
Building a Sustainable Healthcare Model: A Cross-Country Analysis


Department of Economic Engineering, Faculty of Entrepreneurship, Business Engineering and Management, University Politehnica of Bucharest, Splaiul Independentei, No. 313, S6, Bucharest RO-060042, Romania
Sustainability 2016, 8(9), 836; https://doi.org/10.3390/su8090836
Submission received: 13 June 2016
/
Revised: 5 August 2016
/
Accepted: 16 August 2016
/
Published: 23 August 2016
(This article belongs to the Section Economic and Business Aspects of Sustainability)
Abstract
:This paper aims to advocate for a sustainable healthcare system and the need for pursuing a new set of goals in designing it, given the current challenges in European Union (EU28). The EU28 member states are in different phases of economic integration, and yet far from an authentic integrated market. Despite the real gains in other domains, such as commercial and competition, public health is very different across the EU28 space and lacks a common integrated and sustainable approach. Herein a sustainable healthcare model is introduced and is based on four components, two for the inputs and two for the outputs of the healthcare system, each component being further categorized into two factors. The method consists of the assessment of a new and suggestive common index of sustainable healthcare (ISH). The methodology consists of five steps: data gathering, data validation, normalization of data by applying the utilities theory, aggregation of data, and construction of the ISH index. The methodology allows the assessment of a composite ISH which captures the complexity of the national healthcare systems. The ISH is then applied to specific circumstances from different countries and is used in a cross-country analysis to determine the progress towards a sustainable healthcare.
1. Introduction
Every person is a patient at a certain moment in life, and consequently the quality of healthcare is an important aspect of every person’s life and should be a major concern for national, regional and international authorities. The national health policy should establish an equity-based system, focused on results, obtained by promoting value and quality. Consistency of healthcare should be for all healthcare providers and all nations around the globe [1]. The healthcare system and its strengthening are seen as crucial for sustainable development [2], a development that pursues the fulfilment of the needs of present generation, but in a manner that will allow “future generations to meet their own needs” [3]. However, healthcare should be sustainable indefinitely and must be seen as a priority by all national/regional and international actors. Generally speaking, sustainable healthcare represents a complex system that is economically, socially, and environmentally viable in the long term for all human beings, with no negative impacts on any subsystem of the healthcare system. A clearer description was given by Prada, Grimes, and Sklokin [4] who defined sustainable healthcare as “the appropriate balance between the cultural, social, and economic environments designed to meet the health care needs of individuals” with the goal to obtain “optimal health care outcomes without compromising the outcomes and ability of future generations to meet their own health care needs”.
Today, healthcare systems are pressured by many constraints, having limited resources and an increasing demand, especially from an aging population, which is far from being sustainable. The road to a sustainable healthcare system requires many improvements, including safety and equity for all persons, an efficient and legitimate management, a better care delivery, and a proper balance among various types of care—primary versus secondary, preventive versus curative. Such sustainable healthcare begins with the safety of patients and healthcare personnel and ends with their wellbeing. This paper focuses on these dimensions and builds a new model for this concept, where safety and wellbeing of the population are the core concerns.
A brief review of the EU28 member states’ healthcare systems in economic and social terms over the last 20 years shows a very diverse picture. Mackenbach and McKee [5] suggested that the differences among the EU28 member states can be linked to three main causes: resources allotted to healthcare expenditure, social policies, and political conditions. McKee [6] also suggested, before the 2004 enlargement of the EU, that some problems will occur in the healthcare systems of the newcomers from central and eastern Europe, mostly due to their lower spending than the pre-2004 EU member states. Over the years, financial resources invested in healthcare by national authorities increased, but the affordability and access to medical care decreased as revealed by the raise of both health expenditure as a % of gross domestic product (GDP) and out-of-pocket expenditure for medical treatment in EU28 [7,8]. The age-related problems proved to be key challenges, as the proportion of people aged 65 and over (65+) increased and is foreseen to continue to increase, resulting in additional demand and requiring special care [9]. Environmental degradation has had an impact on human health [10], creating major public health problems related to a considerable increase of chronic diseases, such as cardiovascular, respiratory, and nervous illnesses. It is obvious that healthcare systems in EU28 are currently challenged by many problems that require immediate attention given their impact on welfare, the most important being connected with population aging, economic burdens, and chronic disease control. Generally speaking, the health system produced benefits over the last 20 years, but came with a cost, as health expenditure grew faster than the GDP [11]. The task at hand is to balance the healthcare cost with improvement of patient care by developing cost-effective sustainable healthcare systems for the future years, which will be confronted with challenging issues. Healthcare systems throughout the globe are pulled by two main contradictory requirements: the need to sustain an increased demand and the need to lower the costs of healthcare services [12].
Indicators and composite indexes have been used over time for many areas, including economy, such as composite leading indicators (CLI) [13]; society, such as human development index (HDI) [14]; environment, such as environmental sustainability index (ESI) [15]; and innovation [16]. Several indicators and composite indexes for health system were developed by academia and international/national organizations for diverse purposes, like allotment of resources, global reporting, and national progress [17]. A composite index represents a mix of several determinants which are mathematically linked to result in a single number which reflects a large concept (e.g., health status). This index allows the identification of differences across time (for instance, over a 10 year period) and space (cross-country analysis or regional analysis). A composite index is very useful when a multidimensional analysis is needed, as it summarises the complexity of the analysed issues and makes the interpretation easier. At the same time, given the fact that the interpretation of a composite index facilitates the identification of possible interventions and improvements, it may be used as support for politicians in designing better policies. However, there are also objections for using composite indexes, especially when they are poorly constructed [18]. Therefore, the construction of a composite index should be transparent and based on components that are very specific, measurable, practical, available, and founded on reliable statistical data [19].
Healthcare measurement is complex and, in the absence of an EU methodology to monitor it [20], the present paper suggests a new method to promote the best practices around the EU28 space. The actual goal of sustainable healthcare is to improve the welfare of all individuals in an equitable manner; therefore, a different approach should be taken. EU28 needs to pursue a new set of goals in designing sustainable healthcare, given the current challenges related to population aging, economic burdens, and chronic disease control. To this end, the paper has in view the identification of a composite index of sustainable health (ISH) and is based on a multidimensional analysis. This analysis considers a straightforward yet rigorous methodology, where sustainable healthcare incorporates four components and eight essential factors which pursue the welfare of individuals in terms of health, taking into account the inputs and outputs in/from the healthcare system. The ISH is assessed and is used in a cross-country analysis to determine the progress of the member states of the EU28 on the sustainable healthcare road. The ISH is further used to identify the inequalities in the healthcare systems and may be used to lessen these by suggesting dedicated interventions/actions required by some member states.
2. Methods
2.1. Conceptual Framework of Sustainable Healthcare
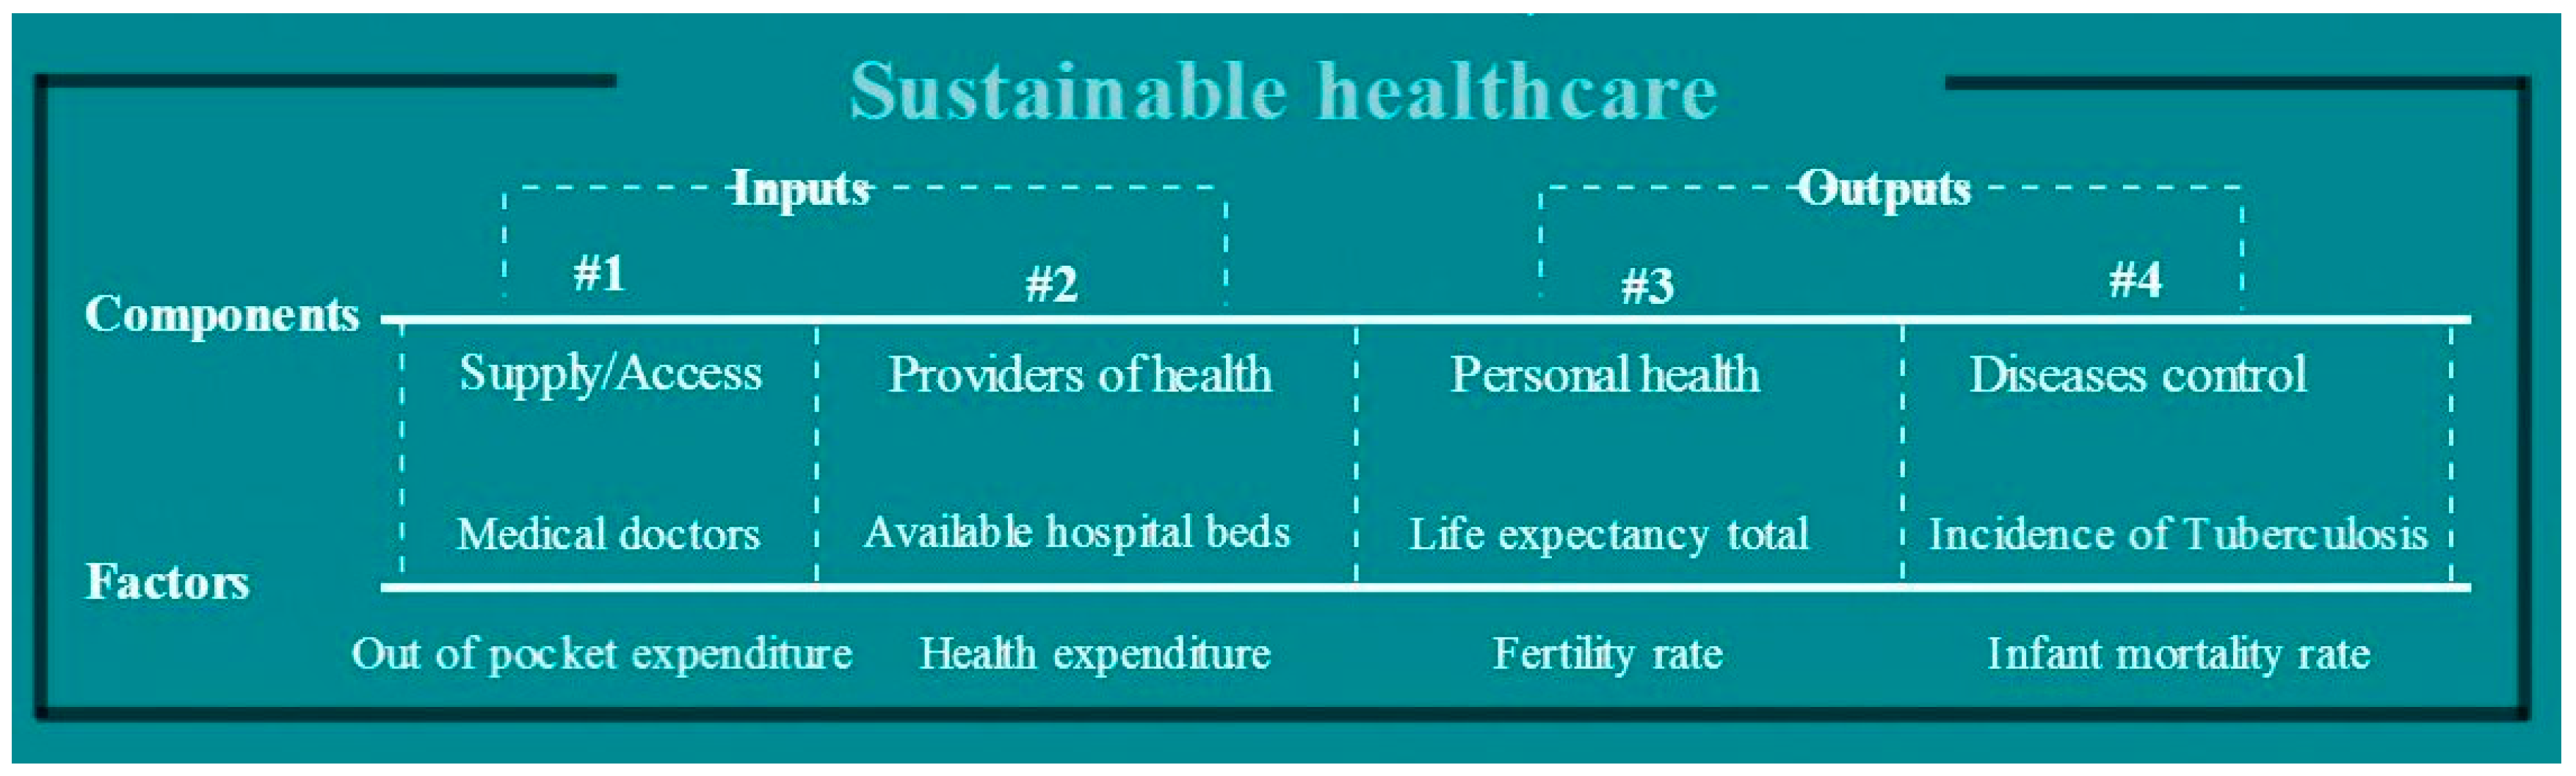
The conceptual framework of sustainable healthcare was designed based on safety and welfare of individuals in terms of healthcare (see Figure 1). The most desirable, feasible, and available set of components, referring to the inputs and outputs of the healthcare system, was selected. Each component was further categorized into two factors, each factor aiming to identify the measures that might lead to a sustainable improvement of population health.
The model was built on four components, each having two factors (4*2 data). The first two components are about the inputs into the healthcare system and the last two are about the outputs. In such a way, the following components and factors were considered, taking into account the identified problems (see Table 1):
- Inputs of the healthcare system:
2.2. Selection of the Factors of the Sustainable Healthcare Model
The selection of factors relevant to this study is based on their importance, but also on their availability supported by international databases and being SMART factors (specific, measurable, achievable, relevant, and time-bound). The data for all the factors is accessible and comparable for all EU28 member states [21,22,23,24,25,26,27,28,29], as the European comparative analysis used quantitative data. Possibly more relevant factors, such as number of medical doctors/nurses, informal payments to medical doctors, corruption, ambulatory care, and deaths by nosocomial infections would be more relevant, but unfortunately there is neither data available for all EU28 countries, nor for the research interval.
Factor 1: The number of health graduates was considered as an indication of the available qualified medical supply, and the maximum value was considered as desirable for ISH determination. The national qualified medical supply takes into consideration sociodemographic development, such as the interaction between patient and the provider of healthcare is facilitated by the common language and cultural heritage. Practicing physicians in the EU28 countries—medical doctors and nursing and caring professionals—would have been selected, but the data was not available for neither medical doctors [30] nor for nursing professionals [31] for many countries belonging to the EU28 for the whole research interval.
Factor 2: This factor was considered because the inability to pay out-of-pocket money may hinder the patient’s access the healthcare system [32]. Out-of-pocket expenditure was selected and the minimum was considered for ISH determination, as the healthcare systems that are requiring low out-of-pocket payments may provide better protection to the poor population [33].
Factor 3: This factor considered available hospital beds as an indicator of the availability of healthcare and is generally used as an indicator of the socioeconomic development of a country/region [34]. It describes the hospitals’ capacities available to the population of a certain country and is used by international organizations as a health service indicator [35]. The maximum condition was assumed for ISH determination.
Factor 4: This factor was based on health expenditure as a % of GDP, as McKlee [6] emphasized that the main problems of the 13 member states that accessed the EU after 2004 are correlated with lower spending for healthcare. While high spending cannot be correlated with best healthcare outcomes, like in the case of United States of America (USA), spending below a minimum threshold can affect the quality of the healthcare system and the safety of patients. The maximum condition was assumed for ISH determination, as the low values recorded for some countries show that the European medical systems are requiring more financial resources. Metaphorically, this factor resembles Max Plank’s quantum theory, in which the healthcare system is the atom that must have a specific minimum amount of energy, that being the financial resources, in order to emit electrons, those being the improved outcomes. However, by increasing the energy, this would not have the effect of emissions of more electrons, meaning that above a threshold an increase in the healthcare expenditure may rather be correlated with inefficient spending than with positive health outcomes.
Factor 5: The analysis of the personal health component started with the selection of a factor which may cover all aspects of life. Life expectancy at birth was selected as all-cause mortality and includes amendable and preventable deaths; it is an important outcome of the medical systems, as it summarizes the length and quality of life. The amendable deaths of the EU citizens would have been selected instead if the data were available for the whole research interval and for all countries of the EU28 [36]. By considering “life expectancy as the outcome of health spending”, the efficiency of healthcare may be better measured [37]. The maximum condition was assumed for ISH determination.
Factor 6: Fertility rate was selected as a factor because it includes (1) the health problems and how they are addressed by the healthcare system; (2) lifestyle choices; and (3) the national policy to support increasing birth rates in developed countries. The maximum condition was assumed for ISH determination.
Factor 7: Incidence of tuberculosis was selected as a factor which reflects the possibilities of the healthcare system to eradicate severe diseases, amendable to health prevention and care. The minimum condition was assumed for ISH determination.
Factor 8: Infant mortality rate was selected, as it reflects the possibilities of the national healthcare system to support new life. The future of a nation resides in its capability to safeguard the future generation and the chances of survival for an infant are important outcomes of the sustainability of the healthcare system. The minimum condition was assumed for ISH determination.
2.3. Methodology Used for ISH Determination
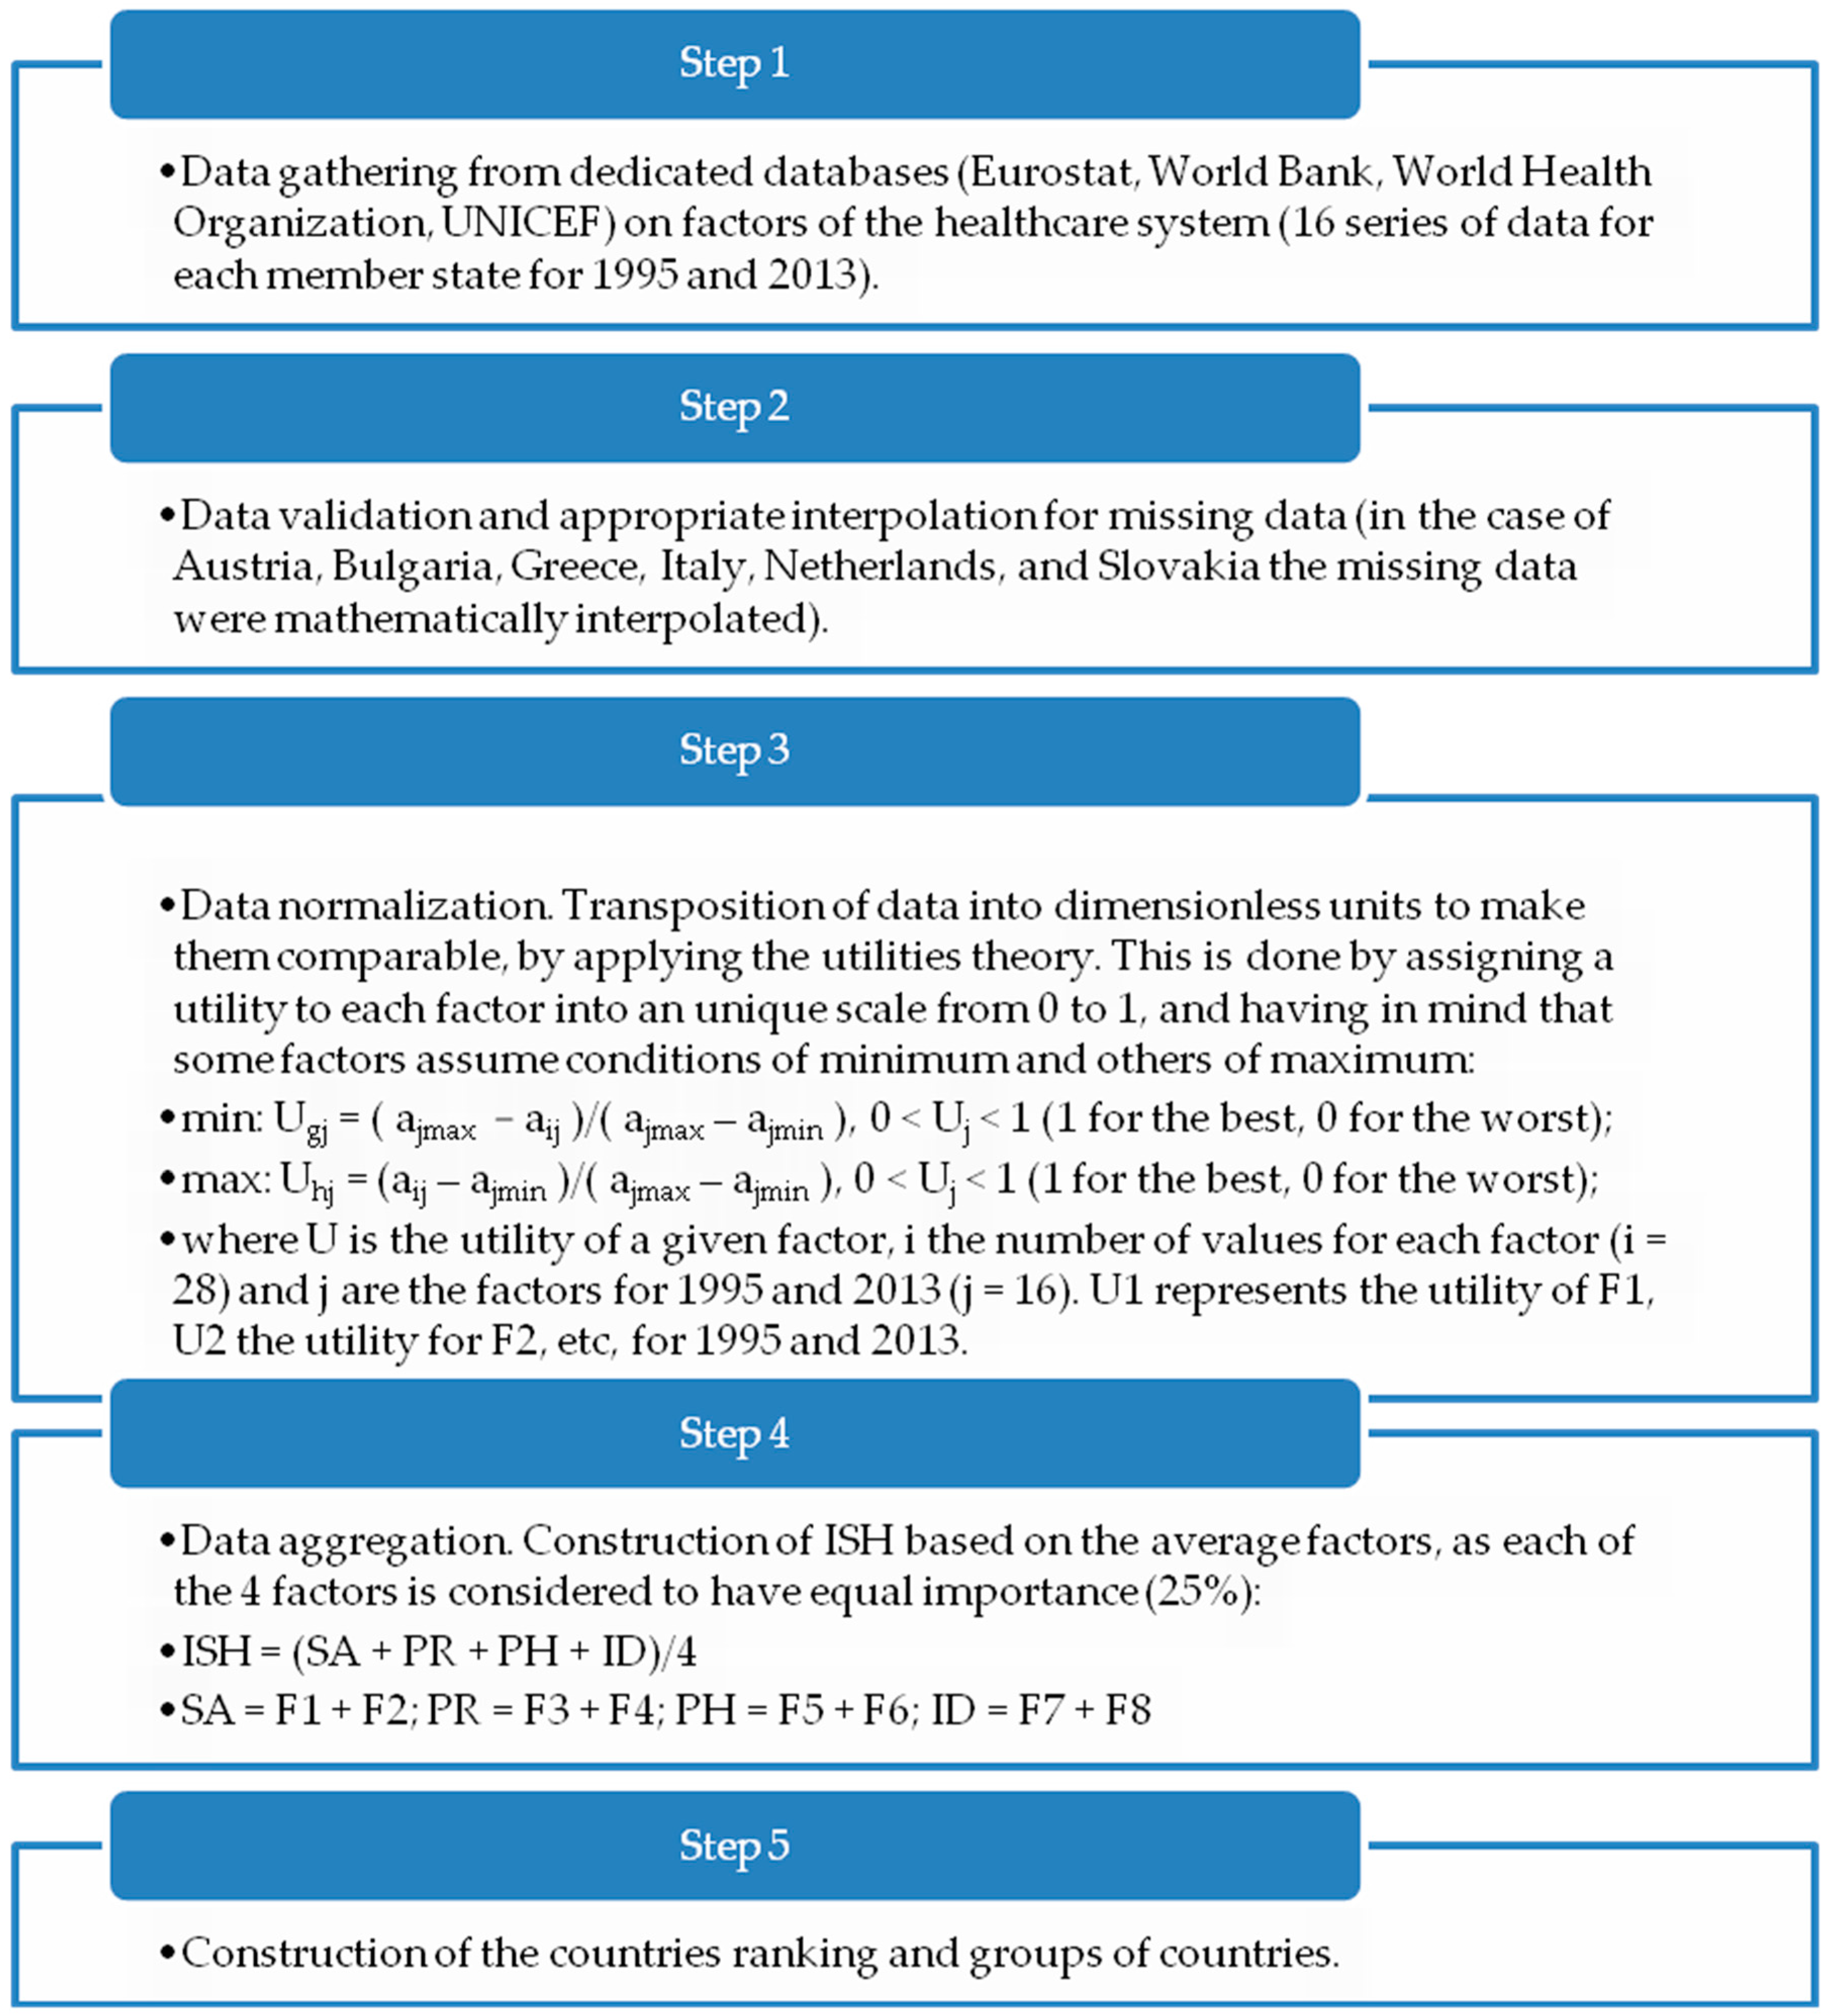
A methodology was created to determine a new suggestive yet rigorous index, the index of sustainable healthcare (ISH), which is based on the basic needs of individuals in terms of healthcare. The design of the ISH is based on data about 28 member states of the EU. The data cover the period of 1995–2013, with the aim to investigate what happened within the European health context within the last 20 years. The methodology consists of five steps and is presented in Figure 2.
3. Results
3.1. Factors of Sustainable Healthcare
The analysis of each factor reveals a mixed picture of the healthcare system throughout the space of EU28. The analysis of the eight factors reveals the impact of the measures taken by each of the EU28 member states and the progress registered since 1995. The actual values of F1–F8 are revealed by Table 2.
The values of F1 (medical doctors, expressed as number of health graduates/100,000 inhabitants) varied in 1995 from 0.0 in Cyprus to 13.94 in Finland, whereas in 2013 Cyprus still had 0.00, while Malta increased to 20.31. The situation was alarming for the Cyprus authorities, who decided to introduce the first Medical School at the University of Nicosia in 2011, which had the graduation ceremony for the first recipients of the school’s Bachelor Degree in Medicine in 2015 (4 years’ program) [39].
For F2 (out of pocket expenditure of each person as % of total health expenditure) the values varied in 1995 from 6.18% in Luxembourg to 63.27 in Cyprus, while in 2013 Netherland scored best with 5.39%, while Cyprus was placed the last position, but with a better number of 46.42%. This very large value for Cyprus is explained also by F1, as F1 is a real strategic factor for any economy, because the national safety depends on the possibilities of providing healthcare with domestic doctors.
F3 (available hospital beds/1000 inhabitants) minimum and maximum values varied in 1995 between 3.92 in Portugal and 11.19 in Latvia, while in 2013 the values regressed to 2.59 in Sweden and 8.20 in Germany.
F4 (total health expenditure as a % of GDP) varied largely across the EU28 space and the minimum value for 1995 was registered for Romania with 3.22%, while the maximum was registered by France with 10.32%. In 2013, the situation showed a mild improvement and the values of F4 varied from 5.34% in Romania to 12.89% in Netherlands. The mean EU28 values slightly progressed from about 7.0% in 1995 to 8.7% in 2013, scoring an increase of about 24% within the considered interval.
F5 (life expectancy at birth (total)—healthy life years) showed a large discrepancy among member states of EU28. Thus, in 1995 the life expectancy for both males and females was 66.39 in Latvia and 78.74 in Sweden, while in 2013, the last position was occupied by Lithuania with 73.91, and the first by Spain with 83.08. The situation improved significantly over the studied interval, but new problems may arise considering the aging of population. However, there is a large inequality among EU28 member states; for 2013 the life expectancy had a difference of 10 years between the best and worst performing country for this factor.
F6 (fertility rate—number of births/woman) showed mild progress for the minimum and a mild drop for maximum values. Consequently, in 1995 the number of births/woman were of 1.17 in Spain and 2.12 in Cyprus, while in 2013 the number of births/woman were 1.28 for Portugal and 2.01 for both France and Ireland.
F7 (tuberculosis cases/100,000 inhabitants) showed a large discrepancy among the EU28. In 1995 the maximum was registered for Romania with 189 cases/100,000, while the minimum was recorded for Cyprus with only 4.8 cases/100,000 inhabitants. The situation improved for 2013, the Romania still scored last with 89 cases/100,000, while Greece recorded the minimum with 5 cases/100,000 inhabitants. The situation improved considerably for EU28 mean, from a value of 36.75 in 1995 to 17.17 in 2013. Even for Romania the values dropped significantly, but not enough, as the quality of healthcare for tuberculosis patients was very poor [40] proving a lack of financial resources and political will to address this problem.
F8 (number of infants dying before reaching one year of age/1000 live births) showed a large difference among EU member states and an alarming inequality. In 1995 the maximum value for the infant mortality rate was recorded for Romania with 27.3, while the minimum was recorded for Sweden with 4. The overall European situation improved in 2013, the maximum being recorded again for Romania with 10.50, while the minimum was of 1.60 for Luxembourg. Consequently, the children born in Romania have fewer chances to survive than others born in different countries, for each infant dying before reaching one year in Luxembourg, 10 are recorded in Romania.
The utilities were calculated as presented at step 3 of the methodology and their values are given in Table 3.
3.2. Index of Sustainable Healthcare
The utilities allowed the calculation of ISH for each country and year, as presented in steps 3 and 4 of the methodology. Table 4 contains the actual values of ISH for the 28 member states of the EU, ranked from best to worst (ISH is better as it approaches 1), using data for 1995 and 2013. During 1995–2013 some countries progressed, the top 5 performers being Slovenia, Netherlands, Denmark, Portugal, and United Kingdom, while others regressed such as Bulgaria, Latvia, Lithuania, Cyprus, and Slovakia.
The methodology allowed the splitting of countries into three groups (see Table 5):
- Group I: sustainable countries—characterized by values of ISH > 0.70, meaning that the countries applied meaningful measures dedicated to increase wellbeing of their inhabitants, in terms of healthcare system development. These are the best countries for a patient to be treated in.
- Group II: on-track countries—characterized by 0.50 < ISH < 0.70, indicating that the countries applied necessary, but insufficient, measures.
- Group III: unsustainable countries—characterized by ISH < 0.50, meaning that the countries employed measures which adversely affected the population, being both unnecessary and insufficient. These are the worst countries for a patient to be treated in.
The measures taken by each country of the EU28 are reflected in the progress/regress of each of the eight factors, F1–F8, presented in Table 2, and the overall effect by the increase/decrease of the ISH.
4. Discussion
Overall, the healthcare system worsened within the EU28 space, the EU average recording a decrease of about 7% in the last 20 years. The concerning fact is that over the studied interval, the number of unsustainable countries increased from 2 in 1995 to 6 in 2013. The first position is occupied by France in both years, while the last position is recorded for Romania in 1995 and Latvia in 2013, Romania occupying the penultimate position in 2013. The ISH may be used to identify the measures needed for a given country to improve the healthcare. For instance, the worst performing country in 1995, which was Romania, did not improve very much during the studied interval. The ISH mildly increased over the research interval from ISH1995 = 0.3179 to ISH2013 = 0.3221, but the country did not recuperate and still registered the last place for financial support (F4), tuberculosis cases (F7), and infant mortality rate (F8). Some of Romania’s inputs seem on the right track, such as medical doctors (F1) and available hospital beds (F3), and the national government should stimulate these two strong points by motivating the medical graduates to practice medicine domestically, by awarding their performance, offering incentives, and decent work schedules; all these measures lead to improved quality of medical treatment. However, all the other input factors determine alarming outputs, therefore, the main actions should be directed at improving the weak points and to encourage the strong points:
- Address the weak points by:
- Improving the funding of the healthcare system, as the country still has the lowest total health expenditure as a % of GDP from EU28; the health expenditure may be correlated to the health outcomes, if this is below a certain limit. Evidence proved that an increase in the health expenditure generates improvements, to a large extent for infant mortality or marginally for life expectancy [41].
- design an action plan for fighting tuberculosis;
- combat infant mortality rate by urgent measures.
- Encourage the development of strong points by:
- offering incentives for motivating the medical graduates to practice medicine domestically;
- updating the available hospital care to increase the quality of medical treatment and improving overall performance.
All these measures can be addressed by a better national health policy for Romania, which should better respond to actual societal challenges. Therefore, the discussion is really about the usefulness of the health policy and the reform of the healthcare system on the bottlenecks identified by ISH. The public health should be free of political momentary interests and characterized by continuity, regardless of the political party which is provisionally in a leading position. When the ministry and teams are changing, the health strategy should survive. Unfortunately, there are institutional national amnesia and inertia when addressing healthcare problems in several EU countries. Instead of constantly changing the public health policy, as a result of different parties’ involvement and diverse interests, the design of public health policy should be left for neutral experts. Therefore, I suggest a common European health policy—such as the functionality approach described by David Mitrany more than 60 years ago, which seems perfect for the health system—because in such a way more value will be created for society. Neutral national/regional/European institutions should collect data acquired from all stakeholders (patients, families, all health providers, payers) in order to analyse the healthcare data, integrate all the interests, and recommend appropriate measures. All the data recorded into patient notes from different healthcare providers should be integrated for the same patient, respecting all confidentiality protocols. The collaboration of all stakeholders should be a priority in reforming and preparing healthcare systems for the challenges to come. These neutral institutions will also act as an open source of information for researchers interested in the health system, containing data for non-identifiable patients. In such a way, a common European health policy and integrated monitoring and control of the healthcare system might level the large inequalities recorded among the EU28 member states and significantly improve the healthcare act.
The use of ISH may act as a strong tool for fostering public health policies, especially for countries belonging to group III. The transformation of society towards an aging population must involve not only a long life, but a healthy and a happy one. The catalyst of this transformation is the public health policy, and the measures taken by countries belonging to group I may be replicated for other countries willing to learn and transpose good practices. The ISH may be used in the process of decision-making and also in the implementation of the decisions, potentially contributing to the good governance in the healthcare system. The healthcare systems throughout the EU28 need a profound change, especially for countries belonging to group III; without this mandatory transformation their healthcare systems are likely to become unsustainable on the long term [42]. Decision-making, together with all the health stakeholders such as industry and civil-society, must better cooperate to put the population at the centre of healthcare strategies by improving the quality, safety, and efficiency of healthcare, and must have the population welfare as an ultimate goal.
The ISH has some limitations, based on the data availability, data on healthcare being sometimes limited by patient confidentiality [43], unmonitored by the national/international authorities, or handled without transparency. Therefore, the selection of factors was limited by the available reliable data. Moreover, ISH does not claim to be a perfect index, as this is impossible [44,45], but it represents a rigorous, suggestive, and relevant index to be used in comparison over time and in space (cross-countries analyses performed over time). Despite the limitations, the ISH provides important insights into the finding of weak and strong points of a certain country in terms of healthcare, and the identification of specific measures to be taken to improve a given situation. Identifying specific solutions to develop a sustainable healthcare system has proven to be a difficult task [43]. The ISH does not claim to hold a perfect recipe for sustainable healthcare or to solve the multiple problems of the healthcare systems, but introduces a new suggestive design, better tailored to the population needs, and which ultimately considers population welfare.
Decision-makers should also consider the potential of new technologies in the long term, therefore the next step in research is to enrich this model with innovation in healthcare delivery, which unfortunately takes place at a different pace in the EU28.
5. Conclusions
At present, there is a need for a transformation of the healthcare system in EU28, sustainable for all European citizens. EU28 is very different in healthcare inputs and outputs, as revealed by the present analysis, but similar in challenges such as population aging, economic burdens, and chronic disease control. EU28 member states have different yet complex healthcare systems, with a great potential for improvement. The patients have the same rights regardless of their country of residence, and major reforms of healthcare systems are needed in some countries, especially for those identified in group III by this paper. Therefore, a common European health policy is needed through the EU28 space, as the European citizens are free to travel and work in any EU country, but they may also get sick there, where the quality of healthcare might not be adequate. Therefore, the findings and suggestions of this paper may be used by decision-makers across EU28 space to improve the healthcare systems and to reach to a common European health policy. ISH intends to increase awareness of decision-makers about the health inequalities existing within EU28 space. Sustainable healthcare in EU28 is a “must” condition, given the current and foreseen challenges, and should be applied in all European countries, considering their specific needs that require targeted solutions.
The index, ISH, assessed by this paper can be applied to different circumstances characterising various healthcare national systems. The use of ISH allows the identification of suitable procedures required to fight against unsustainable practices and achieve an authentic sustainable healthcare. The application of the findings of this paper may induce the conversion of the best practices of national health policies into common measures of a new European health policy. This is one of the keys to preparing the European space for the aging problem by concentrating on the safety and quality of the healthcare system and by determining appropriate responses for countries that lack political will and audacity.
Conflicts of Interest
The author declares no conflict of interest.
References
- Mayberry, R.; Nicewander, D.; Qin, H.; Ballard, D. Improving quality and reducing inequities: A challenge in achieving best care. Proc. (Bayl. Univ. Med. Cent.) 2006, 19, 103–118. [Google Scholar] [PubMed]
- Gilson, L. (Ed.) Health Policy and Systems Research: A Methodology Reader; World Health Organization: Geneva, Switzerland, 2012.
- World Commission on Environment and Development (WCED). Our Common Future; Oxford University Press: New York, NY, USA, 1987; p. 44. [Google Scholar]
- Prada, G.; Grimes, K.; Sklokin, I. Defining Health and Health Care Sustainability. In Proceedings of the Conference Board of Canada, Ottawa, ON, Canada, 15 July 2014.
- Mackenbach, J.; McKee, M. (Eds.) Successes and Failures of Health Policy in Europe, McGraw Hill Education, European Observatory on Health Systems and Policies; Open University Press: New York, NY, USA, 2013.
- McKee, M.; MacLehose, L.; Nolte, E. (Eds.) Health Policy and European Union Enlargement, European Observatory on Health Systems and Policies; McGraw Hill: Berkshire, UK, 2004.
- World Health Organization. Global Health Observatory Data Repository, Out of Pocket Expenditure as % of Total Health Expenditure; World Health Organization Press: Geneva, Switzerland, 2015. [Google Scholar]
- World Health Organization. Global Health Observatory Data Repository, Health Expenditure Ratios; World Health Organization Press: Geneva, Switzerland, 2015. [Google Scholar]
- European Commission. The 2015 Aging Report; Directorate-General for Economic and Financial Affairs: Brussels, Belgium, 2015. [Google Scholar]
- Carnero, M.C. Assessment of Environmental Sustainability in Health Care Organizations. Sustainability 2015, 7, 8270–8291. [Google Scholar] [CrossRef]
- Organization for Economic Co-Operation and Development (OECD). Health Expenditure in Relation to GDP. In Health at a Glance 2011: OECD Indicators; OECD Publishing: Paris, France, 2011. [Google Scholar]
- Abbasi, K. (Ed.) Sustainable Health Systems; World Economic Forum: Geneva, Switzerland, 2013.
- Organization for Economic Co-Operation and Development (OECD). Monthly Economic Indicators (MEI)—Composite Leading Indicators. 2016. Available online: http://stats.oecd.org/Index.aspx?DataSetCode=MEI_CLI (accessed on 16 May 2016).
- Jahan, S. Human Development Report 2015: Work for Human Development; UNDP (United Nations Development Program): New York, NY, USA, 2015. [Google Scholar]
- World Economic Forum (WEF). Environmental Performance Index. 2002. Available online: http://sedac.ciesin.columbia.edu/es/esi/EPI2002_11FEB02.pdf (accessed on 16 May 2016).
- European Commission. European Innovation Scoreboards—2015, Innovation Union Scoreboard Interactive Tool; Publications Office of the European Union: Brussels, Belgium, 2015. [Google Scholar]
- World Health Organization. Global Reference List of 100 Core Health Indicators; World Health Organization Press: Luxembourg City, Luxembourg, 2015. [Google Scholar]
- Metge, C.; Chateau, D.; Prior, H.; Soodeen, R.; De Coster, C.; Barre, L. Composite Measures/Indices of Health and Health System Performance; Manitoba Centre for Health Policy: Winnipeg, MB, Cananda, 2009. [Google Scholar]
- Grzebyk, M.; Stec, M. Sustainable Development in EU Countries: Concept and Rating of Levels of Development. Sustain. Dev. 2015, 23, 110–123. [Google Scholar] [CrossRef]
- European Commission. Communication from the Commission on Effective, Assessable and Resilient Health Systems; 215/2014; Publications Office of the European Union: Brussels, Belgium, 2014. [Google Scholar]
- Eurostat Online Database. Medical Doctors: Health Graduates, Code [hlth_rs_grd]. 2015. Available online: http://appsso.eurostat.ec.europa.eu/nui/show.do?dataset=hlth_rs_grd&lang=en (accessed on 17 May 2016).
- World Bank Online Database. World Development Indicators, Available Beds in Hospitals, Code [SH.MED.BEDS.ZS]. 2015. Available online: http://data.worldbank.org/indicator/SH.MED.BEDS.ZS (accessed on 16 May 2016).
- Eurostat Online Database. Hospital Beds by Type of Care, Code [hlth_rs_bds]. 2015. Available online: http://appsso.eurostat.ec.europa.eu/nui/show.do?dataset=hlth_rs_bds&lang=en (accessed on 16 May 2016).
- World Health Organization. Global Health Expenditure Database, Health Expenditure as a % of GDP; World Health Organization Press: Geneva, Switzerland, 2015. [Google Scholar]
- World Bank Online Database. World Development Indicators, Life Expectancy Total, Code [SP.DYN.LE00.IN]. 2016. Available online: http://data.worldbank.org/indicator/SP.DYN.LE00.IN (accessed on 17 May 2016).
- World Bank Online Database. World Development Indicators, Fertility Rate, Code [SP.DYN.TFRT.IN]. 2016. Available online: http://data.worldbank.org/indicator/SP.DYN.TFRT.IN (accessed on 15 May 2016).
- World Bank Online Database. World Development Indicators, Incidence of Tuberculosis, Code [SH.TBS.INCD]. 2016. Available online: http://data.worldbank.org/indicator/SH.TBS.INCD (accessed on 15 May 2016).
- World Bank Online Database. World Development Indicators, Infant mortality Rate, Code [SP.DYN.IMRT.IN]. 2015. Available online: http://data.worldbank.org/indicator/SP.DYN.IMRT.IN. (accessed on 15 May 2016).
- United Nations Children’s Fund (UNICEF). UN Inter-Agency Group for Child Mortality Estimation; UNICEF: New York, NY, USA, 2016. [Google Scholar]
- World Bank Online Database. World Development Indicators, Physicians (per 1000 People), Code [SH.MED.PHYS.ZS]. 2016. Available online: http://data.worldbank.org/indicator/SH.MED.PHYS.ZS (accessed on 16 May 2016).
- Eurostat Online Database. Nursing and caring professionals, Code [hlth_rs_prsns]. 2016. Available online: http://appsso.eurostat.ec.europa.eu/nui/submitViewTableAction.do (accessed on 22 July 2016).
- Organization for Economic Co-Operation and Development (OECD). Burden of Out-of-Pocket Health Expenditure. In Health at a Glance 2011: OECD Indicators; OECD Publishing: Paris, France, 2011. [Google Scholar]
- Xu, K.; Evans, D.; Carrin, G.; Aguilar-Rivera, A.M. Designing Health Financing Systems to Reduce Catastrophic Health Expenditure; World Health Organization: Geneva, Switzerland, 2005. [Google Scholar]
- United Nations Center for Human Settlements (UNCHS). Urban Initiatives, United Nations Habitat. 2012. Available online: http://unhabitat.org/ (accessed on 26 July 2016).
- European Commission. Public Health Indicators, European Core Health Indicators (ECHI), ECHI Data Tool. Available online: http://ec.europa.eu/health/indicators/indicators/index_en.htm (accessed on 22 May 2016).
- Eurostat Online Database. Detailed Amenable and Preventable Deaths of EU Residents, Code [hlth_cd_apreu]. 2016. Available online: http://appsso.eurostat.ec.europa.eu/nui/show.do?dataset=hlth_cd_apr&lang=en (accessed on 22 July 2016).
- Organization for Economic Co-Operation and Development (OECD). Health Care Systems: Getting More Value for Money, OECD Economics Department Policy Notes; No. 2; OECD: Paris, France, 2010. [Google Scholar]
- Velasquez, M.; Hester, P. An Analysis of Multi-Criteria Decision Making Methods. Int. J. Oper. Res. 2013, 10, 56–66. [Google Scholar]
- St. George’s University of London. News 2015, Medical School’s First Graduation Ceremony in Cyprus. Available online: http://www.sgul.ac.uk/news (accessed on 12 May 2016).
- The Economist. The Economist Intelligence Unit, Report: Romania and Tuberculosis; The Economist Intelligence Unit: London, UK, 2015. [Google Scholar]
- Nixon, J.; Ulmann, F. The relationship between health care expenditure and health outcomes. Eur. J. Health Econ. 2006, 7, 7–18. [Google Scholar] [CrossRef] [PubMed]
- Organization for Economic Co-Operation and Development (OECD). Towards a Sustainable Health Care Model. In Proceedings of the OECD Health Ministerial Meeting, Paris, France, 7–8 October 2010.
- Ricciardi, W. (Ed.) White Paper: Acting Together: A Roadmap for Sustainable Health Care; European Steering Group on Sustainable Healthcare: Brussels, Belgium, 2014.
- Bohringer, C.; Jochem, P. Measuring the Immeasurable: A Survey of Sustainability Indices. Ecol. Econ. 2007, 63, 1–8. [Google Scholar] [CrossRef]
- Momete, D.C. Rational Development as a Sustainable Progress Welfare Vector: A Cross-Country Analysis. Sust. Dev. 2016. [Google Scholar] [CrossRef]
Figure 1.
Conceptual framework of sustainable healthcare.

Figure 2.
The methodology for index of sustainable healthcare (ISH) identification. Note: transposition of data into dimensionless units was done according to [38].
Figure 2.
The methodology for index of sustainable healthcare (ISH) identification. Note: transposition of data into dimensionless units was done according to [38].

| Component | Factor | Actual Data | Reason of Selection | Unit | Desirable |
|---|---|---|---|---|---|
| Inputs | |||||
| Supply/Access (SA) | Medical doctors (1) | Number of health graduates/100,000 inhabitants | Reflects the availability of specialized medical supply and available national supply | Number | max |
| Out of pocket expenditure (2) | Out of pocket expenditure as % of total health expenditure | Reflects the easiness of access to medical care | % | min | |
| Providers of health (PR) | Available hospital beds (3) | Hospital beds/1000 inhabitants | Reflects the ability to provide health care | Number | max |
| Health expenditure (4) | Total health expenditure as a % of GDP | Reflects the will of the Government to support health system | % | max | |
| Outputs | |||||
| Personal health (PH) | Life expectancy at birth total (5) | Healthy life years (the number of years a newborn infant would live if the mortality conditions will be the same) | Reflects expectation of healthy years | Number | max |
| Fertility rate (6) | Number of births/woman | Reflects ability to procreate | Number | max | |
| Diseases control (ID) | Incidence of tuberculosis (7) | Tuberculosis cases/100,000 inhabitants | Reflects the eradication of severe diseases, mainly connected with hygiene, amendable to health prevention and care | Number | min |
| Infant mortality rate (8) | Number of infants dying before reaching one year of age/1000 live births | Reflects the possibly to support new life | Number | min | |
| Geo/Factors | Factor 1 | Factor 2 | Factor 3 | Factor 4 | Factor 5 | Factor 6 | Factor 7 | Factor 8 | ||||||||
|---|---|---|---|---|---|---|---|---|---|---|---|---|---|---|---|---|
| Geo/time | 1995 | 2013 | 1995 | 2013 | 1995 | 2013 | 1995 | 2013 | 1995 | 2013 | 1995 | 2013 | 1995 | 2013 | 1995 | 2013 |
| Austria | 13.07 | 12.13 | 15.10 | 15.81 | 8.54 | 7.65 | 9.58 | 11.03 | 76.67 | 81.14 | 1.42 | 1.44 | 19.00 | 8.40 | 5.70 | 3.20 |
| Belgium | 10.58 | 10.52 | 19.59 | 19.91 | 7.41 | 6.25 | 7.61 | 11.19 | 76.84 | 80.59 | 1.56 | 1.79 | 15.00 | 9.10 | 6.30 | 3.50 |
| Bulgaria | 12.39 | 9.51 | 26.04 | 39.63 | 10.37 | 6.82 | 5.25 | 7.63 | 71.05 | 74.86 | 1.23 | 1.50 | 62.00 | 29.00 | 19.40 | 10.10 |
| Croatia | 9.50 | 12.01 | 13.54 | 12.46 | 5.94 | 5.86 | 7.00 | 7.00 | 72.08 | 77.13 | 1.58 | 1.51 | 54.00 | 13.00 | 8.70 | 3.80 |
| Cyprus | 0.00 | 0.00 | 63.27 | 46.42 | 5.07 | 3.42 | 4.74 | 7.44 | 77.27 | 79.95 | 2.12 | 1.46 | 4.80 | 5.80 | 7.90 | 2.80 |
| Czech Republic | 13.47 | 12.73 | 9.11 | 15.71 | 8.50 | 6.46 | 6.69 | 7.24 | 73.07 | 78.18 | 1.28 | 1.45 | 22.00 | 5.50 | 8.80 | 2.90 |
| Denmark | 6.32 | 18.38 | 16.30 | 12.79 | 4.90 | 3.07 | 8.13 | 10.62 | 75.21 | 80.30 | 1.80 | 1.73 | 11.00 | 7.00 | 5.40 | 2.90 |
| Estonia | 11.21 | 10.93 | 10.23 | 18.89 | 8.35 | 5.01 | 6.32 | 5.72 | 67.54 | 77.14 | 1.38 | 1.56 | 52.00 | 22.00 | 12.80 | 2.70 |
| Finland | 13.94 | 11.47 | 22.65 | 18.54 | 8.12 | 4.86 | 7.85 | 9.40 | 76.41 | 80.98 | 1.81 | 1.80 | 14.00 | 5.70 | 4.30 | 2.10 |
| France | 8.05 | 10.51 | 7.60 | 7.40 | 8.90 | 6.29 | 10.36 | 11.66 | 77.75 | 82.22 | 1.74 | 2.01 | 18.00 | 8.80 | 5.30 | 3.50 |
| Germany | 12.57 | 12.04 | 9.99 | 12.89 | 9.68 | 8.20 | 10.11 | 11.30 | 76.42 | 80.84 | 1.25 | 1.38 | 17.00 | 5.80 | 5.30 | 3.20 |
| Greece | 13.26 | 9.20 | 43.45 | 26.39 | 4.91 | 7.04 | 9.62 | 9.82 | 77.59 | 81.29 | 1.31 | 1.29 | 11.00 | 5.00 | 9.10 | 3.70 |
| Hungary | 9.70 | 15.12 | 16.04 | 27.49 | 8.80 | 7.04 | 7.33 | 8.05 | 69.79 | 75.57 | 1.57 | 1.34 | 48.00 | 18.00 | 12.10 | 5.20 |
| Ireland | 12.86 | 20.25 | 15.34 | 16.84 | 6.97 | 2.76 | 6.56 | 8.92 | 75.57 | 81.00 | 1.84 | 2.01 | 16.00 | 8.50 | 6.10 | 3.20 |
| Italy | 11.99 | 11.18 | 24.71 | 18.01 | 6.27 | 3.38 | 7.06 | 9.09 | 78.17 | 82.69 | 1.19 | 1.43 | 10.00 | 5.70 | 6.40 | 3.00 |
| Latvia | 10.66 | 13.46 | 33.73 | 36.45 | 11.19 | 5.80 | 5.76 | 5.72 | 66.39 | 73.98 | 1.25 | 1.44 | 127.00 | 50.00 | 19.70 | 7.40 |
| Lithuania | 12.01 | 14.81 | 22.39 | 32.63 | 10.94 | 7.28 | 5.37 | 6.24 | 69.01 | 73.91 | 1.55 | 1.60 | 90.00 | 65.00 | 13.50 | 4.00 |
| Luxembourg | 0.00 | 0.00 | 6.19 | 10.80 | 7.10 | 5.05 | 5.57 | 7.10 | 76.51 | 81.80 | 1.70 | 1.57 | 9.80 | 8.70 | 5.20 | 1.60 |
| Malta | 13.15 | 20.31 | 31.14 | 31.53 | 5.43 | 4.80 | 5.63 | 8.73 | 77.14 | 81.75 | 1.53 | 1.72 | 6.30 | 11.00 | 8.30 | 5.40 |
| Netherlands | 7.87 | 14.41 | 9.64 | 5.39 | 5.27 | 4.48 | 8.33 | 12.89 | 77.40 | 81.30 | 1.87 | 1.85 | 12.00 | 6.10 | 5.70 | 3.30 |
| Poland | 10.70 | 9.88 | 27.11 | 22.81 | 5.50 | 6.58 | 5.48 | 6.66 | 71.89 | 77.00 | 1.62 | 1.30 | 48.00 | 22.00 | 12.60 | 4.50 |
| Portugal | 4.08 | 13.64 | 23.92 | 26.63 | 3.92 | 3.40 | 7.52 | 9.71 | 75.31 | 80.72 | 1.41 | 1.28 | 62.00 | 26.00 | 7.50 | 3.10 |
| Romania | 13.29 | 14.83 | 25.46 | 19.69 | 7.64 | 6.67 | 3.22 | 5.34 | 69.46 | 75.06 | 1.33 | 1.53 | 189.00 | 87.00 | 27.30 | 10.50 |
| Slovakia | 12.78 | 12.75 | 11.48 | 22.14 | 8.17 | 5.80 | 6.06 | 8.21 | 72.25 | 76.41 | 1.52 | 1.34 | 34.00 | 7.70 | 12.60 | 6.00 |
| Slovenia | 7.74 | 11.89 | 11.22 | 12.11 | 5.73 | 4.55 | 7.46 | 9.16 | 73.96 | 80.32 | 1.29 | 1.58 | 31.00 | 7.50 | 6.20 | 2.30 |
| Spain | 11.60 | 10.23 | 23.54 | 22.80 | 3.93 | 2.96 | 7.44 | 8.88 | 77.98 | 83.08 | 1.17 | 1.32 | 27.00 | 13.00 | 6.90 | 3.60 |
| Sweden | 8.73 | 10.27 | 13.34 | 16.32 | 4.80 | 2.59 | 7.96 | 9.71 | 78.74 | 81.96 | 1.73 | 1.91 | 7.10 | 7.20 | 4.00 | 2.40 |
| United Kingdom | 6.55 | 13.18 | 10.91 | 9.29 | 4.80 | 2.76 | 6.69 | 9.12 | 76.84 | 81.00 | 1.71 | 1.92 | 12.00 | 13.00 | 6.10 | 3.90 |
| Geo/Utility | U1 | U2 | U3 | U4 | U5 | U6 | U7 | U8 | ||||||||
|---|---|---|---|---|---|---|---|---|---|---|---|---|---|---|---|---|
| Geo/time | 1995 | 2013 | 1995 | 2013 | 1995 | 2013 | 1995 | 2013 | 1995 | 2013 | 1995 | 2013 | 1995 | 2013 | 1995 | 2013 |
| Austria | 0.94 | 0.60 | 0.84 | 0.75 | 0.83 | 0.79 | 0.26 | 0.22 | 0.64 | 0.90 | 0.89 | 0.75 | 0.92 | 0.96 | 0.93 | 0.82 |
| Belgium | 0.76 | 0.52 | 0.77 | 0.65 | 0.85 | 0.73 | 0.41 | 0.70 | 0.48 | 0.65 | 0.62 | 0.77 | 0.94 | 0.95 | 0.90 | 0.79 |
| Bulgaria | 0.89 | 0.47 | 0.65 | 0.17 | 0.38 | 0.10 | 0.06 | 0.30 | 0.89 | 0.75 | 0.28 | 0.30 | 0.69 | 0.71 | 0.34 | 0.04 |
| Croatia | 0.68 | 0.59 | 0.87 | 0.83 | 0.46 | 0.35 | 0.43 | 0.32 | 0.28 | 0.58 | 0.53 | 0.22 | 0.73 | 0.90 | 0.80 | 0.75 |
| Cyprus | 0.00 | 0.00 | 0.00 | 0.00 | 0.88 | 0.66 | 1.00 | 0.25 | 0.16 | 0.15 | 0.21 | 0.28 | 1.00 | 0.99 | 0.83 | 0.87 |
| Czech Republic | 0.97 | 0.63 | 0.95 | 0.75 | 0.54 | 0.46 | 0.12 | 0.23 | 0.63 | 0.69 | 0.49 | 0.25 | 0.91 | 0.99 | 0.79 | 0.85 |
| Denmark | 0.45 | 0.90 | 0.82 | 0.82 | 0.71 | 0.70 | 0.66 | 0.62 | 0.14 | 0.08 | 0.69 | 0.70 | 0.97 | 0.98 | 0.94 | 0.85 |
| Estonia | 0.80 | 0.54 | 0.93 | 0.67 | 0.09 | 0.35 | 0.22 | 0.38 | 0.61 | 0.43 | 0.43 | 0.05 | 0.74 | 0.79 | 0.62 | 0.88 |
| Finland | 1.00 | 0.56 | 0.71 | 0.68 | 0.81 | 0.77 | 0.67 | 0.71 | 0.58 | 0.40 | 0.65 | 0.54 | 0.95 | 0.99 | 0.99 | 0.94 |
| France | 0.58 | 0.52 | 0.98 | 0.95 | 0.92 | 0.91 | 0.60 | 1.00 | 0.69 | 0.66 | 1.00 | 0.84 | 0.93 | 0.95 | 0.94 | 0.79 |
| Germany | 0.90 | 0.59 | 0.93 | 0.82 | 0.81 | 0.76 | 0.08 | 0.14 | 0.79 | 1.00 | 0.97 | 0.79 | 0.93 | 0.99 | 0.94 | 0.82 |
| Greece | 0.95 | 0.45 | 0.35 | 0.49 | 0.91 | 0.80 | 0.15 | 0.01 | 0.14 | 0.79 | 0.90 | 0.59 | 0.97 | 1.00 | 0.78 | 0.76 |
| Hungary | 0.70 | 0.74 | 0.83 | 0.46 | 0.28 | 0.18 | 0.42 | 0.08 | 0.67 | 0.79 | 0.58 | 0.36 | 0.77 | 0.84 | 0.65 | 0.60 |
| Ireland | 0.92 | 1.00 | 0.84 | 0.72 | 0.74 | 0.77 | 0.70 | 1.00 | 0.42 | 0.03 | 0.47 | 0.47 | 0.94 | 0.96 | 0.91 | 0.82 |
| Italy | 0.86 | 0.55 | 0.68 | 0.69 | 0.95 | 0.96 | 0.02 | 0.21 | 0.32 | 0.14 | 0.54 | 0.50 | 0.97 | 0.99 | 0.90 | 0.84 |
| Latvia | 0.76 | 0.66 | 0.52 | 0.24 | 0.00 | 0.01 | 0.08 | 0.22 | 1.00 | 0.57 | 0.36 | 0.05 | 0.34 | 0.45 | 0.33 | 0.35 |
| Lithuania | 0.86 | 0.73 | 0.72 | 0.34 | 0.21 | 0.00 | 0.40 | 0.44 | 0.97 | 0.84 | 0.30 | 0.12 | 0.54 | 0.27 | 0.59 | 0.73 |
| Luxembourg | 0.00 | 0.00 | 1.00 | 0.87 | 0.82 | 0.86 | 0.56 | 0.40 | 0.44 | 0.44 | 0.33 | 0.23 | 0.97 | 0.95 | 0.95 | 1.00 |
| Malta | 0.94 | 1.00 | 0.56 | 0.36 | 0.87 | 0.85 | 0.38 | 0.60 | 0.21 | 0.39 | 0.34 | 0.45 | 0.99 | 0.93 | 0.82 | 0.57 |
| Netherlands | 0.56 | 0.71 | 0.94 | 1.00 | 0.89 | 0.81 | 0.73 | 0.78 | 0.19 | 0.34 | 0.72 | 1.00 | 0.96 | 0.99 | 0.93 | 0.81 |
| Poland | 0.77 | 0.49 | 0.63 | 0.58 | 0.45 | 0.34 | 0.47 | 0.03 | 0.22 | 0.71 | 0.32 | 0.18 | 0.77 | 0.79 | 0.63 | 0.67 |
| Portugal | 0.29 | 0.67 | 0.69 | 0.48 | 0.72 | 0.74 | 0.25 | 0.00 | 0.00 | 0.14 | 0.60 | 0.58 | 0.69 | 0.74 | 0.85 | 0.83 |
| Romania | 0.95 | 0.73 | 0.66 | 0.65 | 0.25 | 0.13 | 0.17 | 0.34 | 0.51 | 0.73 | 0.00 | 0.00 | 0.00 | 0.00 | 0.00 | 0.00 |
| Slovakia | 0.92 | 0.63 | 0.91 | 0.59 | 0.47 | 0.27 | 0.37 | 0.08 | 0.58 | 0.57 | 0.40 | 0.38 | 0.84 | 0.97 | 0.63 | 0.51 |
| Slovenia | 0.56 | 0.59 | 0.91 | 0.84 | 0.61 | 0.70 | 0.13 | 0.41 | 0.25 | 0.35 | 0.59 | 0.51 | 0.86 | 0.97 | 0.91 | 0.92 |
| Spain | 0.83 | 0.50 | 0.70 | 0.58 | 0.94 | 1.00 | 0.00 | 0.05 | 0.00 | 0.07 | 0.59 | 0.47 | 0.88 | 0.90 | 0.88 | 0.78 |
| Sweden | 0.63 | 0.51 | 0.87 | 0.73 | 1.00 | 0.88 | 0.59 | 0.86 | 0.12 | 0.00 | 0.66 | 0.58 | 0.99 | 0.97 | 1.00 | 0.91 |
| United Kingdom | 0.47 | 0.65 | 0.92 | 0.91 | 0.85 | 0.77 | 0.57 | 0.88 | 0.12 | 0.03 | 0.49 | 0.50 | 0.96 | 0.90 | 0.91 | 0.74 |
Note: with bold letters are identified the best countries for each utility (for which utility is 1).
| Geo/Time | 1995 | 2013 | Gain/Loss, % |
|---|---|---|---|
| Austria | 0.7816 | 0.7231 | −7.48 |
| Belgium | 0.7151 | 0.7193 | +0.59 |
| Bulgaria | 0.5227 | 0.3558 | −31.92 |
| Croatia | 0.5978 | 0.5678 | −5.03 |
| Cyprus | 0.5106 | 0.3983 | −21.98 |
| Czech Republic | 0.6737 | 0.6078 | −9.78 |
| Denmark | 0.6725 | 0.7066 | +5.06 |
| Estonia | 0.5570 | 0.5118 | −8.11 |
| Finland | 0.7947 | 0.7006 | −11.85 |
| France | 0.8284 | 0.8265 | −0.24 |
| Germany | 0.7960 | 0.7379 | −7.29 |
| Greece | 0.6416 | 0.6138 | −4.34 |
| Hungary | 0.6103 | 0.5070 | −16.92 |
| Ireland | 0.7432 | 0.7216 | −2.91 |
| Italy | 0.6551 | 0.6097 | −6.92 |
| Latvia | 0.4232 | 0.3192 | −24.57 |
| Lithuania | 0.5732 | 0.4321 | −24.61 |
| Luxembourg | 0.6329 | 0.5941 | −6.13 |
| Malta | 0.6385 | 0.6455 | +1.08 |
| Netherlands | 0.7399 | 0.8036 | +8.61 |
| Poland | 0.5311 | 0.4723 | −11.06 |
| Portugal | 0.5122 | 0.5242 | +2.34 |
| Romania | 0.3179 | 0.3221 | +1.31 |
| Slovakia | 0.6401 | 0.5000 | −21.89 |
| Slovenia | 0.6016 | 0.6598 | +9.68 |
| Spain | 0.6019 | 0.5434 | −9.72 |
| Sweden | 0.7328 | 0.6803 | −7.16 |
| United Kingdom | 0.6598 | 0.6723 | +1.89 |
| EU 28 average | 0.6323 | 0.5884 | −6.94 |
Note: with bold letters are identified the best performing countries, that registered an increase during the analysed interval.
| Country | 1995 | Country | 2013 | Country Type |
|---|---|---|---|---|
| France | 0.8284 | France | 0.8265 | Group I: Sustainable countries in terms of health system ISH > 0.70 |
| Germany | 0.7960 | Netherlands | 0.8036 | |
| Finland | 0.7947 | Germany | 0.7379 | |
| Austria | 0.7816 | Austria | 0.7231 | |
| Ireland | 0.7432 | Ireland | 0.7216 | |
| Netherlands | 0.7399 | Belgium | 0.7193 | |
| Sweden | 0.7328 | Denmark | 0.7066 | |
| Belgium | 0.7151 | Finland | 0.7006 | |
| Czech Republic | 0.6737 | Sweden | 0.6803 | Group II: Countries on track towards sustainable health 0.70 < ISH < 0.50 |
| Denmark | 0.6725 | United Kingdom | 0.6723 | |
| United Kingdom | 0.6598 | Slovenia | 0.6598 | |
| Italy | 0.6551 | Malta | 0.6455 | |
| Greece | 0.6416 | Greece | 0.6138 | |
| Slovakia | 0.6401 | Italy | 0.6097 | |
| Malta | 0.6385 | Czech Republic | 0.6078 | |
| Luxembourg | 0.6329 | Luxembourg | 0.5941 | |
| Hungary | 0.6103 | Croatia | 0.5678 | |
| Spain | 0.6019 | Spain | 0.5434 | |
| Slovenia | 0.6016 | Portugal | 0.5242 | |
| Croatia | 0.5978 | Estonia | 0.5118 | |
| Lithuania | 0.5732 | Hungary | 0.5070 | |
| Estonia | 0.5570 | Slovakia | 0.5000 | |
| Poland | 0.5311 | Poland | 0.4723 | Group III: Unsustainable countries in terms of health system ISH < 0.50 |
| Bulgaria | 0.5227 | Lithuania | 0.4321 | |
| Portugal | 0.5122 | Cyprus | 0.3983 | |
| Cyprus | 0.5106 | Bulgaria | 0.3558 | |
| Latvia | 0.4232 | Romania | 0.3221 | |
| Romania | 0.3179 | Latvia | 0.3192 |
© 2016 by the author; licensee MDPI, Basel, Switzerland. This article is an open access article distributed under the terms and conditions of the Creative Commons Attribution (CC-BY) license (http://creativecommons.org/licenses/by/4.0/).
Share and Cite
MDPI and ACS Style
Momete, D.C. Building a Sustainable Healthcare Model: A Cross-Country Analysis. Sustainability 2016, 8, 836. https://doi.org/10.3390/su8090836
AMA Style
Momete DC. Building a Sustainable Healthcare Model: A Cross-Country Analysis. Sustainability. 2016; 8(9):836. https://doi.org/10.3390/su8090836
Chicago/Turabian StyleMomete, Daniela C. 2016. "Building a Sustainable Healthcare Model: A Cross-Country Analysis" Sustainability 8, no. 9: 836. https://doi.org/10.3390/su8090836
Note that from the first issue of 2016, this journal uses article numbers instead of page numbers. See further details here.