Article

A Climate Change Vulnerability Index and Case Study in a Brazilian Coastal City

by
Vitor Baccarin Zanetti
1,*,
Wilson Cabral De Sousa Junior
1 and
Débora M. De Freitas
2
1
Aeronautics Institute of Technology, Department of Water and Environment, Pca. Mal. Eduardo Gomes, 50 CTA/IEI, São José dos Campos, SP CEP 12228-900, Brazil
2
Biosciences Institute, São Paulo State University-UNESP, Coastal Campus, Praça Infante Dom Henrique s/n, São Vicente, SP CEP 11330-900, Brazil
*
Author to whom correspondence should be addressed.
Sustainability 2016, 8(8), 811; https://doi.org/10.3390/su8080811
Submission received: 14 July 2016 / Revised: 8 August 2016 / Accepted: 9 August 2016 / Published: 18 August 2016
(This article belongs to the Special Issue The Impacts of Climate Changes: From Sustainability Perspectives)

Abstract

:
Coastal areas are highly susceptible to the effects of climate change, particularly to sea-level rise and extreme rainfall events, resulting in increased social and environmental vulnerabilities. In this context, the need for predictive planning instruments, especially in densely populated coastal areas, is a critical management priority. A number of indexes has been developed to assess coastal vulnerability. However, coastal vulnerability indexes are yet to simultaneously consider inland (e.g., landslides and flooding) and ocean (sea-level rise and coastal erosion) hazards in conjunction. To help fill this gap, we developed the Socio-Environmental Vulnerability Index for Coastal Areas. The proposed index is a diagnostic tool to assess the socio-environmental vulnerability of coastal regions in the context of climate change. Applied to the city of Santos, a coastal municipality in São Paulo state, Brazil, the index revealed that most of the city are in areas highly vulnerable to sea-level rise and floods related to extreme rainfall events. Findings show that, in fact, approximately 70% of the area of Santos (27.5 km2) consists of high vulnerability areas mostly located close to urban drainage channels, residential, and other built-in areas. Another 0.12% (0.05 km2) were classified as very high vulnerability areas compromising port and industrial infrastructure. These results highlights the susceptibility of the urban insular area of Santos to climatic change hazards. This study might prove relevant to support local decision-makers in preparing adaptation plans and responding to climate-related risks in vulnerable coastal cities.

1. Introduction

With the growth of human cities, especially the coastal ones, and the increase of the climate hazards due to climate changes, the vulnerability and risk levels are also increasing. The increase of the hazards, and the complexity of the new cities, asks for more potent tools for assessing the risk and vulnerability of urban areas. Additionally, these tools now must provide a broader view on the vulnerability to help the construction of adaptive measures to cope with the future changes.
Since the first assessment report of the International Panel on Climate Change (IPCC) in 1990 [1], vulnerability and risk assessments have been used as important approaches to examine climate change-related risks and impacts, such as variations in temperature, rainfall, and sea-level rise (e.g., [1,2,3]). These assessments have mostly focused on coastal areas, where climate-related stressors are predicted to significantly affect urban populations and infrastructure.
From the risk perspective, some studies, such as [4], can cope with multiple hazards, extending the framework of vulnerability, or using a vulnerability approach access the social aspect of the risk. However, the focus on risk represents a step-forward and requires a large amount of local data that is, most of the time, unavailable for extended areas.
Noteworthy is the number of indexes that have been developed to assess coastal vulnerability (e.g., [2,5,6,7]). This is also true for Brazil (see e.g., [8,9,10,11]); however, coastal vulnerability indexes are yet to simultaneously consider inland (e.g., landslides and flooding) and ocean (sea-level rise and coastal erosion) hazards in conjunction, which can be relevant especially in areas where the relief makes an important role on the landscape. To help fill this gap, we developed the Socio-Environmental Vulnerability Index for Coastal Areas (SEVICA) using the city of Santos, on the central coast of São Paulo, as a case study. The proposed index is a diagnostic tool to assess the socio-environmental vulnerability of coastal regions in the context of climate change and is particularly focused on impacts on critical infrastructure. It supports decision-making in preparing adaptation strategies in response to environmental change, particularly climate-related change.

2. Vulnerability Indexes and Variables

There are many definitions of vulnerability; one of the most accepted is the IPCC’s, which defines it as “(…) the propensity or predisposition to be adversely affected. Vulnerability encompasses a variety of concepts and elements including sensitivity or susceptibility to harm and lack of capacity to cope and adapt” [12] (p. 5). In this paper, we adopt the concept of social-environmental vulnerability, which encompasses both biophysical and social factors. Furthermore, we also consider “place vulnerability”, weighting the dependency of a population on local infrastructure, as suggested by [13]. An index that applies these concepts takes into account both physical and social impacts on human populations. Ultimately, it provides an integrated perspective to vulnerability studies.
There are many vulnerability indexes in the literature (Table 1), but most of them have been initially created to meet local needs, and adapted later for other contexts. These indexes differ in the variables used and reflect the purpose of the vulnerability assessment. However, these somewhat reductionist approaches to vulnerability assessment have been criticized due to their inability to inform systemic considerations. Further, [14] highlights the need for the convergence of many existent interpretations to better understand the real advantages of multiple perspectives of a problem.
The variety of existing indexes underscores a number of possible approaches to thematic vulnerability [21]. Füssel and Klein [22] argue that such approaches vary from a more physical context reflecting the main focus of the studies (e.g., [2]) to a more social-based approach that incorporates social variables and factors better representing the adaptation capacity of local populations (e.g., [7]). The latter is more aligned with the concept of place vulnerability proposed by [13], and the concept of contextual vulnerability adopted by [23].
Despite the differing focus of the indexes, their formulation has not changed much since the early vulnerability studies. It is still based on metrics, mainly arithmetic or weighted mean of factors [2]. The core metrics have not changed because of the simplicity of their application and the variety of weighting techniques that provide the indexes the capability to better analyze a given problem. Critical constraints of traditional approaches to the formulation of indexes using quantitative means include limited contextual richness that could otherwise be obtained through qualitative approaches, and a bias towards easily collected and measureable data.
Studies by [10,24] are examples of vulnerability analyses applied to the Brazilian coast. They use a socio-environmental vulnerability approach to point out that the urban expansion on the Brazilian coast occurs often in vulnerable areas, which usually exposes the population to major risks. These regions have been targeted as a result of increased economic interest relating to oil and gas mega projects. In this context, it is important to develop a rapid and robust index that considers the biophysical and social dimensions of vulnerability, and, by doing so, enables the production local level vulnerability maps that can assist decision-makers to develop better adaptation strategies.

3. Materials and Methods

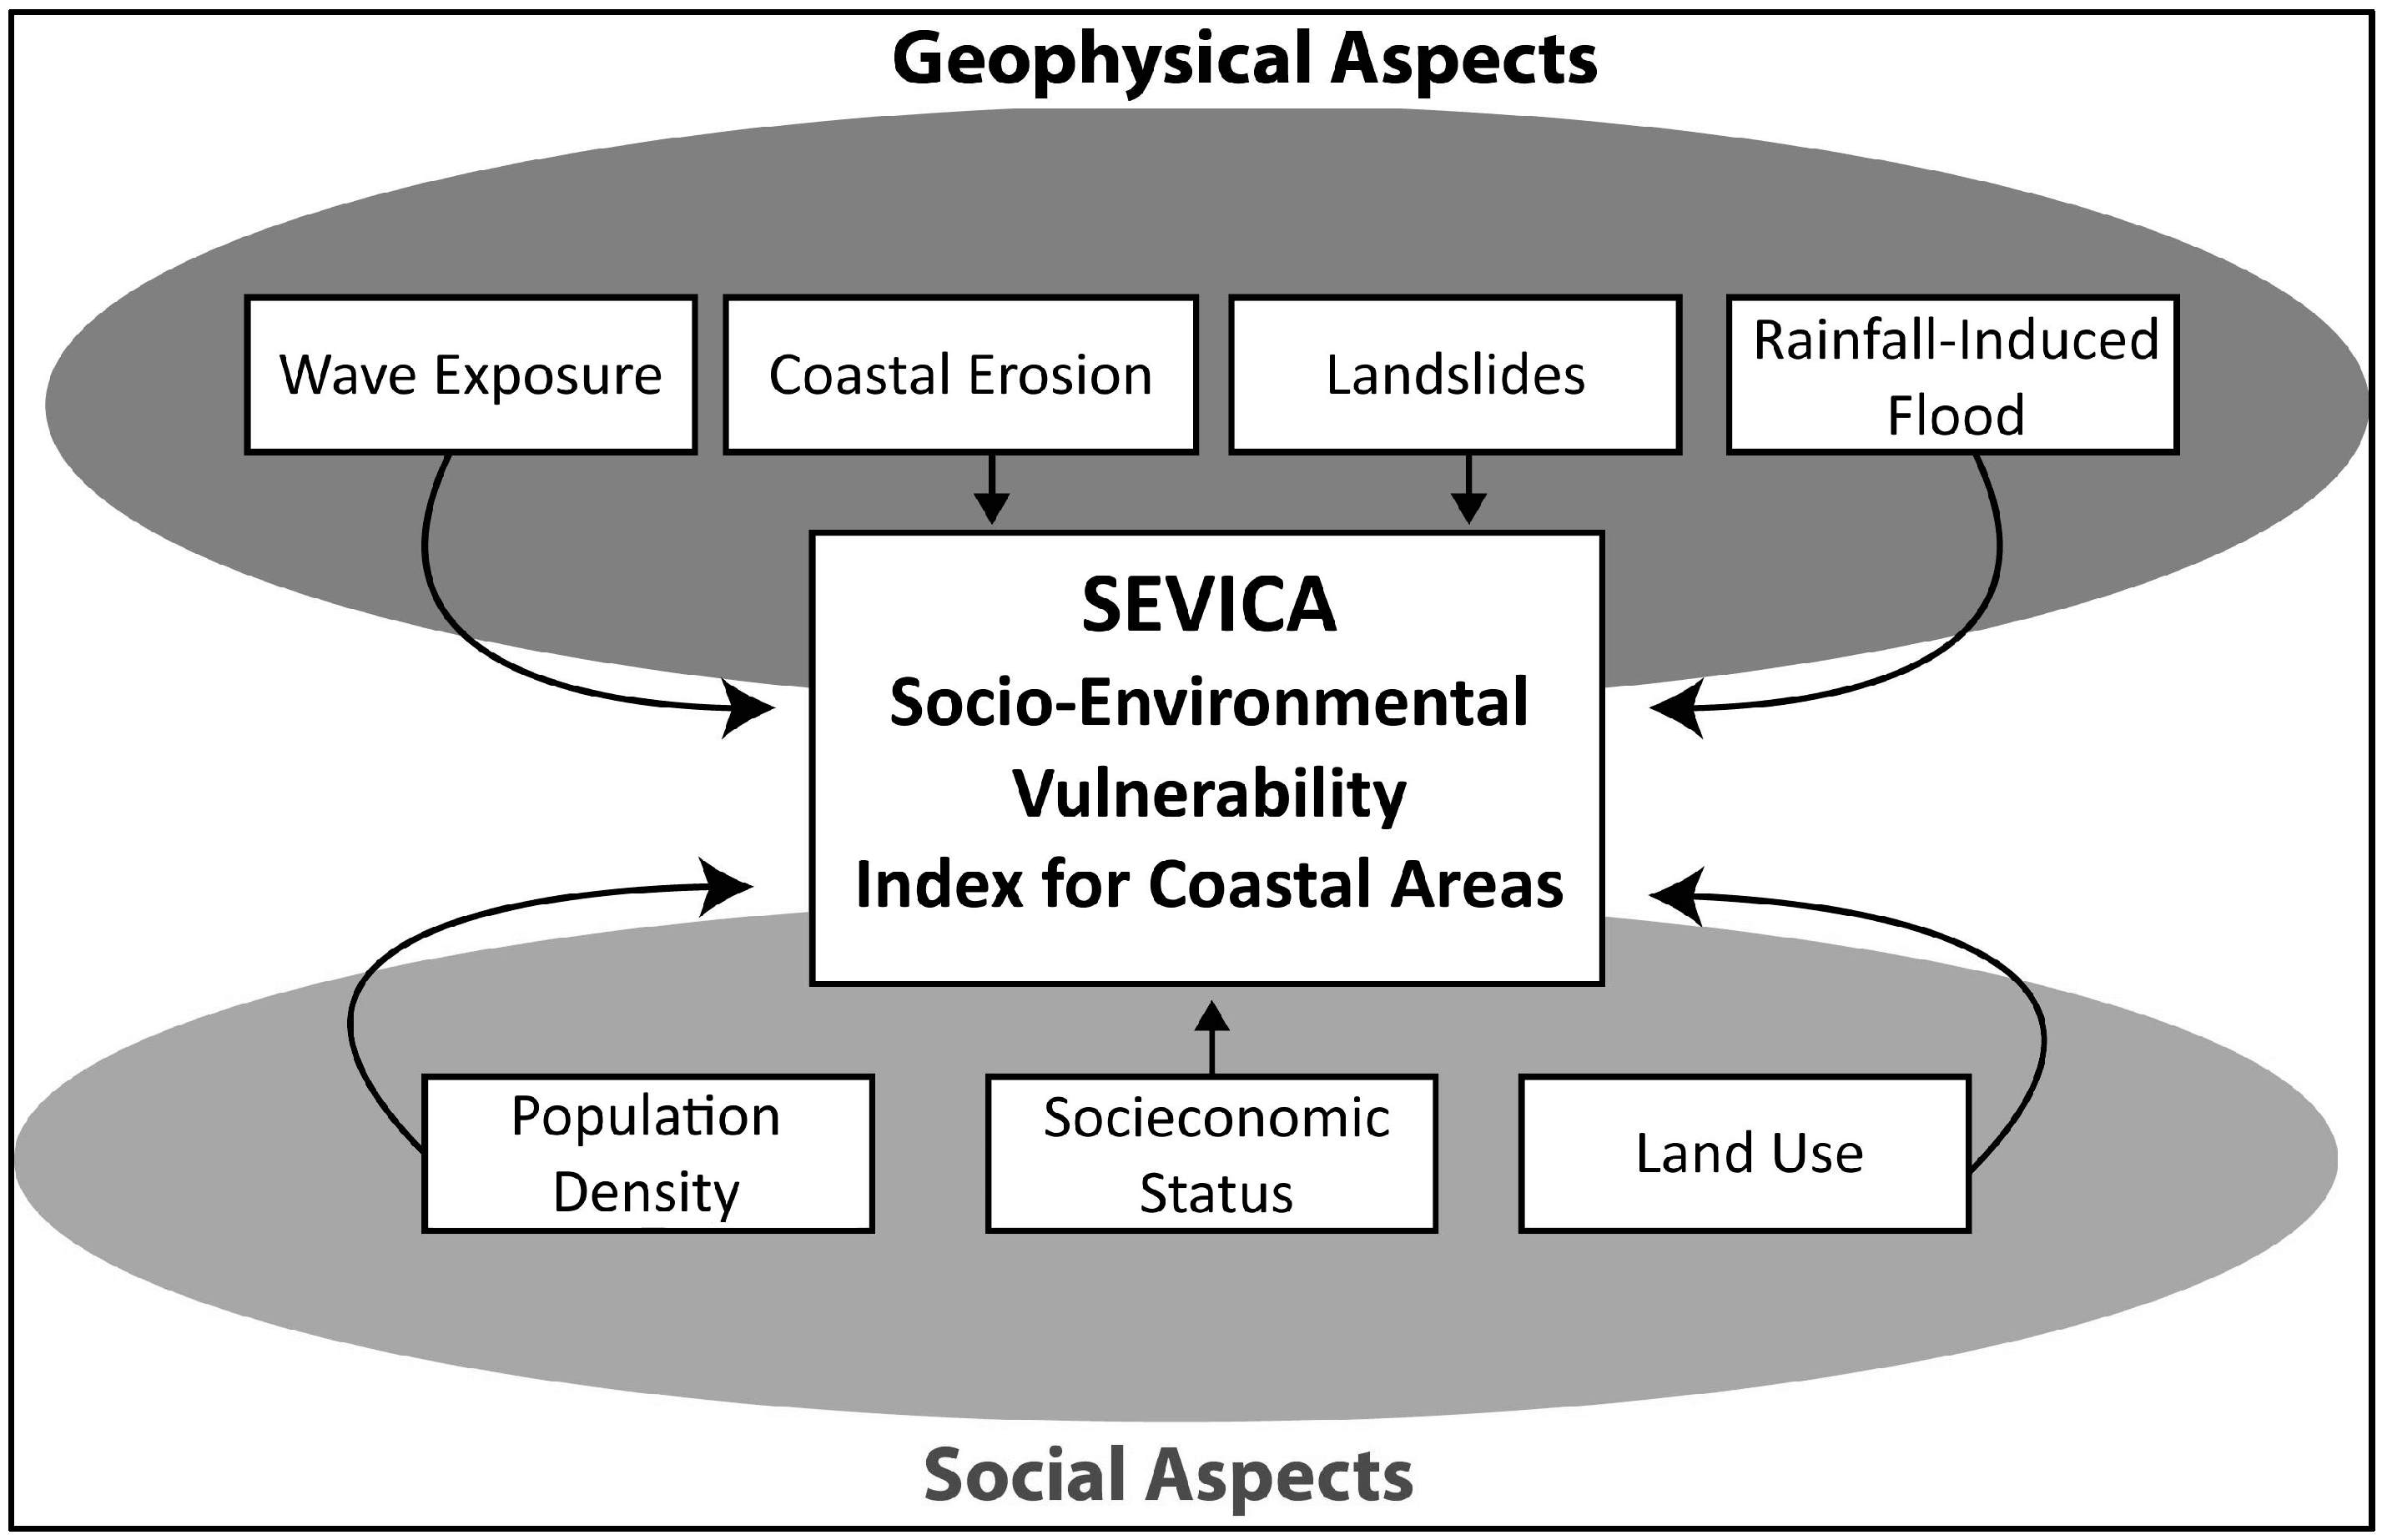
Multiple Hazards Index

The SEVICA consists of seven factors; four of them are geophysical and three are socio-economic factors (Figure 1). Each of these factors features independent parameters and formulation, as shown in Table 2. Each parameter features, in turn, a quantitative vulnerability scale ranging from 1–5. The vulnerability level of a factor is defined by the parameters’ mean.
The variables for each parameter were selected based on literature review (see Table 1), and expert elicitation. It also took into account data availability and the possibility to aggregate variables. The classification scales for each parameter are presented in Table 3.
The expert elicitation was used to determine the variables to be considered on the landslide factor of the index, and involved eight specialists on landslides. This elicitation was made by an open interview (unstructured) that was conducted by the authors, one by one, starting with the introduction to the objectives of the index. After that the experts were asked to provide their opinion about what the variables should be, and those that should not be, included in the factor. Based on the literature review and the expert elicitation, we selected three variables which were presented back for two of the experts, in order to confirm the choice. Later, these two last specialists were consulted during the design of the soils geotechnical classification into five categories used by the index. The specialists concluded that the proposed classification was enough to represent the susceptibility of landslides based on soil characteristics, and the combination with the other variables of the factor.
The factors’ vulnerabilities were obtained from the average value of the considered parameters, according to Equation (1):
Factorv = (P1 + P2 + P3 + … + Pn) × n−1
in which,
  • Factorv = Factor’s vulnerability;
  • P1—n = Parameter;
  • n = number of parameters considered.
Once the values for all factors were calculated using the arithmetic mean, according to Equation (1), the SEVICA itself can be calculated as a weighted mean of the factors, as given by Equation (2):
SEVICA = ( F . p 1 + L . p 2 + CE . p 3 + WE . p 4 + SS . p 5 + PD . p 6 + LU . p 7 ) × ( i = 1 7 p i ) 1
in which,
  • F = Flooding factor index;
  • L = Landslides factor index;
  • CE = Coastal Erosion factor index;
  • WE = Wave Exposition factor index;
  • PD = Population Density factor index;
  • SS = Socioeconomic Status factor index;
  • LU = Land Use factor index;
  • p = weights to each factor.
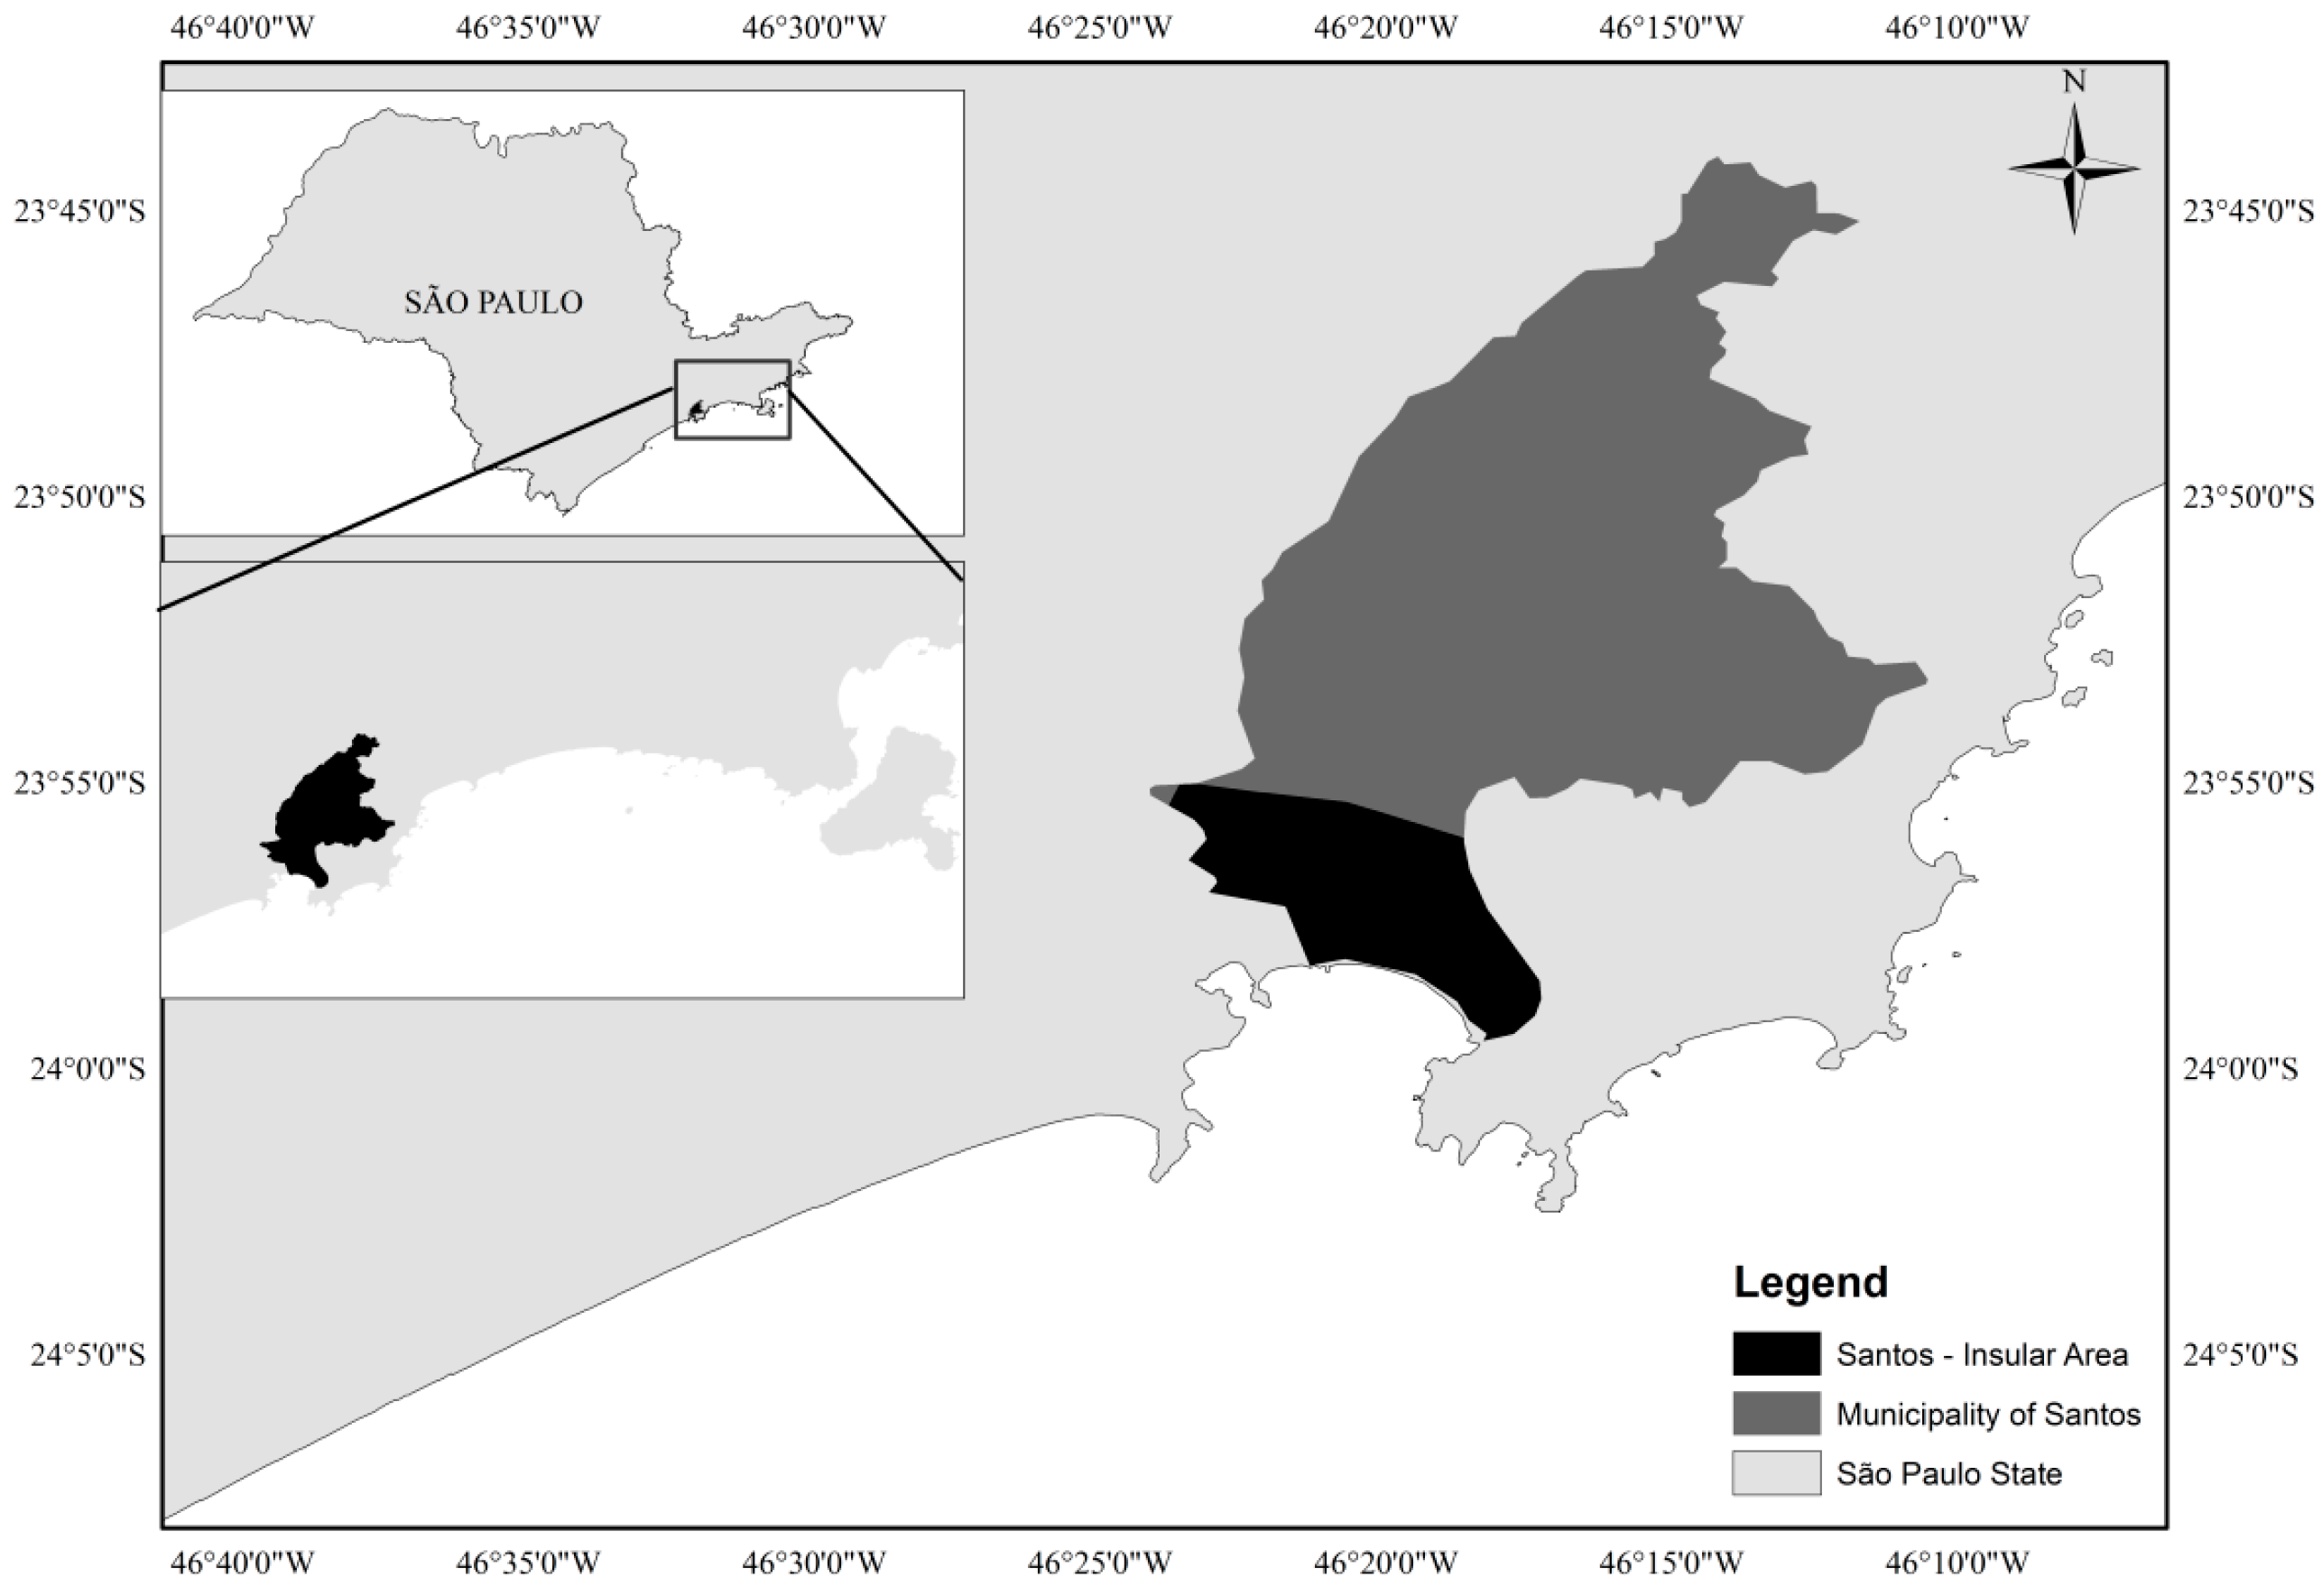
4. Case Study

Santos is the location of the largest port of Latin America. The city has a population of 419,400 people [27]. Ninety-nine percent of the population lives in Santos insular area, which is 39.4 km2 (Figure 2). The insular area also houses all of the government buildings, most of the port infrastructure, and all of the city’s public health and safety facilities, including hospitals, public schools, fire stations, police stations, public gymnasiums, armed forces, and public transport stations.
This insular area is also the main target for the investments relating to Pre-Salt Layer Oil and Gas projects, and associated real estate development. It is a flat and lowland area (average elevation less than 10 m in most of the area) and, therefore, potentially vulnerable to sea-level rise. Flooding caused by extreme precipitation is also a problem, which is likely to be intensified by climate change. Santos is, therefore, an adequate case to develop and test our socio-environmental vulnerability index. Further, this study may prove timely as local authorities are currently discussing a new urban master plan for Santos.

Index Operationalization

This study considered climate change under two [28] scenarios in analyzing the vulnerability of the infrastructure: (1) RCP 4.5, that is a medium impact scenario, with projected temperature increase ranging from 0.9–2 degrees Celsius, and sea-level rise of approximately 0.33 m in 2040; and (2) RCP 8.5, the most extreme scenario, with temperature increase ranging from 1.4–2.6 degrees Celsius, and sea-level rise of approximately 0.38 m. Two variables from the climatic projections were analyzed under these scenarios: sea-level rise and precipitation. Precipitation was estimated for the year 2040 using data from HadGem3 and Miroc5 models, obtained from ETA-CPTEC/INPE, Brazil [29,30]. The sea-level rise was estimated, also for 2040, at 0.33 m for scenario 4.5, and 0.38 m for scenario 8.5 based on data from the IPCC AR5 report [28]. These variables were incorporated in the index together with variables from other sources, in factors that included landslide, flooding, wave, coastal erosion, population density, socio-economic characteristics, and land use (Table 4). For both scenarios the 2040 climatic variables, were projected over the actual land use to provide a snapshot of the vulnerability.
In this study, with the exception of “land use”, which was weighted higher to emphasize its role as a determinant of infrastructure location, all parameters have the same weight. The sum of the scored weights was equal to one unit.
The factors were weighted based on expert elicitation involving academics and decision-makers. The formulation of the index, for this case, is described in Equation (3):
SEVICA = ( 0.13 × ( F + L + CE + WE + PD + SS ) + 0.22 × LU )
in which,
  • F = Flooding;
  • L = Landslides;
  • CE = Coastal Erosion;
  • WE = Wave Exposition;
  • PD = Population Density;
  • SS = Socioeconomic Status;
  • LU = Land Use.

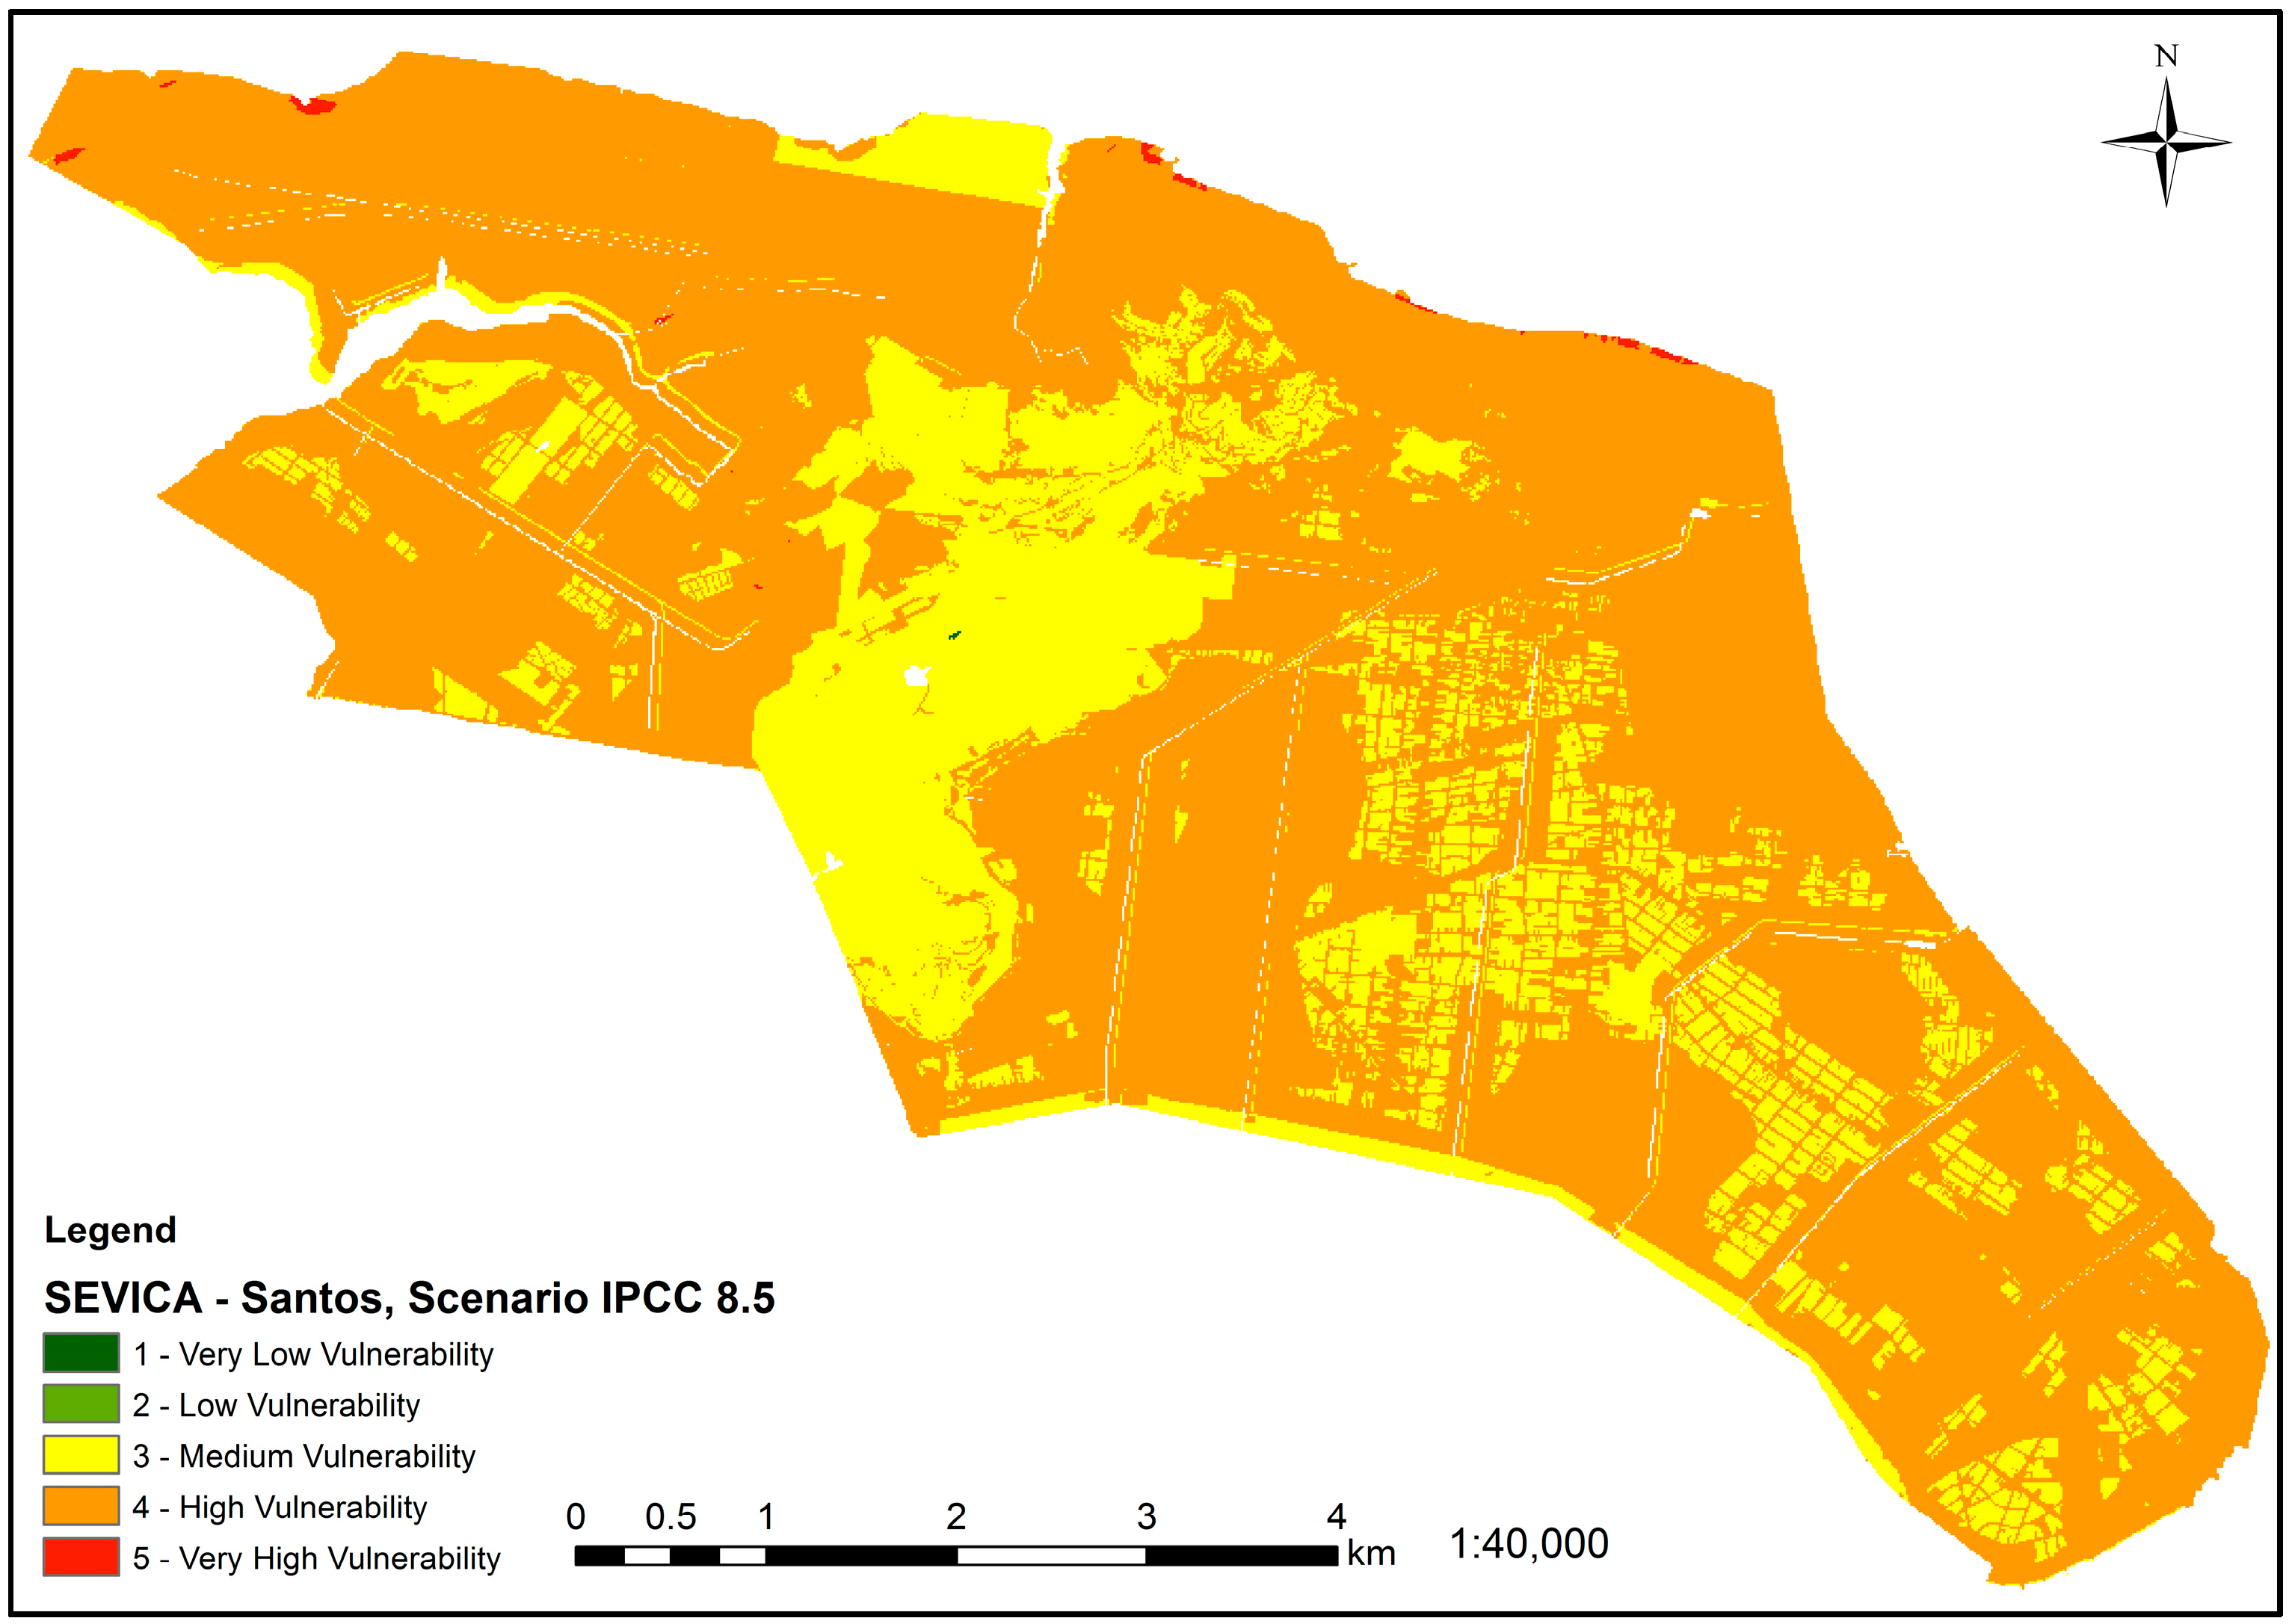
5. Results and Discussion

Our findings indicate that, under both IPCC scenarios, approximately 70% of the area of Santos (27.5 km2) consist of level 4 (high vulnerability) areas. The assessment of vulnerability of Santos under IPCC scenarios RCP 4.5 and RCP 8.5 [28] is presented in the form of thematic maps (Figure 3 and Figure 4). These highly vulnerable areas include major roads and streets, and some residential areas. They are located in low areas and/or close to urban drainage channels. Some of those residential areas, in particular, have been built over alluvial soils, which are naturally more susceptible to erosion. These areas are also associated with high levels of vulnerability based on the wave exposition factor. These are low land areas with elevation less than 1m above current sea level, and therefore subject to high sea-level rise risk.
“Very high” vulnerable areas comprise, especially under IPCC scenario RCP 8.5, approximately 0.12% of the area of Santos (0.05 km2). These areas are associated with port and industrial (particularly oil) activities. They are nearly at sea level; located at the end of inland water drainage channels. In combination, land use, sea level, inundation and landslides) are critical factors rendering these areas maximum level of vulnerability. Considering that the results of the index are sensible to the predictions of the RCP scenarios, more critical scenarios, or realities, could lead to an increase on the vulnerability of the region. In fact, there are a lot of other scenarios that can be taken into account to evaluate the vulnerability, and that were not considered here, for the case study.
These results represent the propensity of the urban area of Santos to the hazards provided by climatic changes. As a vulnerability index, the great value and originality of the SEVICA is the fact that it comprises in it the two major risks of climatic changes, extreme rainfall, and sea level rises. The proposed index is also applied to an area, not only a coastal line, and put it together in one simple map for the decision-maker to evaluate. Other indexes used worldwide, such as the ones of [2,6,7], are very effective in studying vulnerability of one hazard and many other socioeconomic and biophysical factors, but not in overlapping more than one hazard in the same place.
One of the disadvantages of SEVICA lies in the need for various input data to evaluate the vulnerability, which can limit its application to more developed countries that have a better history of collecting data. In Brazil, for example, the lack of data impacts severely on the application of the index in many other cities that could benefit from it. On the other hand, the results of the SEVICA have a great value when prioritizing actions towards a better understanding and adaptation to the climatic threat due its capability of showing which areas are more affected from these threats and, in a retro-analysis, show which hazards are more relevant to each area. For example, the landslide factor in Santos is not a major threat for the city since it is located on a mostly flat area. Meanwhile the flooding factor is a great threat, because the city is crisscrossed by fluvial channels that were projected in the 1950s and are not prepared for the augmented frequency expected from the extreme rain events in the event of the climatic changes.
Altogether, the index application is relatively easy, and its interpretation is simple, which contributes enormously to the communication of the vulnerability. SEVICA has also a great potential to improve awareness about climatic hazards on coastal areas, which makes the index a relevant contribution to the vulnerability discussion, and a viable tool of study and diagnosis for adaptation research and policy-making.

6. Conclusions

The “snapshot” provided by the SEVICA is an important step towards developing more adequate response strategies, including identifying and producing additional data and analyses. By studying vulnerabilities of urban coastal areas, at a range of sizes, local decision-makers can better plan for adaptation and, consequently, increase adaptive capacity to climate-related extreme events. In that context, this study proposed a social-environmental vulnerability index that considers multiple climate-related inland and coastal hazards. The index was tested in the city of Santos, Brazil, and revealed that most of the city’s area and critical infrastructure are highly vulnerable to climate change events (e.g., flooding and sea-level rise). Our index provides a useful tool to assessing the socio-environmental vulnerability of coastal regions to climate change. Unlike other indexes, the index proposed here considers four hazards simultaneously, which allows evaluation of vulnerability to each hazard individually and/or in combination. Though the proposed SEVICA was designed with a focus on city planning, it also allows the analysis of other aspects of vulnerability.
Our findings demonstrate that Santos, like other coastal cities in the world, is highly vulnerable to climate change, particularly sea-level rise and flooding. The proposed index revealed major vulnerabilities to climatic change of critical infrastructure. This suggest that responding to a disaster would prove challenging since the emergency response facilities and services would also be affected. In addition, the growth of the city has been driven mostly by economic interests, without proper consideration of natural hazards. Such information is very timely considering that the city of Santos is currently discussing a new urban master plan and it has yet to incorporate climate change vulnerability in the local agenda.
Vulnerability assessment is a diagnose step of adaptation planning and studies, so indexes like SEVICA are highly recommended to be developed and tested worldwide in similar regions and results and appointments compared to generate a more robust collection of data on how vulnerability studies can help prioritize actions toward an adapted coastal settlement, and adapted communities to climate changes challenges.
It is in our team’s objective to study the application of SEVICA to other major Brazilian cities, such as Rio de Janeiro, Salvador, Recife, and Fortaleza, and future studies will be developed in similar coastal areas in other regions of the world. Although our index produced useful information for city planning, other specialized studies would allow for better planning decisions. Further research would benefit, for example, from a risk analysis that could complement our study by demonstrating probabilistic climate-related risks. Additional studies that include stakeholders in the process of weighting the indicators, and evaluation of the results are also suggested. For example, a dissemination workshop held with Santos city council staff as part of this research proved insightful and demonstrated the applied nature of the index.

Acknowledgments

We thank CAPES/RedeLitoral Project CAPES 417/2010 for the financial support, SAE/PNUD project “Brasil 3tempos” for financial and data support, and Santos City Hall, on the person of Eduardo Kimoto Hosokawa, and his team, for the specific data and discussion during the execution of the study. We also want to thank the two anonymous reviewers for the corrections and suggested modifications to this paper.

Author Contributions

Vitor Baccarin Zanetti and Wilson Cabral de Sousa Junior conceived and designed the experiments; Vitor Baccarin Zanetti performed the experiments; Vitor Baccarin Zanetti and Wilson Cabral de Sousa Junior analyzed the data; Vitor Baccarin Zanetti and Debora M. De Freitas wrote the paper.

Conflicts of Interest

The authors declare no conflict of interest.

References

  1. IPCC—International Panel on Climate Changes. Climate Change: The IPCC Scientific Assessment; International Panel on Climate Changes (IPC): Cambridge, UK, 1990. [Google Scholar]
  2. Gornitz, V. Global Coastal Hazards from Future Sea Level Rise. Palaeogeogr. Palaeoclimatol. 1991, 89, 379–398. [Google Scholar] [CrossRef]
  3. Shaw, J.; Taylor, R.B.; Forbes, D.L.; Ruz, M.-H.; Solomon, S. Sensitivity of the Coasts of Canada. Geol. Surv. Can. Bull. 1998, 505. [Google Scholar] [CrossRef]
  4. Jabareen, Y. The Risk City. Cities Countering Climate Change: Emerging Planning Theories and Practices around the World; Lecture Notes in Energy 29; Springer: Dordrecht, The Netherlands, 2015; p. 210. [Google Scholar]
  5. Abuodha, P.; Woodroffe, C.D. Assessing Vulnerability of Coasts to Climate Change: A Review of Approaches and Their Application to the Australian Coast. In GIS for the Coastal Zone: A Selection of Papers from Coastgis; Woodroffe, C.D., Bruce, E., Puotinen, M., Furness, R.A., Eds.; Australian National Centre for Ocean Resources & Security, University of Wollongong: Wollongong, Australia, 2007; p. 458. [Google Scholar]
  6. Cutter, S.L.; Boruff, B.J.; Shirley, W.L. Social Vulnerability to Environmental Hazards. Soc. Sci. Q. 2003, 84, 242–261. [Google Scholar] [CrossRef]
  7. Balica, S.F.; Wright, N.G.; van Der Meulen, F. A flood vulnerability index for coastal cities and its use in assessing climate change impacts. Nat. Hazards 2012, 64, 73–105. [Google Scholar] [CrossRef]
  8. Alves, H.P.F. Vulnerabilidade Socioambiental Na Metrópole Paulistana: Uma Análise Sociodemográfica Das Situações de Sobreposição Espacial de Problemas e Riscos Sociais e Ambientais. Revista Brasileira de Estudos de População; Associação Brasileira de Estudos Populacionais: Rio De Janeiro, Brazil, 2006; Volume 23, pp. 43–59. (In Portuguese) [Google Scholar]
  9. Nicolodi, J.L.; Peterman, R.M. Climate Changes and Vulnerability of the Brazilian Coastal Zone in Its Environmental, Social, and Technological Aspects. J. Integr. Coast. Zone Manag. 2010, 10, 151–177. [Google Scholar]
  10. Iwama, A.Y.; Batistella, M.; Ferreira, L.C. Geotechnical Risks and Social Vulnerability in Coastal Areas: Inequalities and Climate Change. Ambiente Soc. 2014, 17, 251–274. [Google Scholar] [CrossRef]
  11. Furlan, A.; Bonotto, D.M.; Gumiere, S.J. Development of Environmental and Natural Vulnerability Maps for Brazilian Coastal at São Sebastião in São Paulo State. Environ. Earth Sci. 2011, 64, 659–669. [Google Scholar] [CrossRef]
  12. IPCC—International Panel on Climate Changes. Summary for Policy Makers. In Climate Change 2014: Impacts, Adaptation, and Vulnerability. Part A: Global and Sectoral Aspects. Contribution of Working Group II to the Fifth Assessment Report of the Intergovernmental Panel on Climate Change; Field, C.B., Barros, V.R., Dokken, D.J., Mach, K.J., Mastrandrea, M.D., Bilir, T.E., Chatterjee, M., Ebi, K.L., Estrada, Y.O., Genova, R.C., et al., Eds.; International Panel on Climate Changes (IPCC): Cambridge, UK, 2014; pp. 1–32. [Google Scholar]
  13. Cutter, S.L.; Mitchell, J.T.; Scott, M.S. Revealing the Vulnerability of People and Places: A Case Study of Georgetown County, South Carolina. Ann. Assoc. Am. Geogr. 2000, 90, 713–737. [Google Scholar] [CrossRef]
  14. Miller, F.; Osbahr, H.; Boyd, E.; Thomalla, F.; Bharwani, S.; Ziervogel, G.; Walker, B.; Birkmann, J.; Van Der Leeuw, S.; Rockström, J.; et al. Resilience And Vulnerability: Complementary or Conflicting Concepts? Ecol. Soc. 2010, 15, 11. [Google Scholar]
  15. Thieler, E.R.; Hammar-Klose, E.S. National Asssessment of Vulnerability to Sea-Level Rise: Preliminary Results for the U.S. Atlantic Coast; United States Geological Survey: Reston, VA, USA, 1999. [Google Scholar]
  16. Karymbalis, E.; Chalkias, C.; Chalkias, G.; Gigoropoulou, E.; Manthos, G.; Ferentinou, M. Assessment of the Sensitivity of the Southern Coast of the Gulf of Corinth (Peloponnese, Greece) to Sea-Level Rise. Cent. Eur. J. Geosci. 2012, 4, 561–577. [Google Scholar] [CrossRef]
  17. Boruff, B.J.; Emrich, C.; Cutter, S.L. Erosion Hazard Vulnerability of US Coastal Counties. J. Coast. Res. West Palm Beach (Fla.) 2015, 21, 932–942. [Google Scholar] [CrossRef]
  18. Wu, S.Y.; Yarnal, B.; Fischer, A. Vulnerability of Coastal Communities to Sea-Level Rise: A Case Study of Cape May County, New Jersey, USA. Clim. Res. 2002, 22, 255–270. [Google Scholar] [CrossRef]
  19. Chakraborty, J.; Tobin, G.A.; Montz, B.E. Population Evacuation: Assessing Spatial Variability in Geophysical Risk and Social Vulnerability to Natural Hazards. Nat. Hazards Rev. Am. Soc. Civ. Eng. 2005, 6, 23–33. [Google Scholar] [CrossRef]
  20. Li, K.; Li, G.S. Vulnerability Assessment of Storm Surges in the Coastal Area of Guangdong Province. Nat. Hazards Earth Syst. Sci. 2011, 11, 2003–2010. [Google Scholar] [CrossRef]
  21. Adger, W.N. Vulnerability. Glob. Environ. Chang. 2006, 16, 268–281. [Google Scholar] [CrossRef]
  22. Füssel, H.M.; Klein, R.J.T. Climate Change Vulnerability Assessment: An Evolution of Conceptual Thinking. Clim. Chang. 2006, 75, 301–329. [Google Scholar] [CrossRef]
  23. O’brien, K.L.; Eriksen, S.; Nygaard, L.P.; Schjolden, A. Why Different Interpretations of Vulnerability Matter in Climate Change Discourses. Clim. Policy 2007, 7, 73–88. [Google Scholar] [CrossRef]
  24. Inouye, C.E.N.; Sousa, W.C., Jr.; Freitas, D.M.; Simões, E. Modelling the Spatial Dynamics of Urban Growth and Land Use Changes in the North Coast of São Paulo, Brazil. Ocean Coast. Manag. 2015, 108, 147–157. [Google Scholar] [CrossRef]
  25. Sharp, R.; Tallis, H.T.; Ricketts, T.; Guerry, A.D.; Wood, S.A.; Chaplin-Kramer, R.; Nelson, E.; Ennaanay, D.; Wolny, S.; Olwero, N.; et al. Invest User’s Guide, 2014. Available online: http://data.naturalcapitalproject.org/nightly-build/invest-users-guide/html/ (accessed on 13 July 2016).
  26. Anazawa, T.M.; Feitosa, F.F.; Monteiro, A.M.V. Vulnerabilidade Socioecológica No Litoral Norte de São Paulo: Medidas, Superfícies e Perfis de Ativos. Geografia 2012, 38, 189–208. (In Portuguese) [Google Scholar]
  27. IBGE—Instituto Brasileiro De Geografia E Estatística. Atlas Do Censo Demográfico 2010; IBGE: Brasília, Brazil, 2013. (In Portuguese) [Google Scholar]
  28. IPCC—International Panel on Climate Changes. Summary for Policymakers. In Climate Change 2013: The Physical Science Basis. Contribution of Working Group I to the Fifth Assessment Report of the Intergovernmental Panel on Climate Change; Stocker, T.F., Qin, D., Plattner, G.-K., Tignor, M., Allen, S.K., Boschung, J., Nauels, A., Xia, Y., Bex, V., Midgley, P.M., Eds.; International Panel on Climate Changes (IPCC): Cambridge, UK, 2013; pp. 1–32. [Google Scholar]
  29. Chou, S.; Lyra, A.; Mourão, C.; Dereczynski, C.; Pilotto, I.; Gomes, J.; Bustamante, J.; Tavares, P.; Silva, A.; Rodrigues, D.; et al. Evaluation of the Eta Simulations Nested in Three Global Climate Models. Am. J. Clim. Chang. 2014, 3, 438–454. [Google Scholar] [CrossRef]
  30. Chou, S.C.; Pilotto, I.L.; Nobre, P. Seasonal Climate Hindcasts with Eta Model Nested in Cptec Coupled Ocean Atmosphere General Circulation Model. Theor. Appl. Climatol. V 2012, 110, 437–456. [Google Scholar]
  31. IPT—Instituto de Pesquisas Tecnológicas do Estado de São Paulo. Cartas de Suscetibilidade a Movimentos Gravitacionais de Massa e Inundações—1:25.000; IPT: São Paulo, Brazil, 2014. (In Portuguese) [Google Scholar]
  32. Valeriano, M.M. Modelo Digital de Variáveis Morfométricas Com Dados Srtm Para O Território Nacional: O Projeto Topodata. In XII Simpósio Brasileiro de Sensoriamento Remoto, 2005, Goiânia, Go. Anais Do XII Simpósio Brasileiro de Sensoriamento Remoto; XII Simpósio Brasileiro de Sensoriamento Remoto (XII SBSR): Goiania, Brazil, 2005; pp. 1–8. (In Portuguese) [Google Scholar]
  33. Valeriano, M.M.; Rossetti, D.F.; Albuquerque, P.C.G. Topodata: Desenvolvimento da Primeira Versão Do Banco de Dados Geomorfométricos Locais Em Cobertura Nacional. In Simpósio Brasileiro de Sensoriamento Remoto, 2009, Natal, Rn; XIV Simpósio Brasileiro de Sensoriamento Remoto (XIV SBSR): São José dos Campos, Brazil, 2009; pp. 1–8. (In Portuguese) [Google Scholar]
Figure 1. Structure of the Socio-environmental Vulnerability Index for Coastal Areas (SEVICA).
Sustainability 08 00811 g001
Figure 2. Santos, central coast of Sao Paulo, Brazil, highlighting the study area.
Sustainability 08 00811 g002
Figure 3. Vulnerability of Santos under scenario IPCC 4.5 (0.33 m sea-level rise projection) based on the SEVICA index.
Sustainability 08 00811 g003
Figure 4. Vulnerability of Santos under scenario IPCC 8.5 (0.38 m sea-level rise projection) based on the SEVICA index.
Sustainability 08 00811 g004
Table 1. Examples of different approaches to measuring vulnerability.
Vulnerability ConceptIndex NameVariables/Parameters/FactorsReference
GeophysicalCVIRelief, geomorphology, rock type, vertical sea level movement, shoreline displacement, tidal range, wave height[2]
SIRelief, rock type, geomorphology, sea level tendency, shoreline displacement rate, mean tidal range, mean annual maximum significant wave height[3]
CVIGeomorphology, coastal slope, relative sea-level rise rate, shoreline erosion/accretion rate, mean tide range, mean wave height[15]
CSICVI (Thieler e Hammar-Klose,1999)[16]
SocialSoVIPersonal Wealth, age, density of the built environment, single-sector economic dependence, housing stock and tenancy, race—African American, race—Native American, race—Asian, occupation, infrastructure dependence[6]
CsoVIPoverty, age, development density, Asian and immigrants, rural/urban dichotomy, race and gender, population decline, ethnicity (Indian) and farming, infrastructure employment reliance, income[15]
Socio-EnvironmentalPVICVI (Thieler e Hammar-Klose,1999) + CsoVI[17]
N.DFlood-risk zones, population, housing units, females, ethnic population, young (under 18), elderly (age over 60), single mother households, renter-occupied housing units[18]
N.DFlooding risk, population and structure, differential access to resources, population with special evacuation needs[19]
N.DSocioeconomic index, land use index, eco-environmental index, coastal construction index, disaster-bearing capability index[20]
N.DSea level rise, storm surge, number of cyclones in the last 5 years, river discharge, foreshore slope, soil subsidence, km of coastline, population close to coastline, percentile of disabled persons, shelters, cultural heritage, awareness and preparedness, km of drainage, growing coastal population, recovery time, uncontrolled planning zones, flood hazard maps, institutional organizations, flood protection[7]
Note: N.D = Not defined.
Table 2. Factors, parameters, and data sources for the Socio-environmental Vulnerability Index for Coastal Areas (SEVICA).
FactorParametersSource of Data
Flooding (F)Slope (S)DEM
Number of Extreme Events (NEE)Climatic Models, Meteorological Data
Water Body Proximity (WBP)Hydrography Maps
Landslides (L)Slope (S)DEM
Number of Extreme Events (NEE)Climatic Models, Meteorological Data
Geotechnical Classification of Soil(GCS)Geology institutes, Mineralogy institutes, or Engineering Institutes
Coastal Erosion (CE)Geomorphology (G)Geology institutes, Mineralogy institutes, or Engineering Institutes
SLR (SLR)IPCC, Sea Level Rise Models
Tide Height (TH)Oceanography institutes, Navy
Wave Exposition (WE)SLR (SLR)IPCC, Sea Level Rise Models
Relief (R)DEM
Distance of the coast (DC)Geopolitical Maps
Socioeconomic Status (SS)Education Level (EL)Nacional or Regional Census
Income (I)Nacional or Regional Census
Population Density (PD)Population Density (DENS)Nacional or Regional Census
Age (A)Nacional or Regional Census
Land Use (LU)Land Use (USE)Local Government
Table 3. Parameters’ classification scale.
FactorParameter/Classification12345Reference
LandslideNumber of Extreme Events in the last 10 years (NEE)≤3 events≤10 events≤20 events≤36 events>36 eventsAdapted from [7]
Geotechnical Classification of Soil (GCS)BedrockTertiary non-expansive soil, fractured rock with rugous surfaceLaterite soils, sandy soilAlluvial (quaternary), fractured rock with clean ruptures filled with claysColluvium and talus body, expansive SoilsExpert elicitation
Slope (S)≤20%≤40%≤60%≤80%>80%Adapted from [25]
FloodingNumber of Extreme Events in the last 10 years (NEE)≤3 events≤10 events≤20 events≤36 events>36 eventsAdapted from [7]
Slope (S)≥80%≥60%≥40%≥20%<20%Adapted from [25]
Water Body Proximity (WBP)>150 m>100 m>50 m>20 m≤10 mAdapted from [26]
Wave ExposureSea Level Rise (SLR)≤0 m≤0.3 m≤0.5 m≤0.7 m≤0.9 mAdapted from [25]
Relief (R)> 50 m>20 m>10 m>5 m≤1 mAdapted from [24]
Distance of the coast (DC)>150 m>100 m>50 m>20 m≤10 mAdapted from [26]
Coastal ErosionSea Level Rise (SLR)≤0 m≤0.3 m≤0.5 m≤0.7 m≤0.9 mAdapted from [25]
Geomorphology (G)Rocky, high cliffs, seawallsMedium cliffs and indented coast, bulkheadLow cliffs, alluvial plainCobble beach, estuary, lagoonSand beach, mud flat, deltaAdapted from [25]
Tide Height (TH)≤0.5 m≤1 m≤1.5 m≤2.0 m≤2.5 mAdapted from [15]
Population DensityPopulation Density (DENS)≤5000≤10,000≤50,000≤100,000>100,000Elaborated by authors
Age (A)25–30 years old35–40 years old15–20 years old and 40–50 years old5–15 years old and 50–60 years old0–5 years old and more than 60 years oldAdapted from [6]
Socio-economic levelIncome (I)>20 LMWup to 20 LMWup to 10 LMWup to 5 LMWup to 2 LMWAdapted from [8]
Education Level (EL)Graduated or higherUndergraduatedCollegeHigh SchoolElementary school or less.Adapted from [8]
Land UseLand Use (USE)Environmental protection area or natural habitatRural AreaResidential AreaCommercial AreaIndustrial AreaElaborated by authors.
Note: LMW = local minimum wage.
Table 4. Factors, parameters and data sources for index operationalization.
FactorParameterData Source
Landslide (L)Number of Extreme Events in the last 10 years (NEE)ETA-CPTEC/INPE, Brazil [29,30]
Geotechnical Classification of Soil (GCS)IPT [31]
Slope (S)Topodata [32,33]
Flooding (F)Number of Extreme Events in the last 10 years (NEE)ETA-CPTEC/INPE, Brazil [29,30]
Slope (S)Topodata [32,33]
Water Body Proximity (WBP)IPT [31]
Wave Exp (WE)Sea Level Rise (SLR)IPCC AR5 [28]
Relief (R)Topodata [32,33]
Distance of the Coast (DC)Elaborated by authors.
Coastal Erosion (CE)Sea Level Rise (SLR)IPCC AR5 [28]
Geomorphology (G)IPT [31]
Tide Height (TH)Elaborated by authors.
Populaton Density (PD)Population Density (DENS)Brazilian Census [27]
Age (A)Brazilian Census [27]
Socioeconomic Status (SS)Income (I)Brazilian Census [27]
Education Level (EL)Brazilian Census [27]
Land Use (LU)Land Use (USE)Santos master plan *
* The Land Use map was elaborated by the Santos City council, in 2013; it is the city’s current master plan.

