Article

Early Adoption of Innovative Analytical Approach and Its Impact on Organizational Analytics Maturity and Sustainability: A Longitudinal Study from a U.S. Pharmaceutical Company

Department of Décision and System Sciences, Haub School of Business, Saint Joseph’s University, Philadelphia, PA 19131, USA
*
Author to whom correspondence should be addressed.
Sustainability 2016, 8(8), 808; https://doi.org/10.3390/su8080808
Submission received: 18 May 2016 / Revised: 21 July 2016 / Accepted: 8 August 2016 / Published: 17 August 2016

Abstract

:
We investigate the impact of early adoption of an innovative analytics approach on organizational analytics maturity and sustainability. With the sales operation planning involving the accurate determination of physician detailing frequency, multiple product sequencing, nonlinear promotional response functions and achievement of the right level of share of voice (SOV), an analytical approach was developed by integrating domain knowledge, neural network (NN)’s pattern-recognition capability and nonlinear mathematical programming to address these challenges. A pharmaceutical company headquartered in the U.S. championed this initial research in 2005 and became the first major firm to implement the recommendations. The company improved its profitability by 12% when piloted to a sales district with 481 physicians; then it launched this approach nationally. In 2014, the firm again gave us its data, performance of the analytical approach and access to key stakeholders to better understand the changes in the pharmaceutical sales operations landscape, the firm’s analytics maturity and sustainability of analytics. Results suggest that being the early adopter of innovation doubled the firm’s technology utilization from 2005 to 2014, as well as doubling the firm’s ability to continuously improve the sales operations process; it outperformed the standard industry practice by 23%. Moreover, the infusion of analytics from the corporate office to sales, improvement in management commitment to analytics, increased communications for continuous process improvement and the successes from this approach has created the environment for sustainable organizational growth in analytics.

1. Introduction

In spite of numerous challenges over the years, with not enough new branded drugs replacing blockbuster drugs going off patent [1] and numerous negative press from the consumer groups, including the government, of the pharmaceutical industry’s aggressive sales and marketing practices [2], the U.S. pharmaceutical market is starting to make a comeback. According to IMS Health [3], one of the largest healthcare data providers in the world, the U.S. market will experience 5%–8% growth, computed by compound annual growth rate (CAGR), from 2014 to 2018; this growth is driven largely by sales coming from specialty medicine. In fact, the growth is not limited to the U.S. market, with the global market projected to grow at a CAGR of 4%–7% to 2018 and reach $1.3 trillion in sales.
One of the components driving today’s growth is the pharmaceutical firms’ adoption of analytics in its business processes, sustainability of analytics and subsequent maturity of the firms in the way it embraces and utilizes analytics. When the industry was facing challenges more than a decade ago, the industry was actively innovating analytics and adopting these innovations in order to improve the status quo. In fact, the analytics footprint can be found in many ways over the past two decades including the way sales and marketing resources were allocated over the years [4], the more efficient discovery of new medicines [5] and improvement in the industry’s supply chain logistics [6,7]. These improvements have contributed significantly to its recovery.
The term “sustainability” refers to institutionalization and routinization [8,9]. For success to take a firm hold, planning for sustainability during the development phase also plays a key role [10,11]. In addition, the new approach has to be transparent and coachable from the execution standpoint in order for the organization to mature into a desired competency level [12].
However, to date no published paper has studied (from the longitudinal perspective) the impact from implementation of an analytical approach, as well as its sustainability and assessment of organization-wide analytics maturity through the early adoption of innovative analytics. In this paper, we provide the results of an innovative, knowledge-based analytical approach introduced to a pharmaceutical company in 2005, in an effort to improve sales and marketing resource allocation and implemented locally at a randomly selected sales district. The firm benefited so much from piloting this analytical approach that it not only continued using it but also launched it nationally and the evolution of the approach was measured longitudinally to the end of 2014. We also assess what the impact of adopting analytics at an early stage has on the sustainability of the approach and progression of the firm’s analytics maturity level. We believe these findings will help organizations deciding on investing in analytics, what to measure from the start in order to efficiently mature in analytics and sustain the growth.
The knowledge-based analytical approach in this paper refers to the work done by Yi [13] to address the inaccuracies in determining physician detailing equivalent (PDE) weights when multiple prescription drugs are detailed to target physicians; essentially, PDE, which is utilized by all firms in the pharmaceutical industry, provides a tradeoff between detailing a single product versus multiple products. The accuracy of the PDE weights is critical to optimal sales force resource allocation to maximize sales operation productivity and it has been launched nationally with great success. The pharmaceutical company that originally sponsored the 2005 research has provided the 2014 data and insights on its performance over the years for this paper. Even though this paper focuses on results from a single pharmaceutical company, there are other companies who have successfully used this analytical approach without giving us the permission to publish their results and therefore, we believe the approach can be generalized.
The remainder of the paper is organized as follows: Section 2 provides the background overview of the sales operation function within the pharmaceutical industry and Section 3 reviews the traditional approach in computing share of voice (SOV) and its impact on allocating sales force resources. Section 4 explains the data sets used for this study for both the analytical study and analytics sustainability and maturity assessment. Section 5 describes the innovative analytical approach developed in 2005 to derive the physician detailing equivalent weights for the multiple-product detailing planning purposes, strategies involving sustainability of the approach, and the way it has evolved over the 10-year period. Section 6 summarizes the performance of the approach over the years and provides insights, including sustainability and analytics maturity assessment found from the results. Section 7 discusses the impact of the analytical approach on sales operations as well as future directions of the research.

2. Pharmaceutical Sales Operations Background

Pharmaceutical companies invest heavily into their sales force to provide the latest information and development about their prescription drugs to the physicians, as well as to promote the prescription of their drugs. In fact, given a similar situation where two prescription drugs are equal in helping the patients recover from their ailment, the company believes that the selling ability of its sales rep will influence the physicians to prescribe its drug. This dynamic of promoting to physicians, who are not the end users of the product being promoted, is different from traditional marketing where the end users are directly targeted for all the promotional efforts. However, detailing is not all different than the traditional promotional approaches because it is a marketing tool, an informational source and a way to effectively manage the relationship of the customers [14,15]. We will be using drugs and products interchangeably in this paper.
The cost of a sales representative’s visit to a physician’s office, the process also known as detailing, is anywhere from $100 to $250, which quickly adds up to become the biggest investment companies make to market their prescription products. For this reason, companies spend countless hours and effort in order to identify the right physicians to target their efforts to, research the most effective detailing sequence when multiple drugs are involved and find optimal detailing frequency for their target physicians over time [2].
With the recent changes in the pharmaceutical selling landscape, detailing efforts have slowly been losing their effect over time. The primary change is managed care organizations’ growing influence in regulating the use of drugs coupled with an increasing number of physicians seeking more objective scientific evidence of benefits [16,17,18]. Moreover, a more competitive detailing environment requires a significantly higher level of effectiveness and creativity in advertising and marketing [19]; the number of new blockbuster drugs to gain physicians’ attention, let alone being approved, has declined considerably over the years [20]; and the increasing roles of electronic detailing and direct-to-consumer advertisements [21,22,23,24] all have contributed to the decreasing impact of detailing. The average detailing duration dropped from five minutes in 1998 to less than sixty seconds in 2004 and beyond [25] and signals the physicians’ diminishing interest from sales representative detailing.
In spite of all the difficulties facing detailing efforts, many researchers continue to find evidence that a high market share of detailing, also known as share of voice (SOV), clearly impacts the market share of the drugs that are detailed [26,27,28]. As a result, pharmaceutical firms continue to commit to maximizing their share of voice within their resource constraint in an effort to increase sales; one way to increase the share of voice without adding more sales representatives is to detail multiple drugs instead of detailing just one.
In addition, many firms have been investing heavily in analytical capabilities over the years. It is important to understand the factors that sustain the analytics initiatives and the extent to which analytics potential is utilized and to help the firms maximize the full benefits of their personnel, data, technologies and other analytics investments. This is critical to competing successfully in today’s market and with an ongoing analytics maturity assessment for continuous improvement, firms can position themselves well to compete on analytics [29].

3. Traditional Sales Operations Analytics

To find the accurate SOV, one must first compute the physician detail equivalent (PDE) weights for the drug and the market; PDE is a standard practice used by the pharmaceutical industry to compute total detailing efforts when detailing is done in multiple sequences and the PDE weights reflect the relative detailing impact of each sequence. Equation (1) shows how PDEjkl, which denotes physician detail equivalent for physician j, in time period k, for drug l, is calculated:
P D E j k l = i ( W i × D i j k l )    for i , j , k , l
Dijkl is defined as the total number of details made in sequence i to physician j in time period k, for drug l, while Wi defines the PDE weight for detailing sequence i. In addition, the weights play an instrumental role in computing share of voice in time period k, for drug l, denoted as SOVkl, as shown in Equation (2):
S O V k l = j P D E j k l l j P D E j k l    for k
The traditional PDE weights shown in Table 1 are provided by the sponsoring firm in 2004 and to this day, used by many pharmaceutical companies; the table shows that the full weight of one is assigned to the first detailing drug no matter how many other drugs are in the detailing portfolio. Similarly, if the product is detailed in the second sequence, it will always have the PDE weight of 0.6, which means the sales rep is credited with 60% of detailing that drug to the physician, whether there are more subsequently detailed drugs or not. Finally, any product detailed in the third sequence or beyond will have the PDE weight of 0.3, which means the rep is credited with 30% of detailing the drug to the physician. Periodically, firms check to see if all the reps are meeting the call plan. For example, if the call plan directs the sales representative to detail a doctor at least twice in January for Product Z, this rep can detail Product Z twice in the first sequence, or detail three time in the 2nd position and once in the 3rd position (PDE = 2.1), or any other combination where PDE is at least 2 to meet the call plan. The key assumption is that these PDE weights are accurate.
In this approach, the firms detailing multiple drugs will always have a higher share of voice compared to those firms detailing a single drug. For example, when a sales representative details three drugs to a physician in a single visit, the rep is credited with 1.9 overall PDE for that visit versus 1.0 PDE when a rep details a single drug. Consequently, a firm can achieve relatively high level of SOV even when its drug is exclusively detailed in the third sequence.
According to the firm sponsoring this research, the PDE weights are originated from primary market research to physicians. Interviews with sales operations professionals in other companies made possible by pre-existing professional contacts have validated that these values are similar across the industry.
The traditional approach in utilizing PDE weights has two major weaknesses. First, the approach always favors the decision to detailing multiple drugs versus detailing at most two drugs. This is a flawed assumption because of the sales representatives’ difficulty in accessing physicians, and even the sales reps who were able to access physicians were struggling to detail multiple products with diminishing time with the physicians. In fact, research has shown that the time physicians have with the sales reps is less than a minute, which is hardly enough time to sufficiently detail even a single prescription drug [25]. Even when sales reps were able to detail multiple products, cannibalization amongst the products takes place due to the short, fixed time the sales reps have for the drugs sales. Consequently, always giving SOV advantage to a multiproduct detailing strategy may mislead management in making informed resource allocation decisions.
The second weakness is that the PDE weight for each detailing sequence is constant for all physicians, regardless of their responsiveness to detail, their specialty, or the level of their prescribing volume. This is another flawed assumption because physicians’ and their patients’ needs are different; if the firms do not accommodate these differences and neglect to provide micro-marketing strategy, the allocation of sales resources and resulting selling performance will be less than optimal [4].
Correcting these limitations and understanding the impact of the correction were the objectives of the earlier work of Yi [13]. In this paper, we take steps to understand the longitudinal performance of this approach and the resulting insights gained and we compare the firm’s analytics maturity assessed in 2005 with the assessment from 2014.

4. Data

This research was sponsored by a pharmaceutical firm headquartered in U.S. with annual global sales exceeding $3 billion; the firm wanted to remain anonymous for our publication while receiving the analytical model and the insights from the findings. The firm provided (1) the detailing history and respective sales data at the physician level for a randomly selected district in the Northeast region, comprising a total of 481 physicians on its target list; and (2) a team of domain experts and their time to help in this research on a prescription drug with more than $300 million in annual sales along with answering questions for analytics maturity assessment. This drug is promoted by multiple sales forces in different detailing sequences and it competes against multiple branded products in the same therapeutic market for a share of patients. The drug was selected in 2005 for this research due to the wealth of detailing data available and the firm’s motivation to gain more insights and a competitive advantage through the application of analytics.

4.1. Data for a Knowledge-Based Analytical Approach

Pharmaceutical companies generally determine which physicians to target for their detailing efforts based on the volume of prescriptions they have generated for both the drug class and the drug itself. The physicians were sorted in order of prescription volume in the disease class and then they were grouped into 10 equal segments, with the first decile representing the lowest prescribers and the 10th decile the highest; not surprisingly, the higher-decile physicians received significantly more detailing visits from the sales reps than did the lower-decile physicians. In addition, even those physicians who do not prescribe the firm’s drug, but were high prescribers of competing drugs in the market were also targeted by sales reps based on their potential to prescribe.
We combined two datasets, by unique physician identification number, to form the database for this study. One data set contains the number of prescriptions that the physicians on the company’s target list wrote for the studied drug and its competitors. The second dataset contains historical data on the sales reps’ detailing activity to the targeted physicians. Two years’ worth of data, broken out into eight quarters, from 2nd quarter 2003 through 1st quarter 2005, were collected to develop the very first knowledge-based analytical approach that can improve the accuracy of PDE weights to increase sales operations effectiveness.
To measure the effectiveness of the analytical approach after its implementation, we obtained the firm’s sales rep detailing data and respective sales data from the 3rd and 4th quarters of 2005 from the created database. Also, for evaluating the longitudinal impact of this approach, the data from the 3rd and 4th quarters of 2014 in the same district were obtained.
Furthermore, the company made available domain experts in marketing and sales to make fundamental operational knowledge transparent for this research, along with competitive sales activities data at the district level for the same period, to supplement the insight on market dynamics. Such data provided information on all competing products marketed in the same therapeutic area of the company’s product: the competitors’ sales force structure and changes over time; the number of sales reps detailing the drugs and their frequency; and the detailing sequences of the drugs in the district. The domain experts also answered questions in 2005 as well as 2014 to provide insights on the impact of analytics over the years to their professional growth as well as the organization’s analytics maturity.
We excluded data from other promotional activities such as DTC advertising, e-detailing, journal advertising and sponsored medical educational programs, due to concerns about data integrity at the physician level.

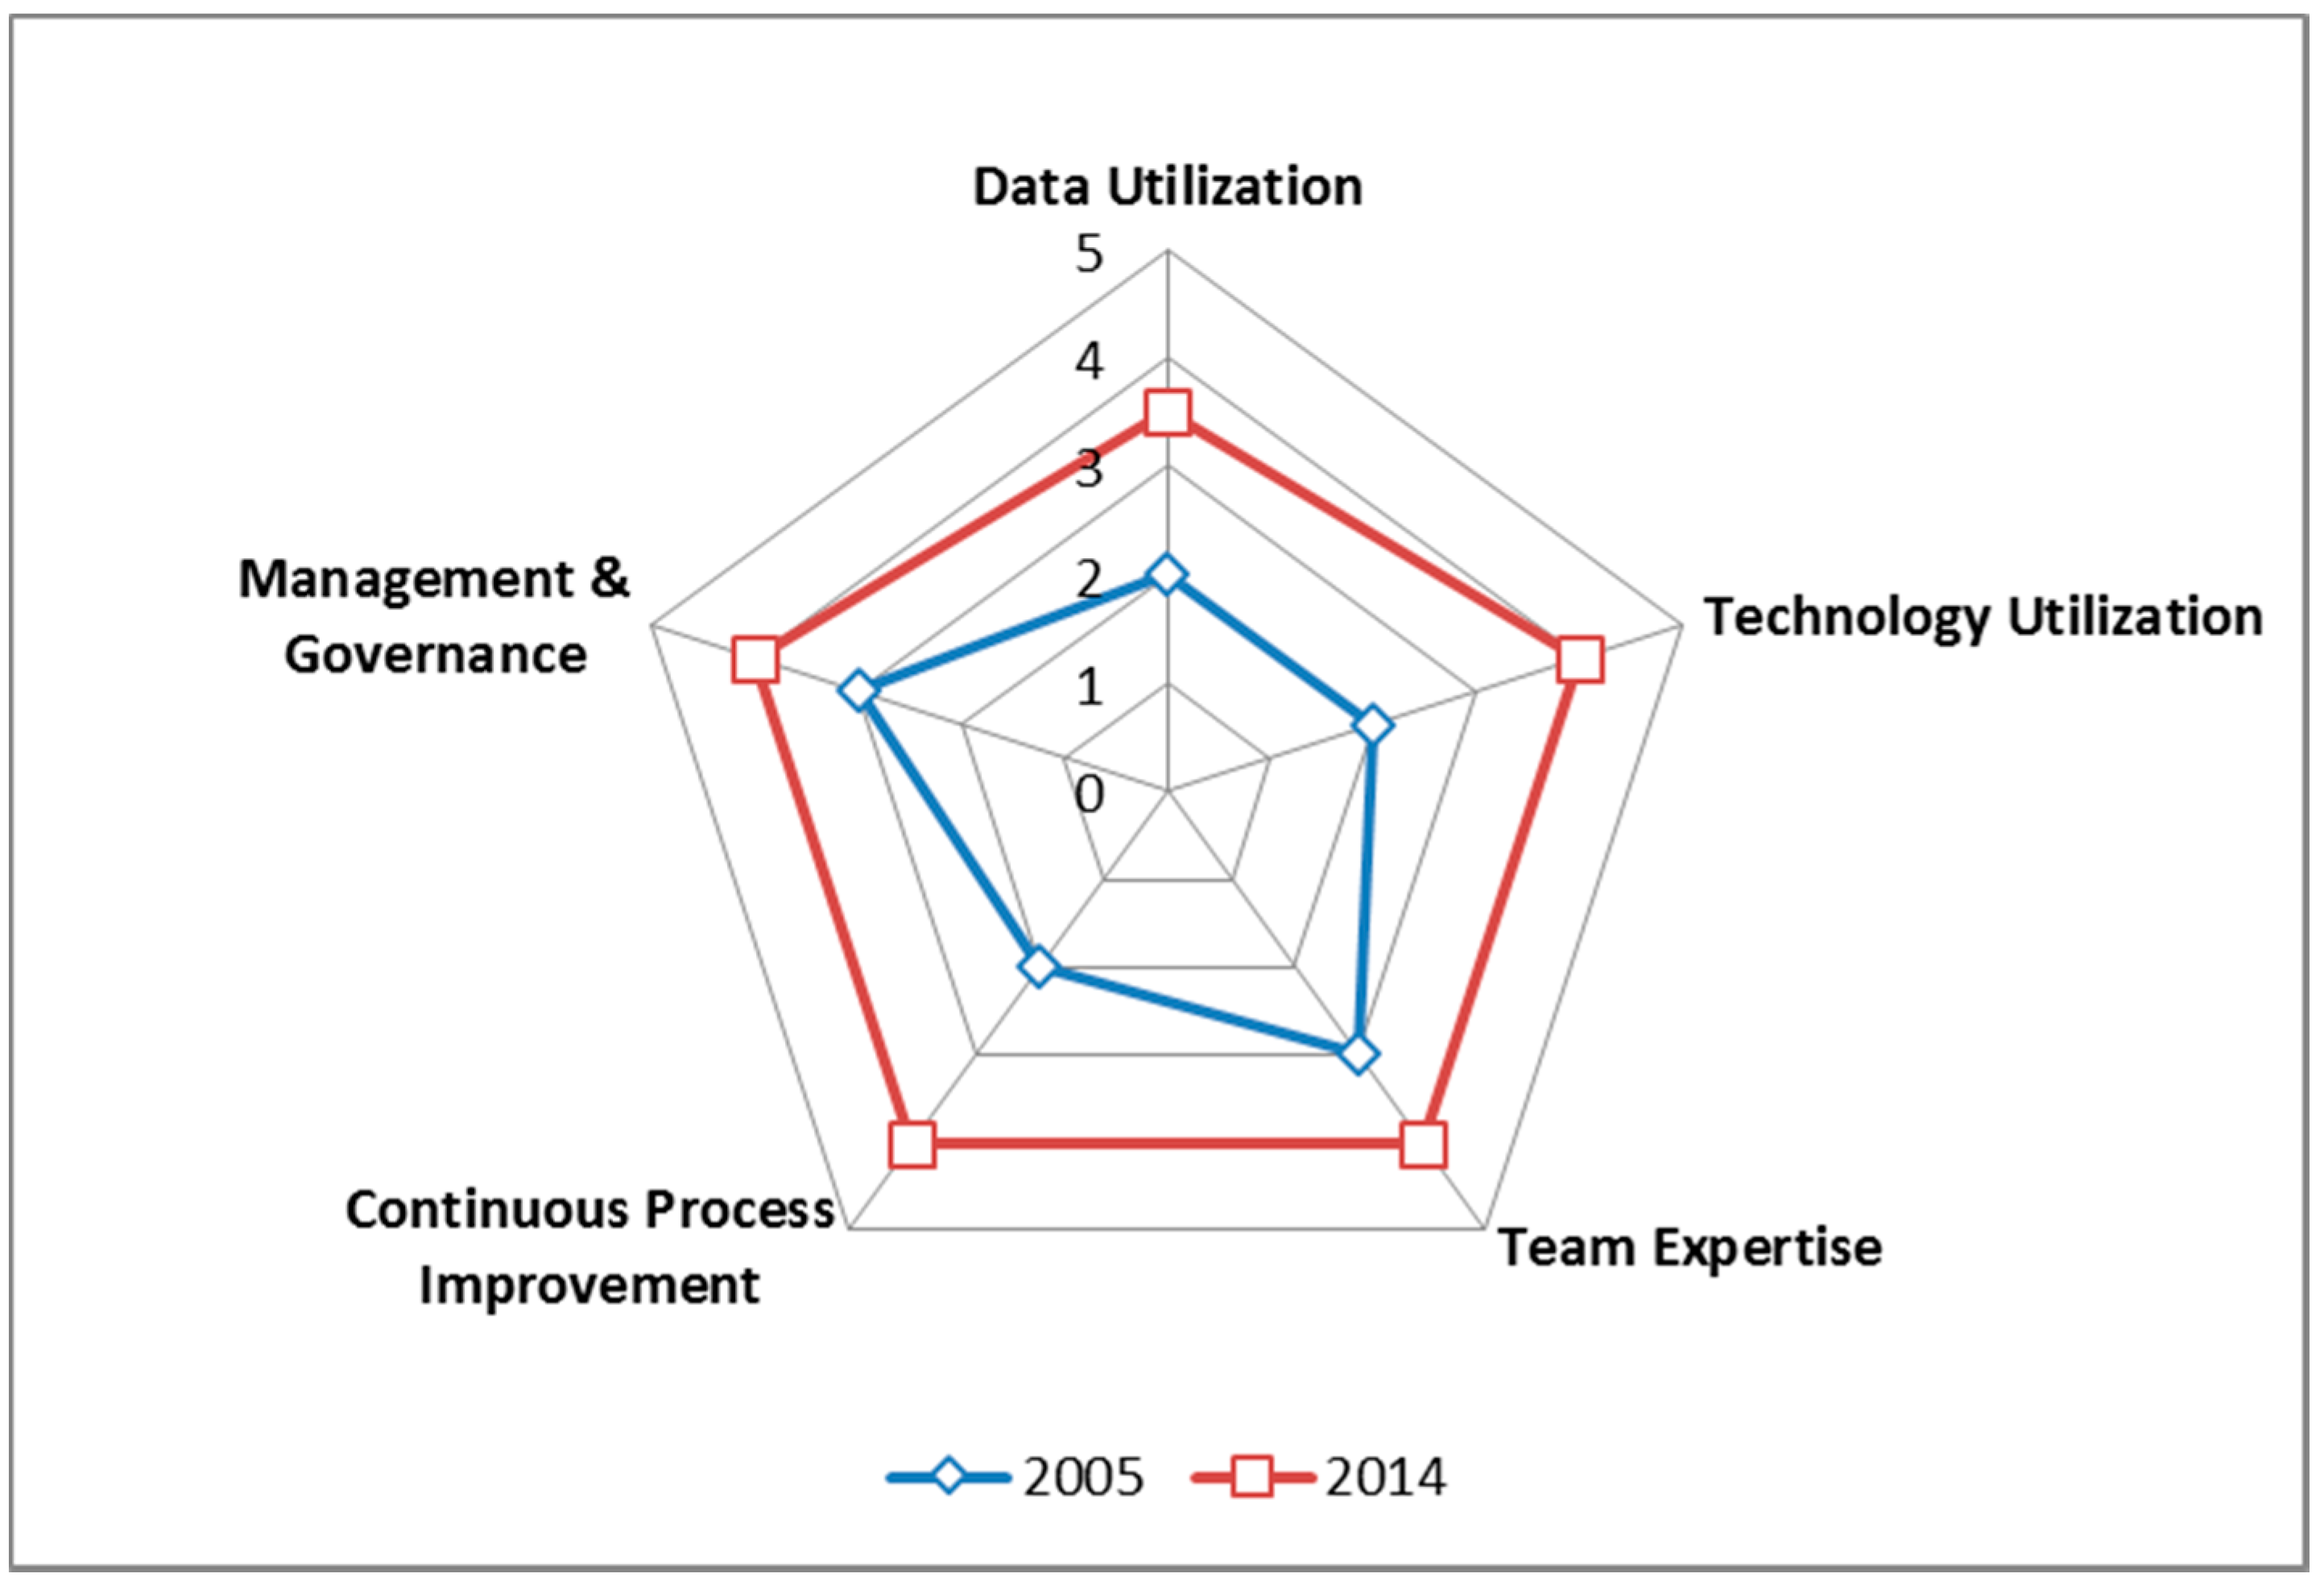
4.2. Data for Sustainability and Analytics Maturity Assessment

The sponsoring company wanted to assess five well-studied dimensions of sustainability, which were also cross-referenced to assessing analytics maturity and ongoing monitoring for continuous improvement opportunities in organizational-wide analytics. The dimensions measured are (1) data utilization [30]; (2) technology utilization [30]; (3) team expertise [31]; (4) continuous process improvement [8]; (5) management and governance [32]. A five-point scale was used for all the dimensions assessed. The assessment was developed together with the firm’s domain experts, communicated to upper management and gained acceptance to be fully assessed for the study in 2005 as well as in 2014.
Data utilization dimension measures how much of the data that the company collects is utilized in supporting organizational decisions. The five-point scale used for this assessment ranges from 100% utilization (scale value of 5) to 0% utilization (scale value of 1), with uniform increments for in-between scale values.
Technology utilization dimension measures what analytical tools are used to collect, manage, and extract data, to performing less complex analytics including performance reporting, data visualization and statistical analyses to complex analytical modeling that includes sales forecasting, data mining to find hidden insights, resource optimization and process simulation. To assess the level of utilization, we used the following five-point scale, with five being the highest level of utilization where the rigor corresponds to the details demanded in a doctoral program in a quantitative field; a scale of three being the level of rigor demanded in a master’s program in a quantitative field; and a scale of one being the level of rigor demanded in a bachelor’s program in a quantitative field.
Team expertise is assessed from the structure of analytics solution process and understanding of the solutions found by the end users. The scale of five is defined as having a team of analytics experts working together to provide and implement analytical solutions with the end users being well versed in the analytical tools and languages used to communicate the findings. The scale of three is defined as having a virtual team to carry out the analytical solution process and the end users being comfortable communicating the findings to their peers. The scale of one is defined as having no analytical analyst on staff and the end user having no understanding of analytics.
The continuous process improvement assesses the organization’s competency to monitor analytically driven activities and act on improvement opportunities in a timely manner. The scale of zero is defined as having no such feedback loop and the scale of five is defined as having a real-time and continuous feedback loop for the organization to set priority meetings to identify real opportunities from outliers for timely and effective improvements.
The management and governance assesses the culture of analytics within the organization. We assessed the degree to which analytical insights are communicated, understood and trusted along the management ladder. The scale of one is defined as there being no champion of analytical projects; the scale of three is defined as analytical projects being championed at the director level of personnel within the organization; the scale of five is defined as analytical projects being championed by senior management and the culture embracing analytical activities.

5. An Innovative Knowledge-Based Analytical Approach

A knowledge-based analytical approach is defined as one designed to extract and integrate the tacit and explicit knowledge within the organization and then to apply it as a vital component in the quantitative modeling process to improve the organization’s performance as well as gaining actionable knowledge that can provide a competitive advantage for the firm [33,34]. An innovative knowledge-based analytical approach has been developed and used at the physician level to improve on the traditional approach to sales operations involving multiple products. The theoretical framework for this approach is founded on utilization of domain knowledge and effectiveness of micromarketing and continues to be practiced by the sponsoring firm.

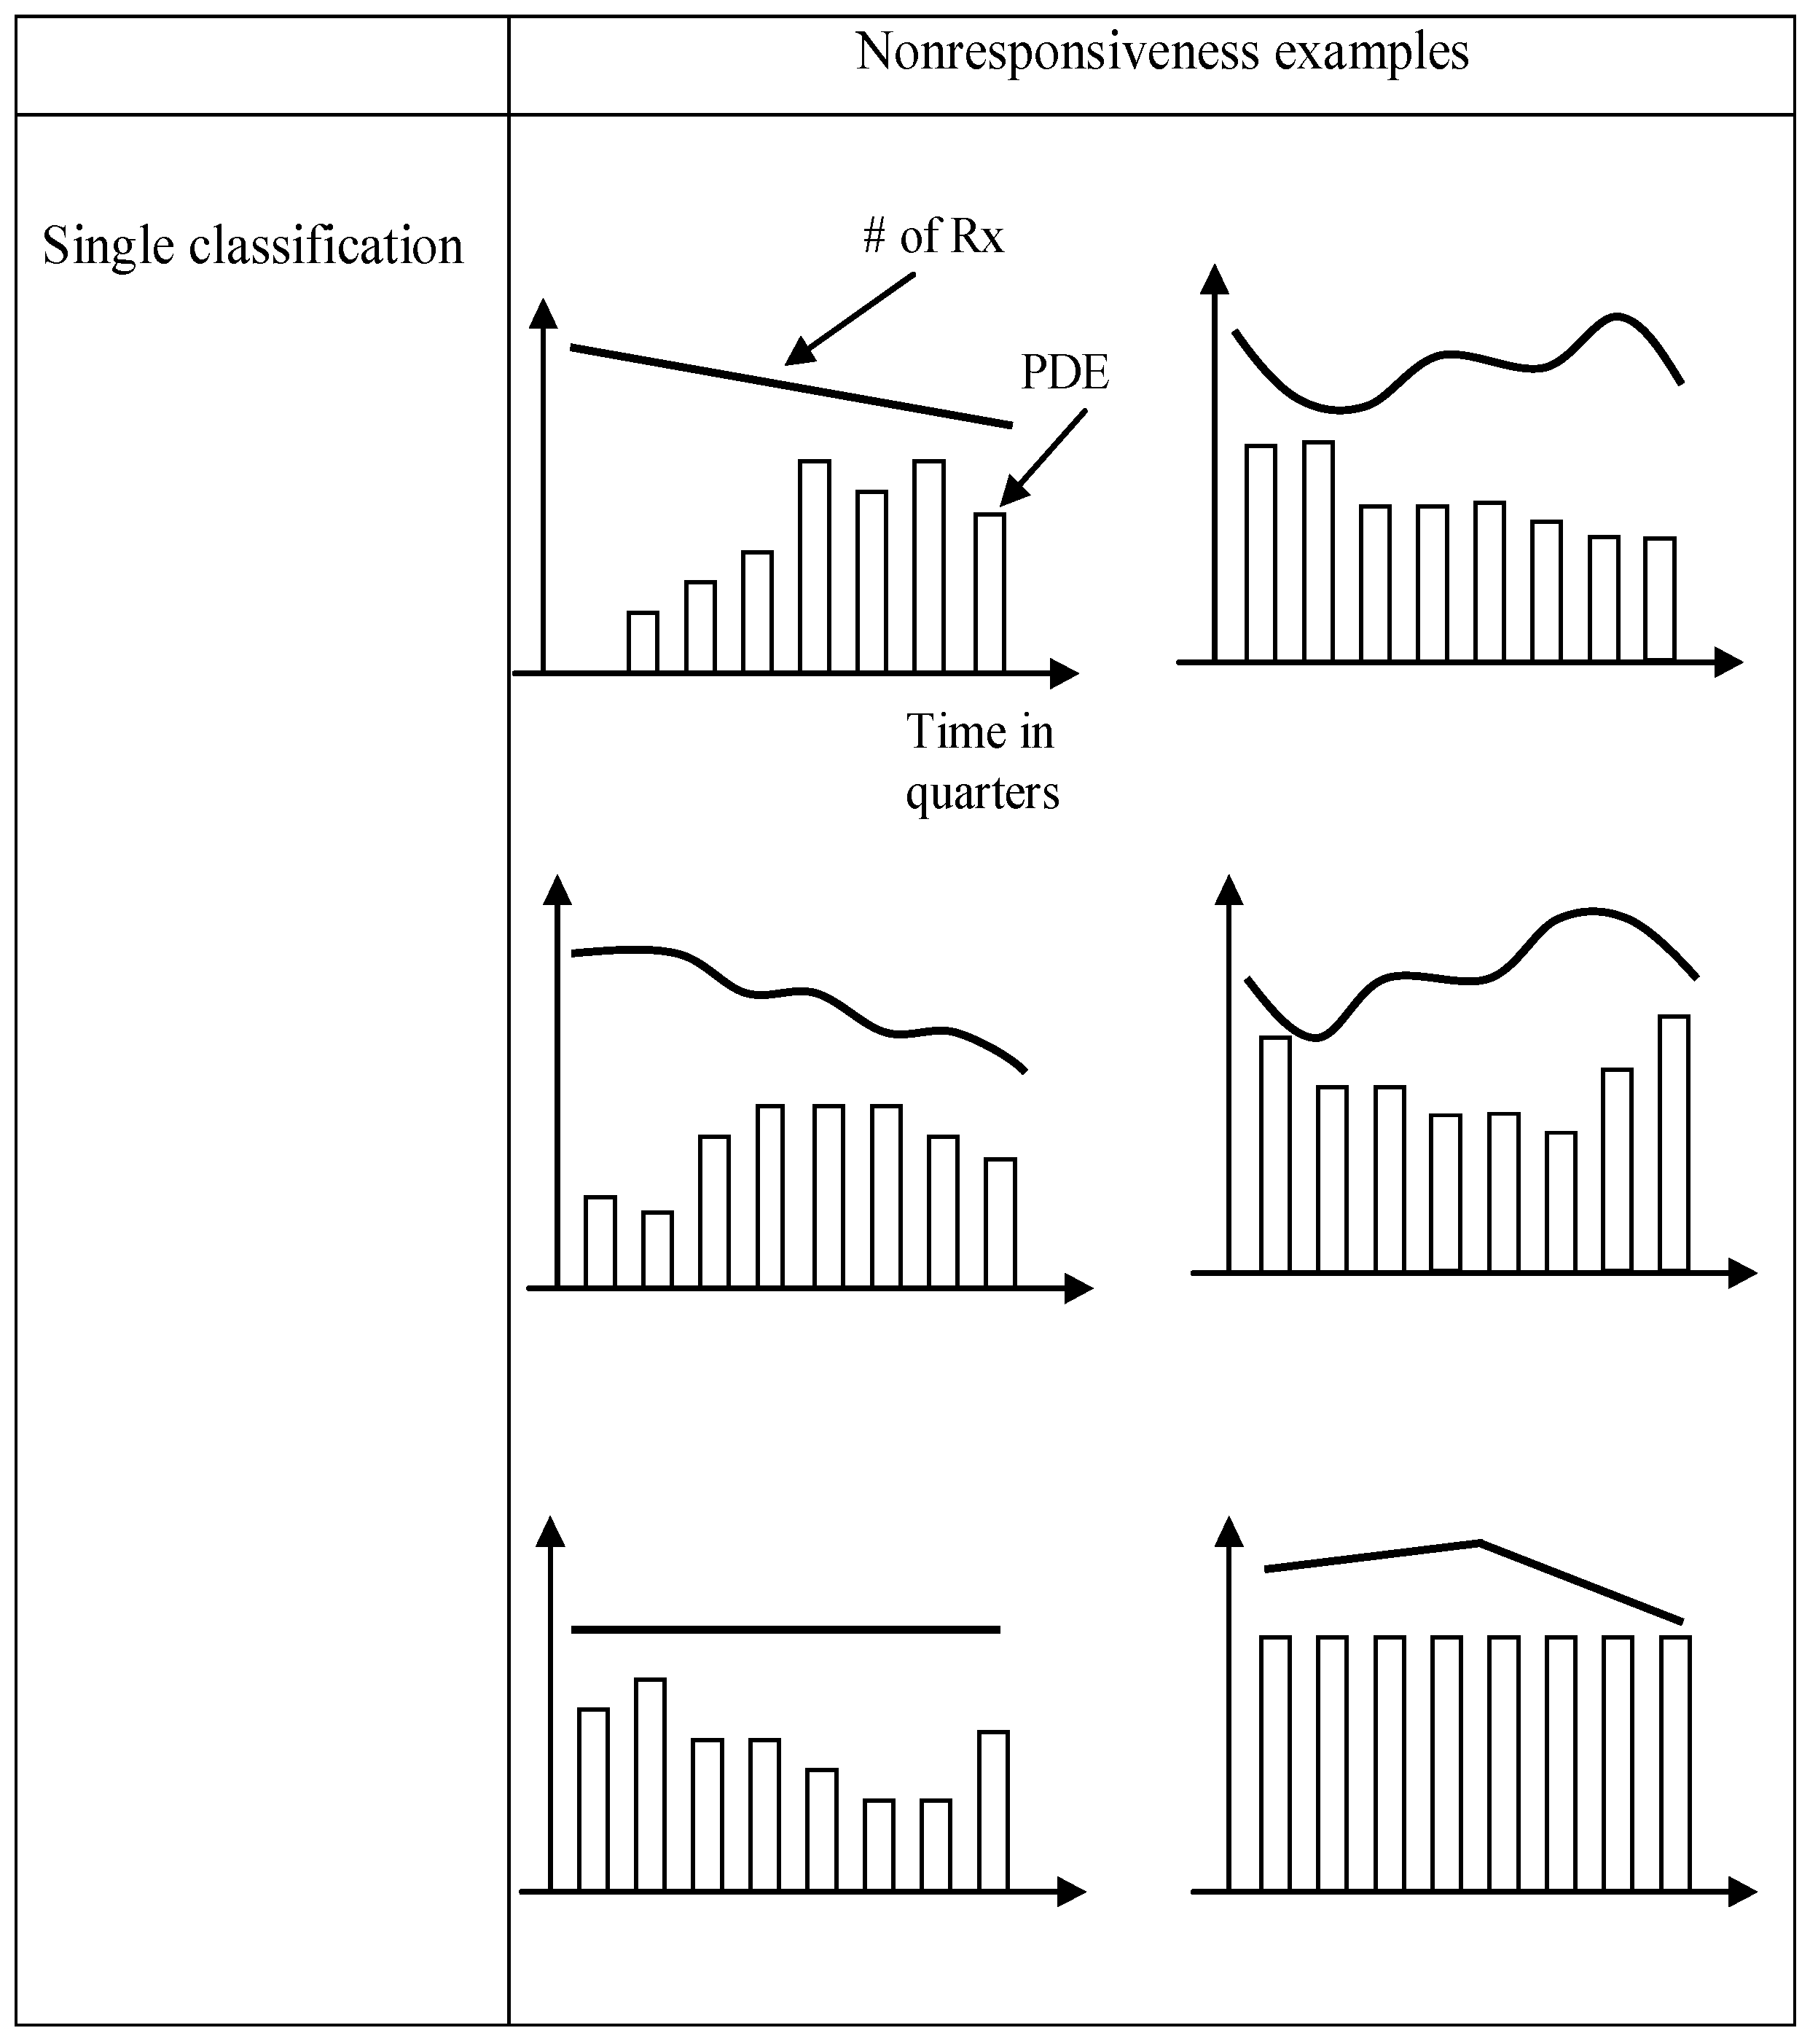
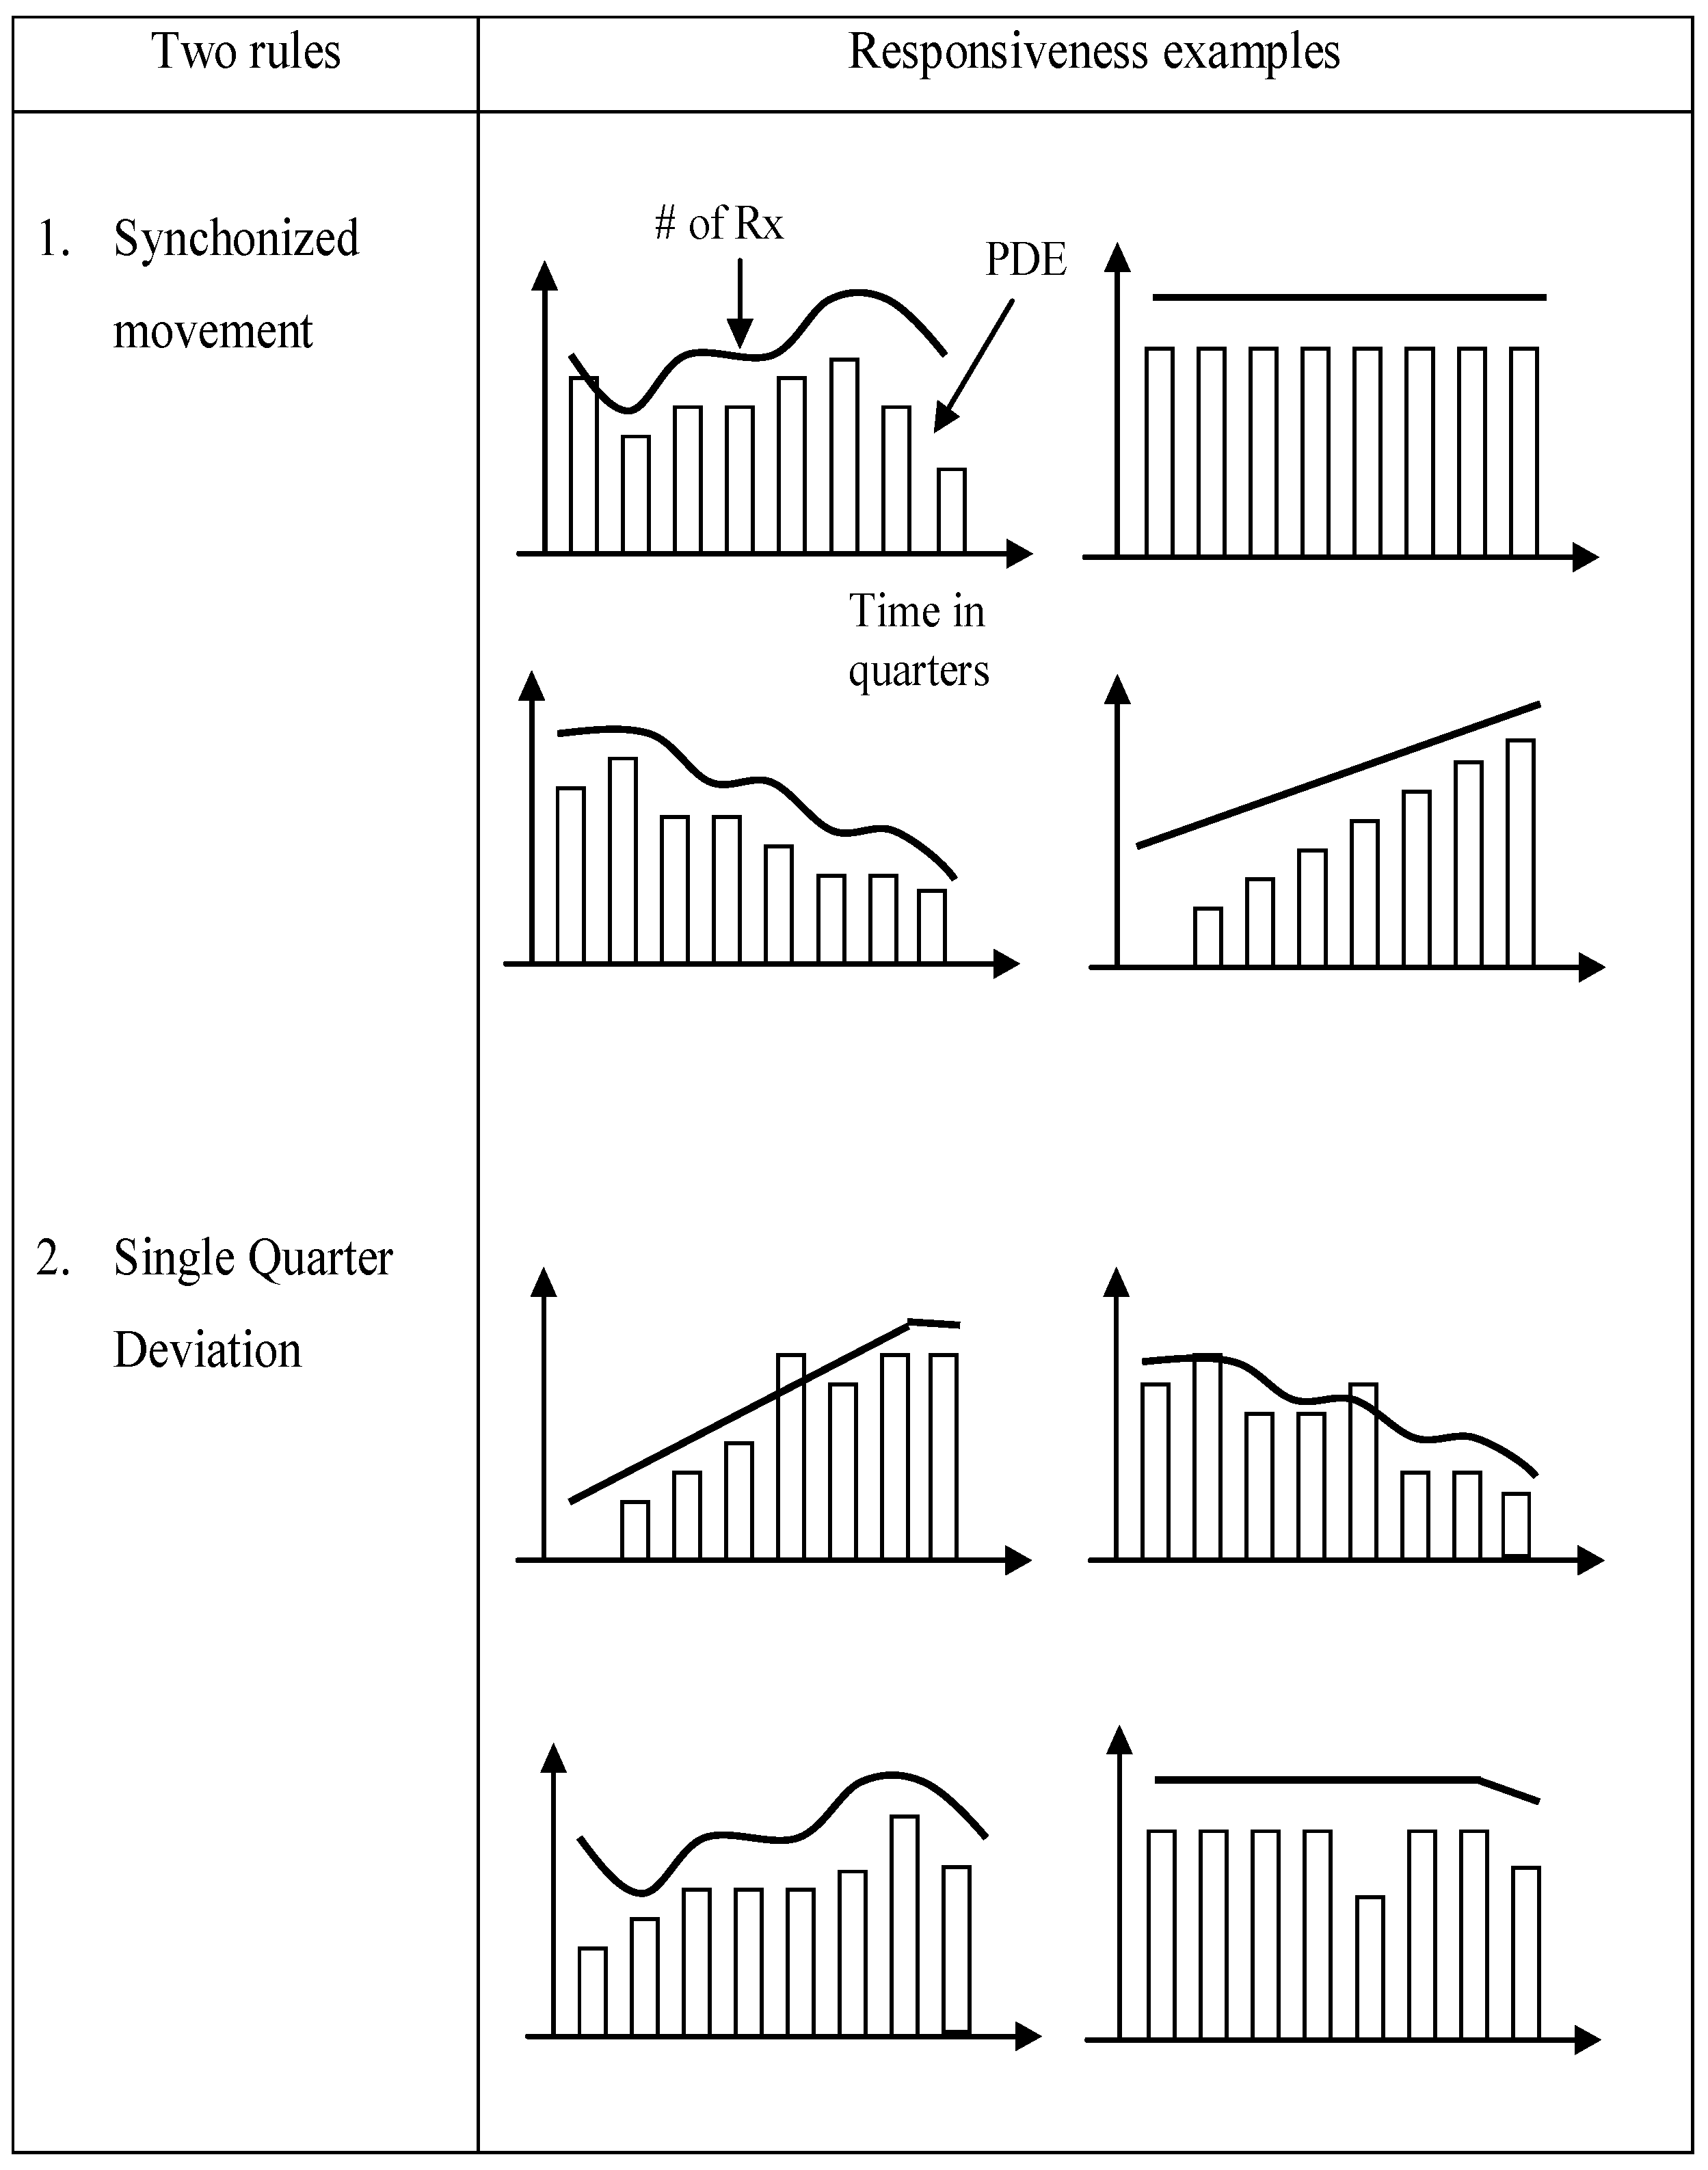
5.1. Theoretical Framework for Knowledge and Micromarketing

Knowledge is defined as the set of justified beliefs that enhance a firm’s capability to take effective action [35]. Knowledge is divided into two major areas: tacit and explicit. Tacit knowledge refers to intuitions, insights and other hunches that are not easily verbalized or communicated. This tacit knowledge plays an important role in the decision-making process, especially in decision situations without the luxury of time, because it is the primary source of problem definition and alternatives [36]. Explicit knowledge however, refers to that which can be formally collected and expressed as data, words and software; and as a result, it can readily reach consensus and quickly diffuse throughout an organization [36]. Researchers have found that converting tacit knowledge into explicit knowledge and integrating the two can significantly enhance a firm’s competitive position by improving organizational capability, competence and performance [37,38]. Moreover, knowledge integration across different functions within a firm has several areas of added values, including demonstrated improvement in decision-making quality and organizational performance [39,40,41,42].
Various studies have proven that knowledge management can be improved when visualization is integrated into the modeling process because visualization’s ability to reach consensus when working with difficulty data and can simplify complex knowledge [43]. Furthermore, integrating domain experts’ knowledge with secondary data to derive visually agreed-upon promotional response patterns has demonstrated to be an effective technique to discern responsive physicians from non-responsive physicians, leading to construction of more accurate response functions and subsequently, improving the quality of the physician detailing strategy [4]. Likewise, it has been proven that the accuracy of promotional response function parameters for individual physicians can improve by calibrating the parameters to reveal physician responsiveness as defined by the experts [13,44].
The knowledge-based analytical model used in this study is based on the assumption that optimally involving domain experts and utilizing their knowledge is significant in enhancing the quality of detailing strategy. Another key assumption is that accurate PDE weights are those that visually reveal physicians’ responsiveness by matching its pattern to the predetermined responsive patterns developed by domain experts because one cannot reveal responsiveness from physicians who are unresponsive to detail [13]. Moreover, since PDE weights are inputs to both SOV computation and detailing planning, improving the accuracy of the weights will enhance the quality of SOV calculation and detailing planning. These benefits are expected to result in the minimization of non-value-added costs, making the sales reps more effective and therefore increasing revenue.
Micromarketing is customizing marketing plans at the individualized consumer level to optimally accommodate the individual service and promotional needs to maximize the impact of sales force resources [45,46,47]. Also, similar to traditional consumers, physicians respond better to marketing messages tailored to their individual needs [44]. Consequently, we incorporated micromarketing as part of a knowledge-based approach to be more effective than the traditionally targeting physicians at a macro level approach.

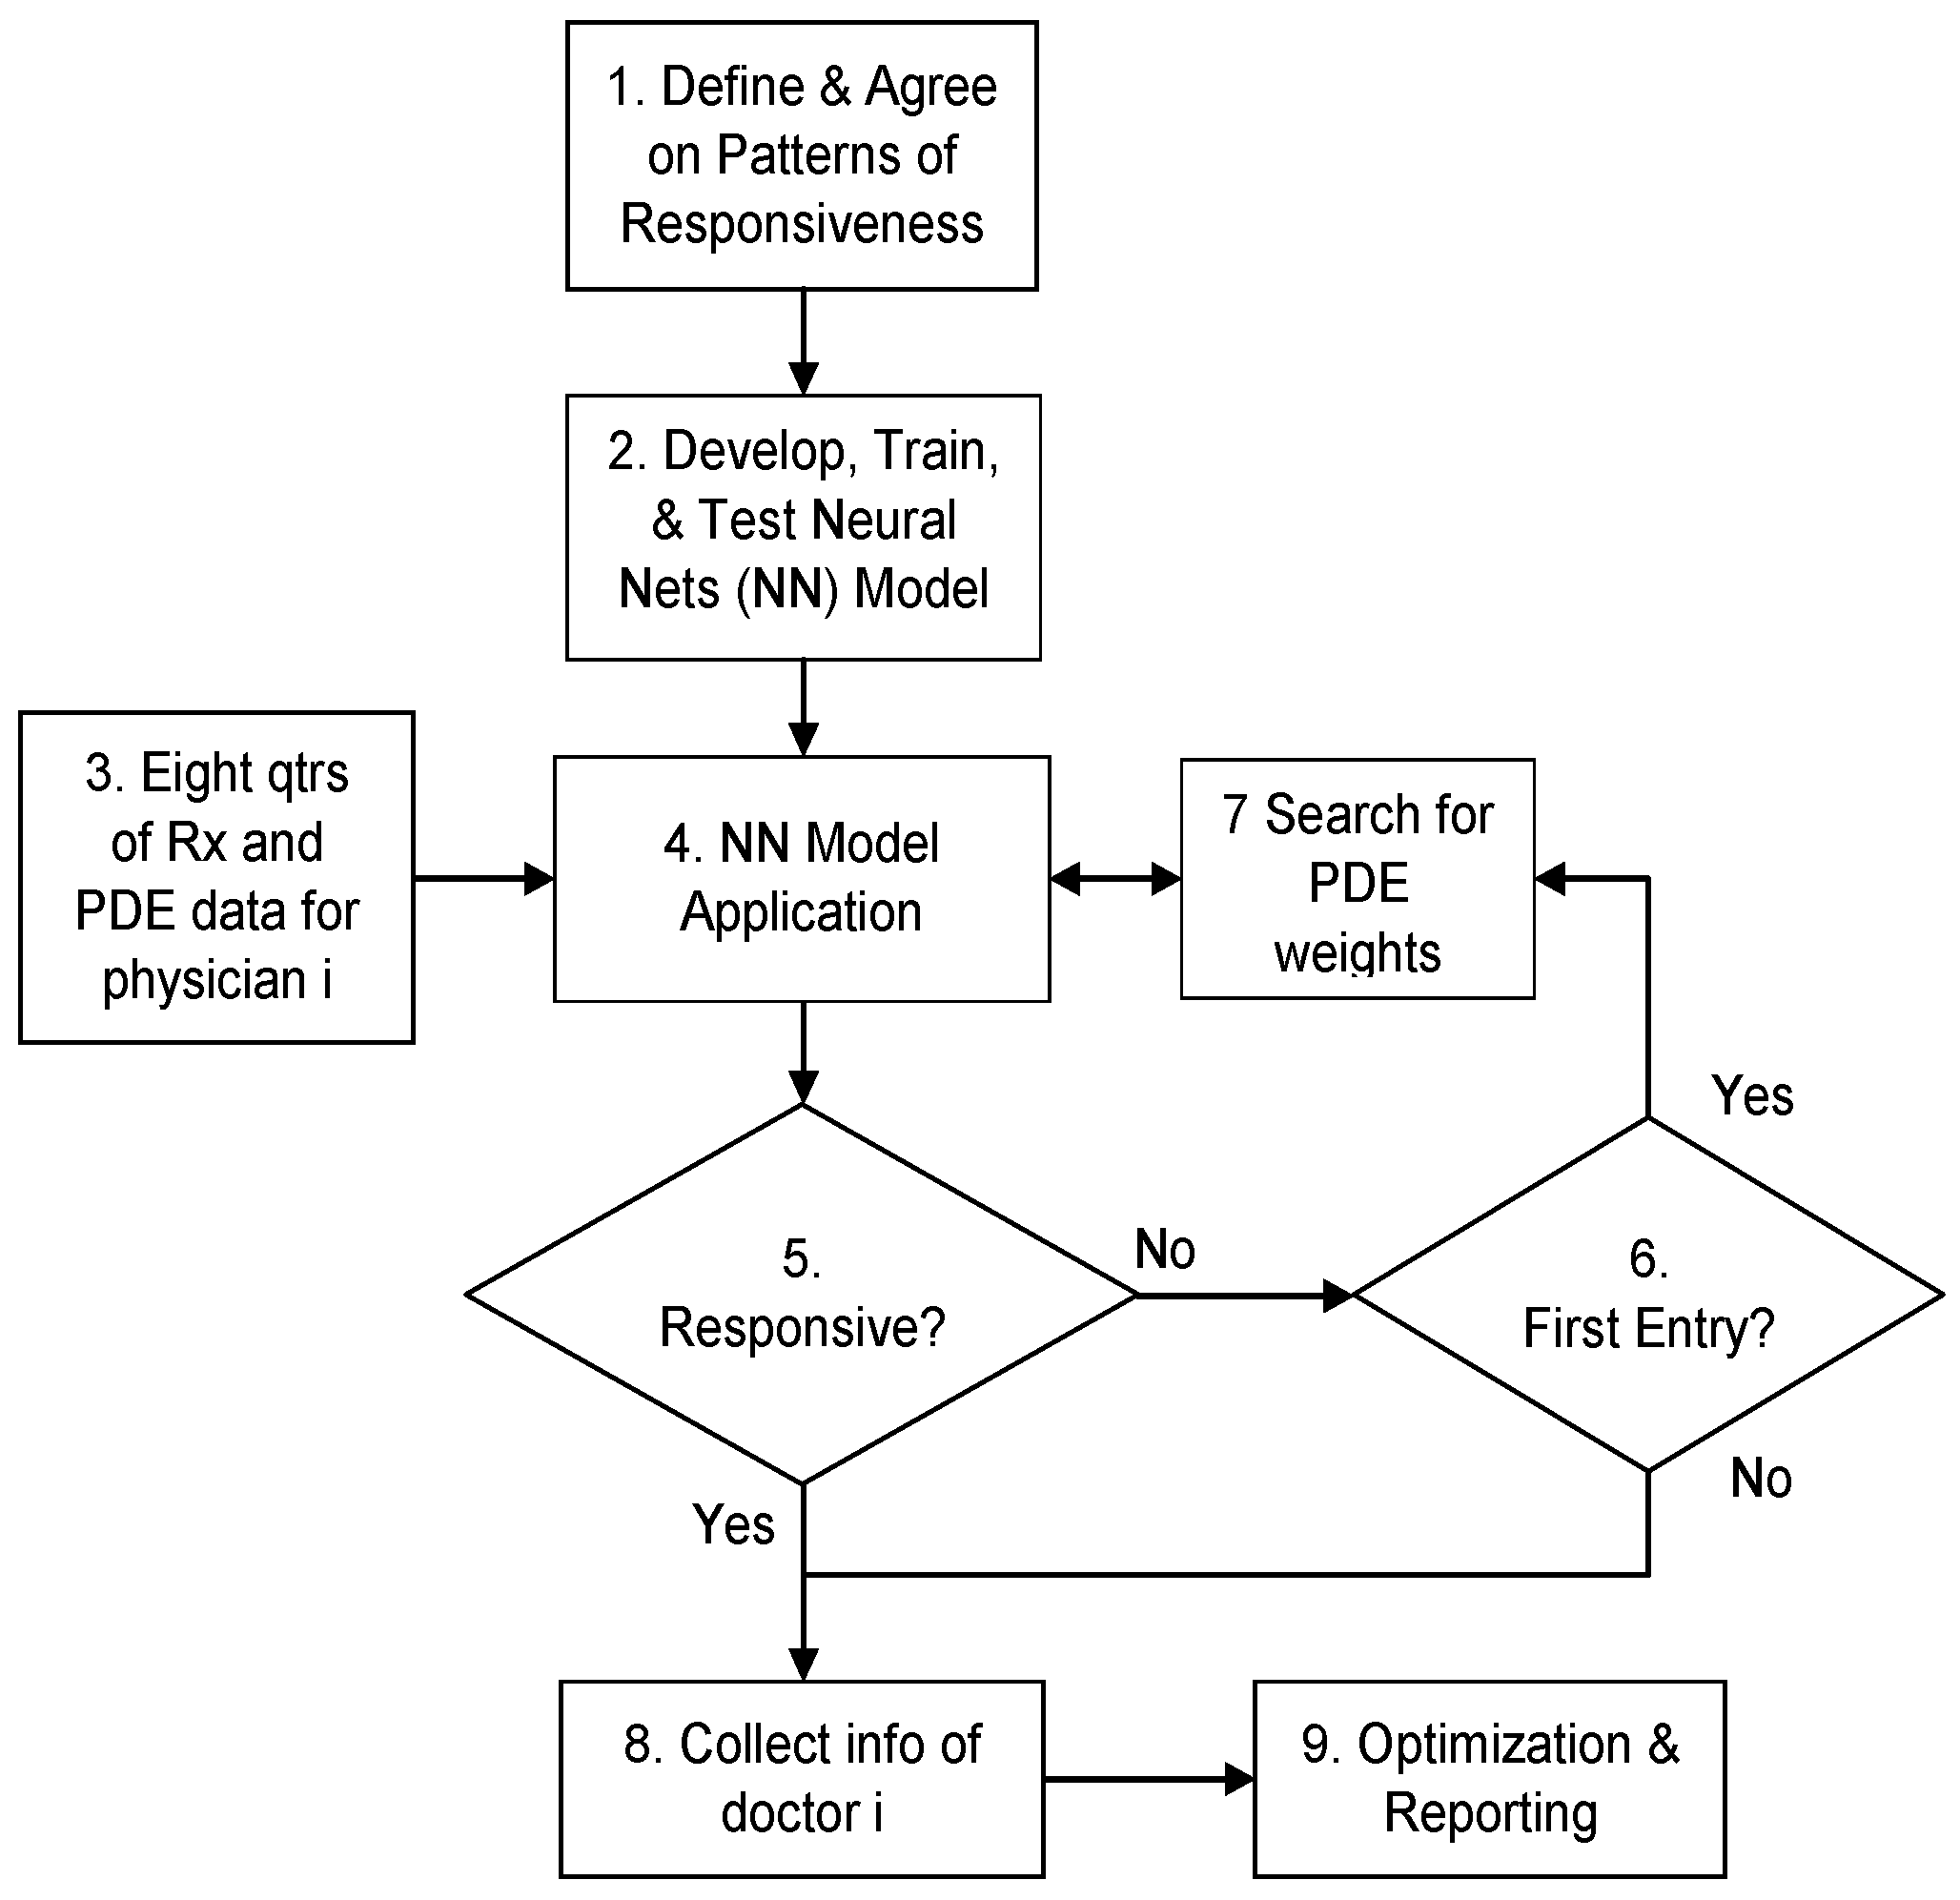
5.2. Process Flow of the Knowledge-Based Analytical Approach

The process flow of this approach used in the research is shown in Figure 1 and has provided transparency to the process, which helped the organization to buy in to this study and improve the ability to coach the key stakeholders on innovation in order to sustain the correct application of this approach.
In Step 1, the definition of responsiveness, based on the visual relationship between PDE and prescription volume over time, is constructed by working with domain experts; these experts represent Marketing, Market Research, Sales Operations, Sales, and Information Management. Each expert is at least a manager with a minimum of three years’ experience in the domain as well as familiarity with the district selected for the research. These domain experts collectively defined responsiveness based on two sets of rules and those not meeting these rules are defaulted as nonresponsive. The two rules of responsiveness, which were first introduced by Yi et al. [4], are as follows: (1) synchronized movement for all eight quarters; (2) allow for a single quarter deviation from the synchronized movement property. Figure 2 shows examples of responsiveness based on these two rules.
The nonresponsiveness examples demonstrate cases where there exists no, or an insufficient visible pattern of relationship between PDE and prescription volume over time and are shown in Figure 3. Clearly, detailing alone cannot explain these physicians’ prescribing behavior.
In Step 2, a neural network (NN) model is developed using the target physicians’ historical data to identify the responsive physicians. The reason for using an NN model in this study is that it automates manually intensive activity of classifying hundreds of physicians into two categories of responsiveness based on visual patterns between PDE and respective prescription volume for eight quarters developed in Step 1. Moreover, NN models are powerful pattern recognition tools especially strong in detecting nonlinear relationships between the inputs and the outputs [48,49]. Although NN models’ functionality is often perceived as black box, the sponsoring firm focused on performance of classification accuracy rather than the explainability of the approach [50].
Replicating the work done by Yi et al. [4], this research uses a back-propagation network with 16 input nodes: 8 quarters of PDE and 8 quarters of the respective prescription volume (TRx); 1 hidden layer containing 7 neurons; and 1 binary output node (1 for responsive and 0 for nonresponsive physicians). The model was developed with 450 training samples with a known output. The NN model outperformed the logistic regression model with a predicted accuracy advantage of 81% vs. 53%. The methodology was used to compare and validate the NN model’s predictive performance is shown in Equation (3).
P r e d i c t e d   a c c u r a c y % = [ 1 i = 1 n A b s ( A c t i P r e d i ) n ] × 100 %
where Acti is the actual responsiveness of physician i; Predi is the predicted responsiveness for physician i; Abs is the absolute value function; and n is the sample size.
In Step 3, the eight quarters of PDE and respective TRx data for physicians are prepared for Step 4, the application of NN model. In Step 5, physicians’ responsiveness is identified, with nonresponsive physicians’ data directed to Step 6 and responsive physicians’ data to Step 8.
All nonresponsive physicians entering Step 6 for the first time go through to Step 7, where the NN model interface with a nonlinear mathematical model to search for a set of PDE weights that reveal physicians’ responsiveness to detailing efforts; the nonlinear program is shown below:
Maximize NN ( R x j k , P D E j k )    for  k = 1 , ... , 8
s . t . P D E j k = i = 1 3 ( W i j × D i j k )    for  k = 1 , ... , 8
W i j 1    for  i
W i j W i + 1 , j    for  i = 1 , 2
all variables  0
where NN(Rxjk, PDEjk) are trained neural network function, returning 1 if physician j is responsive and 0 if physician j is nonresponsive to details, based on the relationship between Rx written and PDE over eight quarters; PDEjk is the physician detail equivalent for physician j in quarter k; Rxjk is the total number of prescriptions written by physician j in quarter k; Wij is the detailing weight for the ith sequence for physician j; Dijk is the total number of details made from the ith sequence to physician j in quarter k.
The objective function given by (4), maximizes the number of responsive physicians in the first summation while maximizing the summation of the weights in the second summation. The first summation interfaces with the trained NN model by providing to the model, the physician-level prescription data and the PDE data for all eight quarters, given by Rxjk and PDEjk respectively, to determine the responsiveness of the targeted physicians.
The first constraint, given by (5), defines PDE for each physician in each quarter. The set of PDE weights, for the ith position to physician j, Wij, is initialized to 1, 0.6 and 0.3 for detailing positions 1, 2 and 3+, respectively. Constraint (6) sets the upper limit for the weight to be one. Constraint (7) forces the weights of the preceding detailing positions to be bigger than the ensuing ones in order to reflect the inverse relationship between the detailing time and the order in which a product is detailed, as well as to limit the searching space for the nonlinear mathematical program. The last constraint given by (8), defines the non-negativity constraint for all variables. Figure 4 illustrates how this step works by having a physician visually fitting to the nonresponsive definition with the traditional set of PDE weights but the optimization algorithm has found a new set of PDE weights to make the physician fit the definition of responsiveness; and this new set of weights replaces the traditional weights for this physician, with the physician classified as responsive.
In Step 8, information on each physician’s responsiveness and the set of respective PDE weights for each is collected and stored. For the nonresponsive physicians, PDE is determined by taking the average PDE weights from the responsive physicians for each detailing sequence.
Physician responsiveness and PDE weights are merged with physician data and the company’s resource data to formulate a nonlinear programming model in Step 9. The objective of this model is to determine the optimal plan for detailing the firm’s target physicians to maximize quarterly profit. This formulation is shown here:
Maximize  i [ PRF i ( P D E i )   ×  Price - Cost i ( P D E i / E ) ] +   d = 1 10 [ TP d × PRF d ( P D E d ) ×  Price - Cost d ( P D E d / E ) ] ,   i I
s . t . P D E i = j = 1 3 W i j × D i j ,  for all  i
W j ¯ = i = 1 n j W i j / n j ,  for  j = 1 , 2 , 3
P D E d = j = 1 3 W j ¯ × T D i d ,  for all  d
[ j i = 1 n j ( W i j × D i j ) + j d = 1 10 ( W j ¯ × T D i d ) ] R j , j = 1 , 2 , 3
all variables  0
where PRFi(x) is the promotional response function for physician or decile i, and returns expected prescription volume for x detail in a quarter; PDEi is the physician detail equivalent for responsive physician or decile i; Rj is the total quarterly resource for the jth position details; Wij is the detailing weight for responsive physician i for detailing position j; Dij is the total details that need to be made in position i to responsive physician j; TDid is total details that need to be made in position i to nonresponsive physician in decile d; TPd is the total physicians in decile d; Price is the price of a single prescription of the drug; Costi is the cost to detailing physician i; E is the efficiency factor to account for empty efforts directed to the physicians’ offices; and nj is the number of responsive physicians for detailing sequence j.
The objective function, given by (9) maximizes the quarterly profit from the sales force efforts. The first summation in the function computes the optimal detailing plan to generate maximum profit from the physicians who are responsive to the sales force’s detailing efforts: the promotional response function of PDEi details to physician i, given by PRFi(PDEi), produces the number of prescriptions written by physician i; this is then multiplied by the price per prescription, Price, to arrive at revenue; the cost to detailing physician i is given by Cost(PDEi/E), where E, which denotes efficiency factor and is less than one and it accounts for the empty efforts made by the sales reps; taking the difference between the revenue and cost per physician i and summing up the profit for all the responsive physicians yields the total profit generated by this group.
The second summation in the function computes the profit from the nonresponsive physicians and since there is no visually discernable response pattern, the promotional response function to detailing effort PDEd, given by PRFd(PDEd), is derived at decile level d based on average PDE weights from the responsive physicians. This function produces the average number of prescriptions written by an average physician from decile d; multiplying the number of prescriptions by price and subtracting the cost associated with the detailing effort, again including E, gives the profit per physician from decile d; and summing for all the deciles gives the total profit generated from this group.
Constraint (10) defines PDE for physician i, based on the PDE weights found specifically for responsive physician i in detailing position j derived earlier, in Step 7. The set of weights provides the visually recognizable pattern of responsiveness for physician i, which enables the program to locate the optimal set of details for that physician.
The average PDE weights for responsive physicians defined for each detailing position is in constraint (11). Constraint (12) defines PDE for the nonresponsive physicians per decile d. Constraint (13) sets the upper limit Rj on the total quarterly detailing resources for the drug for each sequence j, while the non-negativity condition is set by constraint (14). This approach was first implemented in 2005 and was still in use when we were conducting this research.

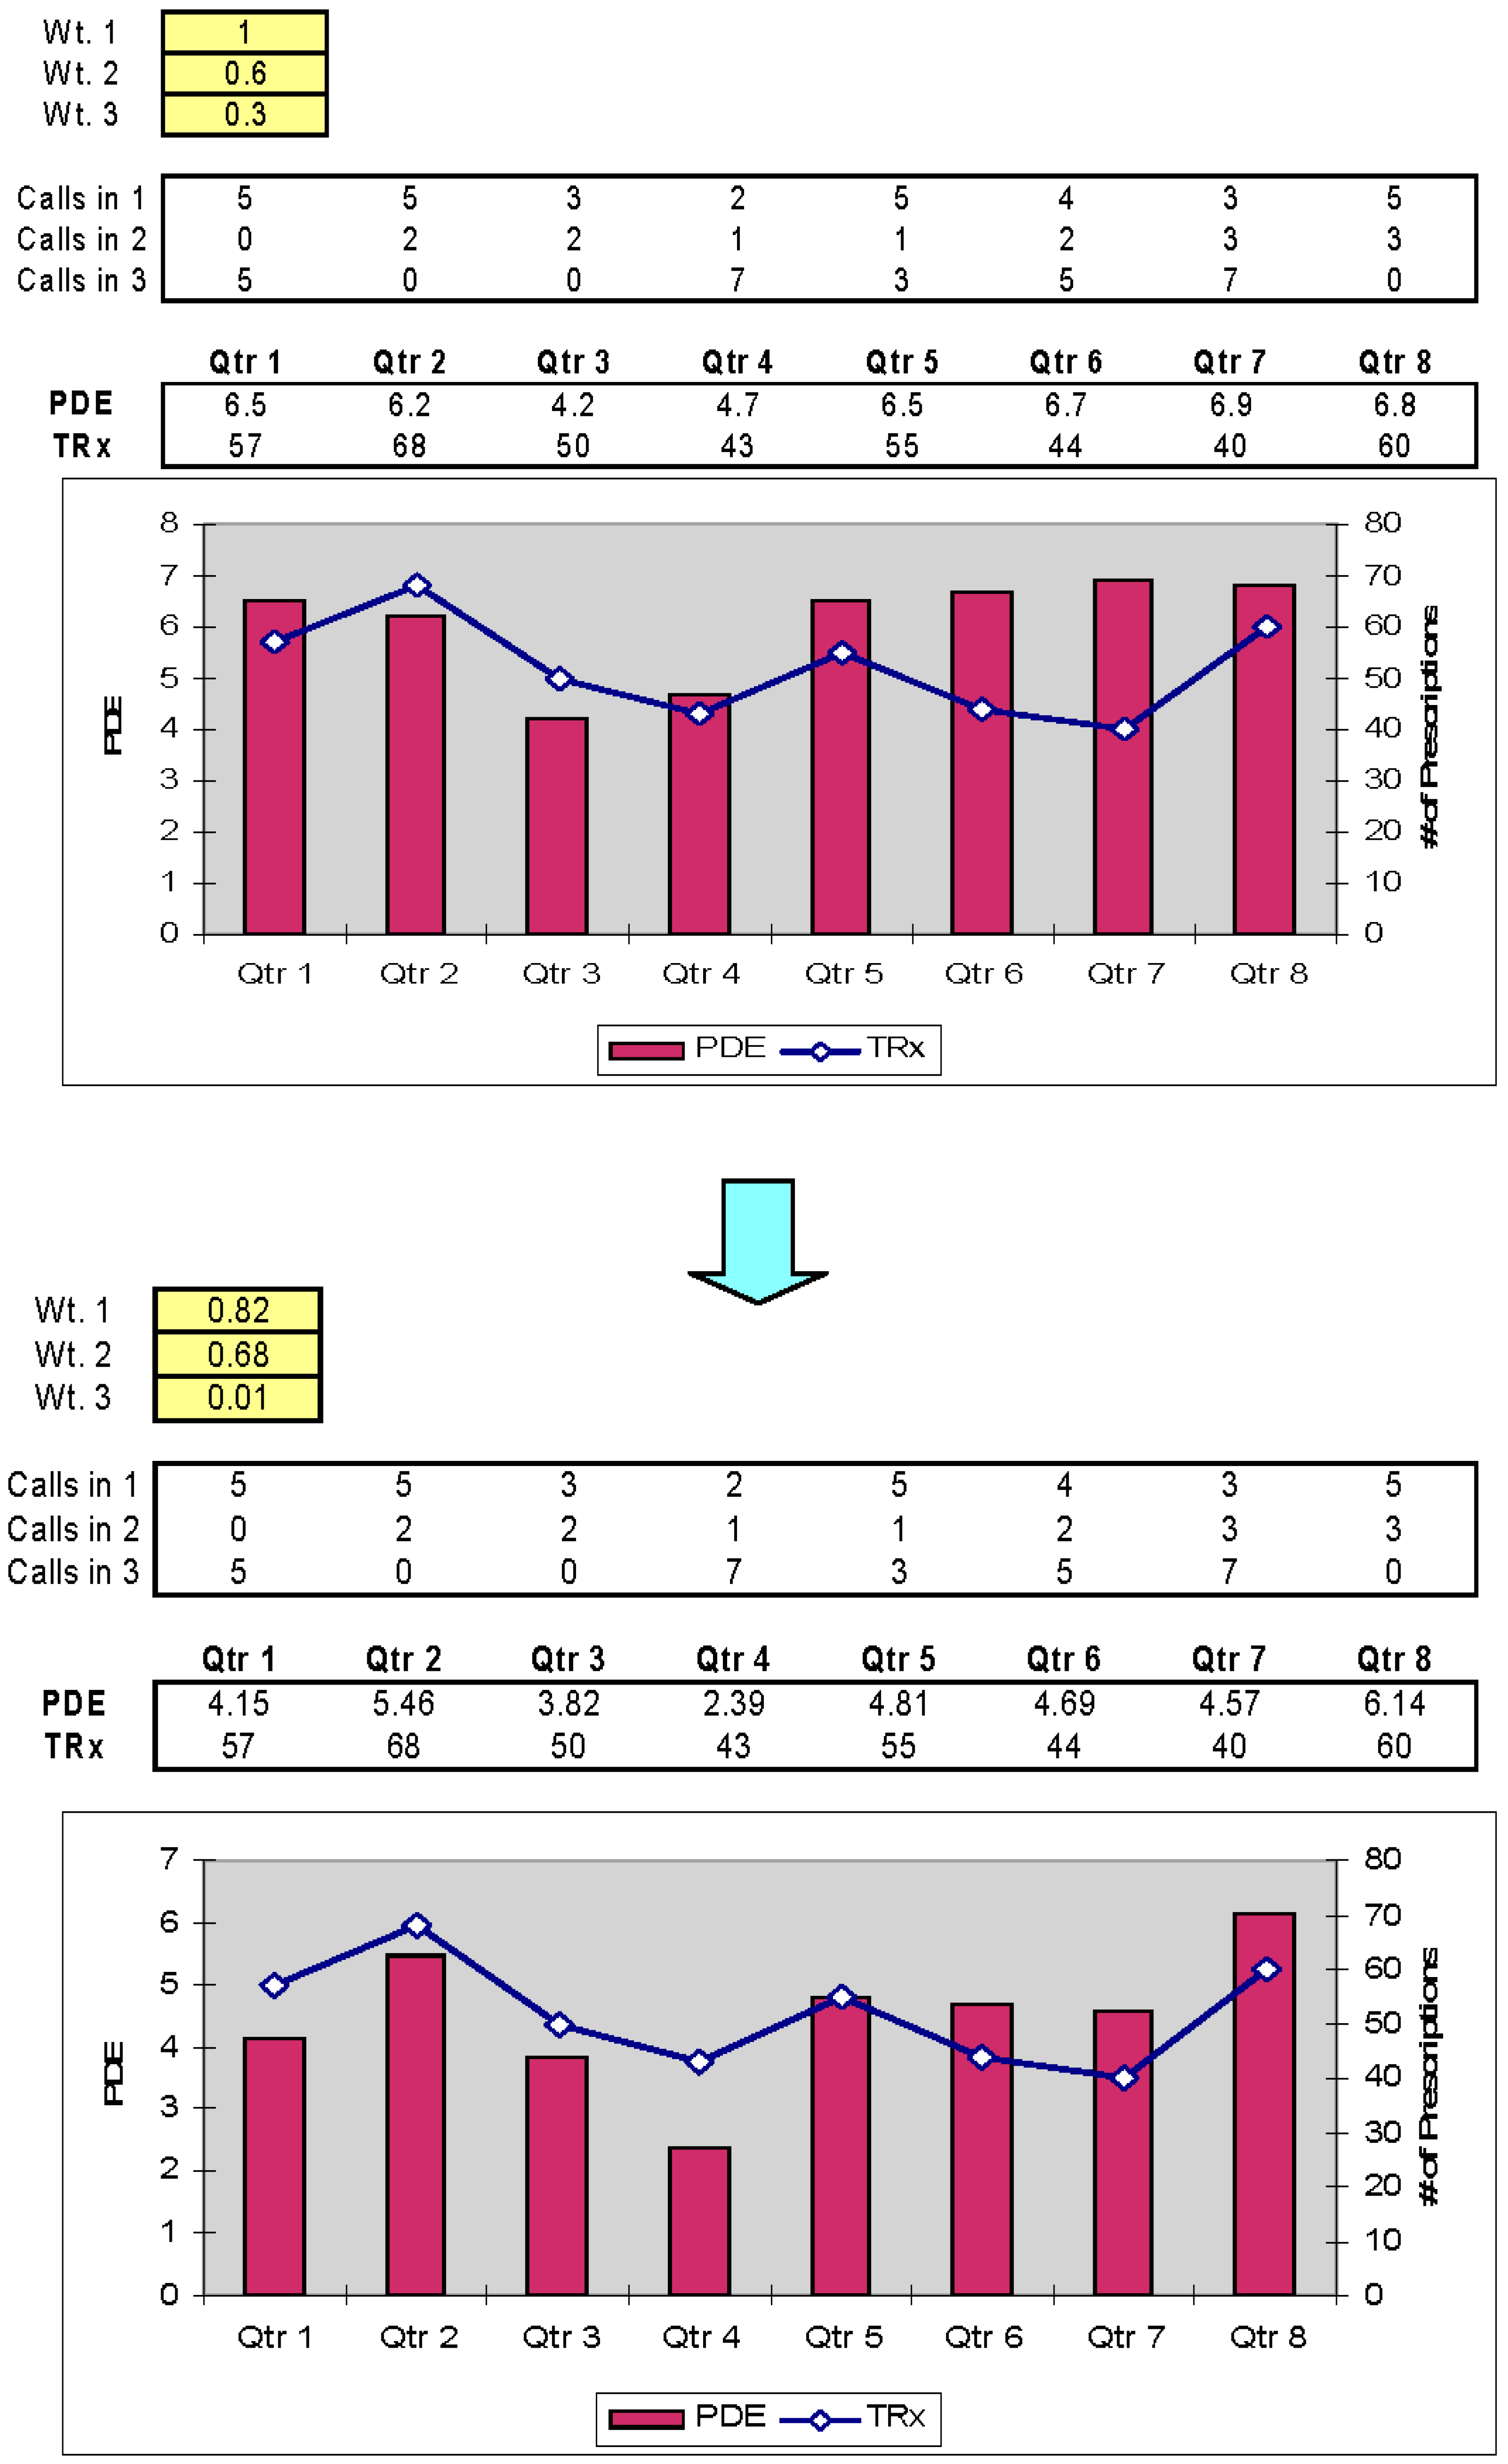
6. Application and Results

To quantify the effectiveness of the knowledge-based approach, the sponsoring firm allowed us to implement the result of the approach to the district where the research data were collected; this randomly selected district, located in the Northeast region with 481 target physicians, is called the test group. The implementation started from 3rd quarter 2005 and was still used in early 2015, when we collected the latest data for this research. The result from the last two quarters of 2005 were used to measure the performance of the test group and compare it against a control group during the same time period and the result from the last two quarters of 2014 were used as a comparison to the result from a decade earlier. The control group selected in 2005 is also from the Northeast region with similar attributes; both prior sales performance and the number of target physicians for the control group came within ±5% of the test group. In 2014, there was no control group because this approach has been nationally launched.
The detailing plan using the traditional PDE weights of 1, 0.6 and 0.3 computed the SOV in 2005 to 14% and 10% in 2014; these values are by design and are consistent to the values sought by management for the drug in those years. In addition, 143 physicians, or 30% of the total physicians in the district, were found responsive in 2005 using the traditional PDE weights based on the responsiveness definition.
In 2005, the knowledge-based analytical approach found that the PDE weight, when only a single drug is detailed is indeed one but when there were two detailing drugs, the PDE weights were calculated to 0.82 and 0.68, respectively for the first and second detailing positions. When a drug is detailed in all three positions, the weights of the first, second and subsequent positions are computed to 0.70, 0.41 and 0.02, respectively. Table 2 summarizes the average PDE weights in relation to the size of detailing products and the detailing sequence from 2005.
In 2014, 67 of the physicians from 2005 were no longer working in the district and of the remaining 414 physicians, 118, which is roughly 29%, were found to be responsive to the firm’s detailing efforts based on the traditional PDE weights. Moreover, of the 89 new physicians who came in to the district after our initial study in 2005, 58 physicians were identified as being responsive to details, making the total number of responsive physicians 176, which is 35% of the total physicians of 503 in the district.
The PDE weights derived in 2014 however, showed that the difference between the first two detailing sequences were more drastic, with the first sequence carrying an average weight of 0.87 while the second sequence carried only 0.43 weight. When a drug was detailed in all three sequences, the weight of the first position was higher with 0.78 compared to 2005’s result of 0.70 but the latter two sequences were drastically lower in 0.32 and 0, respectively. Table 3 reviews the average PDE weights in relation to the number of detailing drugs and the detailing sequence from 2014.
In 2005, the analytically derived PDE weights for individual physicians identified 226 responsive physicians as opposed to 143 responsive physicians based on the traditional PDE weights. This is 47% of the total physicians in the district in 2005, approximately 58% increase in the number of responsive physicians.
When the derived PDE weights are applied to the traditional detailing plan, it resulted in an SOV of only 9%, which is far less than the management’s target of 14% in SOV. It is due to this discrepancy in perceived SOV and actual SOV that the sponsoring firm had been operating less than optimally in allocating resources and against the competition and as a result has had difficulty making its forecast for the last eight quarters.
The optimization of sales resources based on the derived PDE weights recommends a different sequencing of the product, with strong focus on detailing primarily on first and second sequences to maximize profit while eliminating the need to detail in the subsequent sequences. The detailing plan based on the new approach results in an SOV of 16% with the same amount of sales force resource.
The knowledge-based approach recommends 9% increase in PDEs for the responsive physicians and 7% decrease in PDEs for the nonresponsive physicians to maximize profit. After two quarters of implementation of this approach in 2005, the test group showed a significant increase in profitability by more than 12% growth compared to the control group. Also, sales reps from the test groups had 47% more time with physicians per detailing visit, which provides a strong evidence of increased quality of detailing as well as correctly identifying physicians who are interested in receiving drug information and relevant services from the reps. These findings are summarized in Table 4.
The results from the 3rd and 4th quarter of 2014 show that more than 90% of the responsive physicians identified in 2005 stayed responsive to the firm’s detailing efforts; the profitability from these physicians is 23% more than the average physician from the same district. The percentage of the responsive physicians in the district declined from 47% in 2005 to 35% in 2014, with 176 out of 501 physicians found to be responsive based on the derived PDE weights. The SOV in the district was maintained at 10%, which is consistent with the level set by the management. Moreover, the detailing duration compared to the result from 2005 shows a decrease of 9%. The 2014 results do not have a control group for comparison because the knowledge-based analytical approach was implemented at the national level after 2005’s successful findings. As a consequence, the comparisons are made against the results from 2005 as well as applying the traditional assumptions to the 2014 data set and these are summarized in Table 5.
The impact of analytics application to this organization was striking. Not surprisingly, the organization showed a strong initial benchmark in the following two dimensions: Management & Governance and Team Expertise in analytics. As a result, sustain growth in analytics was possible, consequently becoming an analytically-driven organization where all projects requiring data analysis are supported by everyone and the results are widely accepted.
We found that the dimensions improving the most are Continuous Process Improvement and Technology Utilization. In Continuous Process Improvement, from a scale value of two in 2005 to a scale value of four in 2014, the users of analytics had a real-time feedback loop via phone or email to consult with analytics professionals on discrepancies found. In fact, the 2005 sales reps who had stayed at this firm when we returned in 2014 for this study and who were then at least district managers in 2014 stated that the level of trust between the field and the corporate office through the continuous process improvement efforts have improved significantly, pointing specifically to improvements in physician targeting as well as quick updates when feedback comes from the field, and the number of reps consistently detailing according to the Call Plan in 2014, increasing by 40% when compared to 2005.
The Technology Utilization dimension also improved from the scale value of two in 2005 to the scale value of four in 2014. The improvement came from the analytics professionals’ growth in analytical competence and their ability to use the analytical technologies more rigorously than that demanded in a master’s program. They were able to develop analytical models with ease and to interpret the findings correctly. However, their modeling skills were not yet at the level where nonlinear relationships were modeled effectively.
All the remaining dimensions in Data Utilization, Team Expertise and Management & Governance, also improved from 2005 to 2014; Figure 5 illustrates the improvements from 2005 to 2014.
Additionally in 2014, more than 90% of the sales reps in the districts indicated the importance of data and analysis in doing their work more successfully, a 50% improvement the sales reps responses in the district in 2005. Also, in 2014, more than 65% of the reps understood the process of sales operations planning as well as the foundational analytics used in the process, whereas no reps understood the process and the foundational analytics used for creating the call plan in 2005. Finally, more than 80% of the reps in the district stated that they regularly provided feedback to the headquarters sales analytics team for continual improvement of the sales operations process, whereas in 2005, fewer than 20% had any communication.
From the interviews, all the domain experts agreed that transparency in the development of the knowledge-based analytical approach expedited the analytics maturation process when all the experts had to provide the support and the implementation of the approach, where performance was carefully monitored. They also agreed on strong management commitment from the beginning, making it easy to sustain the efforts. Finally, the domain experts emphasized the important role of the analytics team in coaching the users of analytics, with monthly lunch-and-learn initiatives and one-on-one training appointments, in order to educate colleagues on analytics and the interpretation of results.

7. Conclusions

The knowledge-based analytical approach presented in this paper provides striking evidence of how effective the approach is and further demonstrates that the first detailing sequence does not carry the full weight of one when multiple drugs are detailed. In fact, as the number of drugs in the detailing portfolio increases, each detailing sequence carries even less weight, possibly due to the cannibalization of information and time between the drugs. Moreover, drugs detailed in the third position or later, added no benefit to sales in 2014, whereas in 2005, the third position carried a modest weight of 0.02. This result reinforces a call plan strategy of detailing two products or fewer to be effective.
This study also provides strong evidence of effectiveness of micromarketing strategy in the pharmaceutical industry, where physician-level data is collected robustly and is widely available. Moreover, this study shows that a micromarketing strategy strengthens customer relationships by increasing understanding of their needs and this is evidenced by more than 90% of the responsive physicians’ identified in 2005 staying responsive in 2014. In fact, the profitability from these responsive physicians is 23% more than the average physician from the district.
In 2014 however, the total percentage of responsive physicians declined to 35% from 47% in 2005. Also, the detailing duration was reduced by 9%. These findings signal declining detailing effectiveness over the years, even with the best of efforts from the industry and the need to study the combined impact of both personal and non-personal promotional activities.
Finally, the findings demonstrate the importance of management’s commitment to analytics, and the coaching role the analytics team took on to sustain its growth, leading to an analytically mature organization. Moreover, the firm matured in analytics from (1) building trust with internal partners through the effectiveness of the feedback loop from monitoring its performance; (2) witnessing quick action to the field’s requests; and (3) success of the approach leading to enhanced profitability. All the assessed dimensions in Data Utilization, Technology Utilization, Continuous Process Improvement, Team Expertise, and Management & Governance have shown improvement, and management and participant interviews further attest to the significance of investing in analytics driven by the upper management. Consequently, the benefit of analytics can be fully realized while enhancing the firm’s ability to compete on analytics.
Some limitations of this research include the determination of responsive and nonresponsive behaviors based on consensus of domain experts’ from the sponsoring firm; and the responsiveness is measured entirely based on the relationship between physician details and the respective prescribing patterns, while ignoring the other promotional data due to the data-integrity concerns, leaving some prescribing behaviors unexplained. Also, the data available to us was limited to a district in a Northeast region of the United States and even though significant success followed when this approach was launched nationally, we do not have the hard data to fully understand geographical differences, which is important in national initiatives.
For future research, application of the open innovation where firms fully utilize their own innovations across different parts of the world in which the firms have presence [51], as well as external knowledge and other innovations to improve results [52,53], can be considered. Moreover, national data rather than district data can provide more insights about the sales operations landscape, improve overall confidence in this approach and ultimately study results.

Author Contributions

John Yi contributed to acquisition of data, design of research, conducting of analysis, and drafting of the paper; Sungho Kim assisted in the literature review, conducting of analysis, and provision of subject matter expertise during the completion of the paper.

Conflicts of Interest

The authors declare no conflict of interest.

References

  1. Payer Pressures, Market Access Weigh upon Life Sciences Strategy: KPMG Survey. Available online: http://www.prnewswire.com/news-releases/payer-pressures-market-access-weigh-upon-life-sciences-strategy-kpmg-survey-300122575.html (acessed on 6 May 2016).
  2. Gagnon, M.-A.; Lexchin, J. The cost of pushing pills: A new estimate of pharmaceutical promotion expenditures in the United States. PLoS Med. 2008. [Google Scholar] [CrossRef] [PubMed]
  3. IMS Health Forecasts Global Drug Spending to Increase 30 Percent by 2020, to $1.4 Trillion, as Medicine Use Gap Narrows. Available online: http://www.imshealth.com/en/about-us/news/ims-health-forecasts-global-drug-spending-to-increase-30-percent-by-2020 (acessed on 7 May 2016).
  4. Yi, J.; Anandalingam, G.; Sorrell, L. An expert system to physician-detailing planning. Expert Syst. Appl. 2003, 25, 533–544. [Google Scholar] [CrossRef]
  5. Claus, B.L.; Underwood, D.J. Discovery informatics: Its evolving role in drug discovery. Drug Discov. Today 2002, 7, 957–966. [Google Scholar] [CrossRef]
  6. Rivard-Royer, H.; Landry, S.; Beaulieu, M. Hybrid stockless: A case study: Lessons for health-care supply chain integration. Int. J. Oper. Prod. Manag. 2002, 22, 412–424. [Google Scholar] [CrossRef]
  7. McKone-Sweet, K.E.; Hamilton, P.; Willis, S.B. The ailing healthcare supply chain: A prescription for change. J. Supply Chain Manag. 2005, 41, 4–17. [Google Scholar] [CrossRef]
  8. Goodman, R.M.; Steckler, A. A model for the institutionalization of health promotion programs. Fam. Community Health 1989, 11, 63–78. [Google Scholar] [CrossRef]
  9. Rogers, E.M. Diffusion of Innovations; Simon and Schuster: New York, NY, USA, 2010. [Google Scholar]
  10. Edgeman, R.; Williams, J.A. Enterprise self-assessment analytics for sustainability, resilience and robustness. TQM J. 2014, 26, 368–381. [Google Scholar]
  11. Yusr, M.M. Innovation capability and its role in enhancing the relationship between TQM practices and innovation performance. J. Open Innov. Technol. Mark. Complex. 2016. [Google Scholar] [CrossRef]
  12. Rosha, A.; Lace, N. The scope of coaching in the context of organizational change. J. Open Innov. Technol. Mark. Complex. 2016. [Google Scholar] [CrossRef]
  13. Yi, J. Knowledge-based approach to improving detailing plan in multiple product situations using PDE weights. Expert Syst. Appl. 2011, 38, 3835–3843. [Google Scholar] [CrossRef]
  14. Nelson, P. Advertising as information. J. Political Econ. 1974, 82, 729. [Google Scholar] [CrossRef]
  15. Schweitzer, S.O. Pharmaceutical Economics and Policy; Oxford University Press: Oxford, UK, 2006. [Google Scholar]
  16. Robinson, J.C. The end of managed care. JAMA 2001, 285, 2622–2628. [Google Scholar] [CrossRef] [PubMed]
  17. Tenaglia, M. Out of control: the ever increasing price of preferred formulary access. Pharm. Executive 2011, 31, 70–75. [Google Scholar]
  18. Influence of Managed Care Organizations Increasing within Pharmaceutical Industry. Available online: http://www.prnewswire.com/news-releases/influence-of-managed-care-organizations-increasing-within-pharmaceutical-industry-240912971.html (acessed on 8 May 2016).
  19. What’s Really Next for Pharma? Available online: http://www.mmm-online.com/features/cannes-roundtable-whats-really-next-for-pharma/article/428481 (accessed on 9 May 2016).
  20. Malik, N. Key issues in the pharmaceutical industry: Consequences on R&D. Expert Opin. Drug Disc. 2009, 4, 15–19. [Google Scholar]
  21. Davidson, T.; Sivadas, E. Details drive success. Physicians are responding to electronics sales calls. Mark. Health Serv. 2004, 24, 20–25. [Google Scholar] [PubMed]
  22. Gönül, F.F.; Carter, F.J. Impact of e-detailing on the number of new prescriptions. Health Care Manag. Sci. 2010, 13, 101–111. [Google Scholar] [CrossRef] [PubMed]
  23. Barnerjee, S.; Dash, S.K. Effectiveness of e-detailing as an innovative pharmaceutical marketing tool in emerging economies: Views of health care professionals of India. J. Med. Mark. 2011, 11, 204–214. [Google Scholar] [CrossRef]
  24. Della Corte, V.; Iavazzi, A.; D’Andrea, C. Customer involvement through social media: The cases of some telecommunication firms. J. Open Innov. Technol. Mark. Complex. 2015, 1, 1–10. [Google Scholar] [CrossRef]
  25. Yi, J. An expert system to derive carryover effect for pharmaceutical sales detailing optimization. Expert Syst. Appl. 2008, 34, 1742–1753. [Google Scholar] [CrossRef]
  26. Jones, J.P. Ad spending: maintaining market share. Harv. Bus. Rev. 1990, 68, 38–42. [Google Scholar] [PubMed]
  27. Gonul, F.F.; Carter, F.; Petrova, E.; Srinivasan, K. Promotion of prescription drugs and its impact on physicians’ choice behavior. J. Mark. 2001, 65, 79–90. [Google Scholar] [CrossRef]
  28. Pesse, M.; Erat, P.; Erat, A. The network is the customer: Setting the stage for fundamental change in pharmaceutical sales and marketing. J. Med. Mark. 2006, 6, 165–171. [Google Scholar] [CrossRef]
  29. Competing on Analytics. Available online: https://hbr.org/2006/01/competing-on-analytics (acessed on 10 May 2016).
  30. Shediac-Rizkallah, M.C.; Bone, L.R. Planning for the sustainability of community-based health programs: Conceptual frameworks and future directions for research, practice and policy. Health Educ. Res. 1998, 13, 87–108. [Google Scholar] [CrossRef] [PubMed]
  31. Scheirer, M.A. The life cycle of an innovation: Adoption versus discontinuation of the fluoride mouth rinse program in schools. J. Health Soc. Behav. 1990, 31, 203–215. [Google Scholar] [CrossRef] [PubMed]
  32. Evashwick, C.; Ory, M. Organizational characteristics of successful innovative health care programs sustained over time. Fam. Community Health 2003, 26, 177–193. [Google Scholar] [CrossRef] [PubMed]
  33. Blattberg, R.C.; Hoch, S.J. Database Models and Managerial Intuition: 50% Model + 50% Manager. Manag. Sci. 1990, 36, 887–899. [Google Scholar] [CrossRef]
  34. Huang, C.-C.; Fan, Y.-N.; Chern, C.-C.; Yen, P.-H. Measurement of analytical knowledge-based corporate memory and its application. Decis. Support Syst. 2013, 54, 846–857. [Google Scholar] [CrossRef]
  35. Nonaka, I. A dynamic theory of organizational knowledge creation. Organ. Sci. 1994, 5, 14–37. [Google Scholar] [CrossRef]
  36. Davenport, T.; Prusak, L. Working Knowledge: How Organizations Manage What They Know, 2nd ed.; Harvard Business School Press: Boston, MA, USA, 1998. [Google Scholar]
  37. Brown, J.; Duguid, P. Organizing knowledge. Calif. Manag. Rev. 1998, 40, 90–111. [Google Scholar] [CrossRef]
  38. Paladino, A.E. The Power of Unstructured Data: A Study of the Impact of Tacit Knowledge on Business Performance. Ph.D. Thesis, Capella University, Ann Arbor, MI, USA, 2012. [Google Scholar]
  39. Cai, J. Knowledge Management within collaboration processes: A perspective modeling and analyzing methodology. J. Database Manag. 2006, 17, 33–48. [Google Scholar] [CrossRef]
  40. Liebowitz, J. ‘Think of others’ in knowledge management: Making culture work for you. Knowl. Manag. Res. Pract. 2008, 6, 47–51. [Google Scholar] [CrossRef]
  41. Pancholi, S.; Yigitcanlar, T.; Guaralda, M. Public space design of knowledge and innovation spaces: Learnings from Kelvin Grove Urban Village, Brisbane. J. Open Innov. Technol. Mark. Complex. 2015. [Google Scholar] [CrossRef]
  42. Carrillo, F.J. Knowledge-based development as a new economic culture. J. Open Innov. Technol. Mark. Complex. 2015. [Google Scholar] [CrossRef]
  43. Coffey, J.W.; Hoffman, R.; Cañas, A. Concept map-based knowledge modeling: Perspectives from information and knowledge visualization. Inform. Visual. 2006, 5, 192–201. [Google Scholar] [CrossRef]
  44. Yi, J. Knowledge-based approach to improving micromarketing decisions in a data-challenged environment. Expert Syst. Appl. 2008, 35, 1379–1385. [Google Scholar] [CrossRef]
  45. Leeflang, P.; Wittink, D. Building models for marketing decisions: Past, present and future. Int. J. Res. Mark. 2000, 17, 105–126. [Google Scholar] [CrossRef]
  46. Zhang, J.; Krishnamurthi, L. Customizing promotions in online stores. Mark. Sci. 2004, 23, 561–578. [Google Scholar] [CrossRef]
  47. Wright, R.A.; Allen, B.H. Improve the health care macro-system through micro-marketing: A physician/marketer’s viewpoint. In Proceedings of the 1982 Academy of Marketing Science (AMS) Annual Conference; Springer: Berlin/Heidelberg, Germany, 2015; pp. 177–181. [Google Scholar]
  48. Jain, L.C.; Vemuri, V.R. Industrial Applications of Neural Networks; CRC Press: Boca Raton, FL, USA, 1998; Volume 3. [Google Scholar]
  49. Kumar, M.; Thenmozhi, M. Stock index return forecasting and trading strategy using hybrid arima-neural network model. Int. J. Financ. Manag. 2012, 2, 1–14. [Google Scholar]
  50. Livingstone, D.J.; Manallack, D.T.; Tetko, I.V. Data modelling with neural networks: Advantages and limitations. J. Comput. Aided Mol. Des. 1997, 11, 135–142. [Google Scholar] [CrossRef] [PubMed]
  51. Patra, S.K.; Krishna, V.V. Globalization of R&D and open innovation: Linkages of foreign R&D centers in India. J. Open Innov. Technol. Mark. Complex. 2015, 1, 1–24. [Google Scholar]
  52. Yun, J.; Won, D.; Park, K. Dynamics from open innovation to evolutionary change. J. Open Innov. Technol. Mark. Complex. 2016, 2, 2–22. [Google Scholar] [CrossRef]
  53. Jeon, J.-H.; Kim, S.-K.; Koh, J.-H. Historical review on the patterns of open innovation at the national level: The case of the roman period. J. Open Innov. Technol. Mark. Complex. 2015. [Google Scholar] [CrossRef]
Figure 1. Process flow of the knowledge-based approach.
Sustainability 08 00808 g001
Figure 2. Examples of predetermined patterns of physician responsiveness to detail.
Sustainability 08 00808 g002
Figure 3. Examples of predetermined patterns of physician nonresponsiveness to detail.
Sustainability 08 00808 g003
Figure 4. An example of deriving a set of new PDE weights for an actual physician who appeared visually nonresponsive with the traditional set of PDE weights.
Sustainability 08 00808 g004
Figure 5. Analytics maturity assessment comparing 2005 with 2014.
Sustainability 08 00808 g005
Table 1. Summary of traditionally applied PDE weights for detailing sequence based on the number of drugs to be detailed.
1st Sequence2nd Sequence3rd + Sequence
With single drug1.00--
With two drugs1.000.60-
Three or more drugs1.000.600.30
Table 2. The average PDE weights derived using the knowledge-based approach for responsive physicians based on the number of detailing drugs from 2005.
1st Sequence2nd Sequence3rd + Sequence
With single drug1.00--
With two drugs0.820.68-
Three or more drugs0.700.410.02
Table 3. The average PDE weights derived using the knowledge-based approach for responsive physicians based on the number of detailing drugs from 2014.
1st Sequence2nd Sequence3rd + Sequence
With single drug1.00--
With two drugs0.870.43-
Three or more drugs0.780.320.00
Table 4. Performance comparison of traditional and knowledge-based approaches in 2005.
% of Physicians Who Are Responsive Share of VoiceDuration of DetailQuarterly Profit
Traditional approach30%10%--
Knowledge-based approach47%16%+47%+12%
Table 5. Performance Comparison of Traditional and Knowledge-Based Approaches in 2014.
% of Responsive PhysicianSOVDetailing Duration vs. 2005Profitability of Responsive Physicians 2005–2014
Traditional approach19%6%--
Knowledge-based approach35%10%−9%+23%

