Article

Impact of China’s Recycling Subsidy Policy in the Product Life Cycle

1
Department of Management Science and Engineering, East China University of Science and Technology, Shanghai 200237, China
2
Department of Decision Sciences, San Francisco State University, San Francisco, CA 94132, USA
*
Author to whom correspondence should be addressed.
Sustainability 2016, 8(8), 781; https://doi.org/10.3390/su8080781
Submission received: 29 April 2016 / Revised: 1 August 2016 / Accepted: 8 August 2016 / Published: 16 August 2016
(This article belongs to the Section Environmental Sustainability and Applications)

Abstract

:
This paper examines the impact of the Chinese recycling subsidy policy (CRS-policy) on the recycling and reuse industry across the whole product life cycle. We propose a closed-loop dynamic system to illustrate the production flow and interactions among various industry and market factors. A simulation analysis is conducted using data on gas auto engines in China to evaluate the effectiveness of the CRS-policy in encouraging product recycling and reuse. Specifically, we analyze the preventative and regenerative effects of the CRS-policy, and its impact on environmental pollution and social welfare. We further investigate how market factors, including the manufacturer’s innovation environment, consumer environmental awareness and sensitivity to the subsidy, and recycling and reuse industry profit, affect the effectiveness of the CRS-policy. The study provides strong evidence of the important role of the subsidy policy in the recycling and reuse industry and offers insightful recommendations for enhancing the effectiveness of the subsidy policy.

Graphical Abstract

1. Introduction

With concern about environmental problems increasing in recent years, the Chinese government has introduced several recycling subsidy policies to commit to environmental protection by accelerating recycling, reuse and remanufacturing. Under the recycling subsidy policy, recyclers or consumers will receive a subsidy from the government per collected used product. The government intends to implement this recycling subsidy policy to collect more used products and stimulate the development of the recycling and reuse industry.
Given the nationwide attention to environmental issues, and the industry focus on recycling and reuse, as well as the government’s huge expenditure on the subsidy, there is much interest in how the Chinese recycling subsidy (CRS-policy) plays a role across the whole product life cycle. Specifically, how does the CRS-policy affect the reduction in the resource consumption and waste production in the upstream supply chain (preventative impact)? How does the policy influence recycling and reuse practices in the downstream supply chain (regenerative impact)? What is the overall effectiveness of the CRS-policy if we synthetically consider the environmental and economic benefits? In this study, we aim to answer these questions using the system dynamics simulation method, to provide in-depth understanding of the CRS-policy, and to offer insightful recommendations to improve the policy’s effectiveness.
A growing number of studies have explored sustainable operational strategies for enterprises with the government subsidy policy, which mainly provide a firm’s optimal response to the take-back policy and insights into firms. Tu and Huang [1] found that implementing a reduction, reuse and recycling (3R) policy can improve production efficiency and increase reuse or recycling of resources. Aksen et al. [2] and Mitra and Webster [3] studied the effects of government subsidies on promoting collection and remanufacturing activity. Ma et al. [4] analyzed the influence of the government consumption subsidy on manufacturers’ and retailers’ profit. Krass et al. [5] used the Stackelberg model to investigate the impact of the environmental tax policy on an enterprise’s choice of innovation and green technology. Raz et al. [6] and Plambeck and Wang [7] examined the effect of the extended product responsibility (EPR) policy on motivating manufacturers to design. Kleber et al. [8] and Teunter and Flapper [9] studied the enterprise recycling strategy with the EPR policy. Simic and Dimitrijevic [10] explored the production process and tactical production planning with the extended production responsibility policy. These studies mainly analyzed an enterprise’s optimization response strategy to a specific policy. In contrast, some scholars have discussed policy design from the government’s perspective. Finnveden [11] stated that the policy instrument “Compulsory recycling of recyclable materials” can be effective and can be implemented. Hong and Ke [12] and Hong et al. [13] discussed Advanced recycling fees (ARFs) and government subsidy decision-making in the reverse supply chain. They established a Stackelberg game model that included the government and manufacturers and determined the optimal government subsidy fees while maximizing social welfare. Jeanjean [14] used a dynamic mathematical model to provide advice on subsidy policy timeliness by investigating consumer willingness to pay. Lorentziadis and Vournas [15] proposed a quantitative model of vehicle-retirement subsidy policy to explore the quantity change in the new-energy automobiles that are replacing traditional automobiles and determined the appropriate subsidy. However, these studies mainly used game theory or optimization methods that have more assumptions.
Although extensive valuable research has been carried out regarding the role of a government subsidy policy in an enterprise’s business practices, several unexplored aspects remain in the literature. First, there is a lack of studies focusing on the subsidy policy from the perspective of the whole product life cycle in the recycling and reuse industry. Second, little research has evaluated the environmental and economic impact of the subsidy policy simultaneously across the product life cycle. Third, the existing literature mainly employed game theory or optimization modeling, and was based on a simple policy assumption without taking into account the interactions between decision-makers, such as the government, manufacturers, recyclers and consumers.
Government policy, manufacturing, recycling and reuse create a complex, dynamic non-linear system, in which there are multiple feedback loops and interactions among the decision-makers. Moreover, because of the timelag effect of the policy, the causes, results and phenomenon are usually separated in space and time, which cannot be captured by game theory and optimization theory. However, the system dynamics (SD) method is very effective in simulating the complex system with time-varying and multiple feedback loops.
In terms of simulation techniques, the SD stimulation method has been widely applied to study various business policies and recycling operation problems. For instance, based on the SD simulation approach, Poles [16], Georgiadis and Vlachos [17], Sterman [18] and Das and Dutta [19] explored remanufacturers’ production, reverse logistics management and closed-loop supply chain network design. Van and Reuter [20] described the time-varying factors that influence the recycling rate of end-of-life vehicles. Spengler and Schroter [21] simulated an integrated production and recovery system. Calvo et al. [22] assessed how two government measures, economic incentives and tax penalties, affect recollection, recycling and reuse of enterprise construction and demolition waste. Peng et al. [23] analyzed inventory and logistics planning, and Georgiadis and Besiou [24] examined the impact of ecological motivation and technological innovations on enterprise recycling, remanufacturing and use of non-renewable resources.
This study seeks to extend the existent literature by examining the impact of the CRS-policy with simultaneous considerations of the environmental effect and economic performance using system dynamics methodology and the computer simulation method. We evaluate the effectiveness of the CRS-policy by introducing several important indicators, such as the manufacturer’s effort on innovation design, legal recycling rate, illegal disposal quantity, pollution cost, government subsidy expenditure and social welfare. We also introduce several market factors, including the manufacturer’s innovation environment, consumer environmental awareness and sensitivity to the subsidy, and recycling and reuse industry profit, and investigate their influence on the effectiveness of the CRS-policy. This study will provide a theoretical basis for the government to optimize its recycling subsidy policy and improve the government’s ability to control institutional resources.
The remainder of this paper is organized as follows. Section 2 describes the CRS-policy, presents causal loop diagrams of SD model, and designs the stock and flow diagram of the SD model. Section 3 introduces the data and simulation equations. Section 4 analyzes the impact of the CRS-policy individually and comparatively. Section 5 concludes the study.

2. Policy Description, Causal Relationship and Simulation Model

In general, the recycling subsidy policy in China provides a certain amount of subsidy to consumers, which is funded by the government that aims to recycle an increased number of used products or parts. A typical recycling policy in China is the remanufacturing subsidy policy used in the auto industry. In July 2013, China’s five ministries (National Development and Reform Commission (NDRC), Ministry of Finance, Ministry of Industry, etc.) jointly announced the Remanufacturing Product Pilot Program that provides a one-time subsidy of 10% of the replacement price (the sale price of the remanufactured product minus the buy-back price) to a consumer who purchases a remanufactured auto part. This program aims to facilitate the recycling process and enlarge the market share of remanufactured products.
In this section, we discuss the causal relationships among several important factors in the whole product life cycle based on this recycling subsidy policy in China.
A typical product life cycle includes: product design, manufacturing, usage, recycling, reuse and waste disposal, which constitutes a complex closed-loop system. We divide this system into three subsystems to offer more detailed information: a manufacturing and usage subsystem, a recycling and reuse subsystem and a recycling subsidy subsystem. We discuss the key relationships of each subsystem in the following subsections.

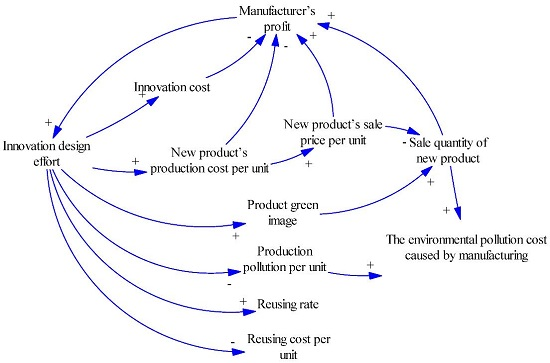
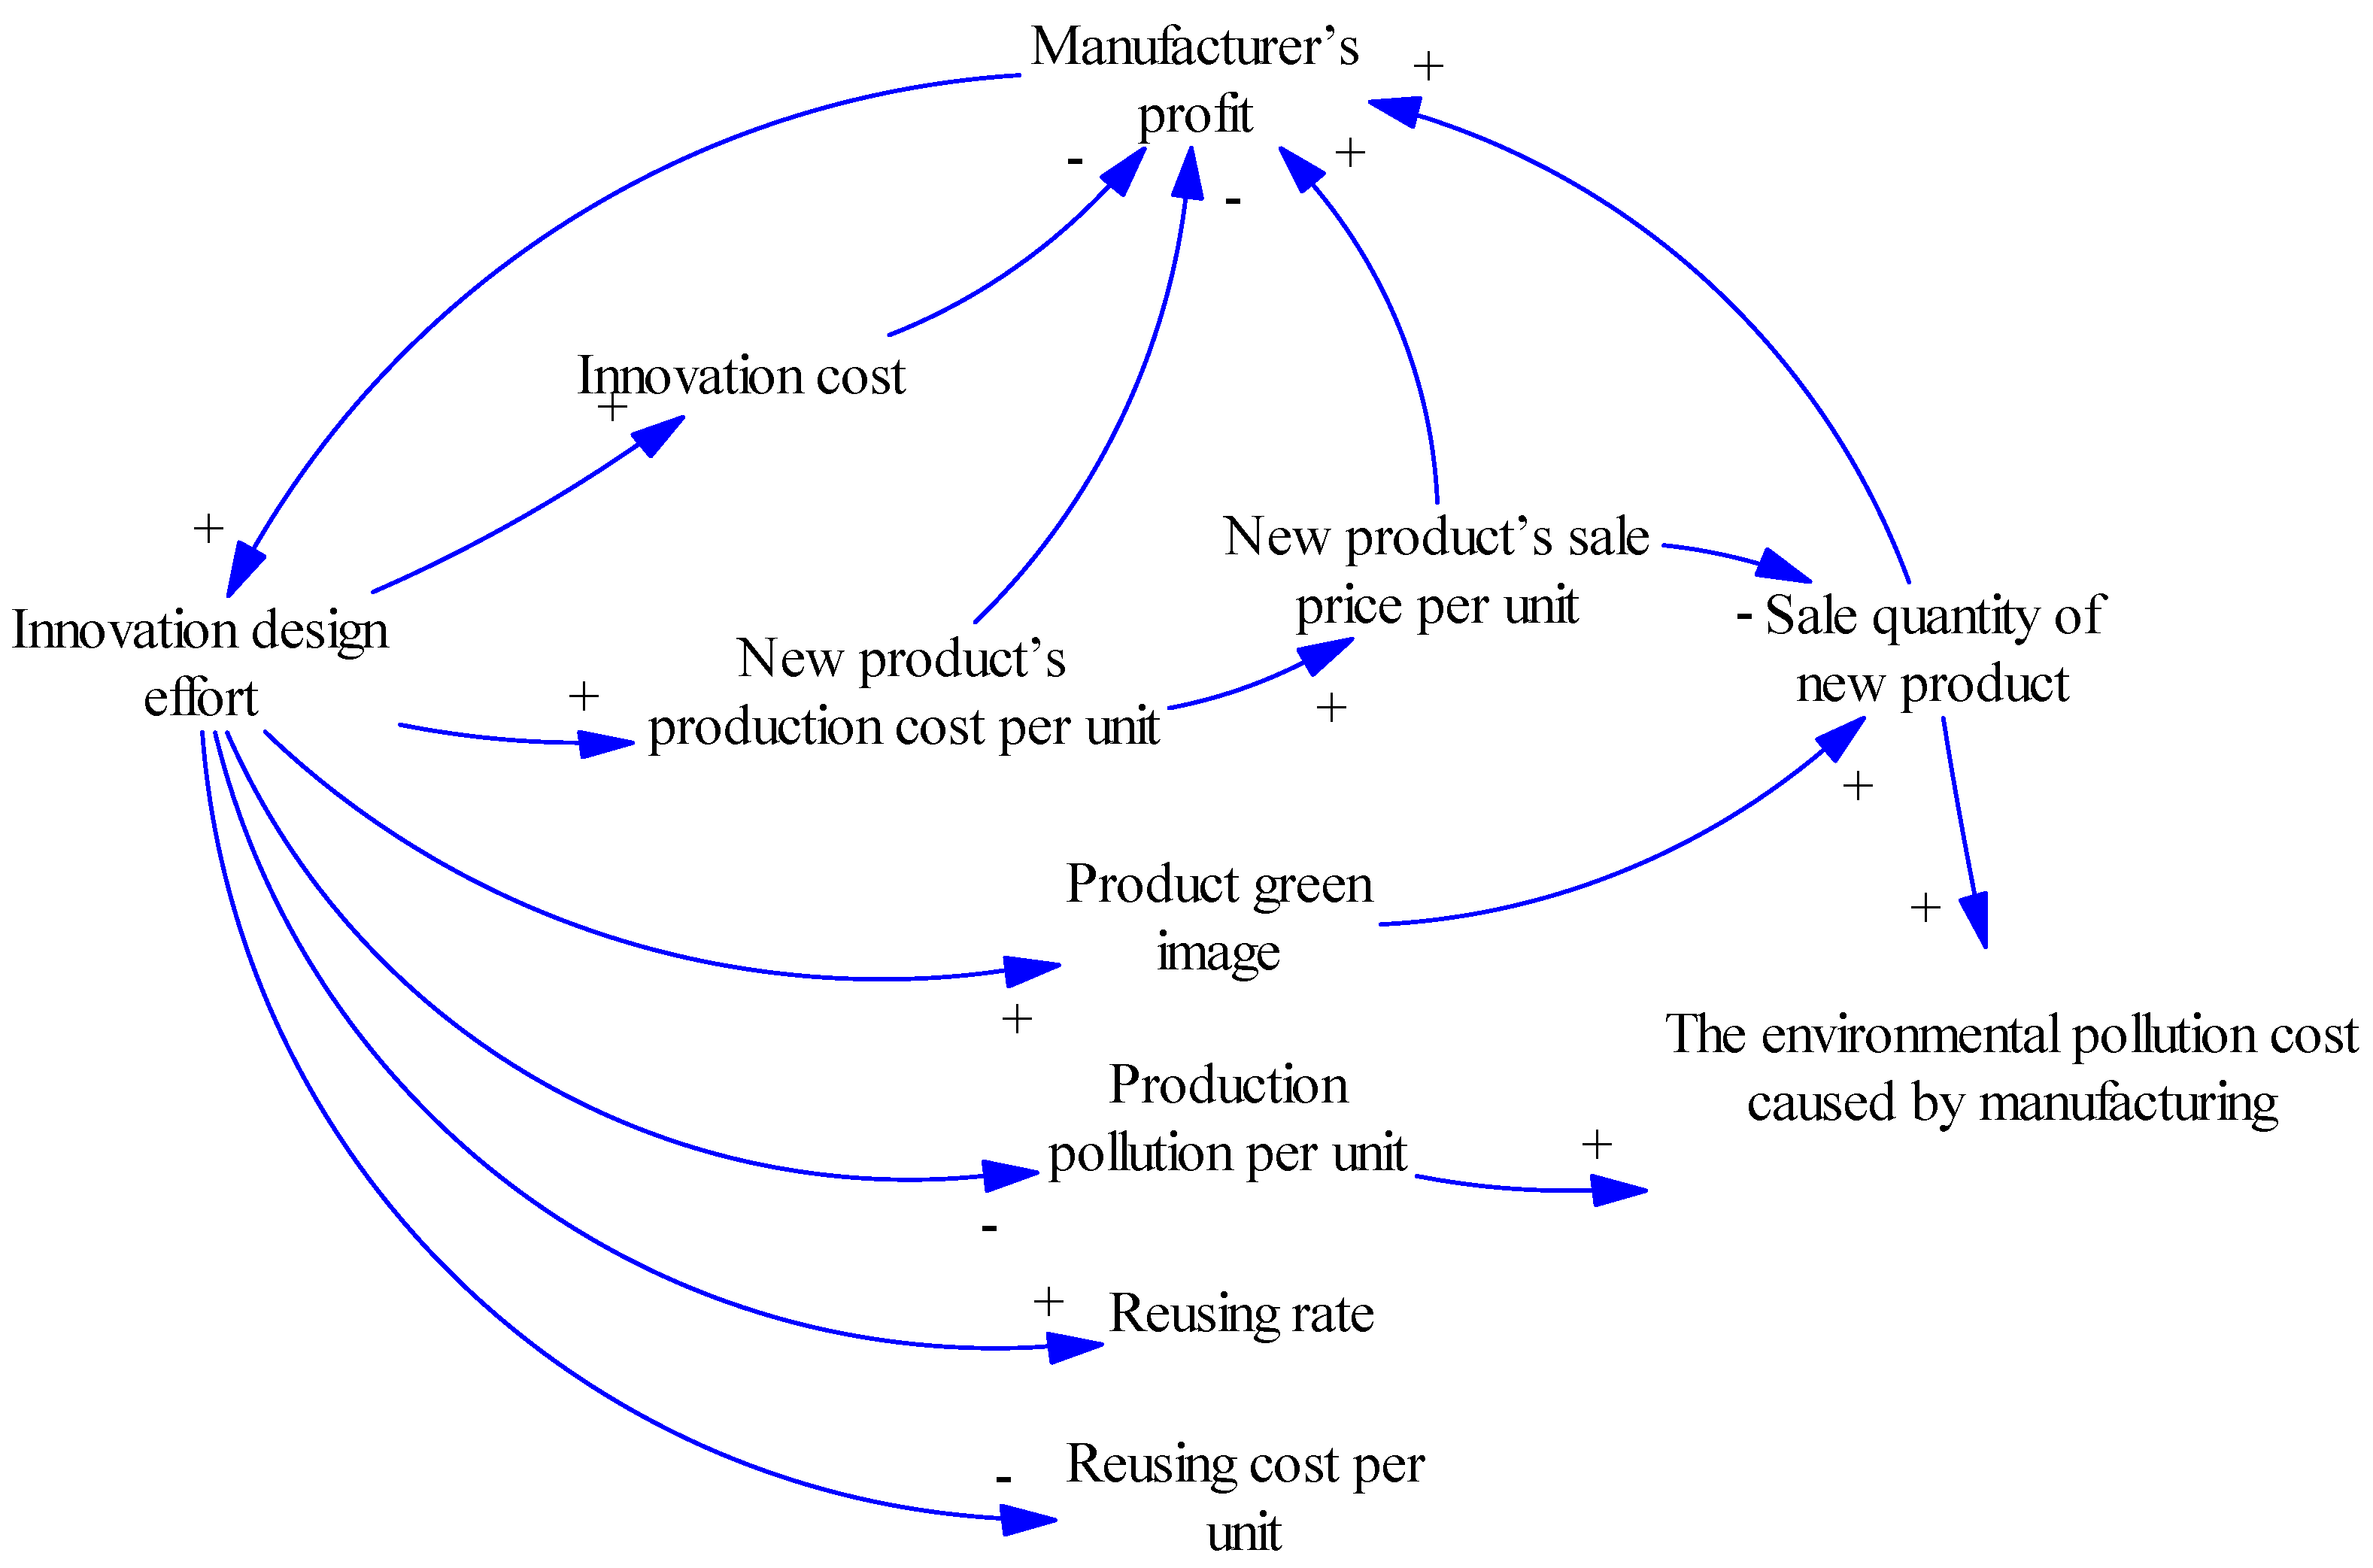
2.1. Manufacturing and Usage Subsystem

The manufacturing and usage subsystem illustrated by the diagram in Figure 1 corresponds to the product design, manufacturing and usage activities in the early stage of the product life cycle. The diagram depicts the causal relationships among several factors in the manufacturing and usage subsystem. The lines and arrows demonstrate the directional effect between corresponding factors. The positive sign (+) next to the arrow represents positive feedback while the negative sign (–) represents negative feedback. For example, innovation design effort + innovation cost at the top of Figure 1 means that the greater the innovation design effort, the higher the innovation cost, and innovation cost manufacturer’s profit means the higher the innovation cost, the lower the manufacturer’s profit.
In this subsystem, a key indicator in the production design stage, the innovation design effort [6], is introduced to represent the manufacturer’s effort to reduce resource consumption and waste production. The high degree of the innovation design offers several benefits across the whole product life cycle. The bottom portion of the diagram in Figure 1 shows that the greater innovation design effort not only decreases production pollution per unit during the manufacturing and usage stage (e.g., energy efficiency, low-carbon and environmentally friendly), but also reduces the reuse cost per unit as the ease of recycling and reuse has been incorporated into the product design. Consequently, the overall waste rate is lowered, and the reuse rate is improved.
Innovation design has a positive impact on environmental outcomes but comes with additional cost. Thus, the influence of innovation design on the manufacturer’s profit, as well as the consumer demand, is two-sided, as illustrated in the top and middle portions of the diagram. On the one hand, the increased innovation cost raises the manufacturer’s production cost per unit; thus, the manufacturer has to raise the selling price to maintain the same profit per unit, which leads to lower sales quantity. As a result, the manufacturer’s overall profit is reduced, which discourages the innovation effort. On the other hand, the design innovation enhances the green image of the product, and with customers’ increasing awareness of environmentally and eco-friendly products, many would prefer to pay more for greenness. Thus, sales will increase, as will the profit, which will further motivate the manufacturer to improve the innovation design.

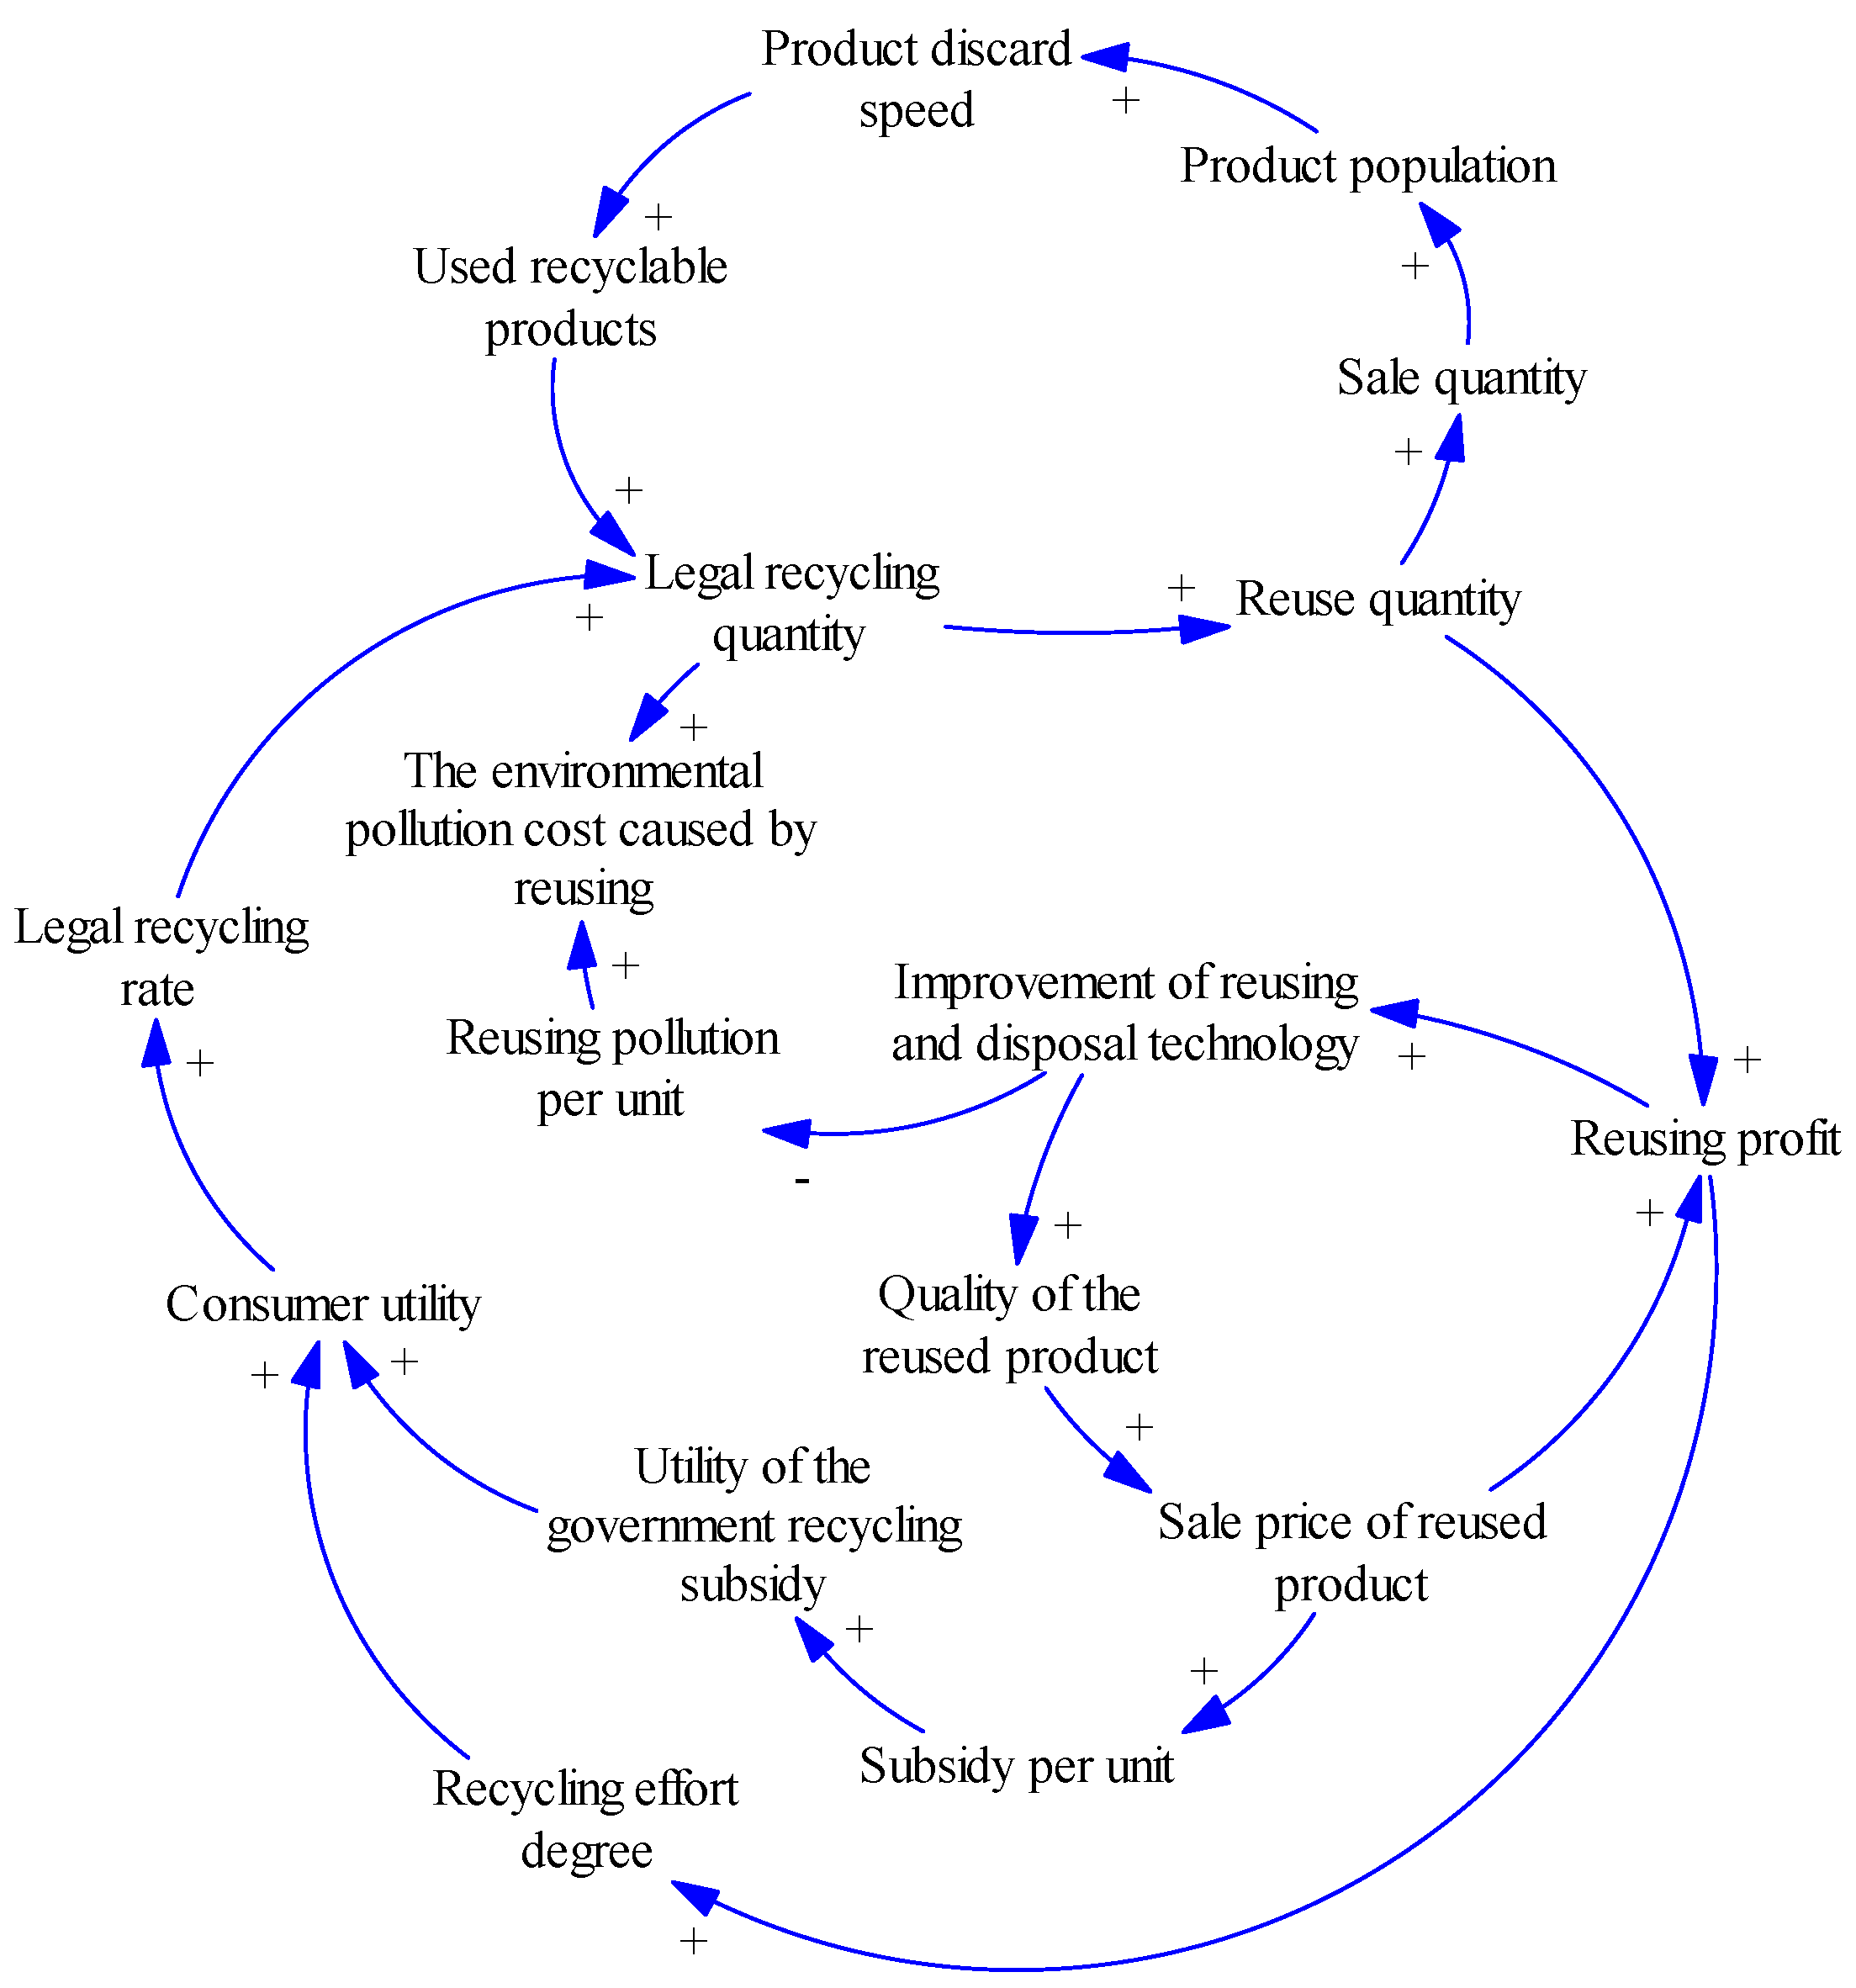
2.2. Recycling and Reuse Subsystem

The recycling and reuse subsystem shown in Figure 2 corresponds to the used product recycling, reuse, disposal and discard activities at the end stage of the product life cycle. This subsystem is an important part of a closed-loop product operation system and mainly describes the causal relationships among the product population, product discard rate, legal recycling rate, reuse cost and profit, among others.
There are several important relationships in Figure 2. First, the top of the diagram shows that an increased product population is associated with higher product discard speed, resulting in more used recyclable products and higher legal recycling quantity through legal recycling channels. In addition, we assume that the recycler would like to improve recycling and reuse disposal technology with less pollution. The middle portion of the diagram describes that higher reuse profit provides incentives for a recycler to improve the reuse and disposal technology, which will improve the quality of the reused product and reduce the pollution of the reuse process. Thus, the sale price would be raised due to the higher quality of the reuse product, and the recycling and reuse dealers will gain more profit, which will motivate them to further engage in recycling. Likewise, consumers are subsidized by a percentage of the sale price of the reused product. Therefore the subsidy per unit is higher when the sale price of the reused product is higher. Moreover, a higher subsidy and increased manufacturer recycling effort will increase consumer utility, which will result in a higher legal recycling rate and more used product collected through legal channels.

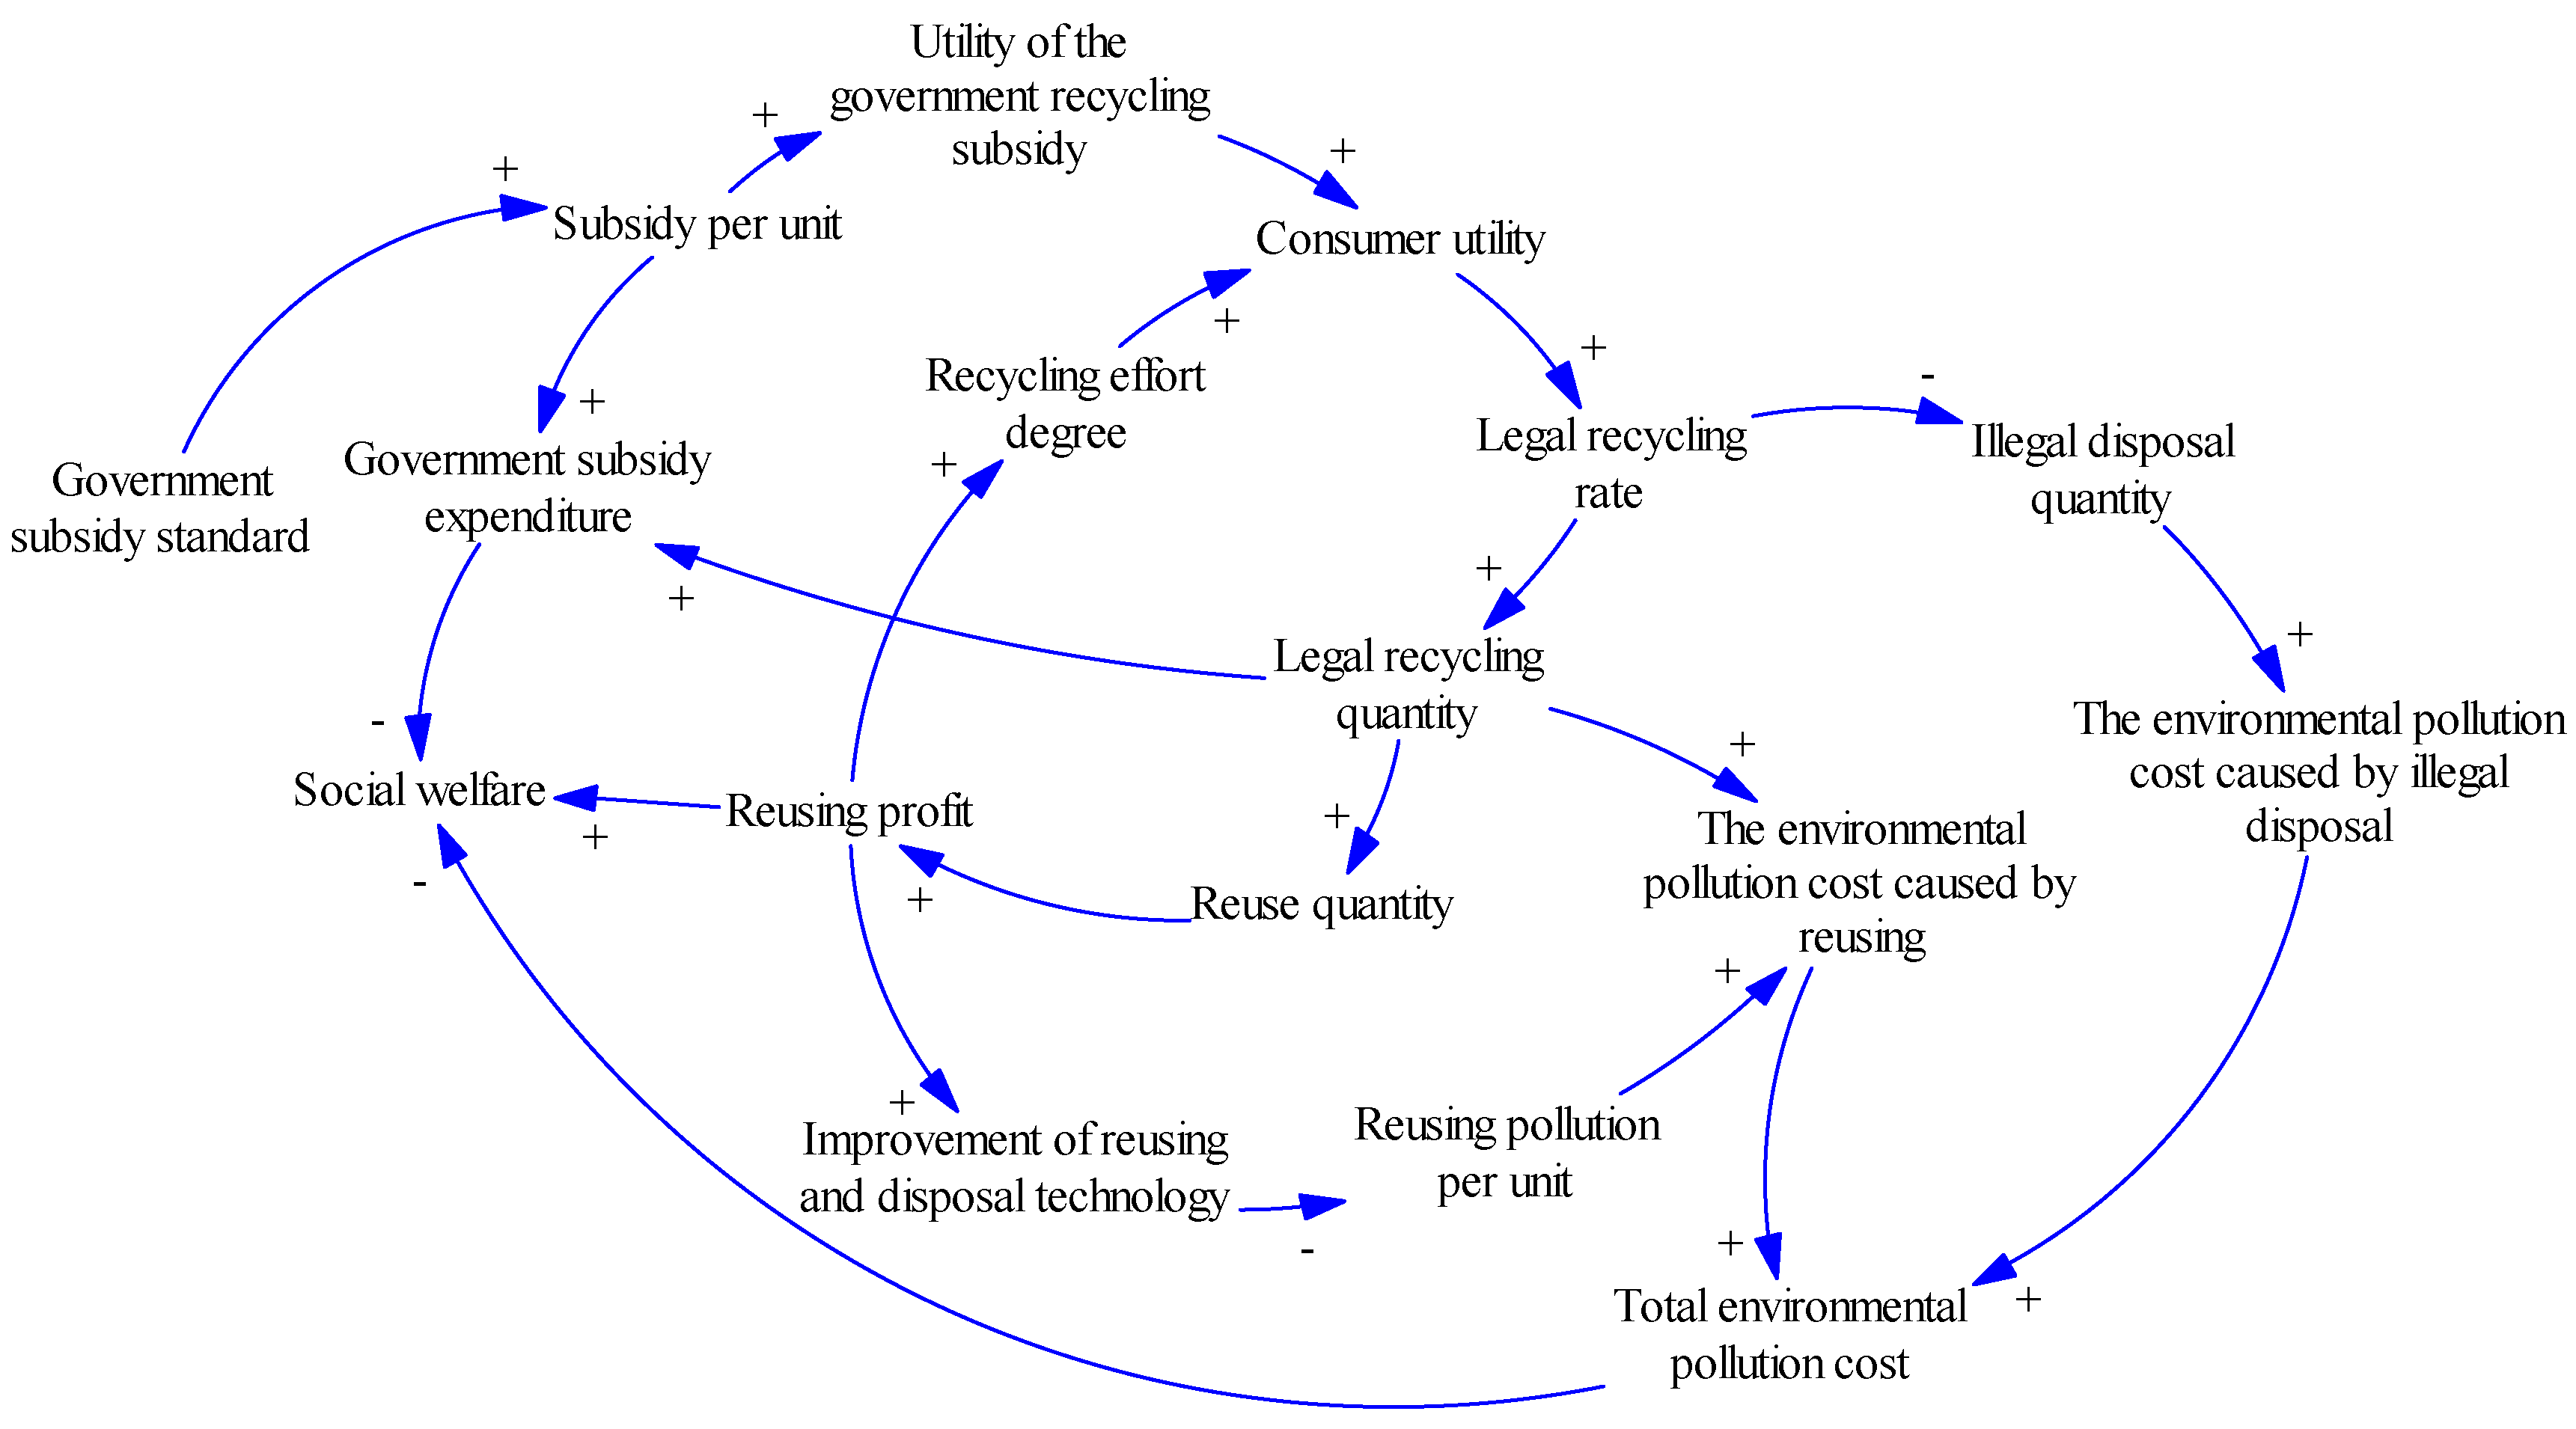
2.3. Recycling Subsidy Subsystem

The causal loop diagram of the government recycling subsidy subsystem is presented in Figure 3. Based on the CRS-policy, we assume that the subsidy mainly applies to individual consumer in the recycling and reuse stage. As shown in the left portion of the diagram, the higher government subsidy standard indicates a larger recycling subsidy per unit, which will attract more consumers, along with more legal recycling. In addition, the government subsidy expenditure is greater when the recycling subsidy per unit is higher, implying lower social welfare. In addition, we assume that production, legal recycling and reuse will cause environmental pollution, referred to as negative environmental effects as shown in the right portion of the diagram. Increased negative environmental effects also lead to lower social welfare.

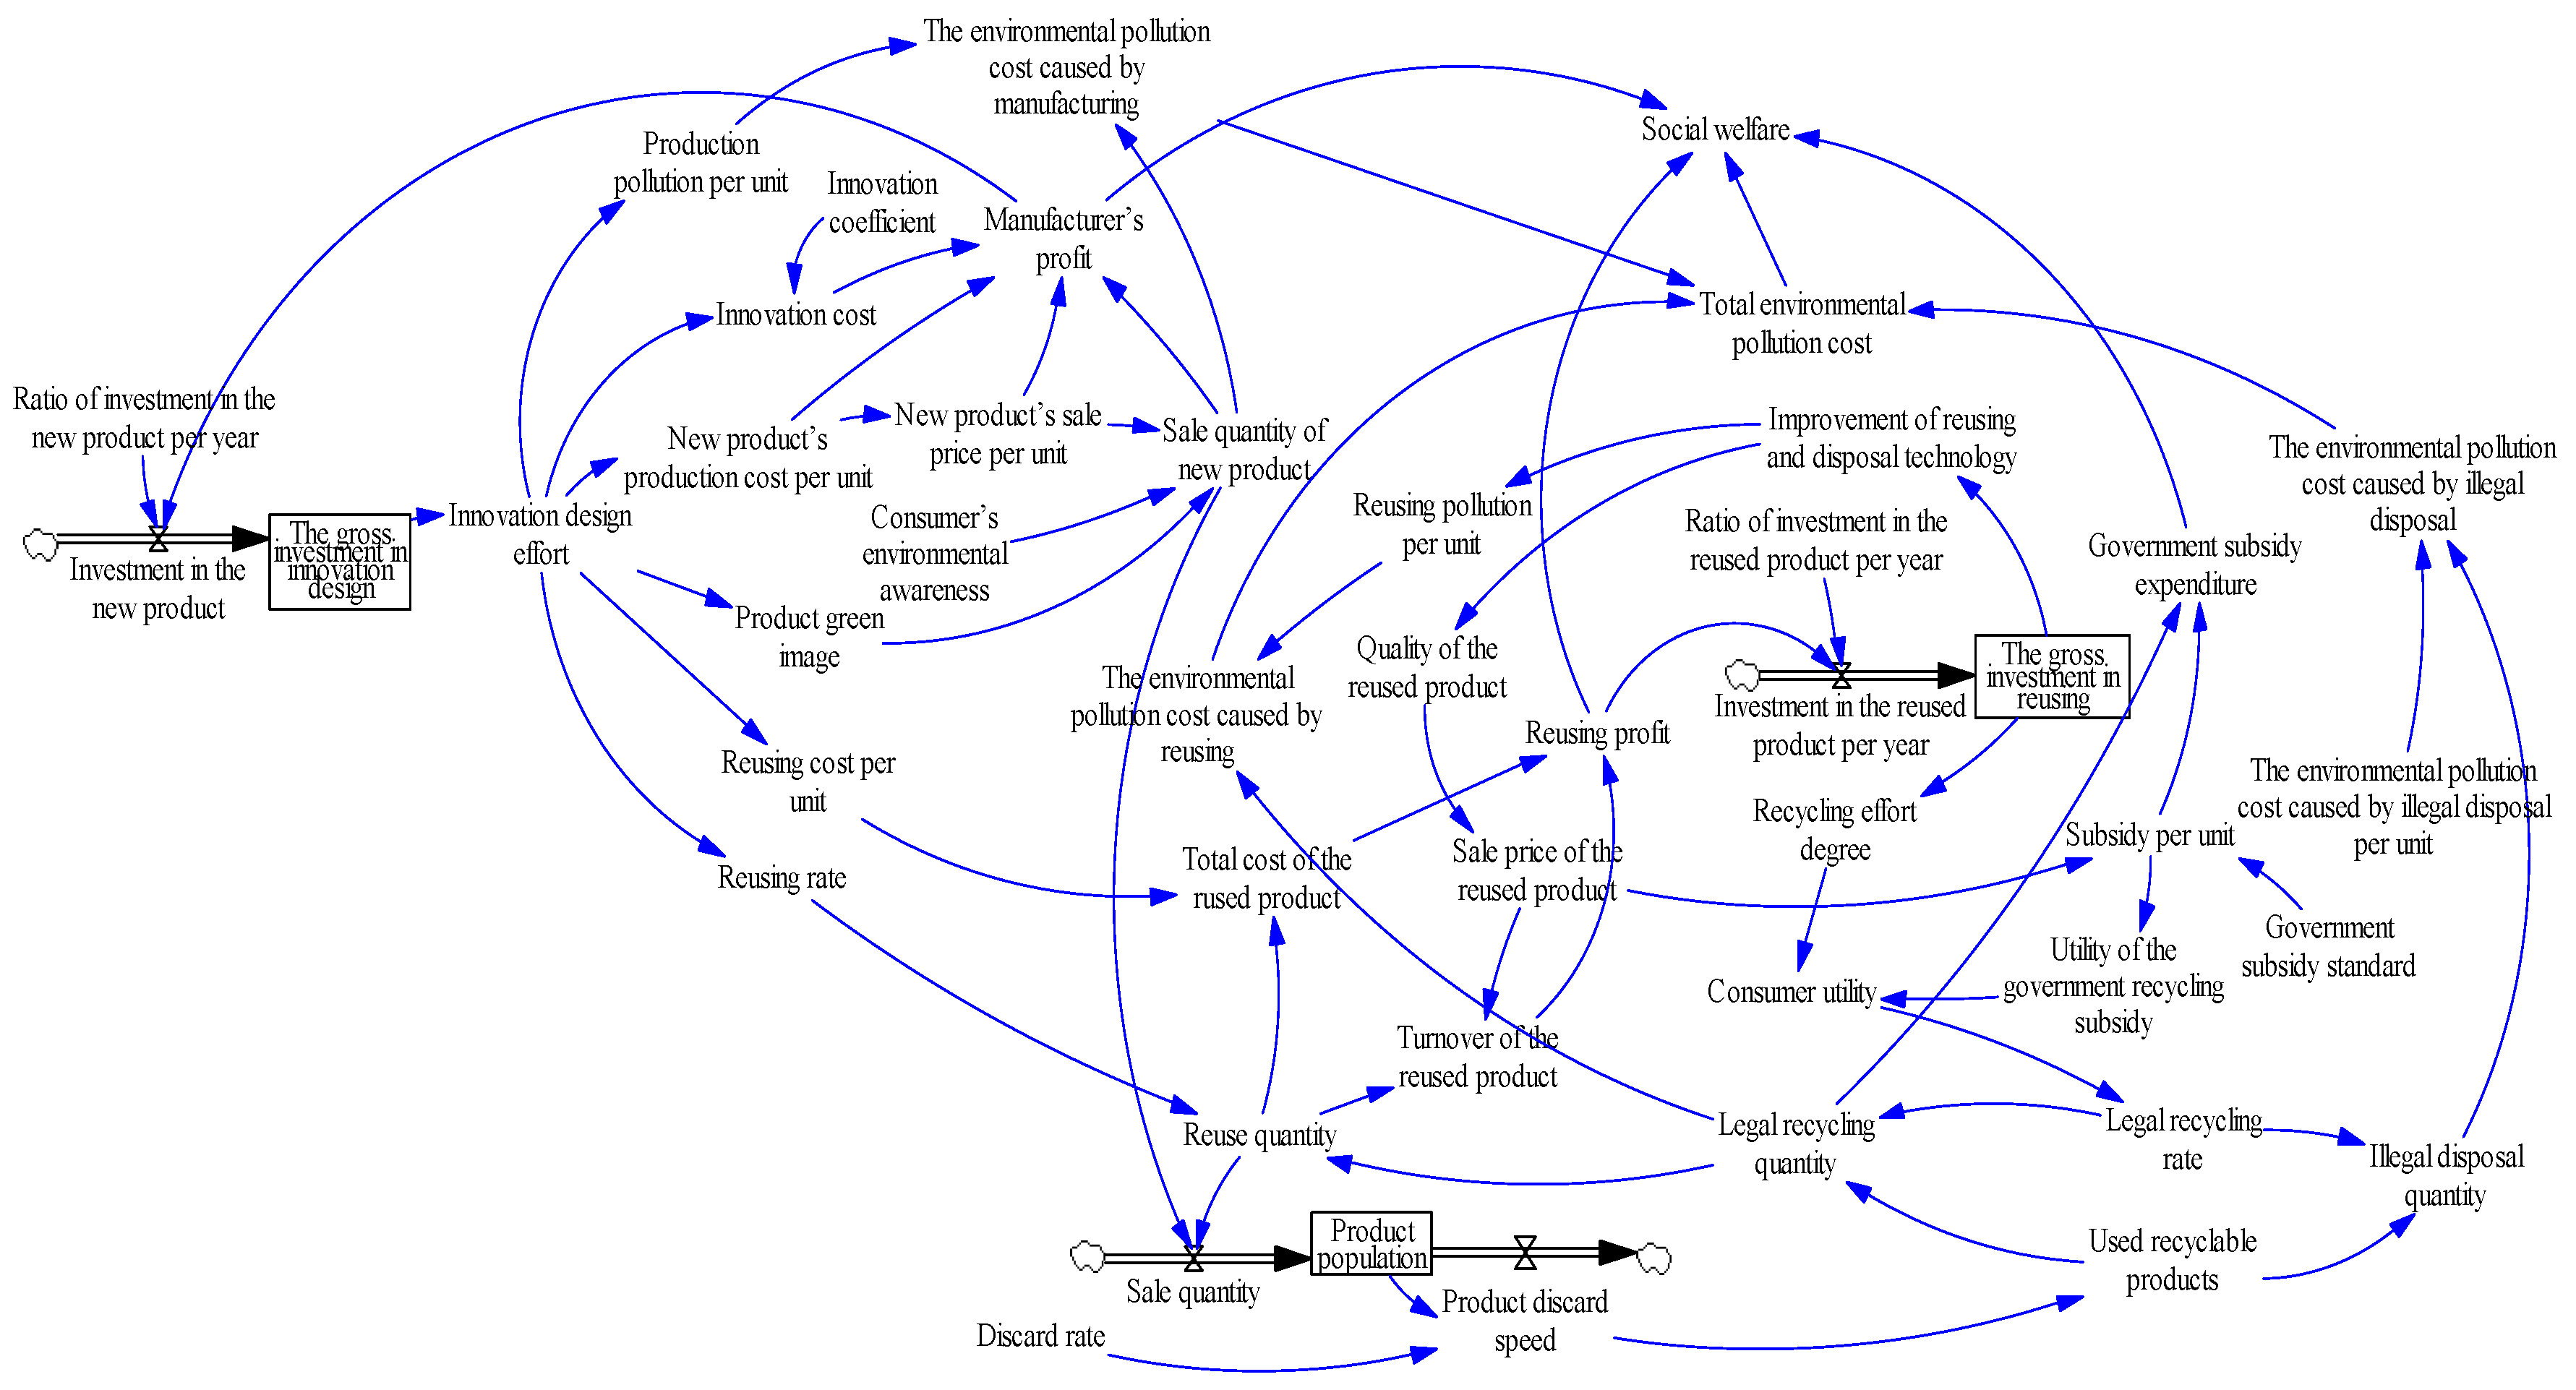
2.4. Stock and Flow Diagram of the SD Model

Based on the three causal loop diagrams introduced in Section 2.1 through Section 2.3 (Figure 1, Figure 2 and Figure 3), a stock and flow diagram of the SD model regarding the product’s close-loop life cycle under the CRS-policy is illustrated in Figure 4. The causal loop diagram reflects the relationships between different factors at different life cycle stages, as well as the system’s feedback process. Although the stock and flow diagram illustrates the whole dynamic system’s process and its changes over time, The diagram also embodies our understanding of the system’s feedback and control process.

3. Data and Simulation Setup

The key data, parameters and formulas of the simulation analysis are introduced in this section. A summary of the notations can be found in Table A1 in the Appendix.
(1)
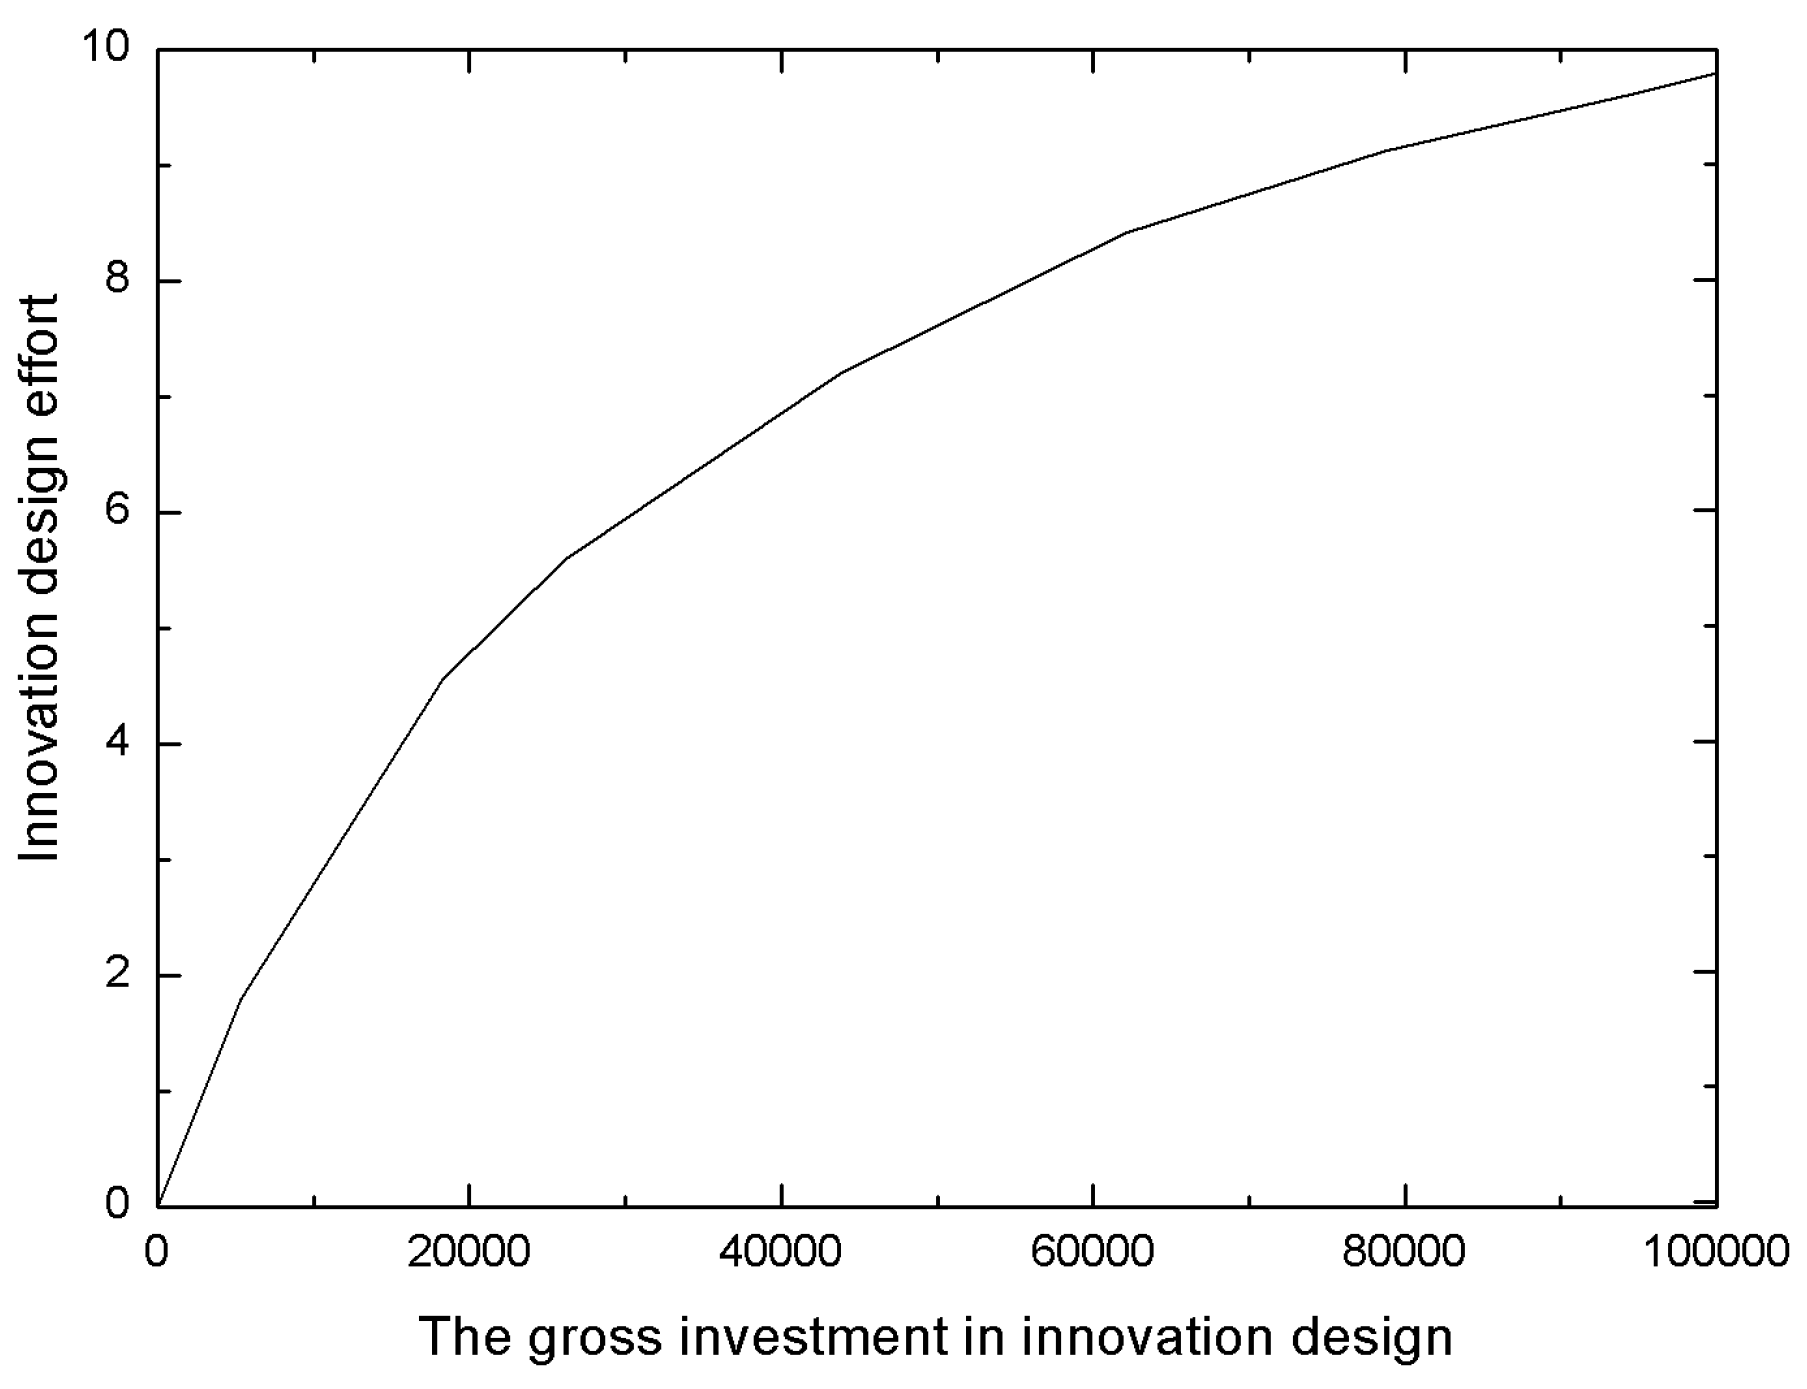
Innovation-related function
There are two typical innovation-related functions: innovation design effort and innovation cost.
The innovation design effort e is a dimensionless parameter. A large e represents a high innovation design effort. We suppose the value of e varies depending on the manufacturer’s investment in innovation design, and the impact of the manufacturer’s investment on the degree of innovation design effort decreases over time [25], which is depicted as Figure A1 in the Appendix.
We set the variable for the innovation cost as de2 following Raz et al. [6]. A large d indicates high innovation difficulty, and the initial value is set as 100.
(2)
New product’s unit production cost and sale price
Based on the work of Raz et al. [6], we set the function of the new product’s unit production cost as c = c 0 ( 1 + γ e ) , which means innovation incurs an additional cost.
We set c 0 = 42.2 (thousand Yuan) referring to the current Volkswagen major engine, the EA888 series [26], and we set γ = 0.1, which means the manufacturer’s innovation cost is no higher than the initial unit production cost c 0 .
(3)
New product sales quantity and product population
We suppose that the new product’s sales quantity equals the consumer demand, and the function is D = A k ( 1 a δ e ) p . Improvement in a , δ and e reduces consumer price sensitivity. We set a = 1, which will be discussed in Section 4.2.2. Based on actual data on Chinese gasoline engines between 2005 and 2014, the optimal curve was simulated, and the values A = 4630, k = 662 and δ = 0.25 are deduced.
The initial value of the product population is set as the actual number of Chinese family vehicles in 2005 as it almost equals the number of gasoline engines.
(4)
Discard rate and legal recycling rate
Based on the real discard rate of Chinese automobiles, the discard rate in the simulation is set as 0.06 [27], that is, 6% of the total number of gasoline engines on the market are at the scrapping stage in China.
The legal recycling rate is the ratio of the recycling quantity through legal channels to the total recyclable quantity on the market, and the maximum value is 1, which is a crucial indicator for measuring the recycling performance. The legal recycling rate is affected by consumer utility and is expressed as Legal recycling rate = 0.3 + u, where u = 0.2 × Recycling effort degree + 0.8 × the utility of the government recycling subsidy.
(5)
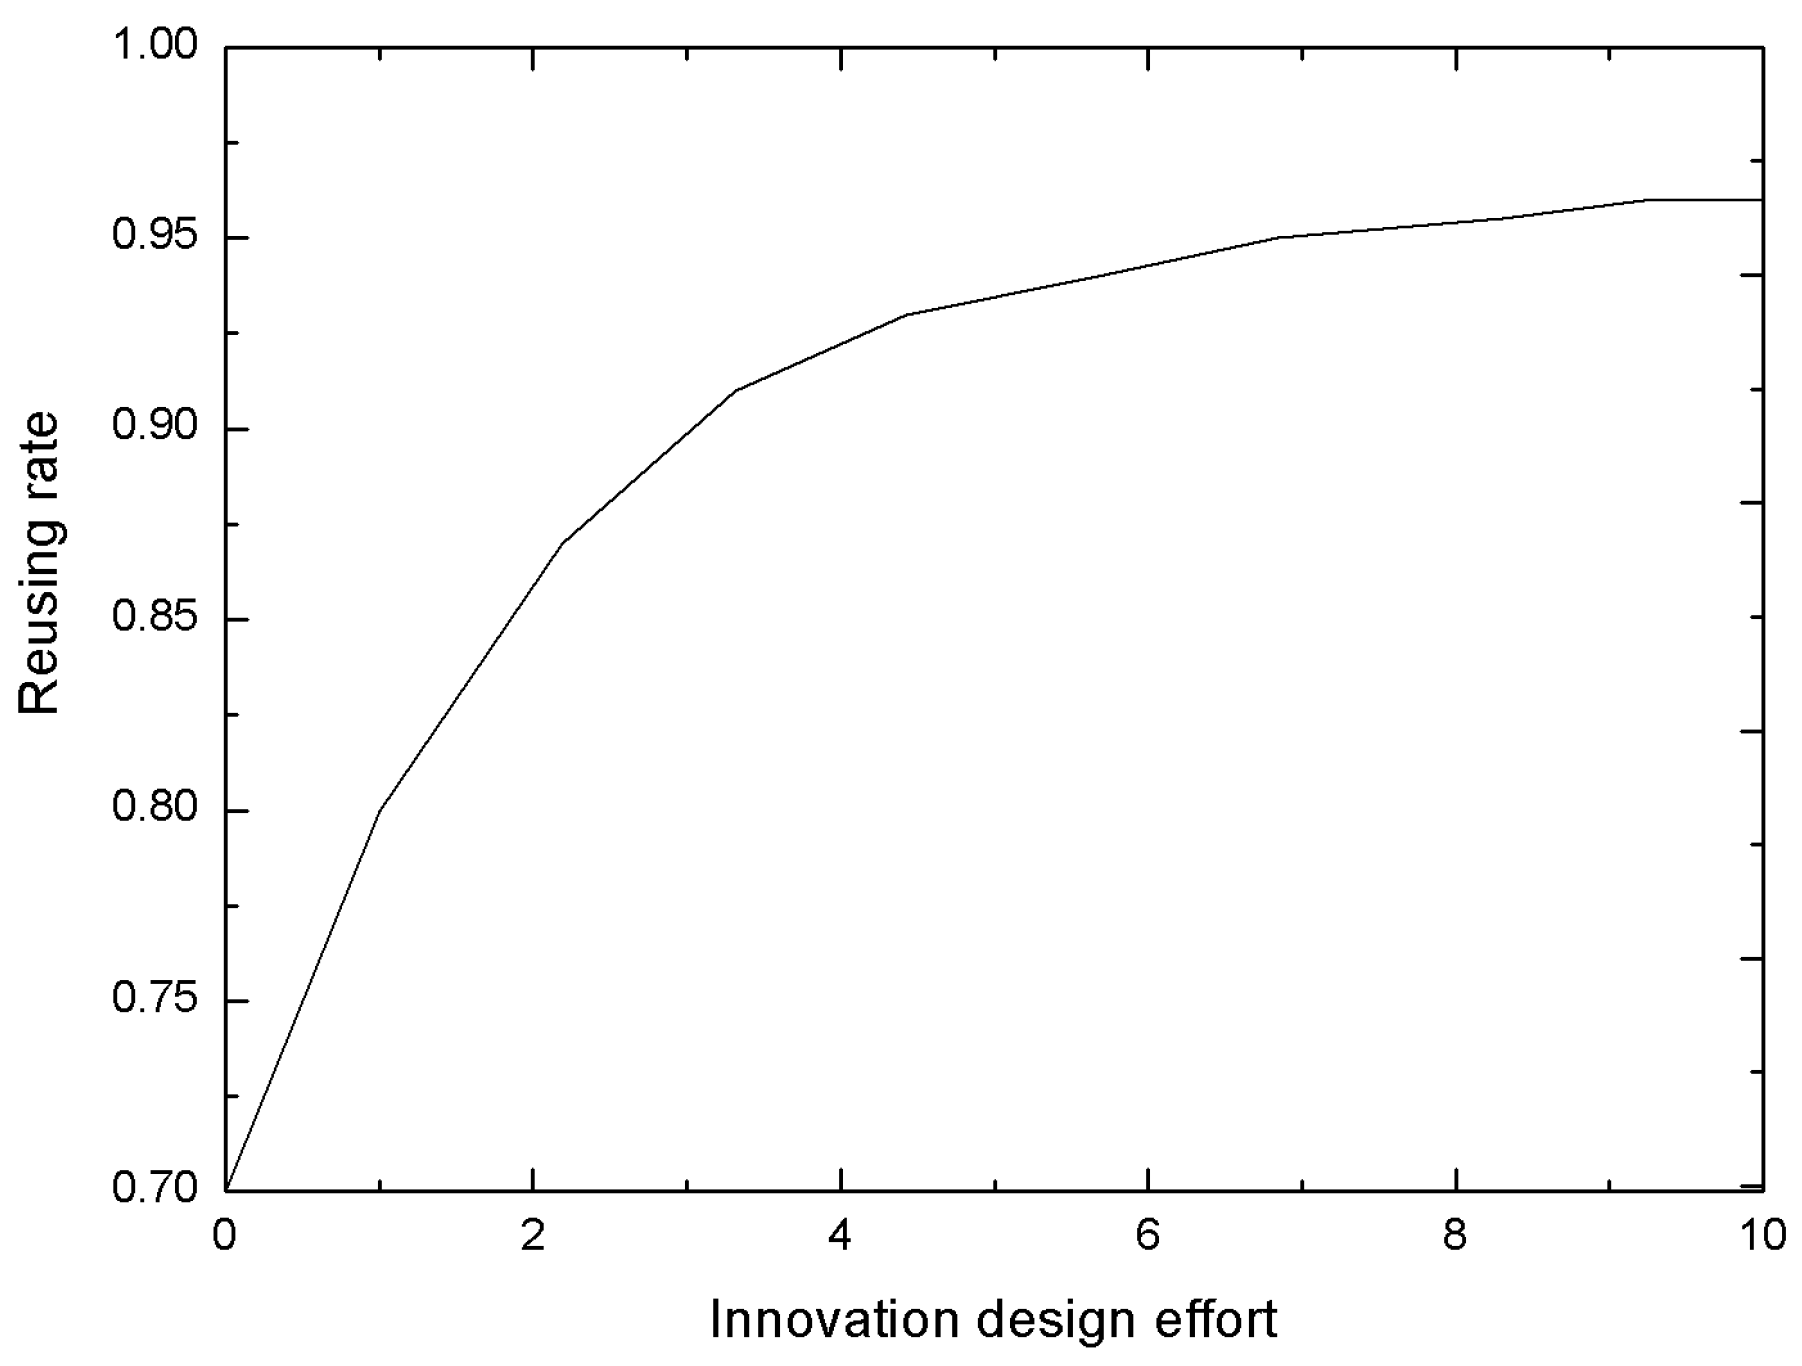
Reuse rate and reuse cost per unit
The reuse rate τ refers to the ratio that shows how much of the legal recycling product is transformed into a reusable product. The ratio is related to the manufacturer’s innovation design effort. We assume that the effect of the innovation design effort on τ weakens as the innovation design effort increases, which is depicted as Figure A2 in the Appendix. The initial value of τ is set as 0.7.
For the reuse cost per unit, we assume its value linearly decreases with the innovation design effort e. Given that the remanufacturing cost of the EA888 series is 16.4 thousand Yuan [26], we set the reuse cost per unit = 1.64 × (1 − e × 0.05). Therefore, when the innovation design effort achieves its maximum, the reuse cost per unit is half of the initial value.
(6)
Sale price of the reused product
The sale price of the reused product is determined by the quality of the reused product. We set the sale price of the reused product per unit p r = 2.8 × ( 1 + 0.1 υ ) , where 2.8 is derived from the sale price of 28 thousand Yuan of a remanufactured EA888 auto engine [26], and υ [ 0 , 10 ] is the value of the reused product quality. When the quality is optimal (the value is 10), the sale price of the reused product doubles.
(7)
Environmental cost
As discussed in Section 2, we expect that manufacturing, legal recycling and reuse, and illegal recycling and disposal have negative effects on the environment, referred to as negative environmental effects. The corresponding manufacturing environmental pollution cost (manufacturing EPC c e m ), recycling and reuse EPC ( c e r ), illegal recycling and disposal EPC ( c e d ) constitute the total EPC ( c e ).
c e m = e e m × sale quantity of new product, where e e m = 1.4 − 0.08e [28].
c e r = e e r × the quantity of legal recycling, where e e r = 1 − 0.08 × T. The reuse investment affects the value of T. The relationship between T and the reuse investment is depicted as Figure A3 in the Appendix.
c e d = e e d × illegal disposal quantity. Atasu et al. [29] pointed out that the setting of the product environmental pollution cost is complex. The value may be affected by different products, processing technologies or market environments. In this study, we assign e e d as 30 thousand Yuan.

4. Simulation Analysis, Results and Discussions

The system dynamics software Vensim PLE is used for the simulation analysis in this study. An important step of the SD methodology is the sensitivity analysis by examining the results of what-if scenarios that are discussed in this section. We set a timespan of 26 years, 2010–2035, with increment of one year.

4.1. Analysis of the CRS-Policy Impact

In this subsection, we analyze and discuss the impact of the CRS-policy at different stages of the product life cycle. We simulate five subsidy standards: 0%, 10%, 20%, 30%, and 40% of the sale price of the reused product to represent “no subsidy”, “standard subsidy”, “medium subsidy”, “high subsidy“, and “superior subsidy”, respectively.

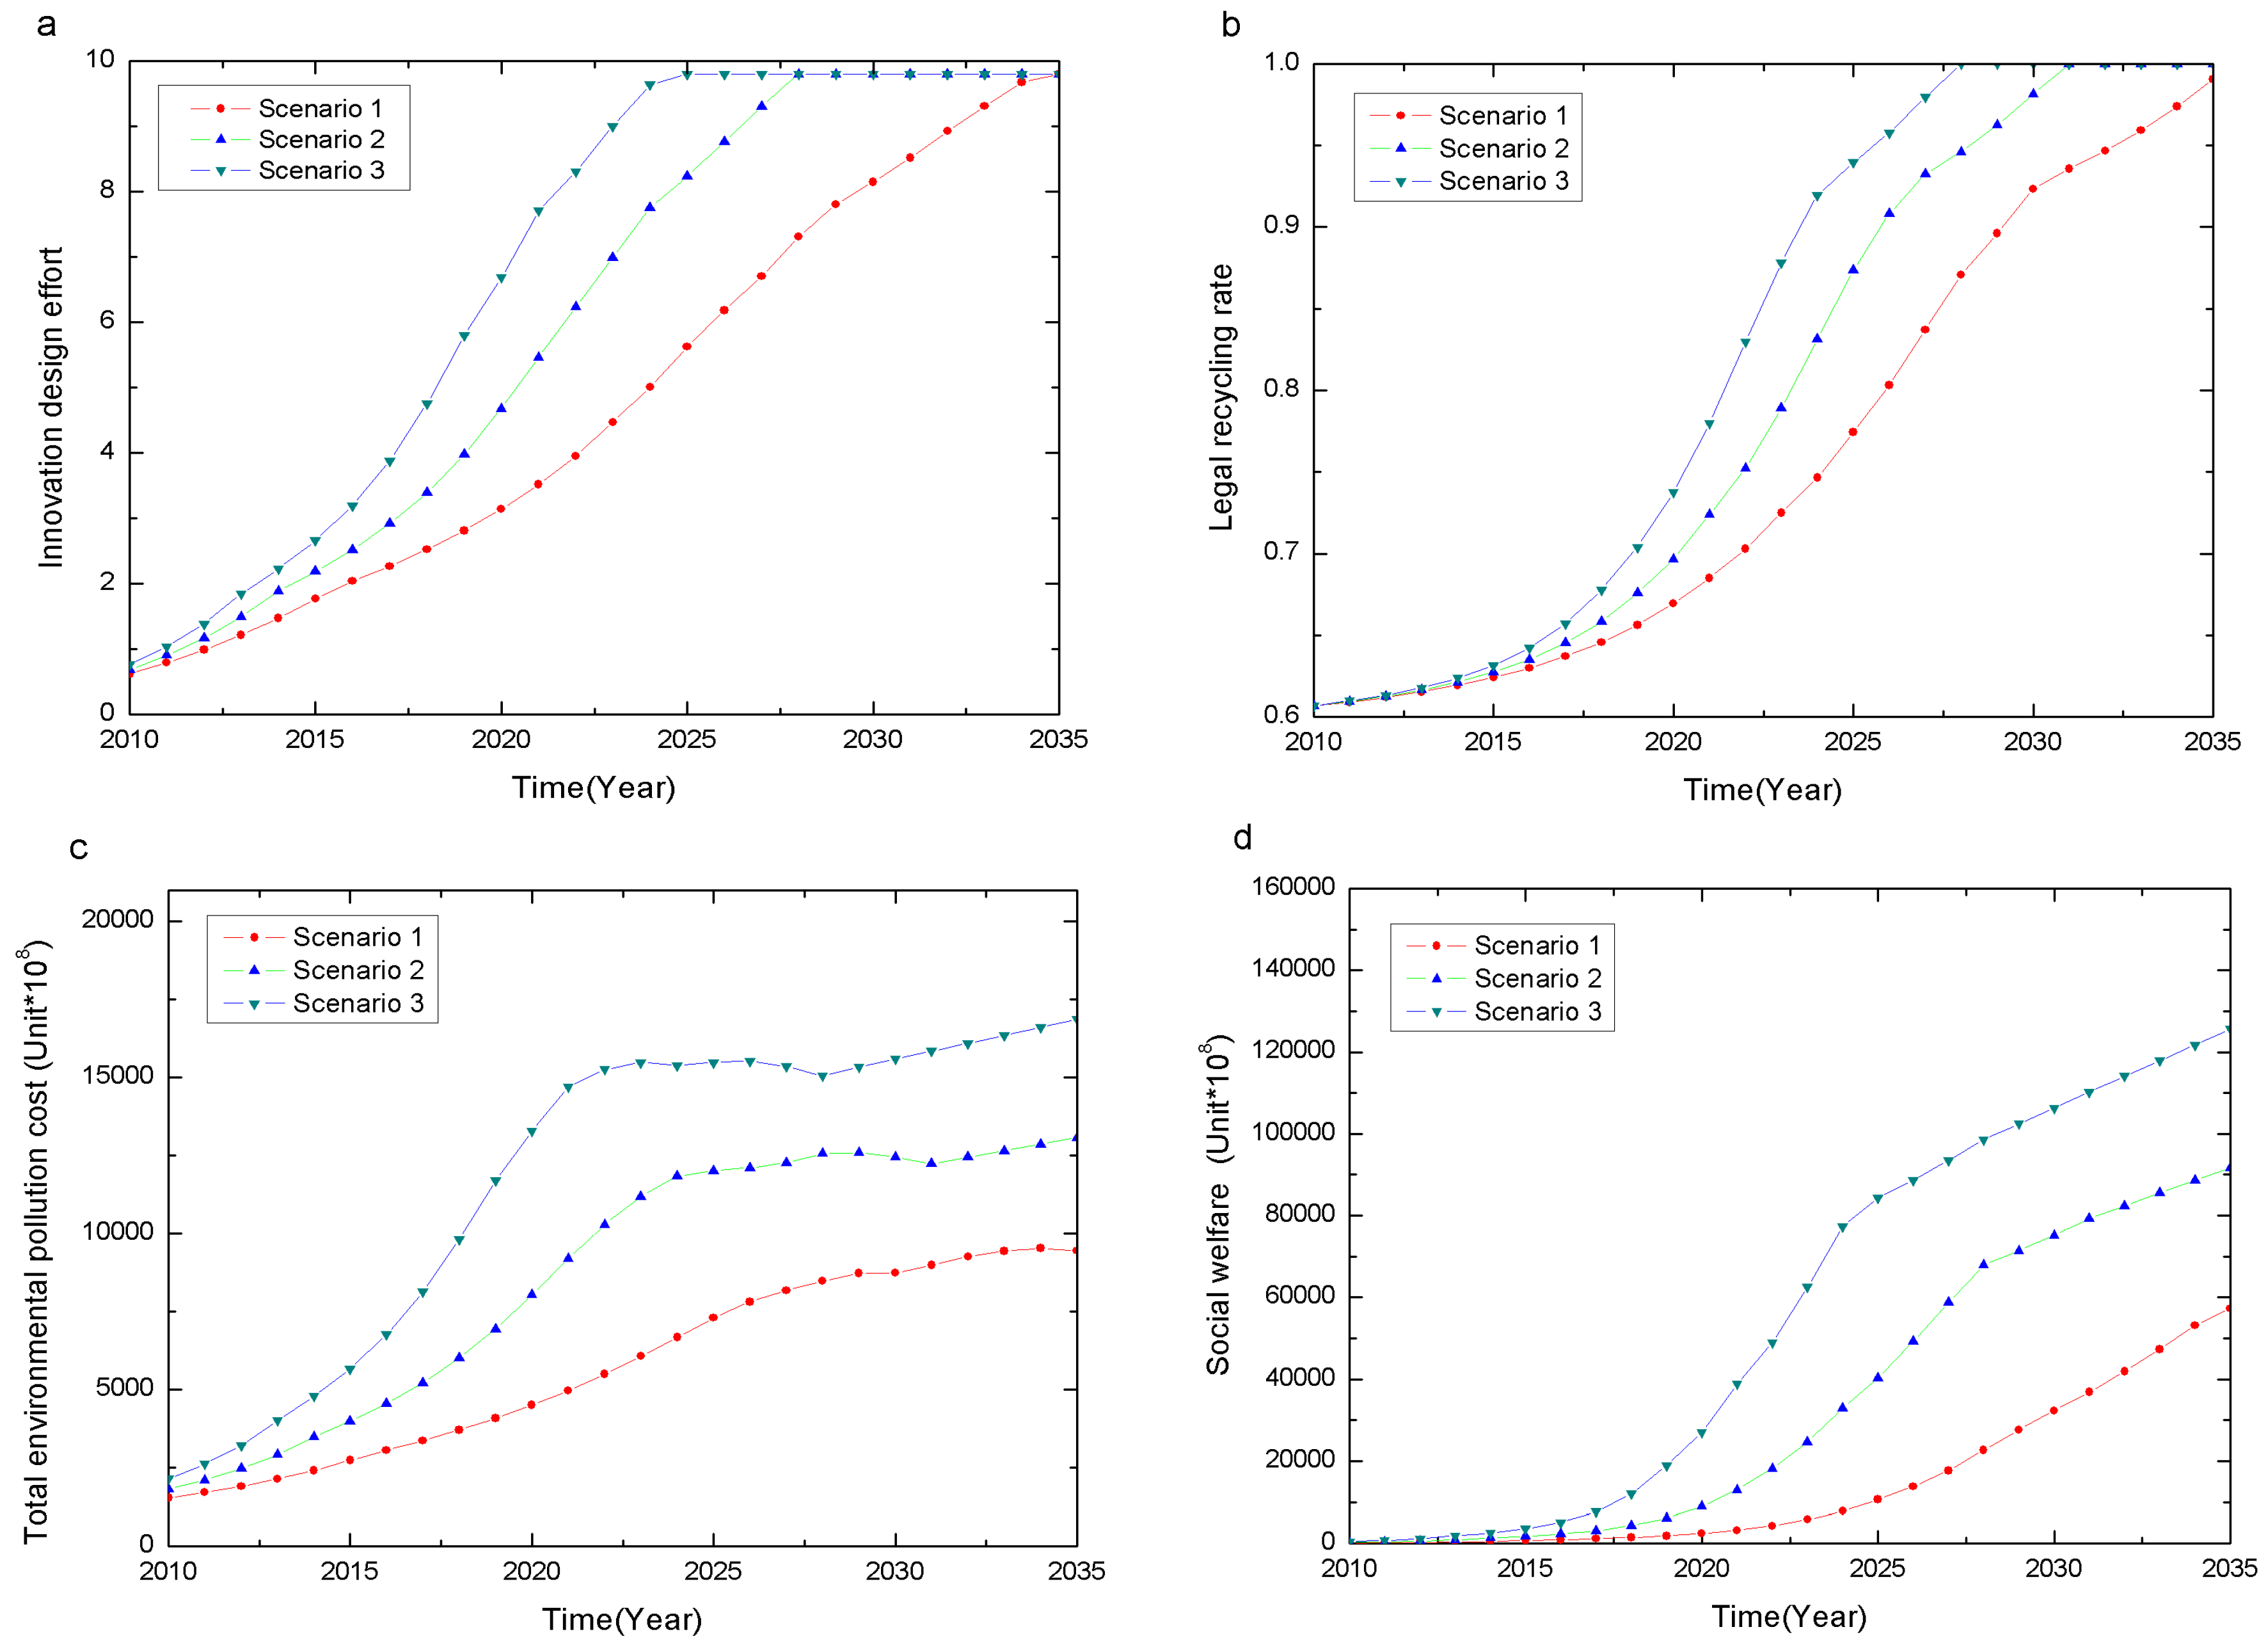
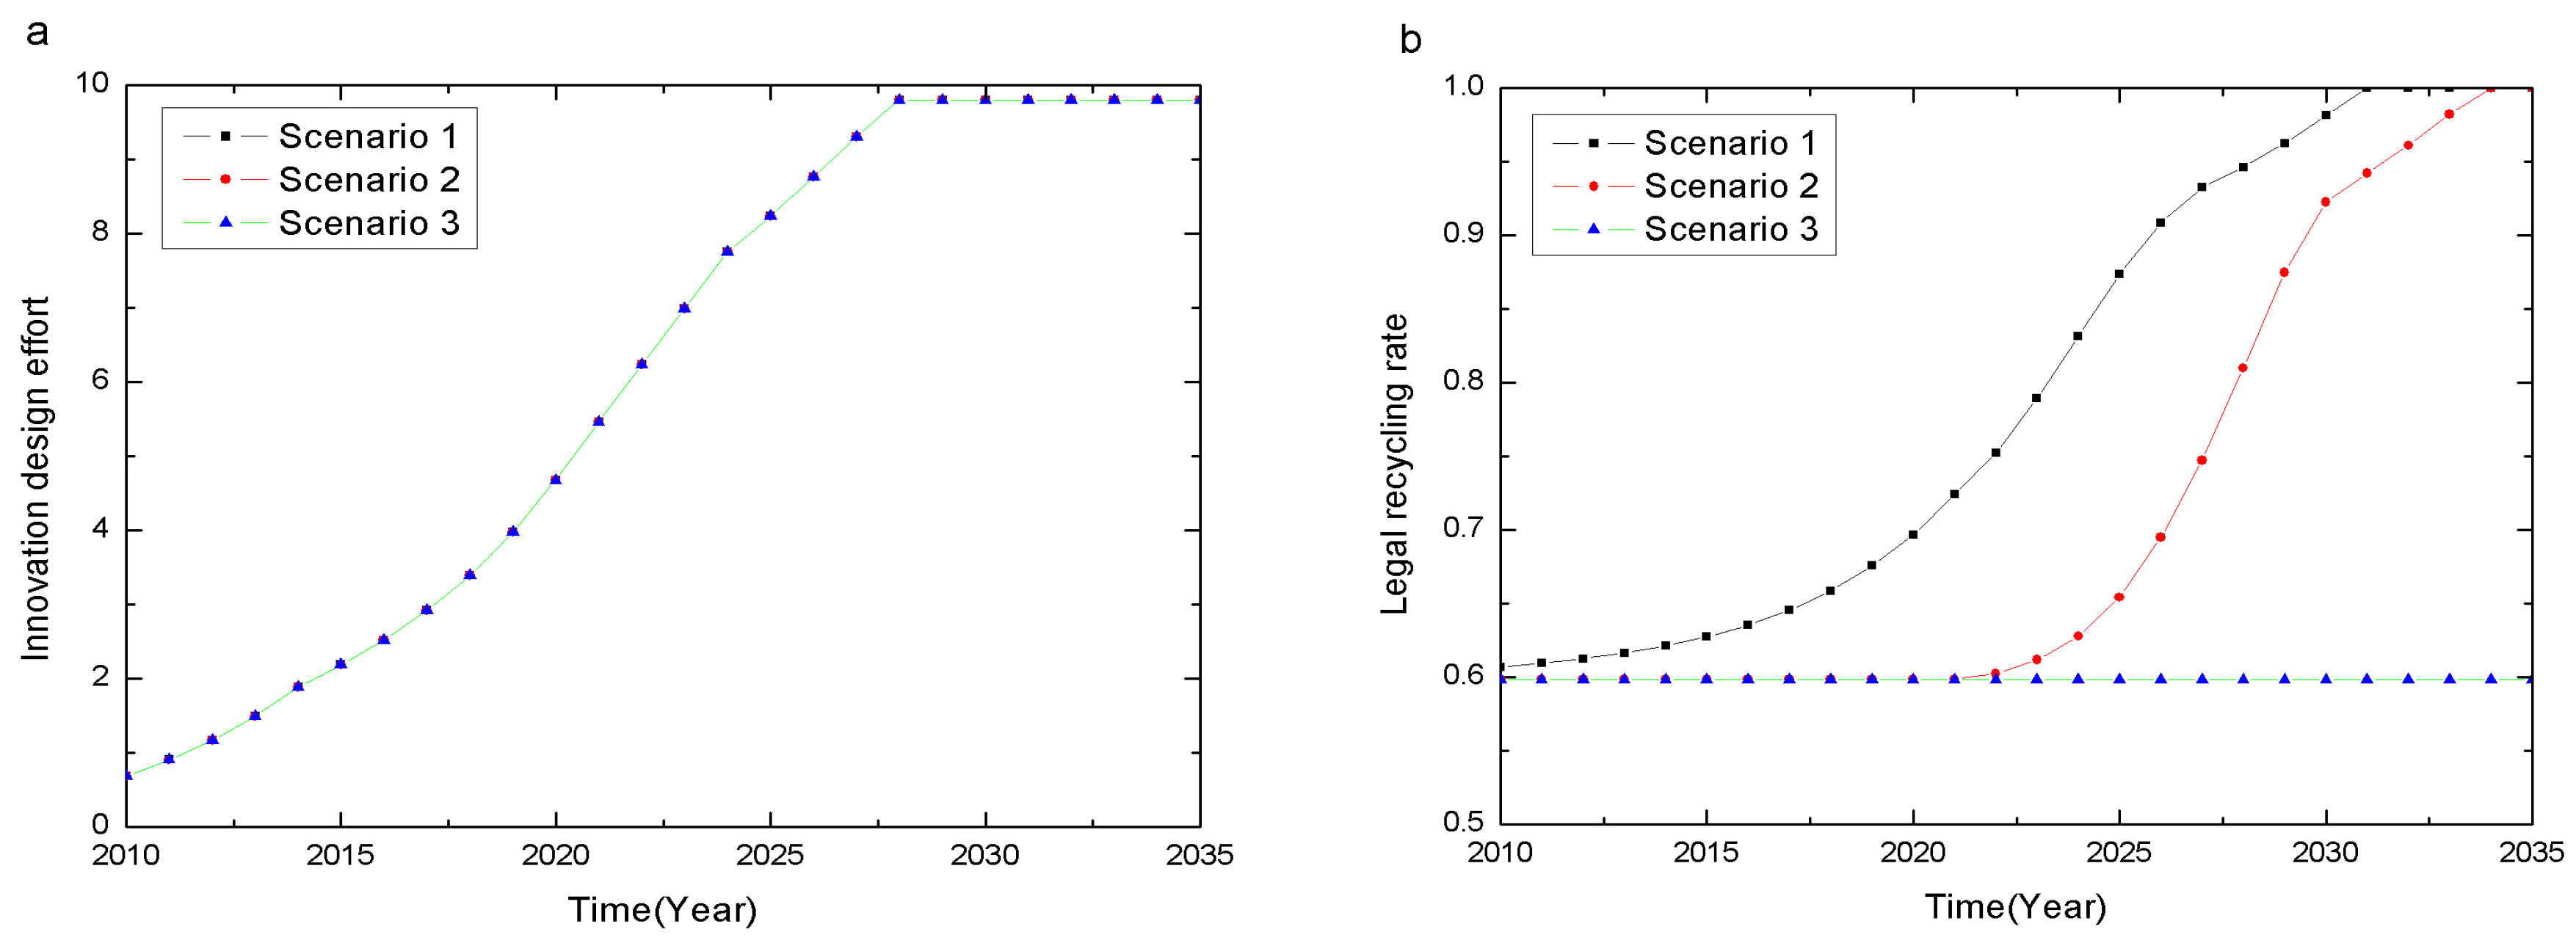
4.1.1. Preventative Impact

As described in Section 2.1, we use the innovation design effort to measure the manufacturer’s reduction effort. If the policy can enhance the manufacturer’s innovation design effort, it suggests that the manufacturer also puts greater effort into reducing recourse consumption and waste production. Thus, the subsidy policy has a better preventative effect. Figure 5 shows the simulation results.
As illustrated in Figure 5, the five lines of the different subsidies overlap and increase over 15 years. This indicates that the manufacturer’s innovation design effort is generally the same regardless of the degree of the subsidy. The manufacturer tends to put more effort into the innovation design over time until the effort reaches the maximum. This might be motivated by the manufacturer’s increased profit resulting from the innovation design, and profit is a major incentive for the manufacturer to pay even more attention to the innovation design. Therefore, we can draw Conclusion 1 as follows.
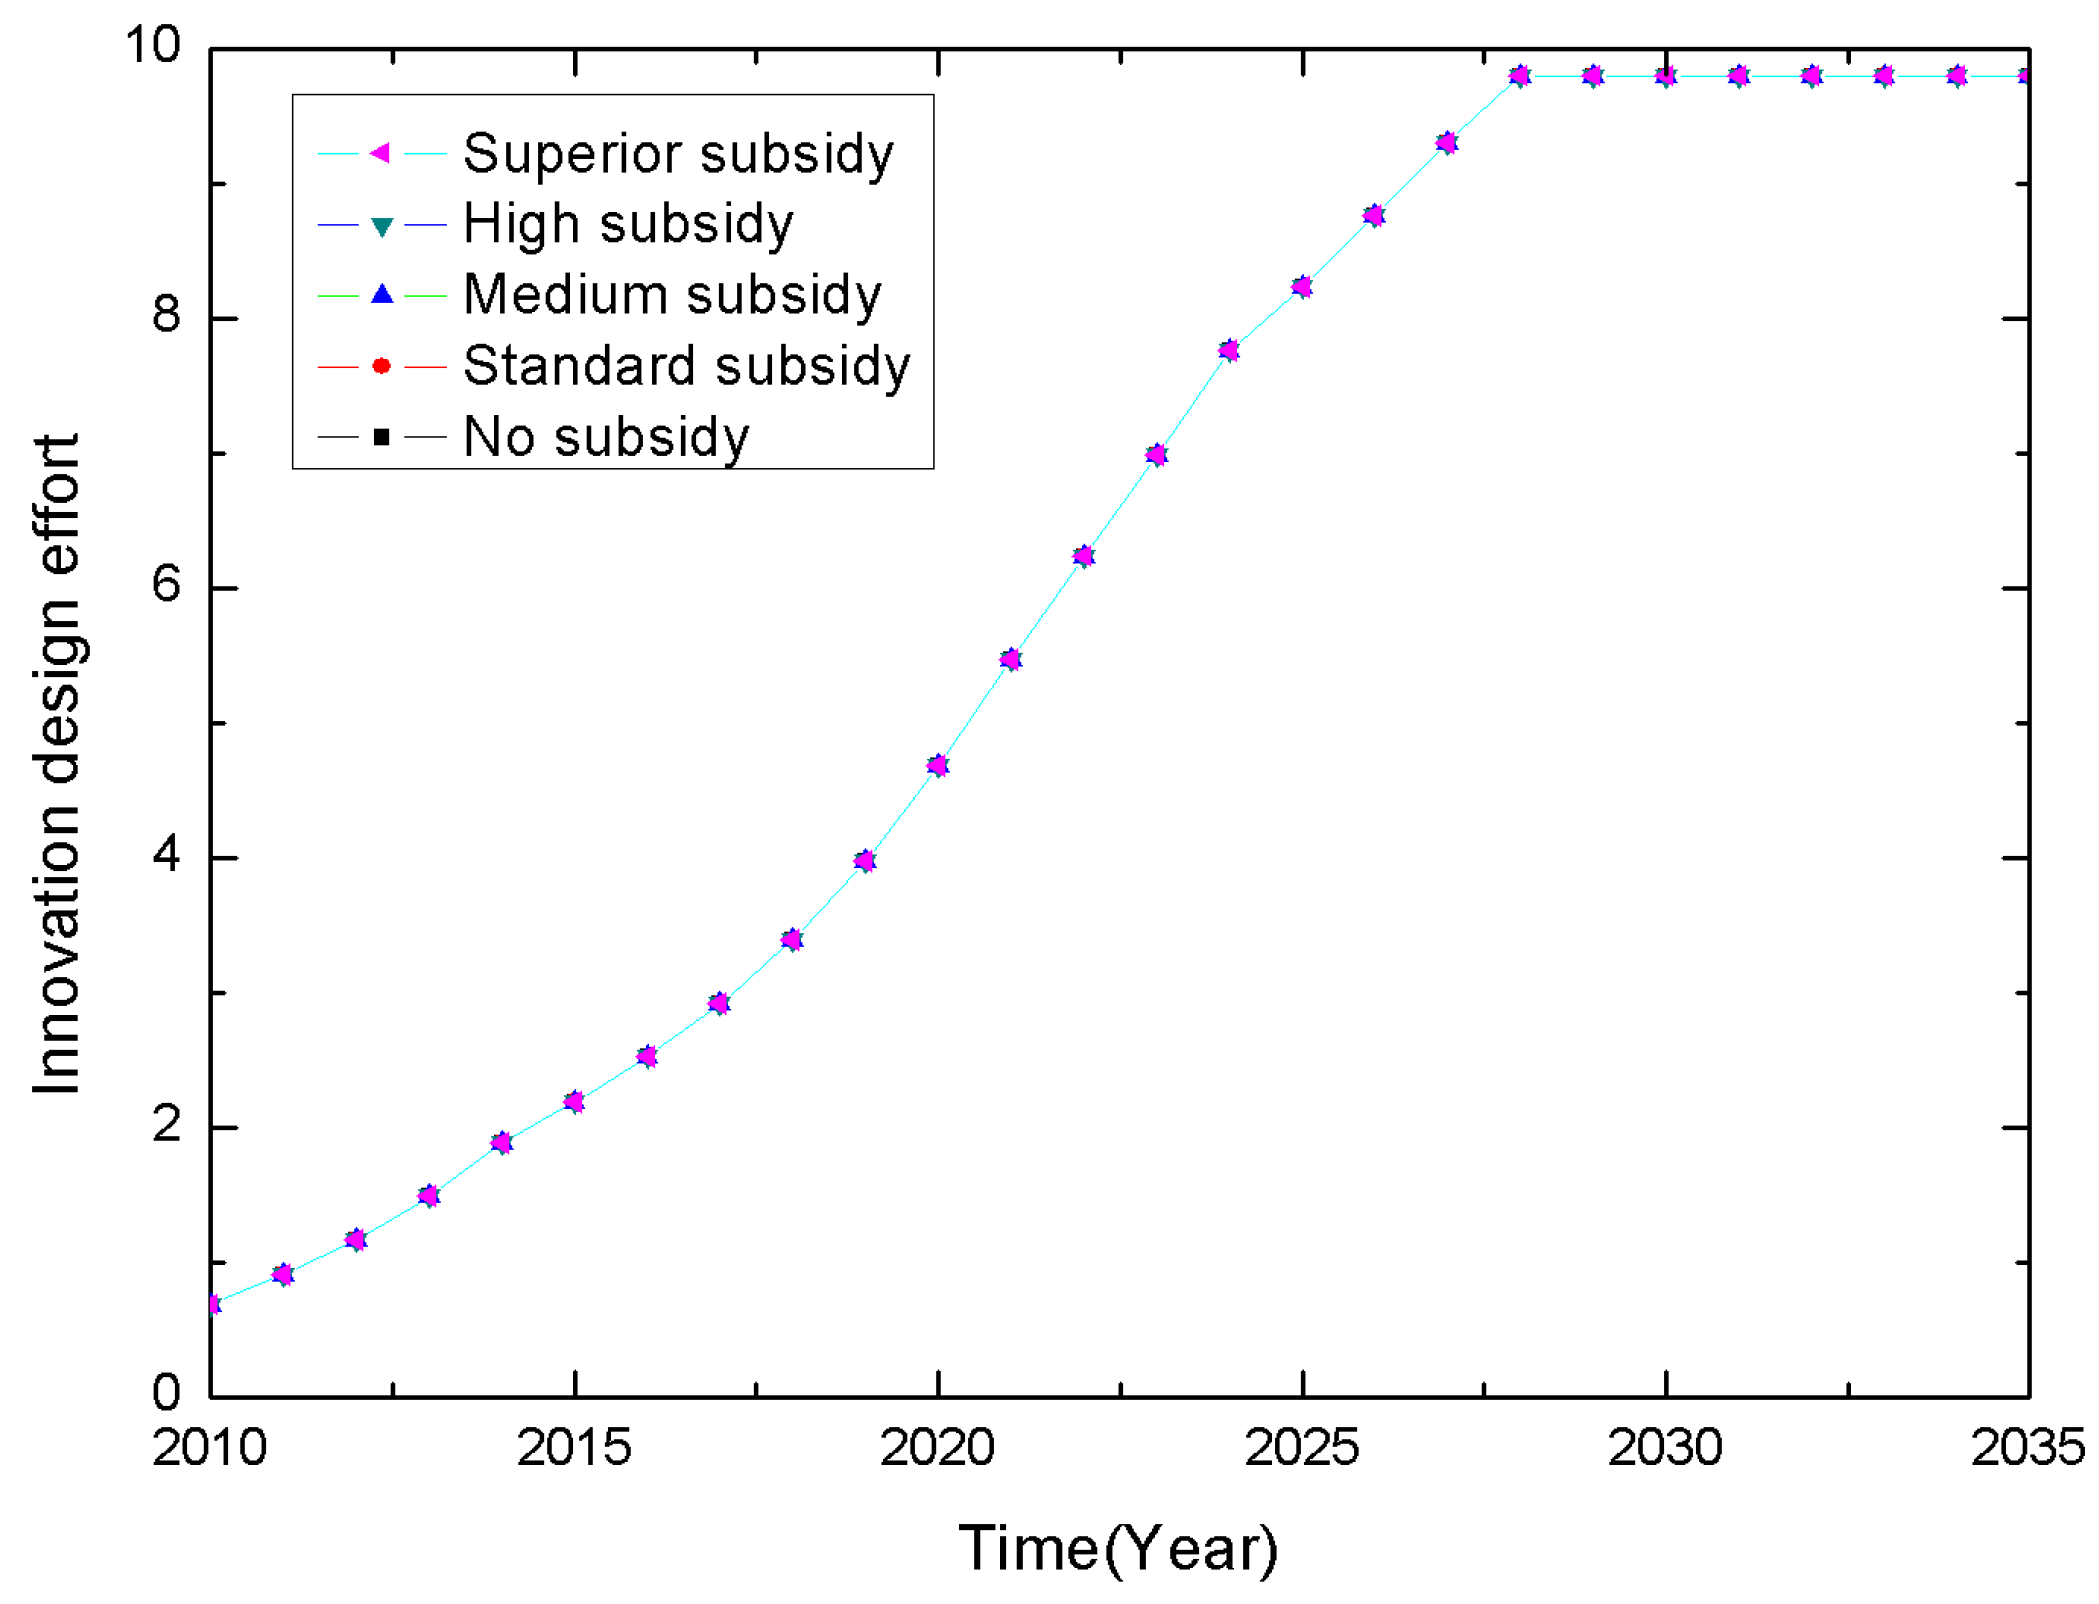
Conclusion 1: The CRS-policy motivates the manufacturer’s innovation design effort, but different subsidies have no significant preventative impact on the manufacturing stage.
The CRS policy mainly focuses on the recycling stage and has no incentive or penalty for the manufacturing stage. Therefore, it is not surprising that the different subsidies have an indifferent influence on the manufacturer’s design innovation effort or reduction effort. This finding is consistent with that of previous studies. For example, Atasu et al. [29] found that European Union (EU) waste electrical and electronic equipment (WEEE) recycling legislation does not motivate producers to invest more in environment design and to be more environmental friendly. To encourage manufacturers to pay more attention to recycling and reuse by concentrating on reductions at the source, the subsidy policy should also provide incentives and supervision for manufacturers.

4.1.2. Regenerative Impact

We use three indicators, the legal recycling rate, legal recycling quantity and illegal disposal quantity, to measure the regenerative impact of the CRS-policy on the recycling process. Figure 6 demonstrates the simulation results of the relationships between the five subsidies and the three indicators over time.
Figure 6 shows that when the subsidy is higher, the legal recycling rate (Figure 6a) and the legal recycling quantity (Figure 6b) increase, whereas the illegal disposal quantity (Figure 6c) greatly decreases. Specifically, when the subsidy increases (medium, high and superior subsidies), the legal recycling rate reaches its maximum faster, and the legal recycling quantity increases similarly over time. The same pattern applies to the illegal disposal quantity. When the subsidies are high (medium, high or superior), the illegal disposal quantity is much lower compared to that of the low subsidies (no or standard).
These observations indicate that when the subsidy is above a certain level, the marginal impact of the subsidy on the legal recycling quantity and the illegal disposal quantity is similar. This is mainly because that the legal recycling rate is already high enough when the subsidy is high, and as a result, the effect of the subsidy policy on the legal recycling quantity and illegal disposal quantity weakens. Therefore, the result suggests that from the regenerative perspective an optimal subsidy exists in the recycling and reuse stage.
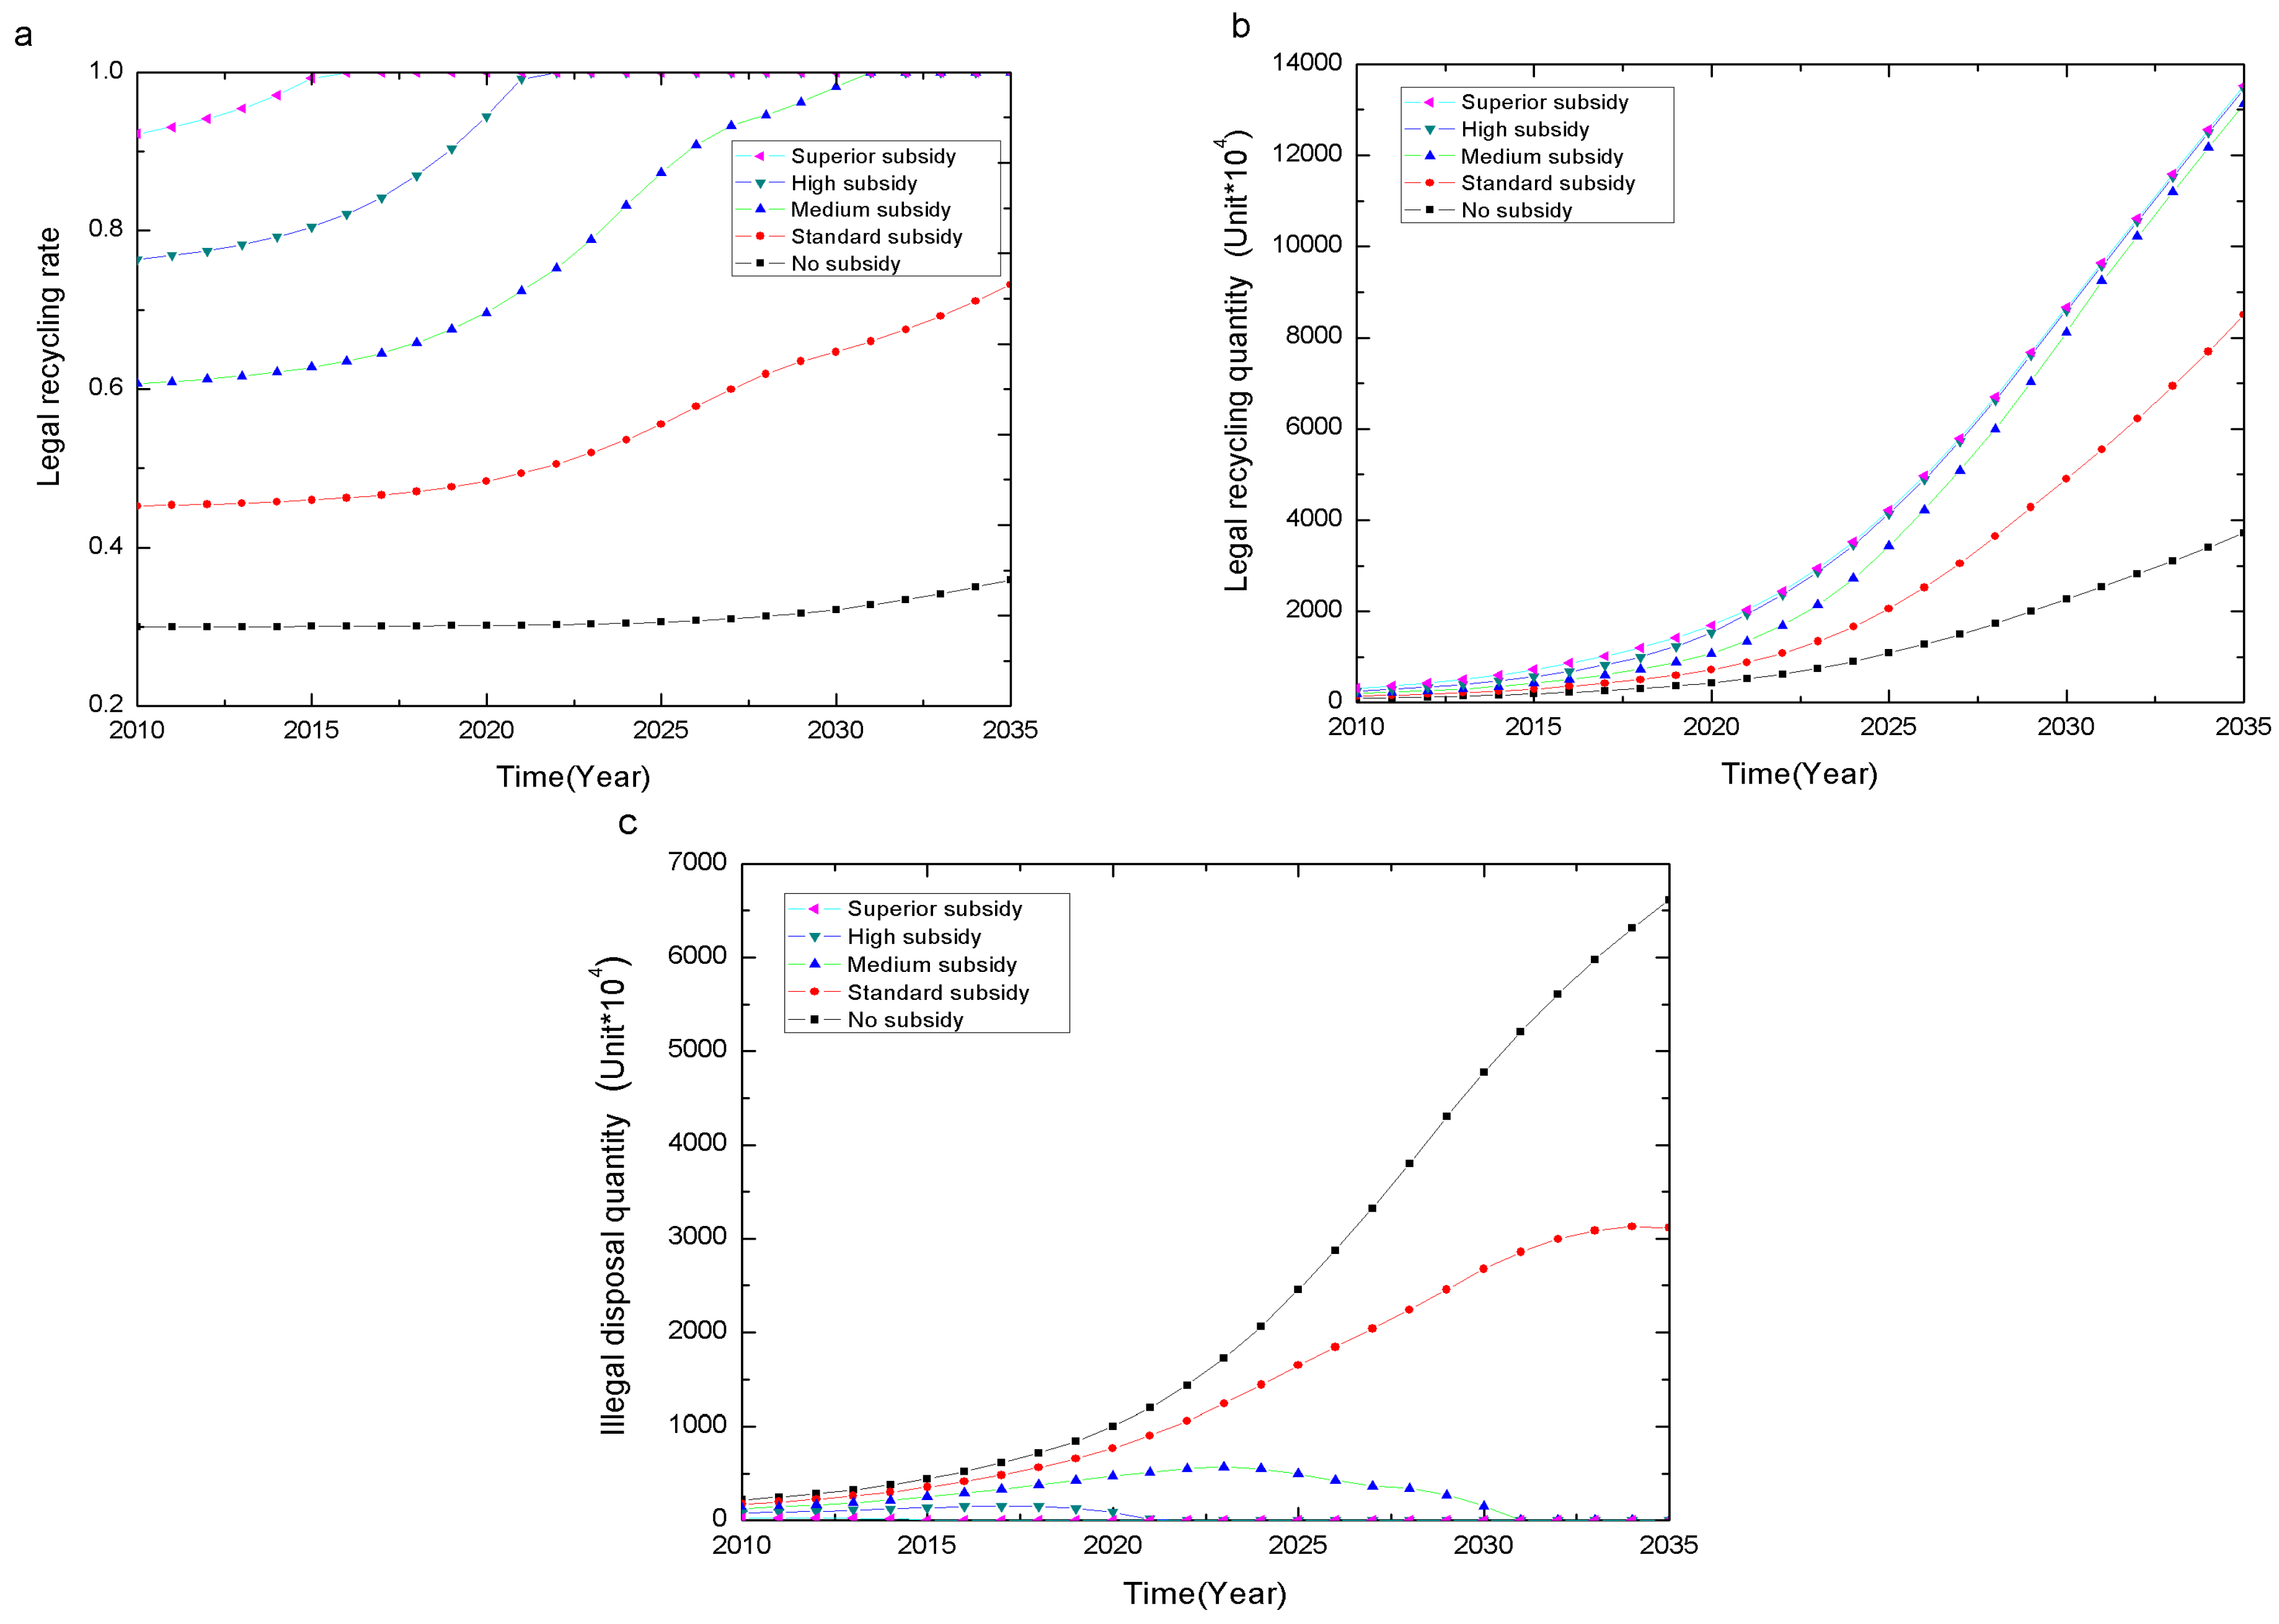
Conclusion 2: CRS-policy levels have a significant regenerative effect on the recycling and reuse stage, and an optimal subsidy exists.
Conclusion 2 confirms the subsidy practice common in many countries and regions in which the government implements a subsidy policy to encourage enterprises to actively participate in recycling and reuse. For example, the Taiwanese government implemented a Fund policy to subsidize and compensate recycling enterprises by charging manufacturers a waste disposal fee. In the United States, government subsidy policies vary from state to state, but generally, manufacturers or consumers are charged a fee to subsidize recycling and reuse [30].

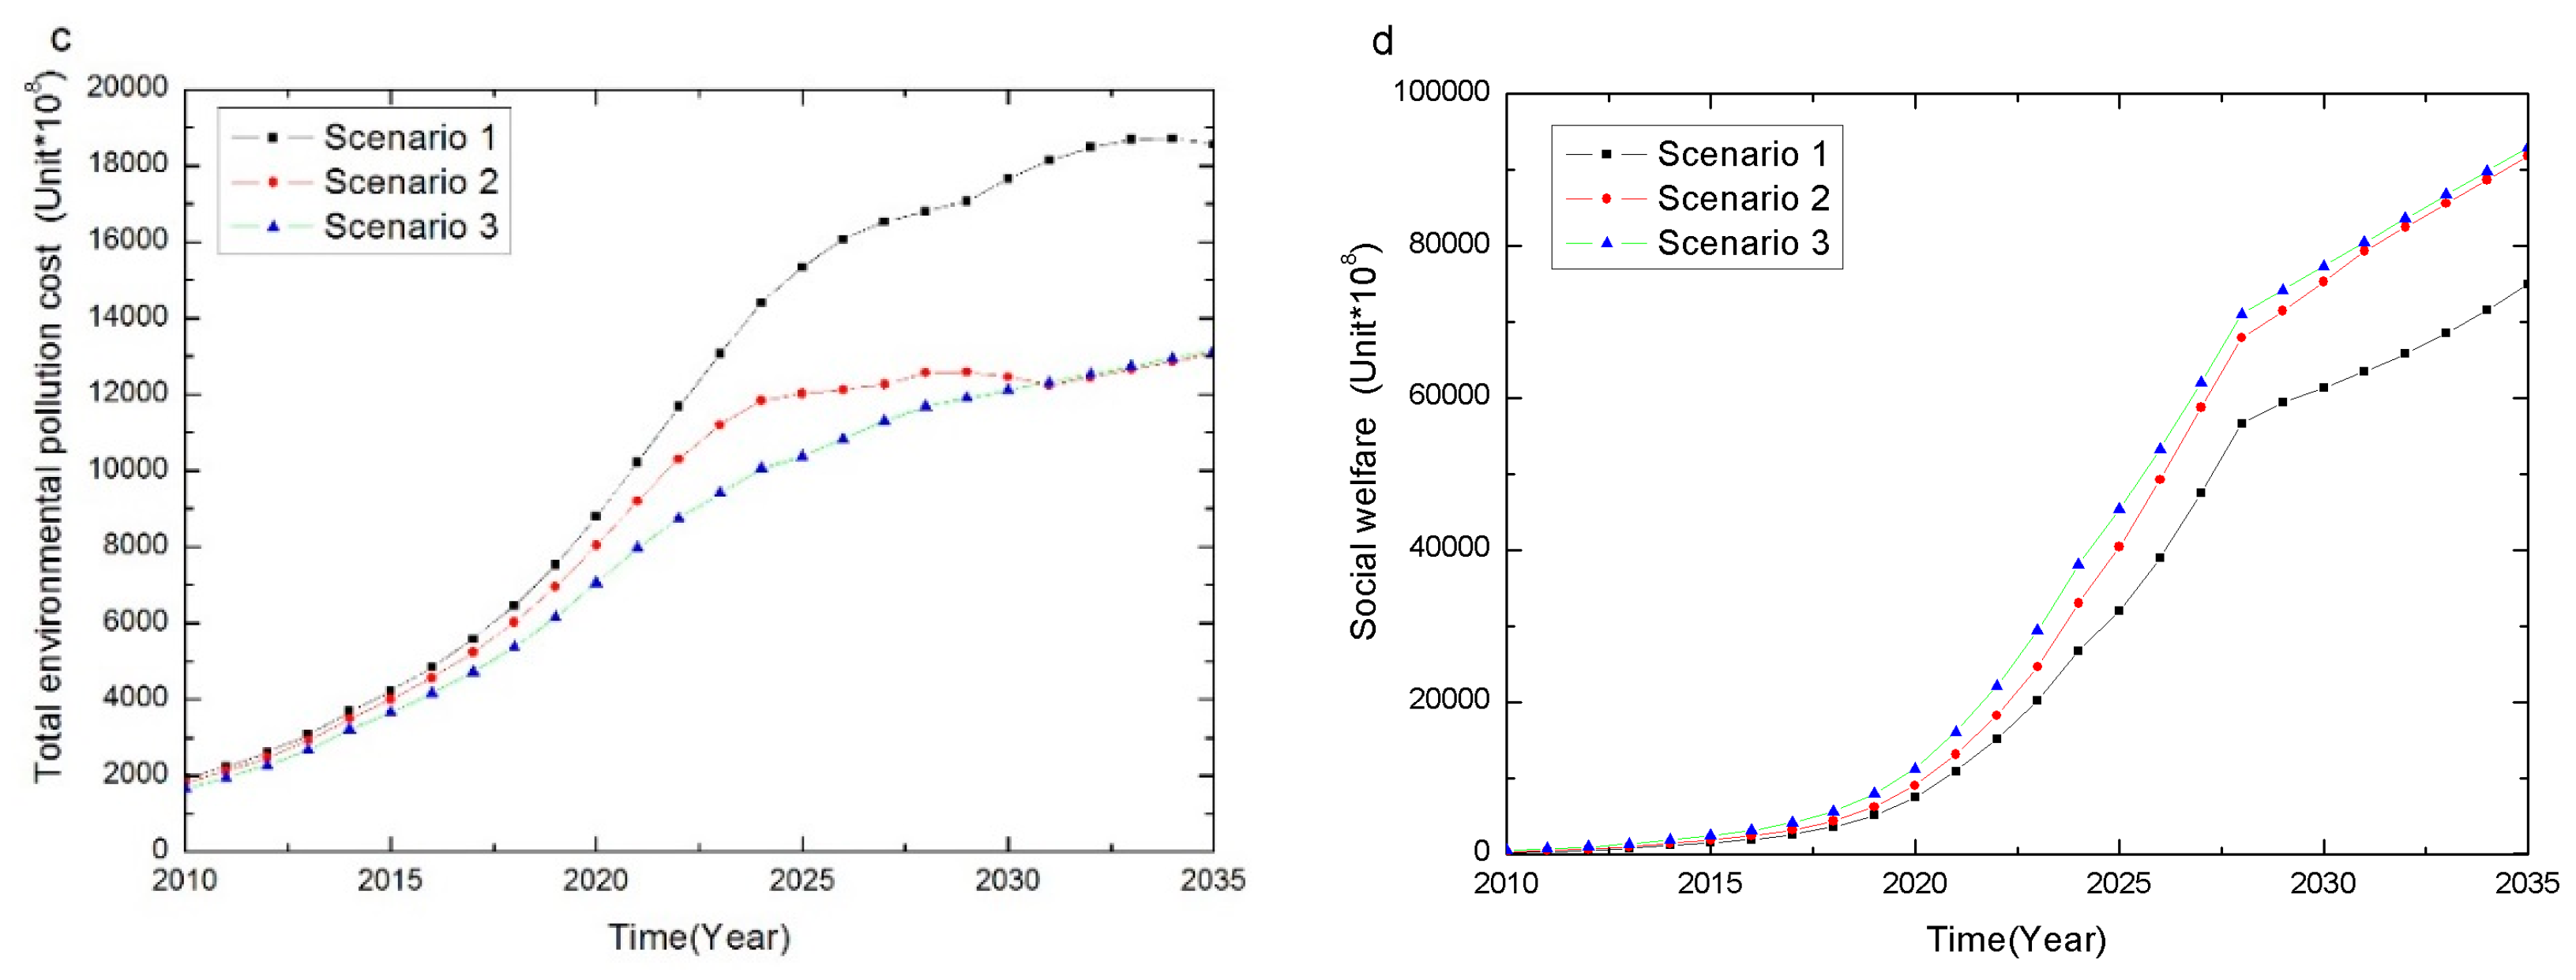
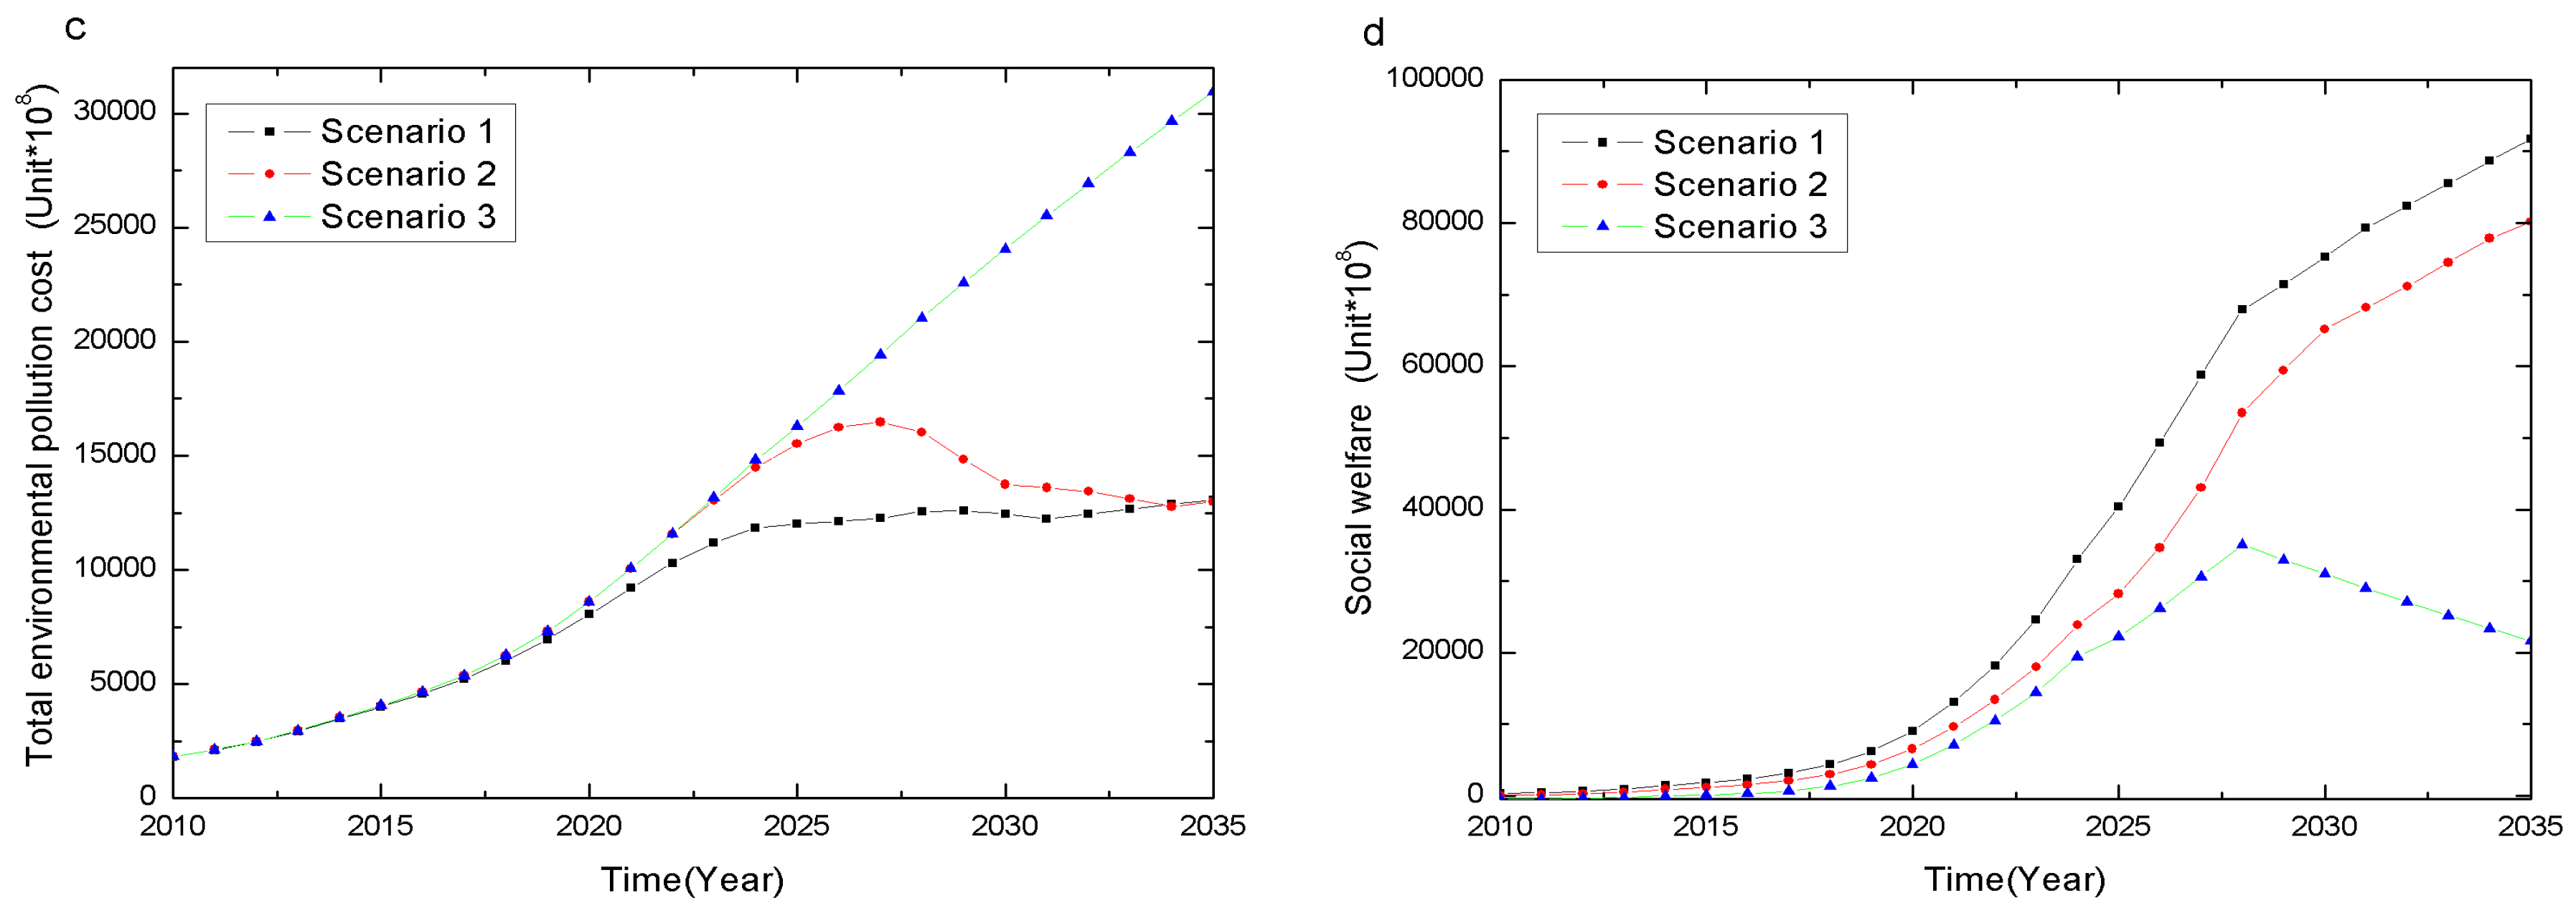
4.1.3. Environmental Pollution Cost

In this subsection, we select four indicators: the manufacturing environmental pollution cost (manufacturing EPC), the reuse environmental pollution cost (reuse EPC), illegal disposal environmental pollution cost (illegal disposal EPC) and total environmental pollution cost (total EPC), to measure the environmental effects of the CRS-policy. A larger indicator value represents a higher EPC in an activity. Figure 7 illustrates the simulation results.
We observe the following relationships between the four subsidies and the four types of EPC from Figure 7:
(1)
The different subsidies have the same impact on the environmental pollution cost in the manufacturing stage (Figure 7a) but have different effects on the other indicators (Figure 7b–d).
(2)
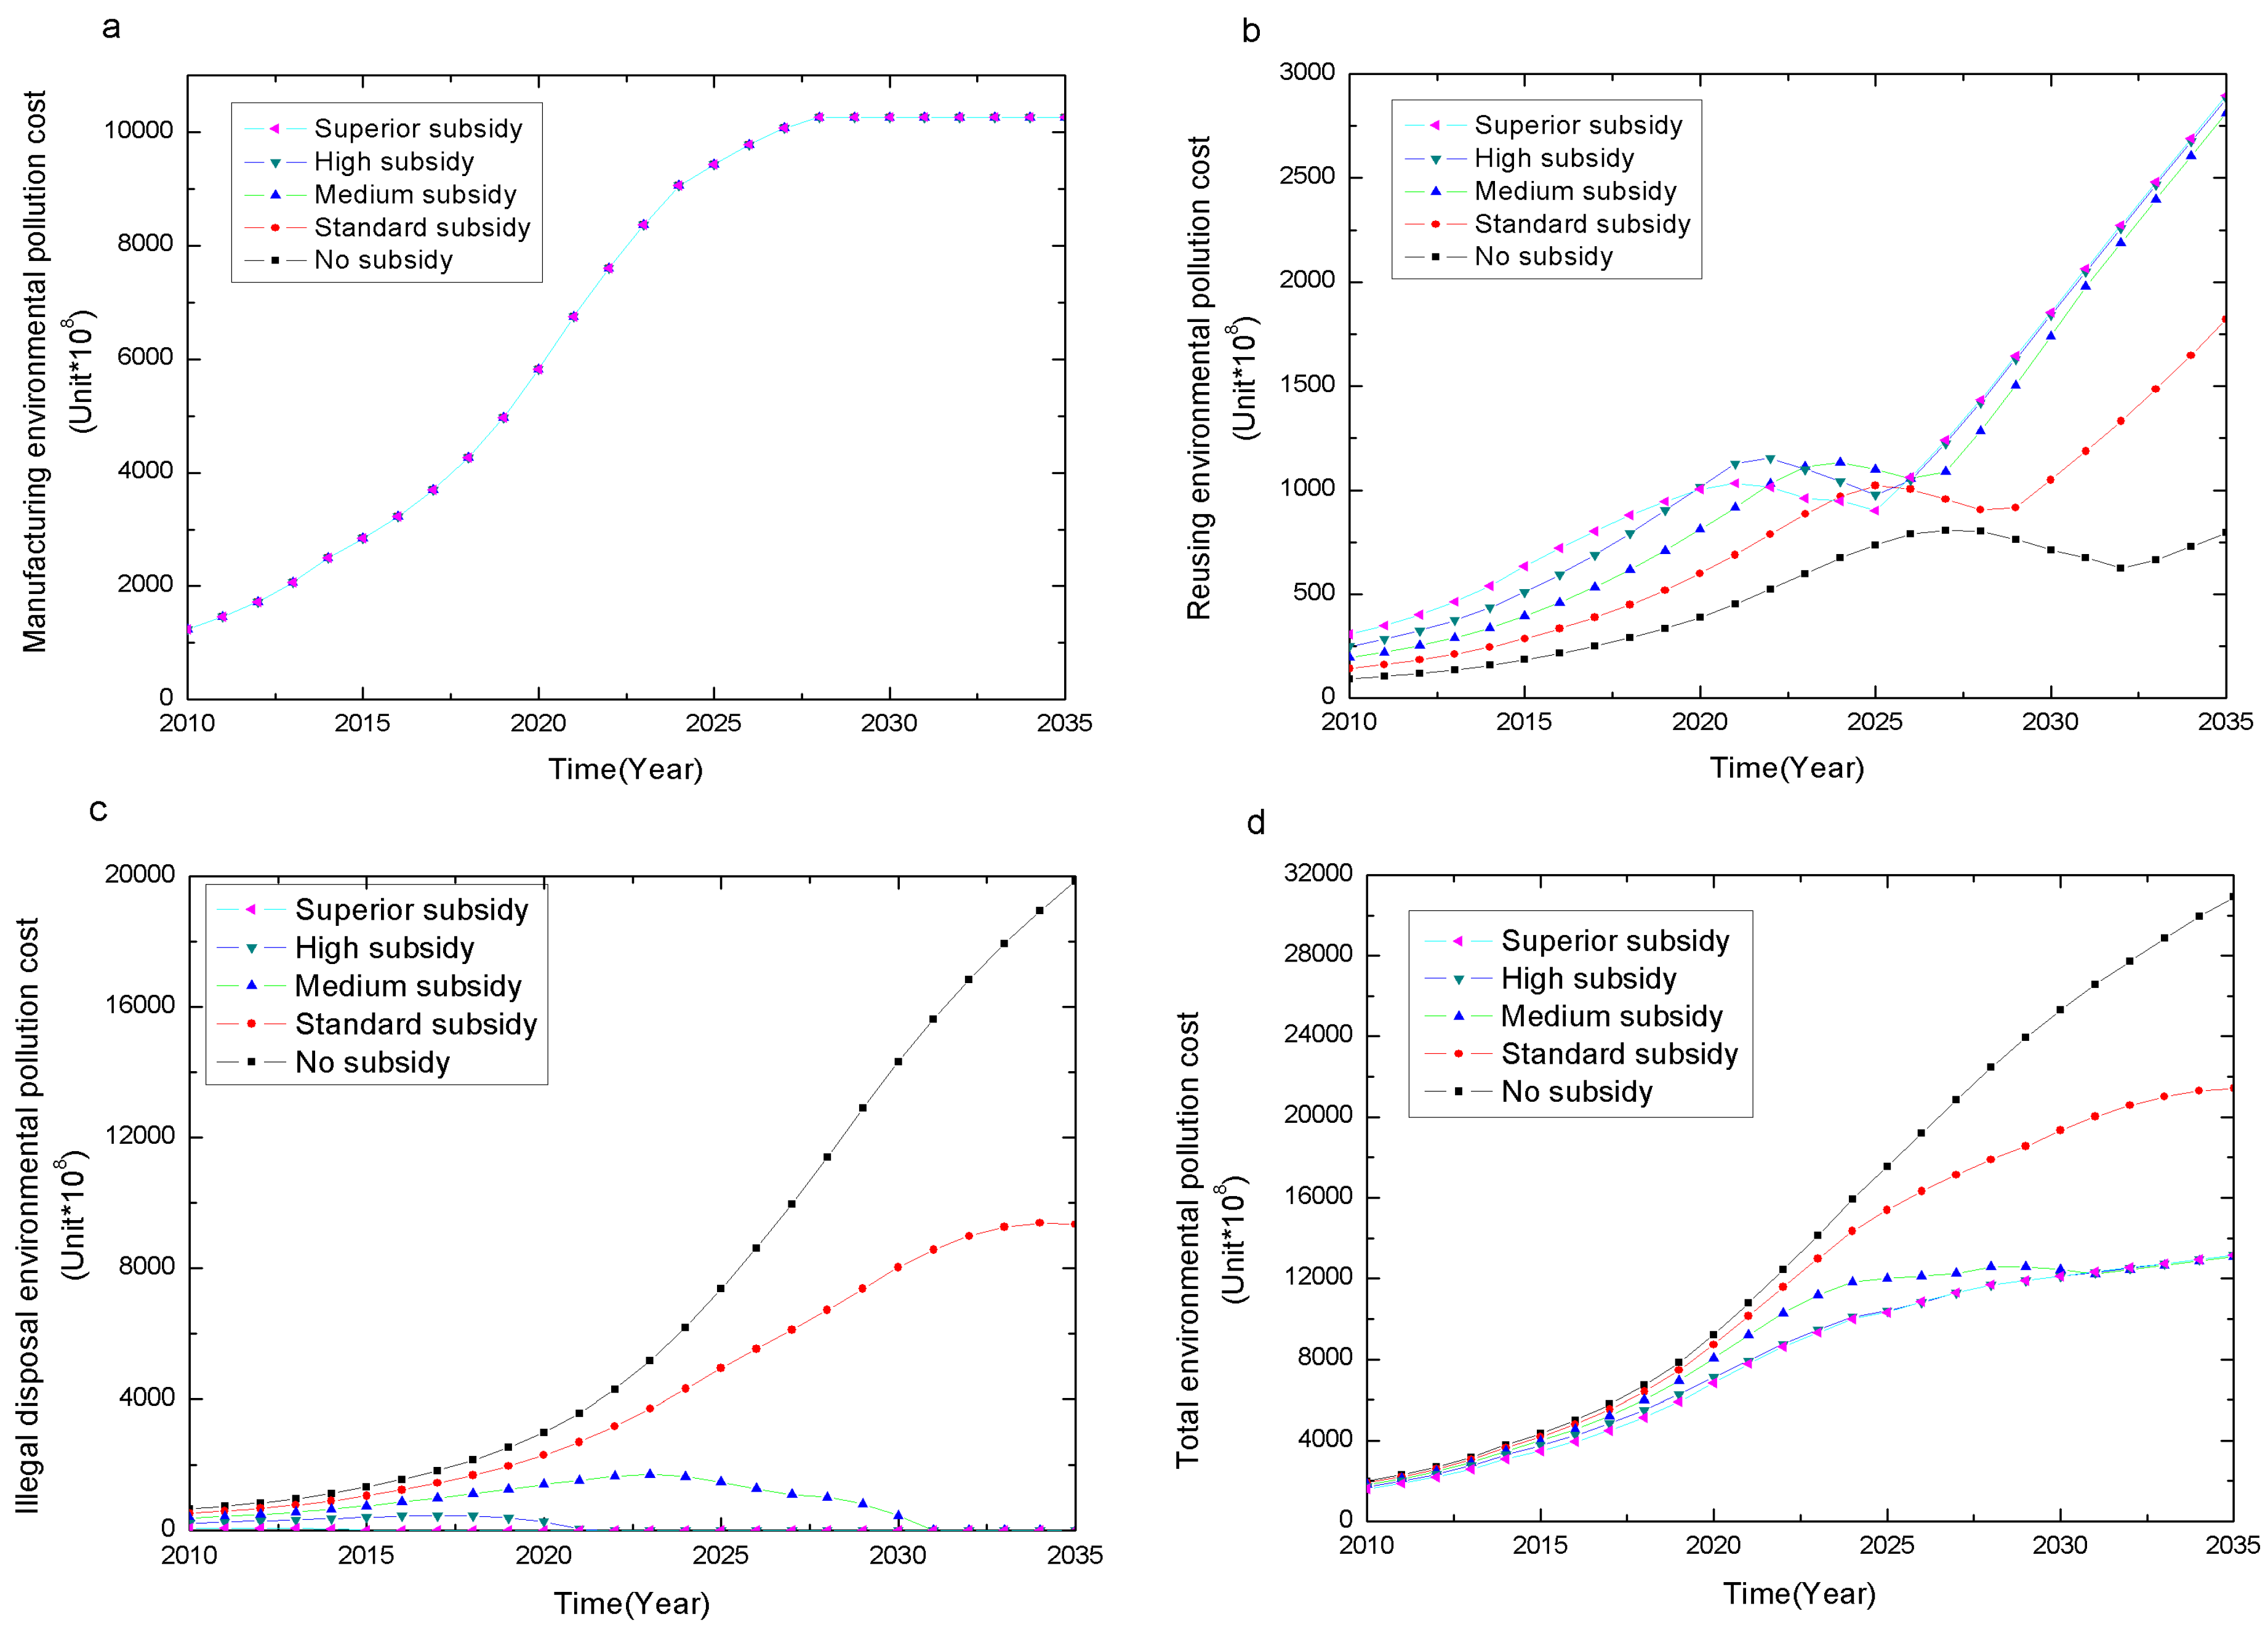
The Recycling or disposal process may cause pollution cost to some extent, referred to as negative environmental effects. Different subsidies levels result in the following changes in the reuse EPC (Figure 7b).
Between 2010 and 2020, there is a positive correlation between the reuse EPC and the subsidy amount. A higher subsidy leads to a higher reuse EPC.
Between 2020 and 2025, an optimal subsidy value S* exists in which the reuse EPC reaches its minimum. When the subsidy is lower than S*, there is a positive correlation between the reuse EPC and the subsidy amount, while when the subsidy is higher than S*, they have a negative correlation.
Between 2025 and 2035, there is still a positive correlation between the reuse EPC and the subsidy level. The high and superior levels overlap.
There are two turning points in each subsidy level curve in Figure 7b. For example, the superior subsidy policy has its first turning point around 2020, implying that the recycling and reuse technology may have been improved and leads to a significant decrease in the reuse EPC until 2025. The second turning point appears around 2025, when the recycling and reusing technology may have reached its limit, and unit reuse EPC may be stabilized at a constant value. Thus, the increased recycling quantity leads to a higher environmental pollution cost.
(3)
Figure 7c reveals a clear pattern that a relative high subsidy will dramatically reduce the illegal disposal EPC, and eventually eliminate the illegal disposal EPC in the long term. The increasing illegal disposal EPC is incurred from the no or standard subsidy policies, suggesting that relative low subsidy policy is not effective in reducing illegal disposal EPC in the long run.
(4)
For the total EPC shown in Figure 7d, the subsidy incurs growing total EPC over time, but the higher subsidy tends to result in a much lower total EPC. Between 2010 and 2025, the superior subsidy leads to the lowest total pollution. Between 2025 and 2029, the high subsidy has the minimum overall pollution. Between 2030 and 2035, the middle subsidy has the minimum overall pollution. This finding implies the existence of a critical point of industry development, denoted by D. When industry development does not reach the critical point D, the higher subsidy generates less overall pollution. However, when industry development reaches the critical point D, an optimal subsidy S* exists that has the minimum overall negative environmental effect.
Conclusion 3: CRS-policy levels have no significant different impact on reducing environmental pollution at the manufacturing stage, but significantly affect reuse and illegal disposal environmental pollution, as well as overall environmental pollution. When the development of the recycling industry reaches a certain degree D, an optimal subsidy S* with the lowest overall environmental pollution exists. This optimal subsidy is negatively related to the industry development.
Conclusion 3 indicates that the government may consider the following suggestions while designing a subsidy policy, especially when recycling and reuse have negative environmental effect.
(1)
In the initial stage of industry development, the government should offer high subsidies. When the industry development has reached a more advanced stage, an optimal subsidy should be proposed with simultaneous considerations of recycling, legal and illegal disposal, and improvement in the reuse process technology.
(2)
The policy should provide incentives to recyclers to adopt more environmentally-friendly technology, to improve reuse process and to reduce negative environmental effect of the reuse activities.

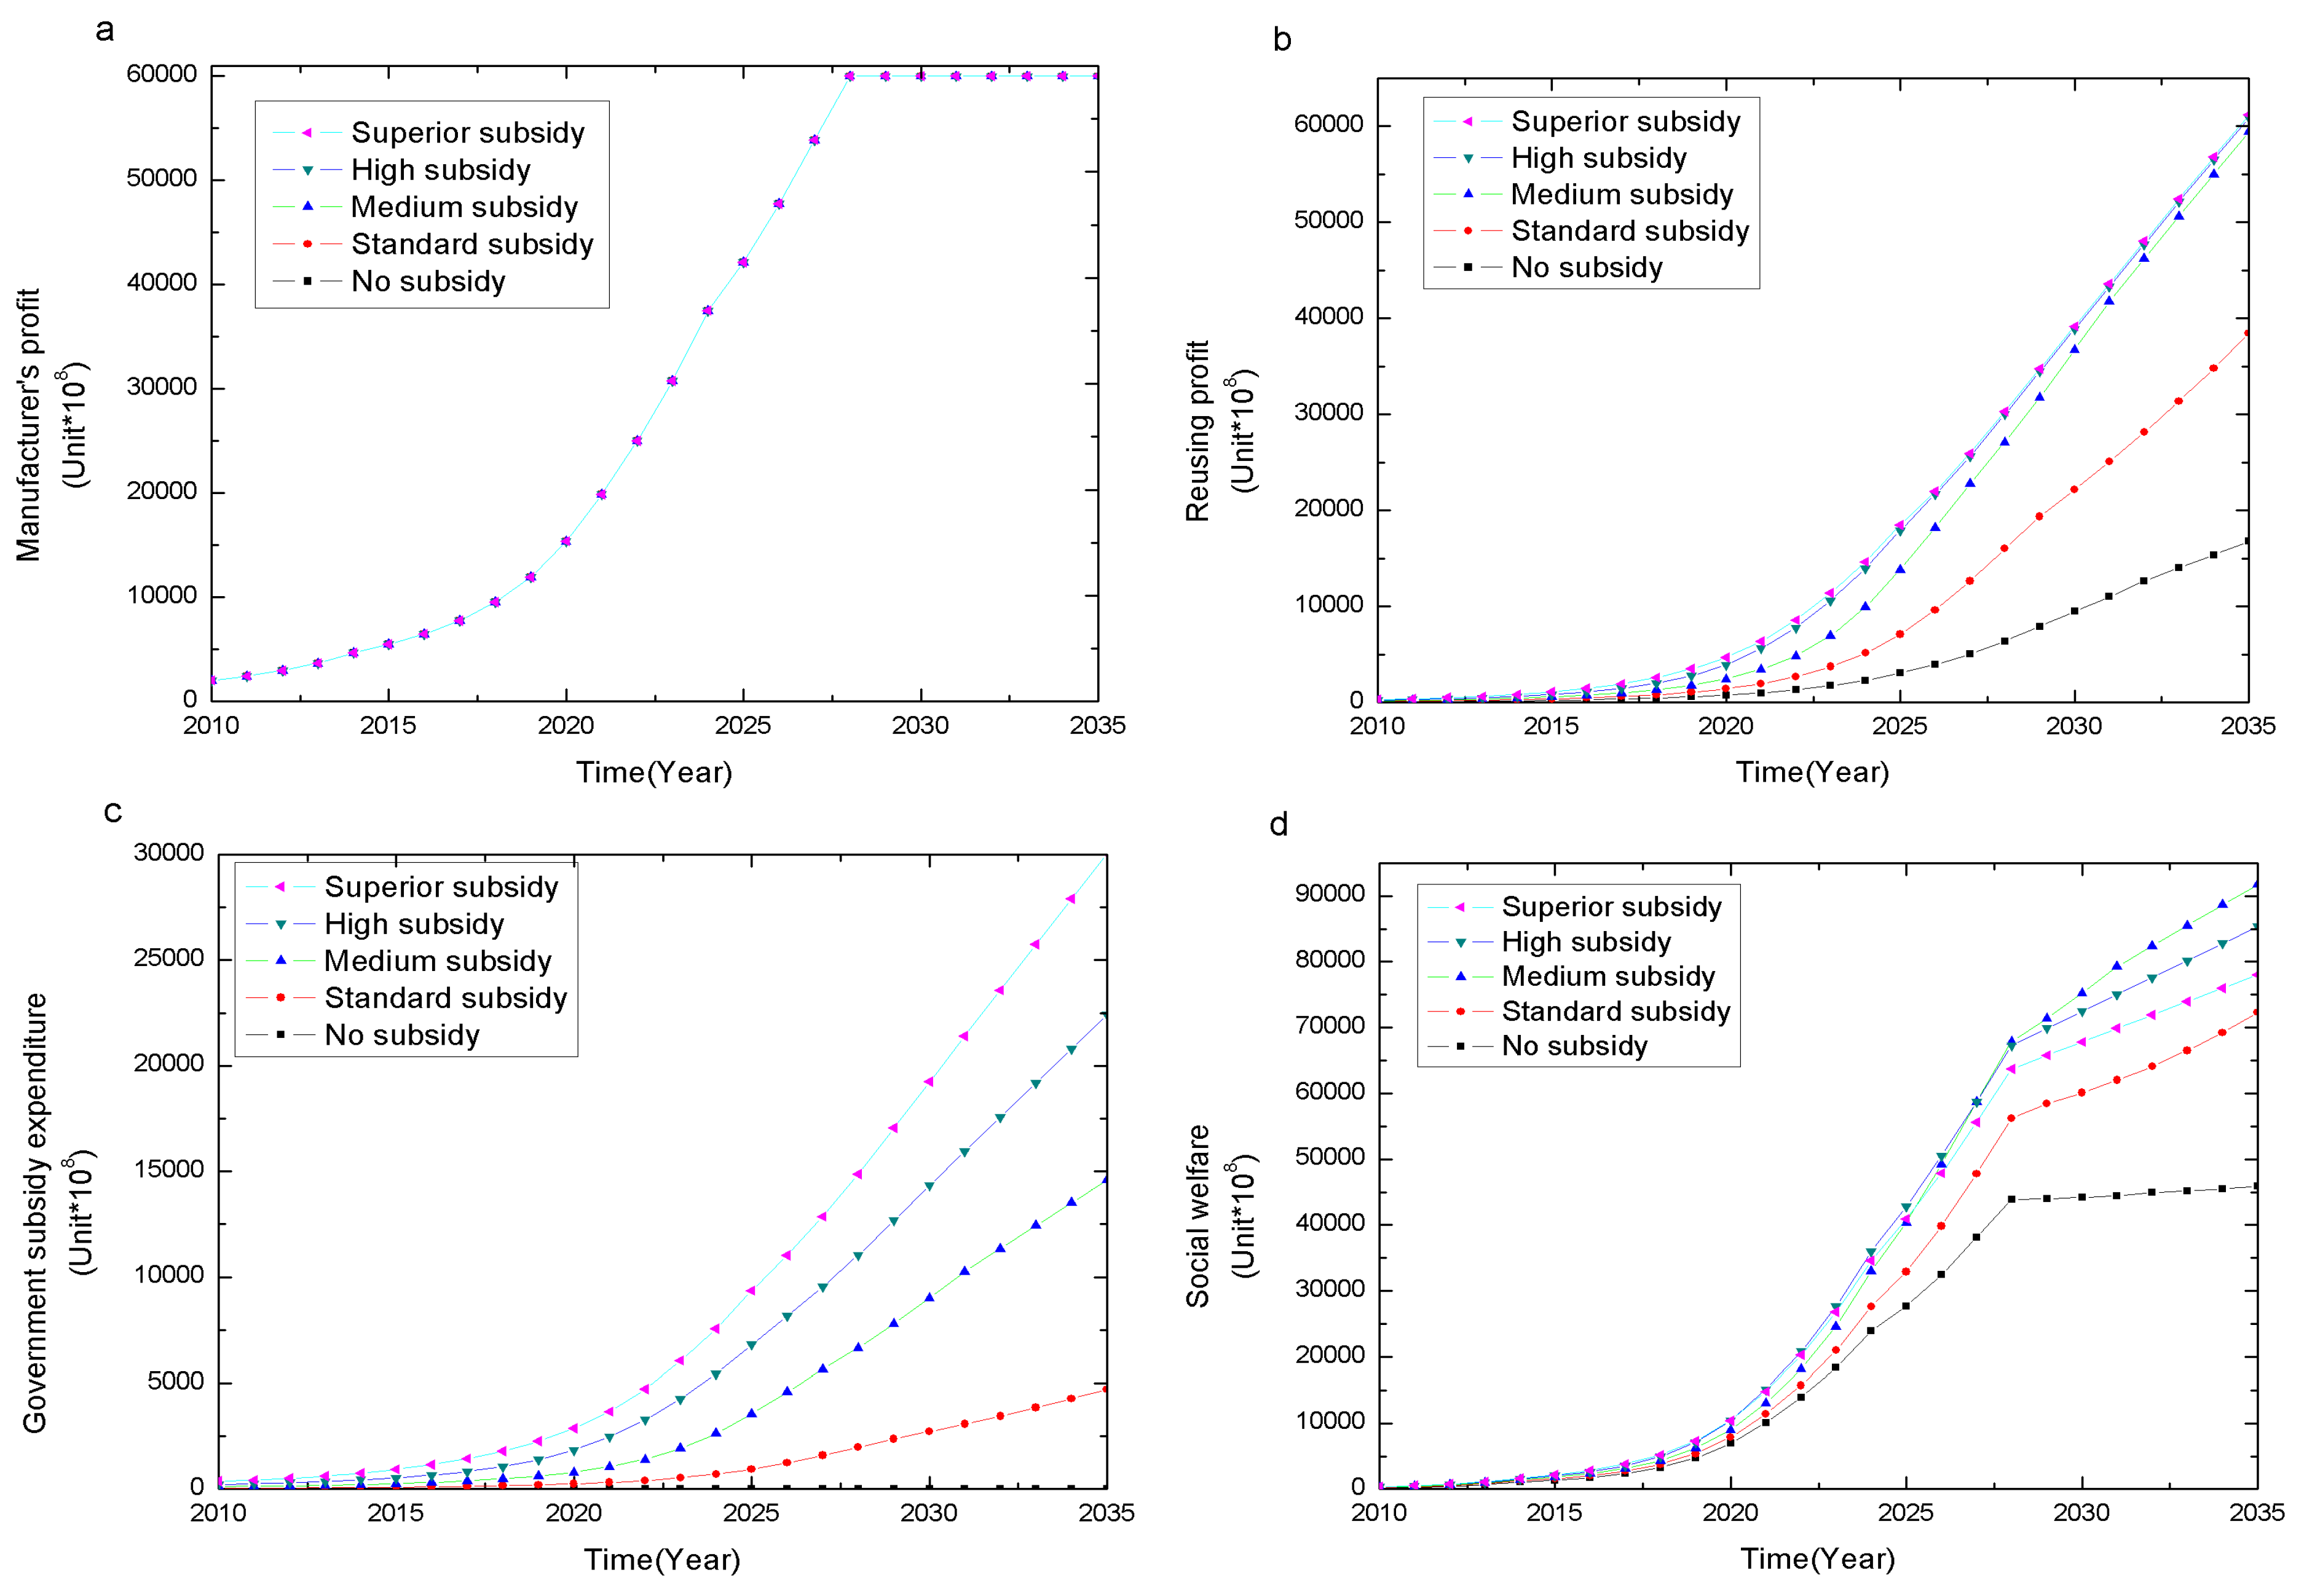
4.1.4. Economic and Social Welfare

Four indicators are chosen to measure the effects of the CRS-policy on economic and social welfare: manufacturer’s profit, recycler’s profit, government subsidy expenditure and social welfare. Figure 8 displays the simulation results.
Figure 8 shows that different subsidy policy levels do not have different impacts on the manufacturer’s profit (Figure 8a) but influence the recycler’s profit, the government subsidy expenditure and social welfare differently (Figure 8b–d). In particular, the increased subsidy results in higher reuse profit and government subsidy expenditure. The impact of the subsidy level on social welfare varies across the time periods as follows.
Between 2010 and 2020, there is a positive correlation between the subsidy levels and social welfare. A higher subsidy leads to higher social welfare.
Between 2020 and 2025, an optimal subsidy level S* exists, where social welfare is the highest. When the subsidy is lower than S*, there is a positive correlation between the subsidy levels and social welfare, while when the subsidy is higher than S*, they have a negative correlation.
Between 2025 and 2035, another optimal subsidy S** exists where social welfare is the highest and S** < S*. The turning point in 2028 in Figure 8d is caused by the constant production of the new product.
Conclusion 4: CRS-policy levels have no significant different impact on the manufacturer’s profit but significantly affect the recycler’s profit, government subsidy expenditure and social welfare. When the development of the recycling industry reaches a certain degree, an optimal subsidy exists with the highest social welfare. This optimal subsidy is negatively related to industry development level.
Similar recommendations are made based on Conclusion 4. In the early stage of industry development, the government should offer a high subsidy. When industry development has reached a more advanced stage, an optimal subsidy should be proposed with simultaneous considerations of the policy’s economic effects, environmental effects and government financial expenditure. This optimal subsidy may decrease gradually as the industry develops.

4.2. Analysis of the Market Factors’ Impact

Numerous market factors contribute to the effectiveness of the subsidy policy, such as the innovation environment in the manufacturing stage, consumer environmental awareness in the usage stage, consumer sensitivity to the subsidy in the recycling stage and the profitability of the recycling and reuse industry. In this section, we aim to investigate and further understand how the policy can effectively respond to changes in the market’s environment.
To investigate the relationship between the market factors and the effectiveness of the CRS-policy, we select four indicators: the manufacturer’s innovation environment, consumer environmental awareness, consumer sensitivity to the recycling subsidy and the recycling and reuse industry profit. The simulation was undertaken with a fixed subsidy of 20% (the medium subsidy in Section 4.1).

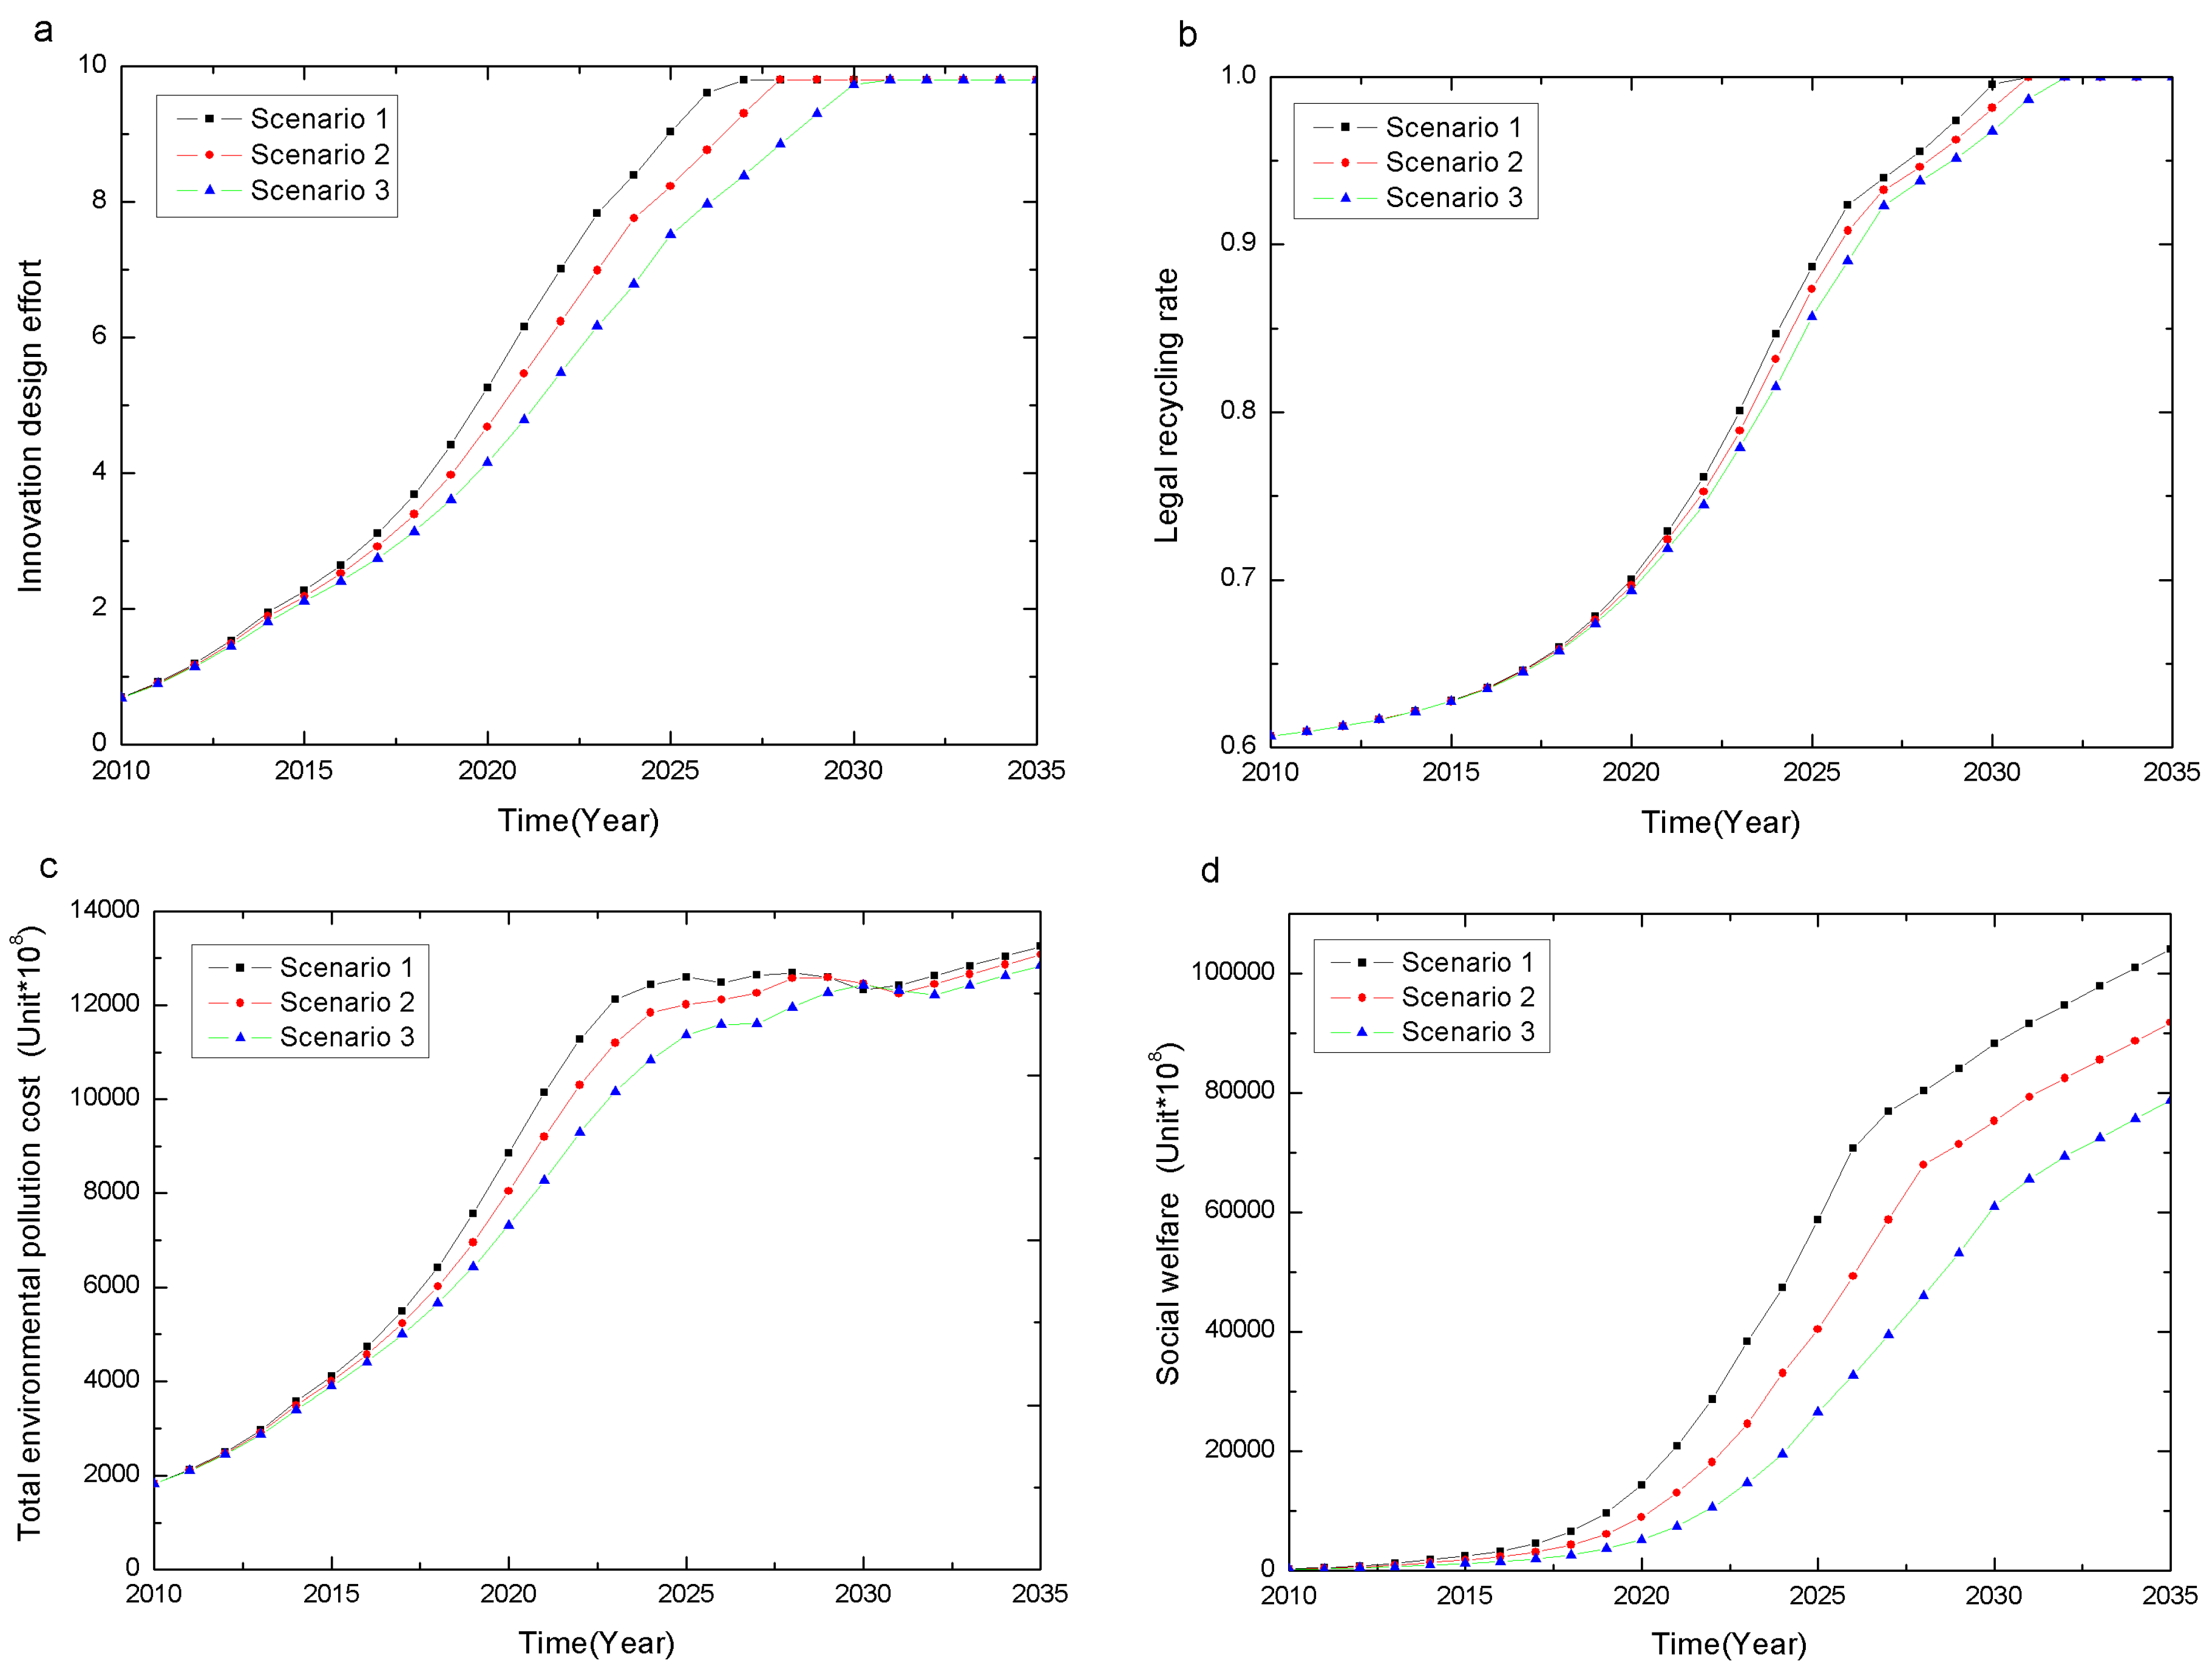
4.2.1. The Innovation Environment

Conclusion 1 mentioned that CRS-policy levels have no significant different impact on the manufacturer’s innovation design behavior. Similarly, we are also interested in examining how the innovation environment affects manufacturer’s innovation design behavior, and further impacts the effectiveness of the subsidy policy in recycling and reuse, environmental performance and social welfare.
We use de2 to represent the innovation cost defined in Section 3. A larger value of d indicates higher manufacturer innovation cost and a worse innovation environment, which discourages the manufacturer from innovating. We conduct the simulation with d as 0 (Scenario 1), 100 (Scenario 2) and 200 (Scenario 3) to represent low, medium and high innovation difficulty, respectively. Figure 9 illustrates the simulation results.
The results demonstrate that the manufacturer’s innovation design effort, legal recycling rate, overall environmental pollution cost and the social welfare will be lower when the innovation difficulty increases (Figure 9a–d). This finding implies that an inferior innovation environment in the upstream industry inhibits the growth prospects of the whole industry, and low difficulty in the innovation environment is always desired.
Conclusion 5: Improvement in the upstream innovation environment would enhance the effectiveness of the CRS-policy in the manufacturing and recycling and reuse stages.
Therefore, we recommend the government improve the innovation environment for manufacturers and motivate them to put more effort into designing innovation and reducing waste at the manufacturing stage. The legal recycling rate will increase, and the CRS-policy will contribute positively to social welfare, although the total environmental pollution cost is slightly higher.

4.2.2. Consumer Environmental Awareness

Consumer environmental awareness (CEA) represents consumer sensitivity to the product’s green image in the usage stage. If consumers prefer products with a greener image, we conclude that consumer environmental awareness affects sales demand positively. We simulate three CEA levels: 0.8, 1 and 1.2, the greater value indicates higher CEA. Figure 10 displays the simulation results.
We observe from Figure 10a–d that higher CEA is associated with greater innovation design effort by the manufacturer and a higher legal recycling rate, total environmental pollution cost and social welfare.
The simulation results confirm that an increase in consumer environmental awareness can stimulate the manufacturer’s innovation design, enhance the subsidy policy’s effectiveness in recycling and provide social welfare benefits. Although the overall environmental pollution increases, the benefits outweigh the costs in general. Improving consumer environmental awareness will contribute to industry development in recycling and reuse on the upstream and downstream.
Conclusion 6: An increase in consumer environmental awareness would enhance the effectiveness of the CRS-policy in the manufacturing and recycling and reuse stages.
As a result, we suggest the government make effort to increase consumer environmental awareness and encourage green images for products to enhance the effectiveness of the CRS-policy.

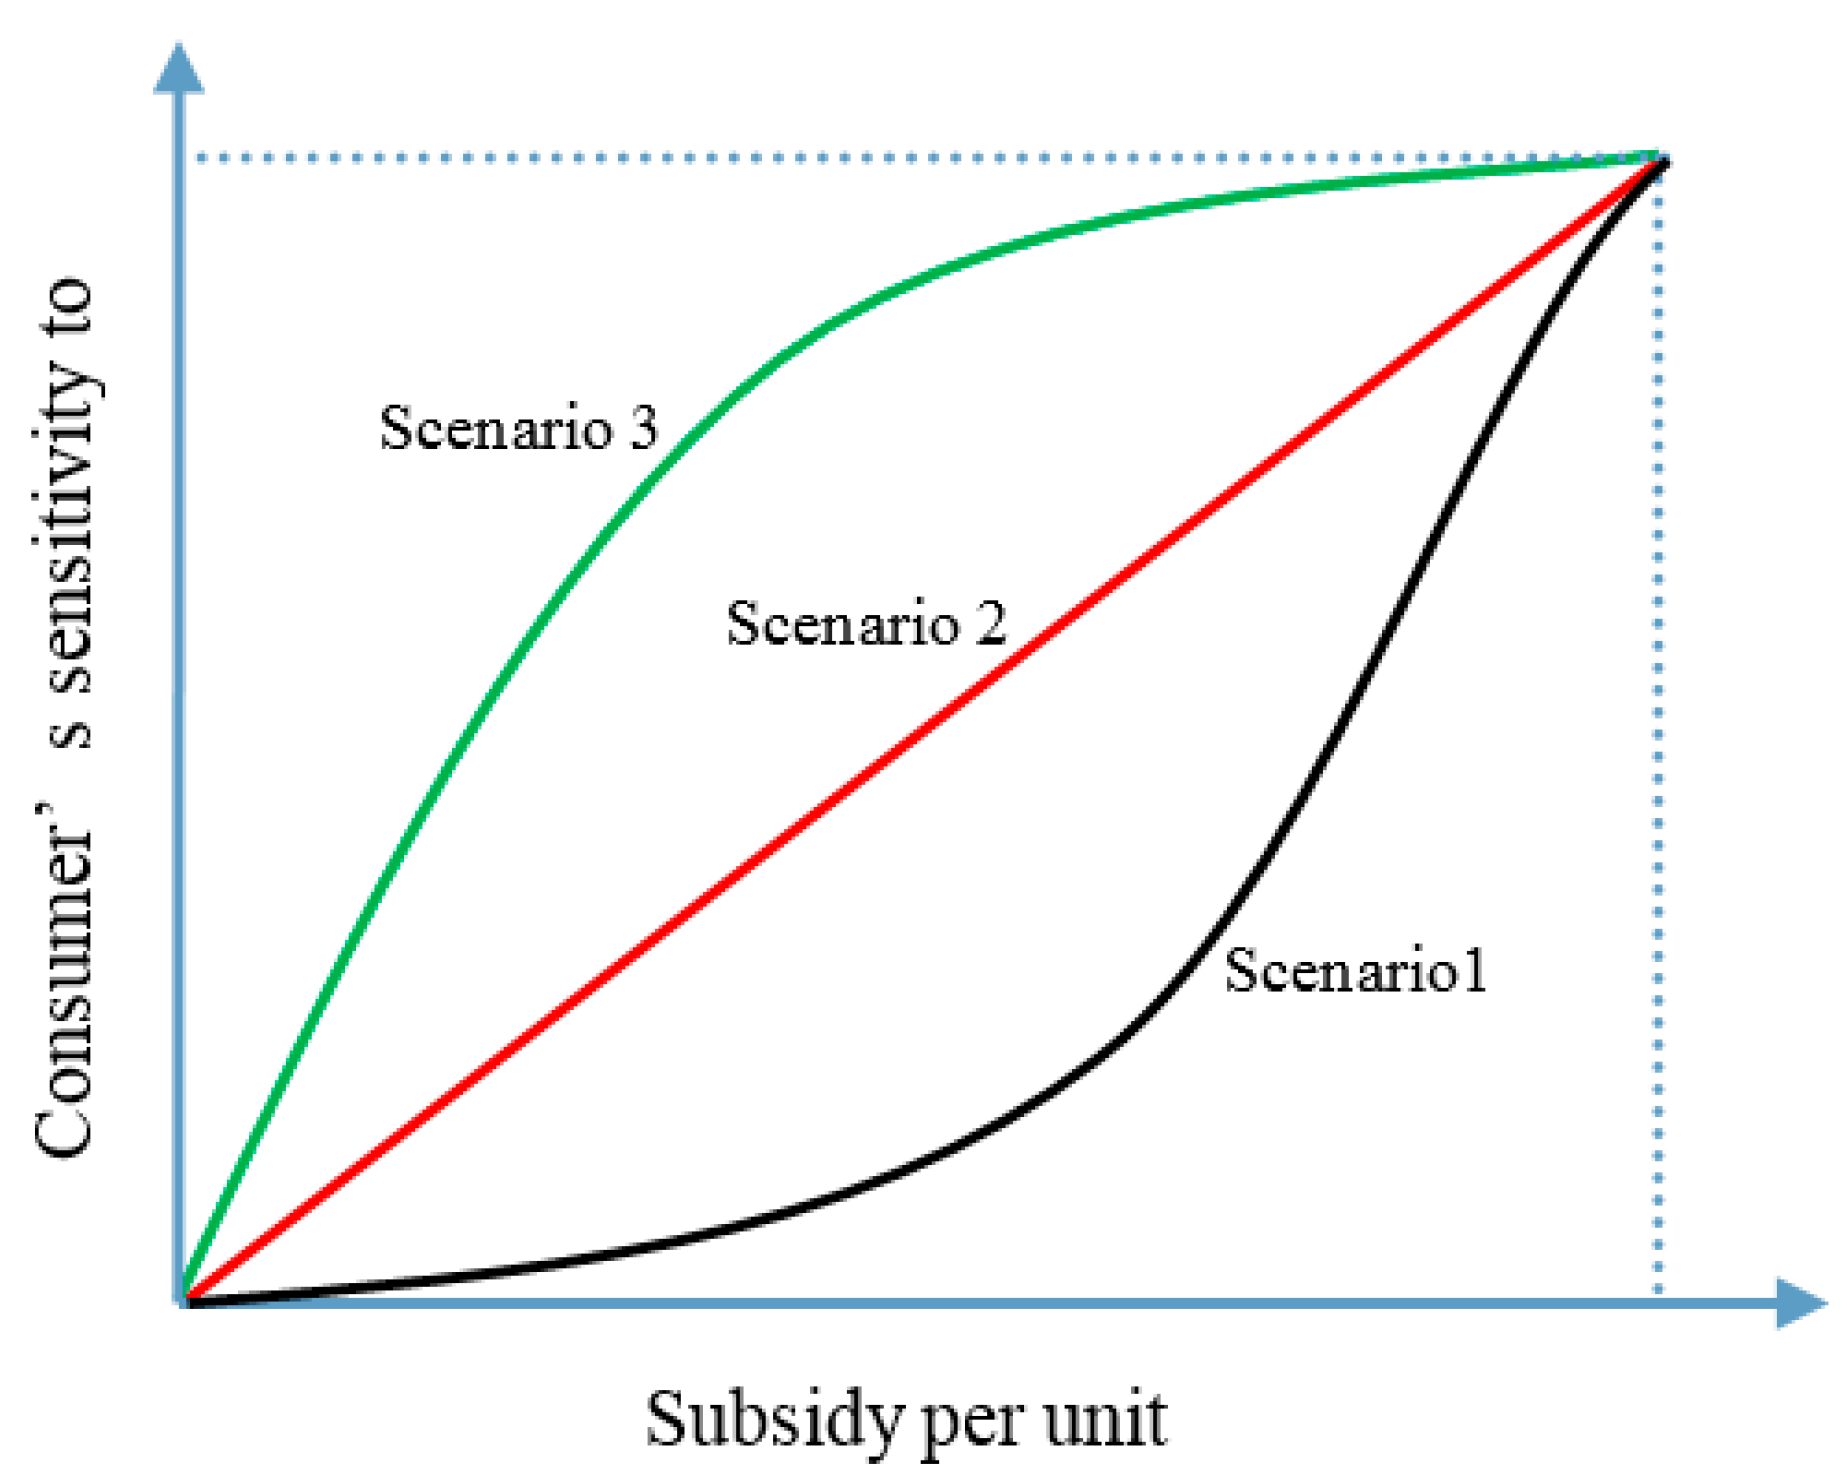
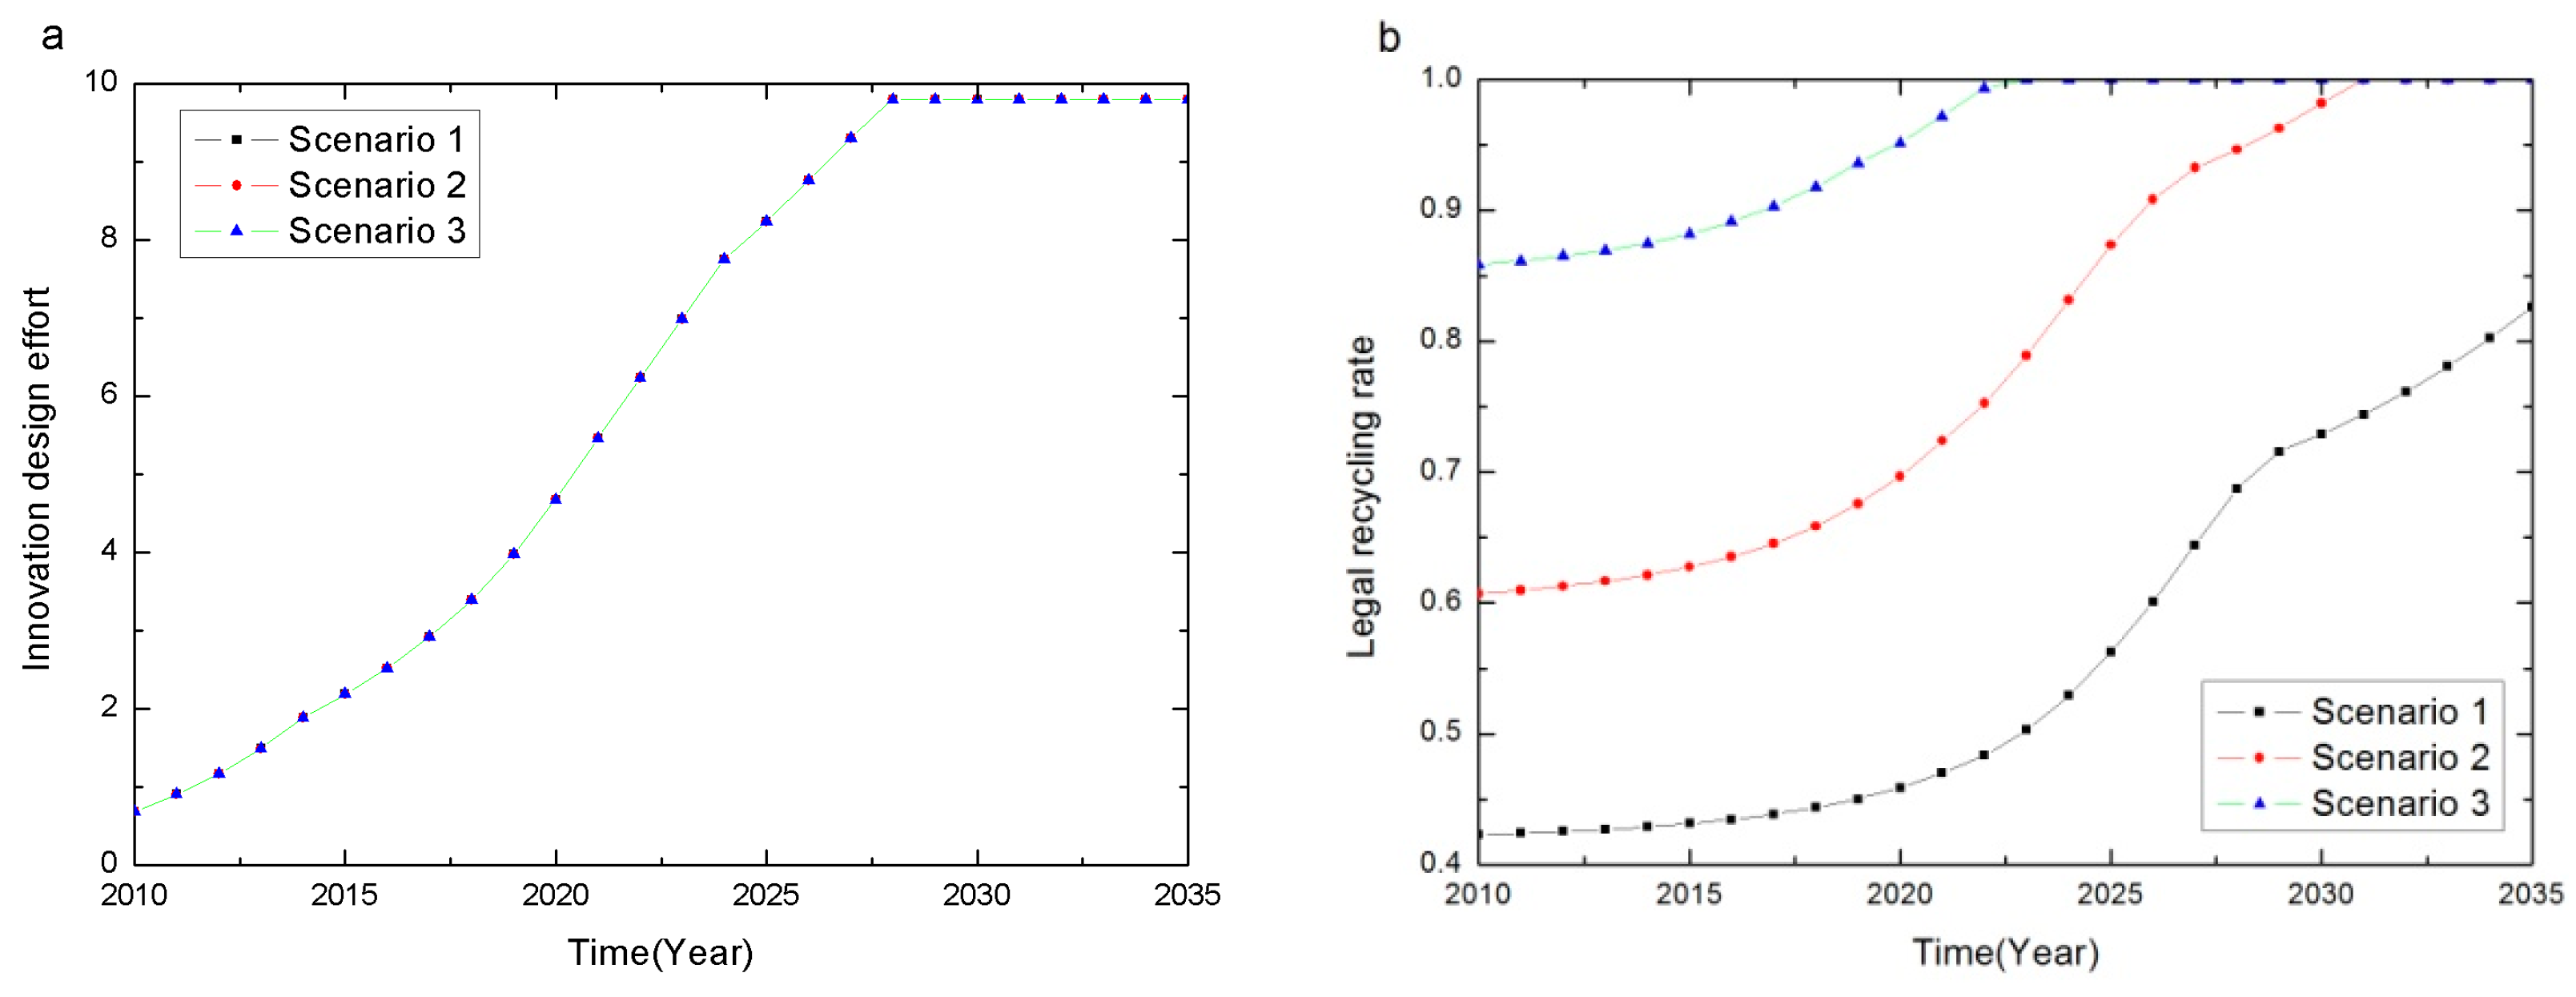
4.2.3. Consumer Sensitivity to the CRS-Policy

Consumer sensitivity to the CRS policy stands for the consumer’s utility of the CRS policy in the SD model in Section 2. We consider three types of consumer sensitivity in response to the subsidy level as shown in Figure 11. Scenario 1 refers to a slow response market, namely, a market environment in which consumers respond slowly to a low subsidy and quickly to a high subsidy. Scenario 2 represents a proportional response market, in which consumer sensitivity to the subsidy level increases at a constant speed. Scenario 3 represents a rapid response market in which consumers respond more quickly to a low subsidy than to a high subsidy.
Figure 12 depicts the simulation results for the three types of market. The figure shows that consumer sensitivity to the CRS-policy in the three types of response markets does not have different impacts on the manufacturer’s innovation design behavior (Figure 12a), but affects the legal recycling rate, total environment pollution cost and social welfare differently (Figure 12b–d). Specifically, consumer sensitivity to the CRS-policy in a rapid response market is associated with the lowest legal recycling rate and total environmental pollution cost, as well as the highest social welfare. This result suggests that the CRS-policy is most effective when consumers respond quickly to the low subsidy policy.
Conclusion 7: Improvement in consumer’s sensitivity to the recycling subsidy at the initial stage of the policy would enhance the effectiveness of the subsidy policy in the recycling and reuse stage.
This conclusion suggests that the government should first understand current market environment in which consumers respond to the CRS-policy and seek opportunities to increase consumer sensitivity to the low subsidy.

4.2.4. Profit in the Recycling and Reuse Industry

In this subsection, we investigate the impact of the recycler’s recycling and reuse profit on the effectiveness of the CRS-policy’s. The unit reuse cost of 16.4 thousand Yuan defined in Section 3 is the baseline, referred as to Scenario 1. We also proposed Scenario 2 in which the unit reusing cost is twice of the baseline cost, that is 32.8 thousand Yuan; and Scenario 3 in which the unit reuse cost is four times the baseline cost, which is 65.6 thousand Yuan. We assume that the recycler will always gain benefits from recycling in Scenario 1. When the reuse cost is doubled as in Scenario 2, the recycler will have a deficit at the beginning but make a profit later. If the reuse cost is even higher, as in Scenario 3, the recycler will not gain any benefits from recycling. The simulation results for the three scenarios are shown in Figure 13.
Different recycling and reuse profit levels have no significantly different impact on the manufacturer’s innovation design effort (Figure 13a). However, when the recycler’s profit declines, the legal recycling rate is much lower in the long run (Figure 13b); the total environmental pollution cost rises dramatically over time (Figure 13c) and social welfare is hurt (Figure 13d). These results clearly show that strong government support is needed when the recycling profit is low.
Conclusion 8: An increase in the downstream recycling and reuse profit would enhance the effectiveness of the CRS-policy in the recycling and reuse stage.
Therefore, the government should offer strong support or incentive, such as compensation or rewards, when recycling is not profitable, in order to improve the legal recycling rate, reduce the total environmental pollution cost and increase social welfare.

5. Conclusions

During the past few decades, China has paid a heavy environmental price for overusing unsustainable natural resources for economic development. Now the government has realized the importance of environmental sustainability, and reduction, recycling and reuse are increasingly becoming a top priority in many industries throughout China. A major problem facing policy makers is how to develop a more effective and efficient recycling subsidy policy.
This paper developed a system dynamics model to evaluate the effectiveness of the CRS-policy across the whole product life cycle. Three subsystems were introduced in the model: (i) the manufacturing and usage subsystem; (ii) the recycling and reusing subsystem; and (iii) the recycling subsidy subsystem. This paper simulated different recycling policy options and subsidy levels to construct an effective of CRS-policy. We used indicators, such as innovation design effort, legal recycling rate, environmental pollution cost, government subsidy expenditure and social welfare, to evaluate the effectiveness of the CRS-policy’s. The key findings from the simulation analysis are summarized as follows.
First, the results demonstrate that different subsidy levels can effectively stimulate recycling and reuse practices. Especially, the subsidy policy positively contributes to development of the industry in the downstream, namely, the recycling and reusing stage. However, this policy does not effectively encourage manufacturers to reduce resource consumption and waste production at the manufacturing stage. In addition, an optimal subsidy level exists and the government can adjust the subsidy policy dynamically to balance trade-offs between environmental pollution and economic or social welfare benefits over time.
Second, the effectiveness of the subsidy policy is affected by the interactions among many market factors across the whole product life cycle. Upstream factors (innovation environment and consumer environmental awareness) and downstream factors (consumer sensitivity to the subsidy level and recycling and reuse profit) have a significant impact on recycling and reuse practices, and understanding and improving these factors would enhance the effectiveness of the CRS-policy. Therefore, the government should not only focus on implementing the subsidy policy in the downstream as in the current CRS-policy but, more importantly, also on optimizing all the major factors through the whole product life cycle, to maximize the benefits and effectiveness of the subsidy policy.
In this study, we conducted a comprehensive analysis with simultaneous considerations of the CRS-policy’s environmental effect and economic performance from the whole product life cycle perspective. Because the current CRS-policy focuses on the recycling and reuse stage of the closed-loop product life cycle only, the policy shows a weak preventative effect but a prominent regenerative effect. The policy also fails to reduce environmental pollution at the manufacturing stage but can be adjusted to an optimal level to demonstrate a significant positive effect at the recycling and reuse stage. Additionally, when the major market factors are taken into account, the effectiveness of the CRS-policy can be further enhanced.
The setting of our study is mainly based on China’s recycling subsidy policy, but the findings and recommendations can be extended to other countries and regions to evaluate their subsidy policies and offer practical insights to any policy maker to improve policy effectiveness in the recycling and reuse industry.

Acknowledgments

We thank the editor and reviewers for their detailed comments and many valuable suggestions that have significantly improved the quality of this paper. The authors would also like to acknowledge the support of all participants in this research and to express sincere thanks to the National Natural Science Foundation of China (71473085, 71102068, 71573087), the Shanghai Pujiang Program (14PJC020) and the Shanghai Planning Office of Philosophy and Social (2014FGL003) for funding this research.

Author Contributions

Xiangyun Chang designed and wrote the whole paper, Junjie Fan designed the system dynamics models, defined the parameters and formulas and conducted the simulation analysis. Yabing Zhao provided some core advice and checked through the whole paper. Jie Wu mainly checked through the whole paper. All authors approved the final draft.

Conflicts of interest

The authors declare no conflict of interest.

Appendix

Table A1. Parameters.
ParametersDefinition
d The innovation cost coefficient.
e The innovation design effort of the manufacturer, which is a dimensionless parameter. e [0,10].
c 0 Initial production cost per unit without any innovation effort.
γ represents the cost increasing rate of the innovation, γ [ 0 , 1 ]
A Market scale
k Consumer’s price sensitivity
aConsumer’s environmental awareness (CEA)
δ product innovation green coefficient, δ ∊ [0,1] and δ e represents the product green image.
p , p r New product’s unit sale price and reused product’s unit sale price, respectively.
uConsumer utility
τ Reusing rate, τ [ 0 , 1 ]
υ Value of the reused product quality, υ [ 0 , 10 ]
c e m , c e r , c e d Manufacturing environmental pollution cost (manufacturing EPC), recycling and reusing EPC, illegal recycling and disposal EPC, respectively.
e e m , e e r , e e d Manufacturing EPC per unit, recycling and reusing EPC per unit and illegal recycling and disposal EPC per unit, respectively.
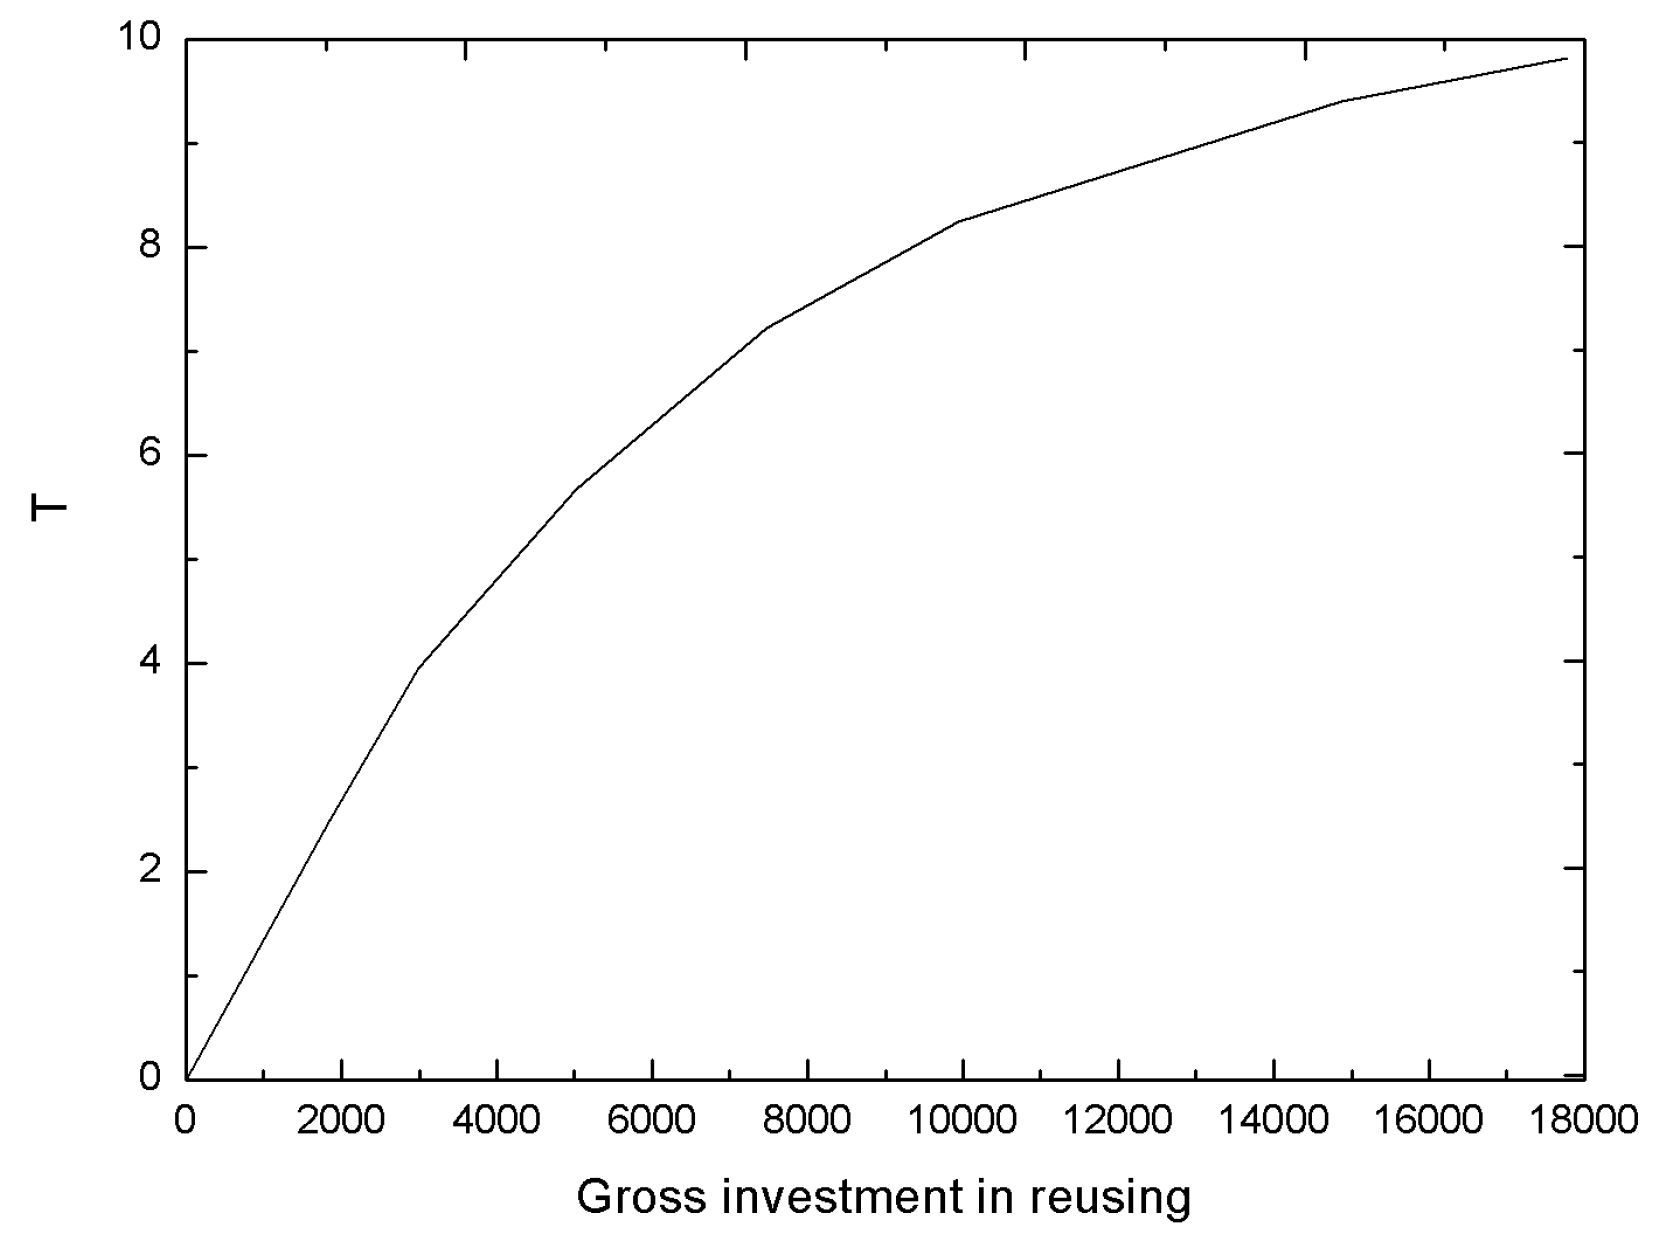
TThe value of the improvement of reusing and disposal technology, T [ 0 , 10 ]
Figure A1. The relationship between the innovation design effort and the investment. Its table function is: nnovation design effort = WITH LOOKUP (the gross investment in innovation design) Lookup = ([(0,0)–(100000,10)], (0,0), (5378.97,1.93), (18,337.4,4.56), (26161.4,5.89), (43,765.3,7.65), (62,102.7,8.42), (78,728.6,9.12), (94,621,9.614), (100,000,9.8)).
Sustainability 08 00781 g014
Figure A2. The relationship between the reusing rate and the innovation design effort. Its table function is: Reusing rate = WITH LOOKUP (innovation design effort) Lookup = ([(0,0.7)–(10,1)], (0,0.7), (1,0.80), (2.188,0.87), (3.318,0.91), (4.424,0.93), (5.671,0.95), (6.847,0.95), (8.306,0.96), (9.223,0.96), (10,0.96)).
Sustainability 08 00781 g015
Figure A3. The relationship between T (The value of the improvement of reusing and disposal technology) and the investment. The corresponding table function is: T = WITH LOOKUP (gross investment in reusing) Lookup = ([(0,0)–(18,000,10)], (0,0), (1848.41,2.06), (2992.67,3.96), (5017.11,5.68), (7481.66,7.23), (9946.21,8.35), (14,875.3,9.40), (17,780,9.82)).
Sustainability 08 00781 g016

References

  1. Tu, J.C.; Huang, H.S. Analysis on the relationship between green accounting and green design for enterprises. Sustainability 2015, 7, 6264–6277. [Google Scholar] [CrossRef]
  2. Aksen, D.; Aras, N.; Karaarslan, A.G. Design and analysis of government subsidized collection systems for incentive-dependent returns. Int. J. Prod. Econ. 2009, 119, 308–327. [Google Scholar] [CrossRef]
  3. Mitra, S.; Webster, S. Competition in remanufacturing and the effects of government subsidies. Int. J. Prod. Econ. 2008, 111, 287–298. [Google Scholar] [CrossRef]
  4. Ma, W.; Zhao, Z.; Ke, H. Dual-channel closed-loop supply chain with government consumption-subsidy. Eur. J. Oper. Res. 2013, 226, 221–227. [Google Scholar] [CrossRef]
  5. Krass, D.; Nedorezov, T.; Ovchinnikov, A. Environmental taxes and the choice of green technology. Prod. Oper. Manag. 2013, 22, 1035–1055. [Google Scholar] [CrossRef]
  6. Raz, G.; Druehl, C.T.; Blass, V. Design for the environment: Life-cycle approach using a newsvendor model. Prod. Oper. Manag. 2013, 22, 940–957. [Google Scholar] [CrossRef]
  7. Plambeck, E.; Wang, Q. Effects of e-waste regulation on new product introduction. Manag. Sci. 2009, 55, 333–347. [Google Scholar] [CrossRef]
  8. Kleber, R.; Zanoni, S.; Zavanella, L. On how buyback and remanufacturing strategies affect the profitability of spare parts supply chains. Int. J. Prod. Econ. 2011, 133, 135–142. [Google Scholar] [CrossRef]
  9. Teunter, R.H.; Flapper, S.D.P. Optimal core acquisition and remanufacturing policies under uncertain core quality fractions. Eur. J. Oper. Res. 2011, 210, 241–248. [Google Scholar] [CrossRef]
  10. Simic, V.; Dimitrijevic, B. Production planning for vehicle recycling factories in the EU legislative and global business environments. Resour. Conserv. Recycl. 2012, 60, 78–88. [Google Scholar] [CrossRef]
  11. Finnveden, G.; Ekvall, T.; Arushanyan, Y.; Bisaillon, M.; Henriksson, G.; Gunnarsson Östling, U.; Ljunggren Söderman, M.; Sahlin, J.; Stenmarck, Å.; Sundberg, J.; et al. Policy instruments towards a sustainable waste management. Sustainability 2013, 5, 841–881. [Google Scholar] [CrossRef]
  12. Hong, I.H.; Ke, J.S. Determining advanced recycling fees and subsidies in “E-scrap” reverse supply chains. J. Environ. Manag. 2011, 92, 1495–1502. [Google Scholar] [CrossRef] [PubMed]
  13. Hong, I.H.; Lee, Y.T.; Chang, P.Y. Socially optimal and fund-balanced advanced recycling fees and subsidies in a competitive forward and reverse supply chain. Resour. Conserv. Recycl. 2014, 82, 75–85. [Google Scholar] [CrossRef]
  14. Jeanjean, F. Subsiding the next-generation infrastructures. Consumer-side or supply-side. Info 2010, 12, 95–120. [Google Scholar]
  15. Lorentziadis, P.L.; Vournas, S.G. A quantitative model of accelerated vehicle-retirement induced by subsidy. Eur. J. Oper. Res. 2011, 211, 623–629. [Google Scholar] [CrossRef]
  16. Poles, R. System dynamics modelling of a production and inventory system for remanufacturing to evaluate system improvement strategies. Int. J. Prod. Econ. 2013, 144, 189–199. [Google Scholar] [CrossRef]
  17. Georgiadis, P.; Vlachos, D. The effect of environmental parameters on product recovery. Eur. J. Oper. Res. 2004, 157, 449–464. [Google Scholar] [CrossRef]
  18. Sterman, J.D. Business Dynamics: Systems Thinking and Modeling for a Complex World; Irwin/McGraw-Hill: Boston, MA, USA, 2000. [Google Scholar]
  19. Das, D.; Dutta, P. A system dynamics framework for integrated reverse supply chain with three-way recovery and product exchange policy. Comput. Ind. Eng. 2013, 66, 720–733. [Google Scholar] [CrossRef]
  20. Van Schaik, A.; Reuter, M.A. The time-varying factors influencing the recycling rate of products. Resour. Conserv. Recycl. 2004, 40, 301–328. [Google Scholar] [CrossRef]
  21. Spengler, T.; Schroter, M. Strategic management of spare parts in closed-loop supply chains: A system dynamics approach. Interfaces 2003, 33, 7–17. [Google Scholar] [CrossRef]
  22. Calvo, N.; Varela-Candamio, L.; Novo-Corti, I. A dynamic model for construction and demolition (C&D) waste management in Spain: Driving policies based on economic incentives and tax penalties. Sustainability 2014, 6, 416–435. [Google Scholar]
  23. Peng, M.; Peng, Y.; Chen, H. Post-seismic supply chain risk management: A system dynamics disruption analysis approach for inventory and logistics planning. Comput. Oper. Res. 2014, 42, 14–24. [Google Scholar] [CrossRef]
  24. Georgiadis, P.; Besiou, M. Sustainability in electrical and electronic equipment closed-loop supply chains: A system dynamics approach. J. Clean. Prod. 2008, 16, 1665–1678. [Google Scholar] [CrossRef]
  25. Wu, Y.P.; Dong, Z.Y. Impact of technological innovation difficulty on high-tech enterprise optimal innovation investment: Based on analysis of agent-based model. Sci. Technol. Econ. 2014, 27, 44–48. (In Chinese) [Google Scholar]
  26. Xu, B.S. Remanufacturing and Recycling Economy; Science Press: Beijing, China, 2007. (In Chinese) [Google Scholar]
  27. Jin, X.H.; Zhu, J.W.; Zhang, T.Z.; Cui, P.F.; Tian, G.D.; Wang, H. Analysis of dynamic modeling and prediction of end-of-life vehicles. Comput. Commun. 2008, 26, 23–25. (In Chinese) [Google Scholar]
  28. Mao, G.P.; Zhu, Y.W.; Wu, C. A study on the environmental influence comparison between engine manufacturing and remanufacturing. Automot. Eng. 2009, 31, 565–568. (In Chinese) [Google Scholar]
  29. Atasu, A.; Van Wassenhove, L.N.; Sarvary, M. Efficient take-back legislation. Prod. Oper. Manag. 2009, 18, 243–258. [Google Scholar] [CrossRef]
  30. Atasu, A.; Wassenhove, L.N. An operations perspective on product take-back legislation for e-waste: Theory, practice, and research needs. Prod. Oper. Manag. 2012, 21, 407–422. [Google Scholar] [CrossRef]
Figure 1. A causal loop diagram of the manufacturing and usage subsystem.
Sustainability 08 00781 g001
Figure 2. Causal loop diagram of the recycling and reusing subsystem.
Sustainability 08 00781 g002
Figure 3. Causal loop diagram of the recycling subsidy subsystem.
Sustainability 08 00781 g003
Figure 4. The stock and flow diagram of the system dynamics model.
Sustainability 08 00781 g004
Figure 5. Preventative effects of the CRS-policy.
Sustainability 08 00781 g005
Figure 6. Regenerative effects of the CRS-policy: (a) legal recycling rate; (b) legal recycling quantity; and (c) illegal disposal quantity.
Sustainability 08 00781 g006
Figure 7. Environmental effects of the CRS-policy: (a) manufacturing environmental pollution cost; (b) reuse environmental pollution cost; (c) illegal disposal environmental pollution cost; and (d) total environmental pollution cost.
Sustainability 08 00781 g007
Figure 8. Economic and social welfare effects of the CRS-policy: (a) manufacturer’s profit; (b) recycler’s profit; (c) government subsidy expenditure; and (d) social welfare.
Sustainability 08 00781 g008
Figure 9. Impact of innovation environment. Scenario 1: innovation indicator = 0; Scenario 2: innovation indicator = 100; and Scenario 3: innovation indicator = 200. (a) Innovation design effort, (b) legal recycling rate (c) total environmental pollution cost (d) social welfare.
Sustainability 08 00781 g009
Figure 10. Impact of consumer environmental awareness. Scenario 1: CEA = 0.8; Scenario 2: CEA = 1; Scenario 3: CEA = 1.2. (a) innovation design effort; (b) legal recycling rate (c) total environmental pollution cost (d) social welfare.
Sustainability 08 00781 g010
Figure 11. Three scenarios of consumer sensitivity to the CRS-policy.
Sustainability 08 00781 g011
Figure 12. Impact of consumer’s sensitivity to recycling subsidy: (a) total environmental pollution cost; (b) legal recycling rate; (c) total environmental pollution cost; and (d) social welfare.
Sustainability 08 00781 g012aSustainability 08 00781 g012b
Figure 13. Impact of recycling and reuse profit: (a) innovation design effort; (b) legal recycling rate; (c) total environmental pollution cost; and (d) social welfare.
Sustainability 08 00781 g013aSustainability 08 00781 g013b

