Article

Laboratory Assessment of the Infiltration Capacity Reduction in Clogged Porous Mixture Surfaces

by
Valerio C. Andrés-Valeri
1,*,
Mariana Marchioni
2,
Luis Angel Sañudo-Fontaneda
3,
Filippo Giustozzi
4 and
Gianfranco Becciu
2
1
GITECO Research Group, Civil Enigneering School, Universidad de Cantabria, Santander 39005, Spain
2
Water Science and Technology Area, Department of Civil and Environmental Engineering, Politecnico di Milano, Milano 20133, Italy
3
Centre for Agroecology, Water and Resilience (CAWR), Coventry University, Ryton Organic Gardens Wolston Lane, Coventry CV8 3LG, UK
4
Transport Infrastructures Section, Department of Civil and Environmental Engineering, Politecnico di Milano, Milano 20133, Italy
*
Author to whom correspondence should be addressed.
Sustainability 2016, 8(8), 751; https://doi.org/10.3390/su8080751
Submission received: 4 July 2016 / Revised: 26 July 2016 / Accepted: 1 August 2016 / Published: 4 August 2016
(This article belongs to the Special Issue Agroecology and Water Management)

Abstract

:
Permeable pavements have been used widely across the world to manage urban stormwater. The hydrological behaviour of permeable surfaces is a complex process affected by many factors, such as rainfall intensity, rainfall duration, pavement geometrical conditions, and clogging level of the permeable surface, amongst others. This laboratory study was carried out to assess the influence of clogging level and rainfall intensity on the infiltration capacity of porous mixture surfaces used in Permeable Pavement Systems (PPS). Porous Concrete (PC) and Porous Asphalt (PA) mixtures with different air void contents (15%, 20%, and 25%) were subject to different clogging scenarios by using varying sediment loads (0, 500, and 1000 g/m2). Permeability experiments were carried out for each clogging scenario through a new rainfall simulator specially developed, tailored, and calibrated for the laboratory simulation of a wide range of rainfall events. Permeability measurements were taken under all different scenarios as a result of the combination of the different rainfall events (50, 100, and 150 mm/h) simulated over the specimens of porous mixtures and the sediment loads applied to them. The results showed that the PC mixtures tested perform better than the PA ones in terms of infiltration capacity, showing less potential for clogging and being more easily cleaned by the wash-off produced by the simulated rainfall events.

Graphical Abstract

1. Introduction

The progressive urban sprawl during the last decades has worsened the problems related to stormwater management in urban areas [1]. The decline of natural pervious areas has led to the increase of runoff volumes in lowland areas, causing local flooding problems and Combined Sewer Overflows (CSO) in areas with combined sewerage systems [2]. In addition, the water flow over impervious surfaces causes amenity problems for vehicles and pedestrians [3], and washes off the pollutants deposited on them, producing toxic effects in the receiving water systems [4].
Conventional drainage systems are not capable of adequately coping with the management of stormwater over time, especially in highly urbanized areas [2] and scenarios of climate change where peak flows are higher and more rapidly reached [5]. Sustainable Drainage Systems (SuDS), also known as Stormwater Best Management Practices (BMPs), arose as a set of drainage techniques and comprehensive solutions for dealing with problems related to urban stormwater. These systems aim to mimic the natural processes by which natural environments deal with stormwater. Permeable Pavement Systems (PPS) are one of the most extensively researched BMP/SuDS techniques because of their well-proven performance in reducing runoff volumes and their pollutant removal efficiency [6,7,8,9]. These systems are principally composed of several layers of pervious materials that allow the water to infiltrate whilst retaining the pollutants deposited on their surface, which have been transported by urban runoff. Porous mixture surfaces are a special type of permeable surfaces, composed of a granular skeleton coated by a binder. Depending on the binder used, two main types of porous mixtures may be defined: Porous Concrete (PC), when the binder used is a cementitious material; and Porous Asphalt (PA), when the binder used is bituminous. The infiltration capacity of porous mixtures is closely correlated with the air void content in the mixture. According to the American National Center for Asphalt Technology (NCAT), the minimum infiltration capacity of porous friction courses should be 100 m/day [10]. Moreover, it has been observed by some researchers that the minimum air void content that enables these infiltration capacities to be achieved is 15% [11].
Different methods have been used to directly measure the infiltration capacity of porous mixture surfaces, such as single-ring and double-ring infiltrometers [12,13] and permeameters [13,14]. However, falling head and constant head permeameters are the most widely used devices for permeability measurements on porous surfaces [14]. For permeability measurements on constructed pavements, it is normal to use falling head permeameters, due to their simplicity and the limitations imposed by on-site measurements. The results of the permeability tests vary among the devices used: some of them provide permeability coefficients, while others provide a discharge time by which the infiltration capacity of the pavement is directly obtained. Some researchers have attempted to use rainfall simulators in the search for methods that help to measure the infiltration capacity of permeable surfaces in a more realistic way and under more accurate conditions. Laboratory experimental devices were developed for obtaining the infiltration capacity on a small, medium, and full-scale by Rodriguez-Hernandez et al. [7], Sañudo-Fontaneda et al. [9], Rodriguez-Hernandez et al. [1], and portable devices for field analysis by Fernandez-Barrera et al. [15] and Nichols et al. [16], amongst others.
One of the main concerns about the use of porous mixture surfaces for both the scientific and engineering communities is the infiltration capacity reduction due to the progressive clogging of the surfaces by sediments deposited on the pavement and transported by the runoff [17,18,19,20]. The potential clogging of porous surfaces is highly dependent on the relationship between the pore size distribution of porous mixtures and the particle size distribution of the clogging material [8,17]. The retention of solid particles over time progressively reduces the pore diameter in the pavement surface, also reducing the diameter of the retained particles [21]. As the process continues, a thin layer of strained material is formed above the pavement surface, dramatically reducing the infiltration capacity of the pavement [8,17]. The permeability loss in a real scale application due to clogging effects can be very important; some field studies report important reductions from 470 mm/min down to 7 mm/min after two years of use without maintenance [22]. However, other authors [19,20] observed permeability losses in the range of 80% of the original permeability, but allowing reasonable infiltration rates after 5–8 years of continuous use without maintenance. These differences among on-site studies could be attributable to the different characteristics of the porous mixtures studied [23]. The local conditions of the pavements analysed—especially in relation to the sediment types, sizes and deposition rates, the average daily traffic, and the rainfall regime—are other important factors influencing the clogging rate of porous mixtures [8,24,25,26]. In addition, some studies report that the rainfall itself could have a great influence on the clogging dynamics in porous mixtures, producing a partial wash off of the sediments deposited on the pavement [9].
Furthermore, the air void content in porous mixtures, the concentrations of the sediments deposited on the pavement, and the rainfall intensity are parameters that could greatly influence the infiltration capacity of porous mixtures in the field. With the main aim of studying the influence of these parameters on the infiltration capacity of porous mixture surfaces, a laboratory study was conducted in collaboration among several universities across Europe, in which PC and PA mixtures were tested. A rainfall simulator was developed and tailored especially for the simulation of rainfall events on the laboratory specimens, being one of the singular contributions of this work. This new device was used as an important part of the experiments to assess the infiltration capacity reduction of the porous mixtures under different clogging scenarios.

2. Materials and Methods

PC and PA slabs of 50 cm × 26 cm and 5 cm thickness were built for this experimental research in the laboratory. Six slabs of each material were produced, with three targeted air void contents (15%, 20%, and 25%), resulting in three slabs for each air void percentage. As the mixture design was constant, the air void content was modified by varying the compaction energy applied to each slab. While PA mixtures were compacted by using a roller compactor, PC mixtures were compacted by a percussion system until they reached the targeted void ratio for each case.
The gradations used for the PA and PC mixtures are shown in Figure 1a. While PA mixtures were produced by using a mix of 80%/20% of limestone and basaltic aggregate, respectively. PC mixtures were made with coarse limestone aggregates and 5% fine sand by weight of aggregates, according to previous works [27,28]. PA mixtures were produced with a dosage of 4% by weight of a mixture of Styrene Butadiene Styrene-modified bitumen. PC mixtures were produced with Type II Portland Cement (42.5R), a water to cement ratio of 0.27, and various admixtures dosed according to the manufacturer’s recommendations: high range water reducer, air entraining admixture, and viscosity modifier admixture. The material used to clog the porous mixture surfaces was quarry sand. The gradation of the clogging sediments is shown in Figure 1b, and was selected in order to achieve the maximum densification of the particles according to the Federal Highway Administration 0.45 power gradation curve [29]. The selected gradation was compared with those provided by previous studies [30,31,32,33], observing that the gradation fits well into the range of gradations found in the real scale measurements of the sediments deposited in urban areas (Figure 1b).
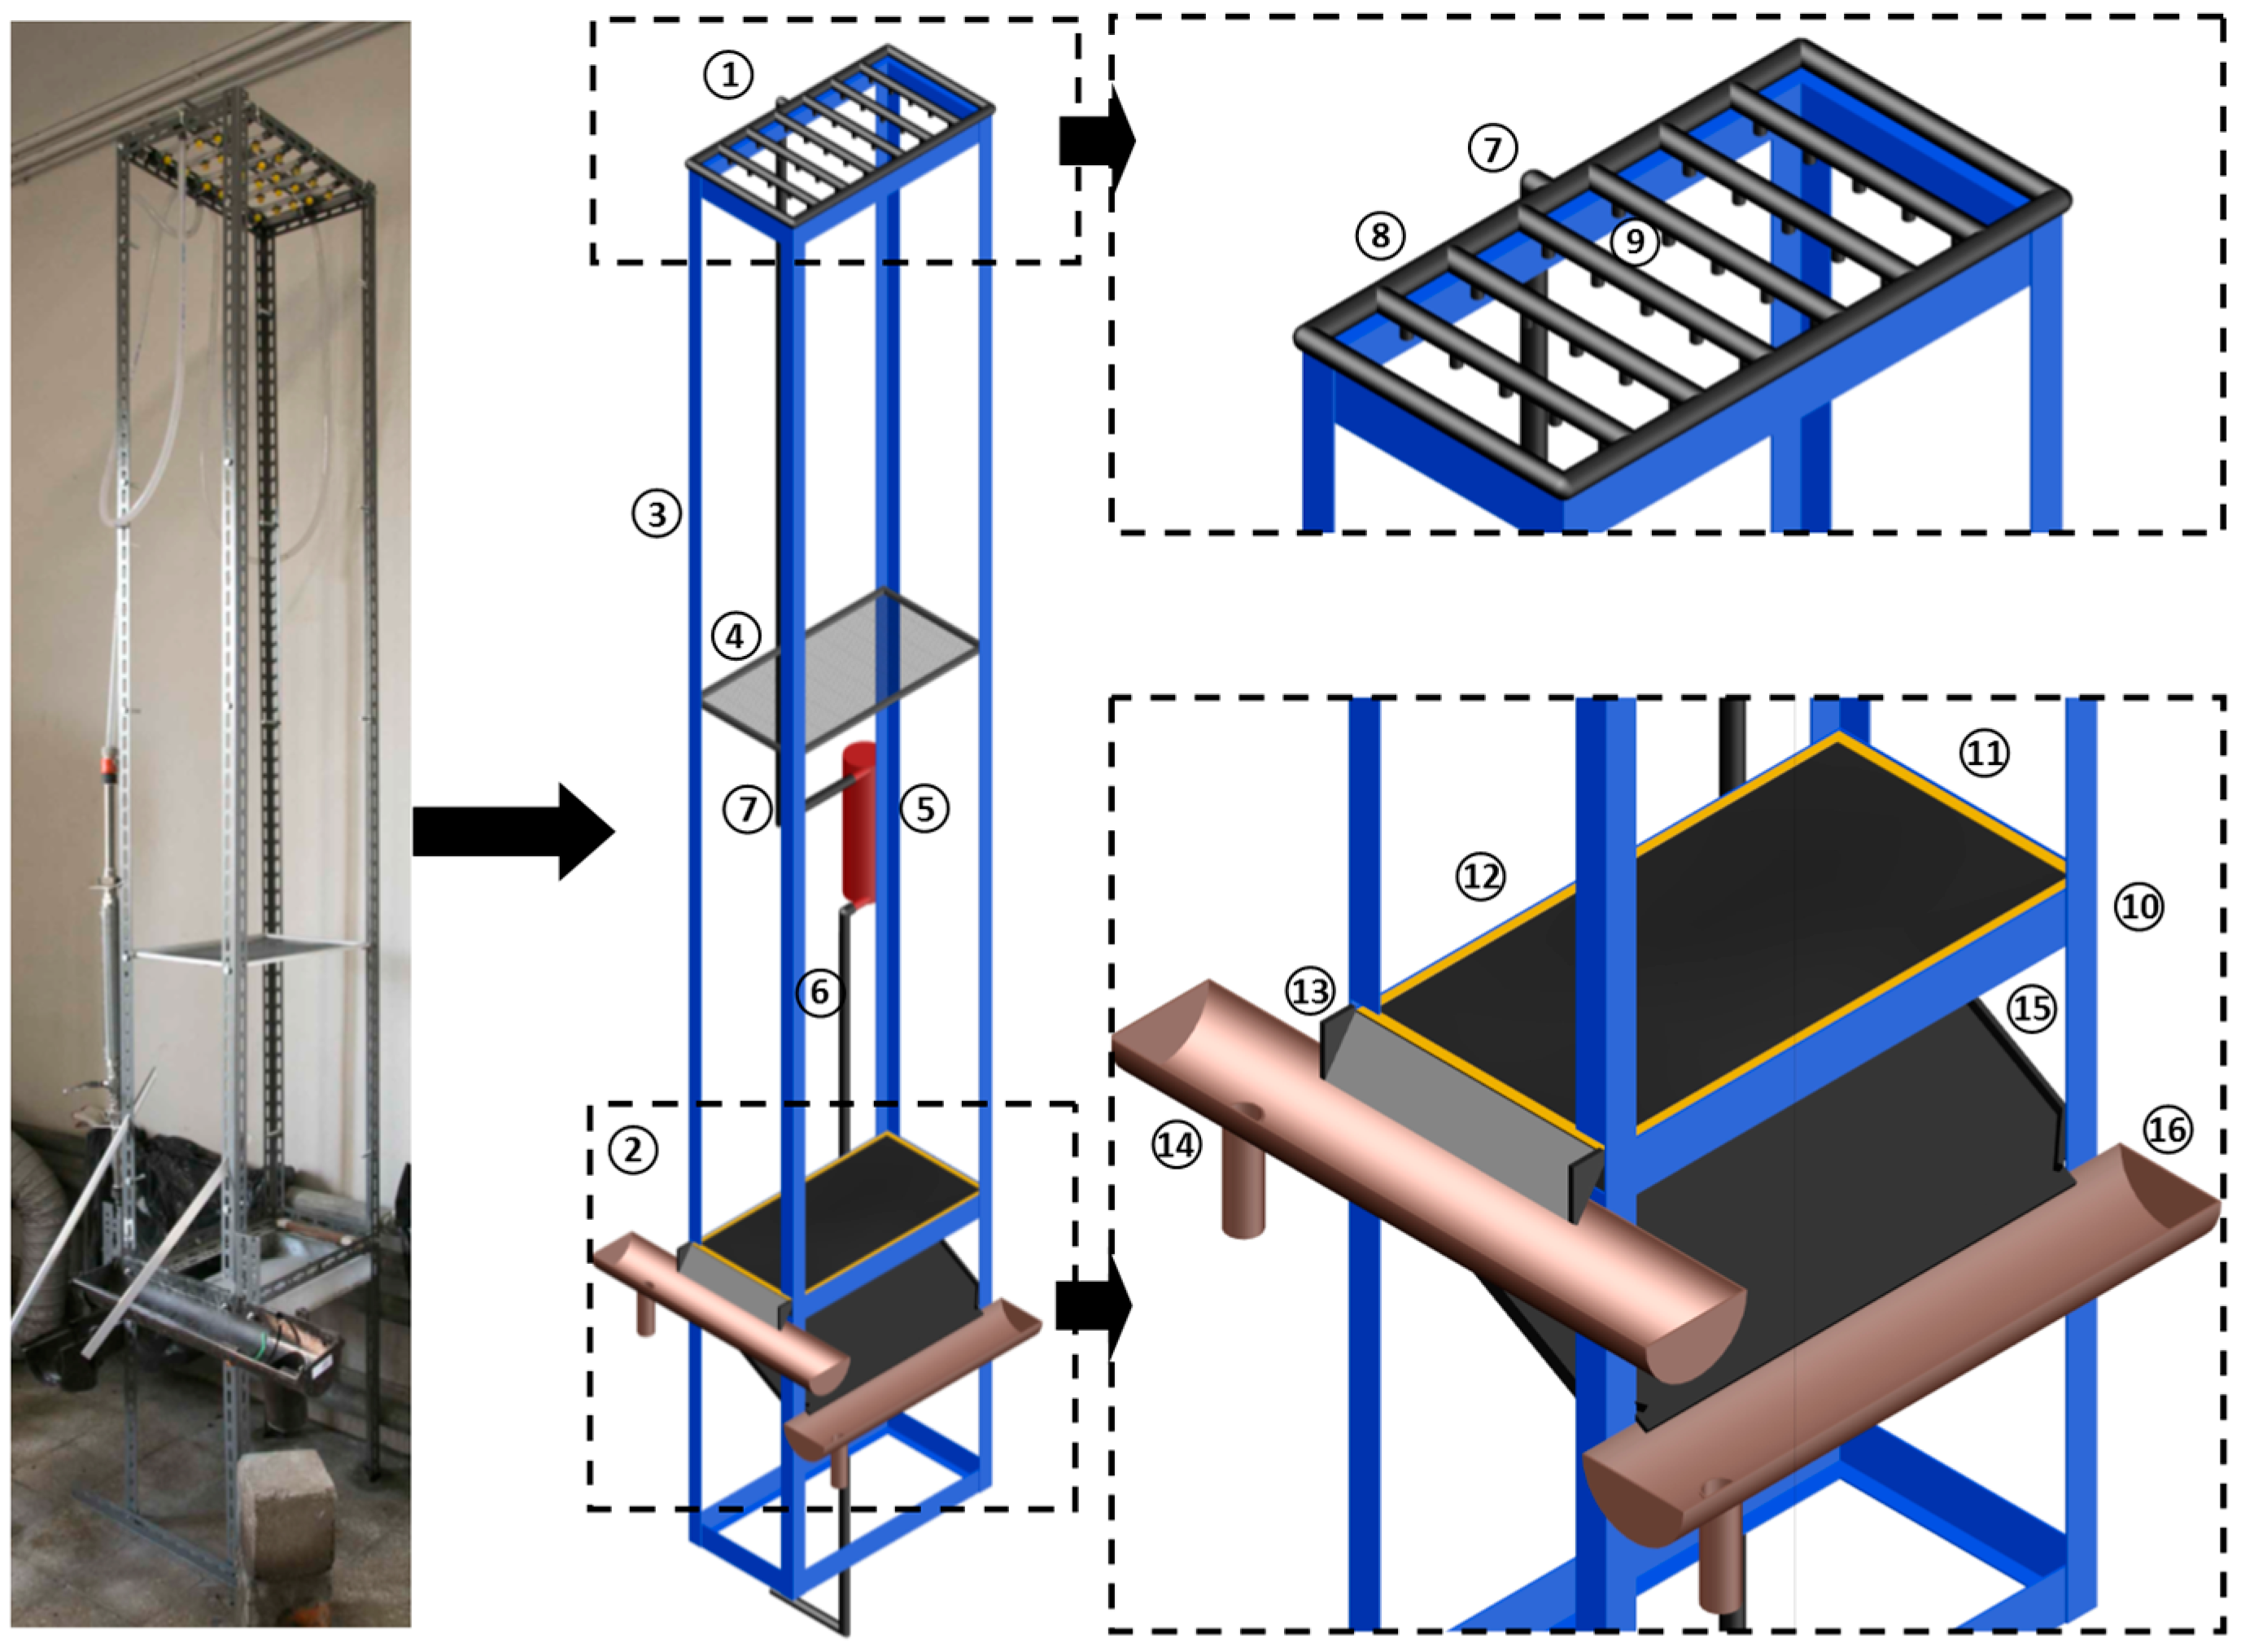
The infiltration capacity of the slabs tested was assessed by using a falling head permeameter, according to the European Standard EN 12697-40 [34]. This standard provides the infiltration capacity based upon the discharge time, or in other words, the time required to discharge a fixed amount of water through the permeable surface. In addition, a new rainfall simulator was developed (Figure 2) in order to assess the hydrological performance of the porous mixtures tested under conditions similar to those existing under real rainfall events. As can be observed, the device is made out of a steel frame structure of 3 m height, with internal floor dimensions of 53 cm × 30 cm. The specimens of 50 cm × 26 cm were placed at a height of 60 cm above the floor, and the rainfall simulation was simulated by 30 drippers distributed in six rows of five drippers each. The drippers were placed at the top of the device, covering the whole test specimen surface. The drippers are connected by flexible pipes, which are linked to a flowmeter that provides a flow range of 2–30 L/h and controls the simulated rainfall intensity in real time. The device was designed to collect the infiltrated water and to catch the surface runoff with the objective of assessing the infiltration capacity of the specimens and calculating the runoff coefficient on each porous surface.
The drippers were adjusted in order to produce similar water flows, with a maximum difference among them of 10%. During the calibration phase, it was observed that the use of the drippers to simulate rainfall led to a concentration of the raindrops on certain points of the tested specimens, therefore affecting the obtained results—especially in clogged conditions; this situation was also reported by previous studies [9]. Thus, in order to avoid this problem, a plastic grid of 54 cm × 29 cm with 1.2 mm sided square holes and plastic fibres of 0.2 mm was used to distribute the raindrops more adequately and accurately over the porous surface. The grid was fixed onto a steel frame and was placed under the drippers. Different distances between the drippers and the plastic grid were evaluated during the calibration phase: 220 cm, 170 cm, and 120 cm. For device calibration, eight 13 cm × 15 cm buckets were placed over the specimen support, and the rainfall intensity was assessed in the area covered by each bucket for different flows of the flowmeter: 10 L/h, 20 L/h, and 30 L/h. Finally, the total simulated rainfall intensity over the specimen as a whole was obtained as the average value of the measurements made in each bucket, resulting in the calibration graph shown in Figure 3a.
The assessment of the drop size distribution of the simulated rainfall was performed in order to characterize the simulated rainfall events provided by the rainfall simulator. The flour pellets method was used for measurement of the drop size distribution [35,36]. This method consists of exposing flour pans of 2 cm in height to simulated rainfall events for 5–10 s and then air drying the flour pan for 48 h. The hardened flour pellets produced due to water contact were sieved and weighed. The drop sizes are calculated through Equation (1) [37], obtained by weighting the flour pellets produced by drops with a known diameter.
Dd = 13.18·Mp0.34
where Dd is the diameter of the drops in mm and Mp is the weight of the flour pellets in grams. After calculating the raindrop sizes produced under the different conditions tested, the drop size distribution was calculated, and the results are shown in Figure 3b.
Three different clogging scenarios were assessed in this research: under newly built conditions and after being clogged with 500 and 1000 g/m2 of sediments. The clogging material was applied over the tested slabs and manually compacted by using a steel roller. The infiltration capacity measured through the discharge time of the falling head permeameter was assessed at three points of the slabs for each clogging scenario. In addition, rainfall simulations of 15 min in duration and with three different rainfall intensities (50, 100, and 150 mm/h)—selected as they form a common range of extreme rainfall intensities in most countries [38]—were applied over the specimens for all clogging scenarios. The slabs were placed inside the rainfall simulator with a fixed slope of 2.5% and they were peripherally sealed. During the simulated rainfall events, the runoff volumes were measured, and the infiltration capacity was assessed, measuring the discharge time at three points of each specimen after finishing the rainfall simulations in order to establish the influence of simulated rainfall intensity on the infiltration capacity of clogged porous mixture surfaces. After finalizing the permeability tests, the specimens were cleaned by combining pressure washing and back-wash cleaning methods [38], reported as the best cleaning technique for porous mixtures [17,21,39]. The cleaning procedure consisted of applying pressure washing for 1 min over the slab surface, and applying backwash cleaning for another minute, considered to be enough according to the preliminary tests performed. Permeability measurements were made after cleaning the slabs at the end of the tests for each clogging scenario in order to validate the cleaning procedure. The results of these tests are shown in Table 1 and prove that the infiltration capacity did not vary during the experimental program.
Finally, for the different air void content and clogging scenarios under study, the discharge times measured for PC and PA mixtures were compared by using statistical tests. Non-parametrical statistical tests were used because the sample sizes of the groups compared were relatively low, and the data distribution was not normally distributed and/or was not homoscedastic for some groups of data. Specifically, a non-parametric Mann-Whitney U-test [40] was used to enable pairwise comparisons to be made between groups of populations, assessing the significance of the differences observed by testing the null hypothesis of equality of populations. This statistical test has been extensively used in previous works in related fields [1,3,20] to make similar comparisons to those performed in this research. The test was performed with a confidence level of 95% (α = 0.05), and hence the hypothesis of equality of populations is rejected when the statistical significance (Sig.) of the test is less than 0.05.

3. Results and Discussion

Rainfall simulations were performed with the distance between the drippers and the plastic grid fixed at 220 cm in order to provide rainfall intensities of around 200 mm/h. The discharge times obtained through the permeability tests carried out on PC and PA samples (Table 2) showed that clogging has an important impact on the infiltration capacity of porous mixtures. Reductions in the infiltration capacity of between 63% and 93% were found for PA mixtures and of 57% to 93% for PC mixtures, depending on the quantity of sediments deposited and the mixtures’ air void content. Generally, the higher the air void content of the mixtures, the less the reduction in the infiltration capacity for the clogging scenarios under test. The deposition of 500 g/m2 of sediments proved to be enough to reduce the infiltration capacity to the range of 63%–79% for PA mixtures and 57%–86% in PC mixtures on average, depending on the air void content. The infiltration capacity is normally higher in PC mixtures than in PA mixtures for the scenarios tested, probably due to the different gradations used for the two materials, which leads to different pore properties, and may result in different infiltration capacities and clogging dynamics for similar air void contents, according to previous studies [41,42,43].
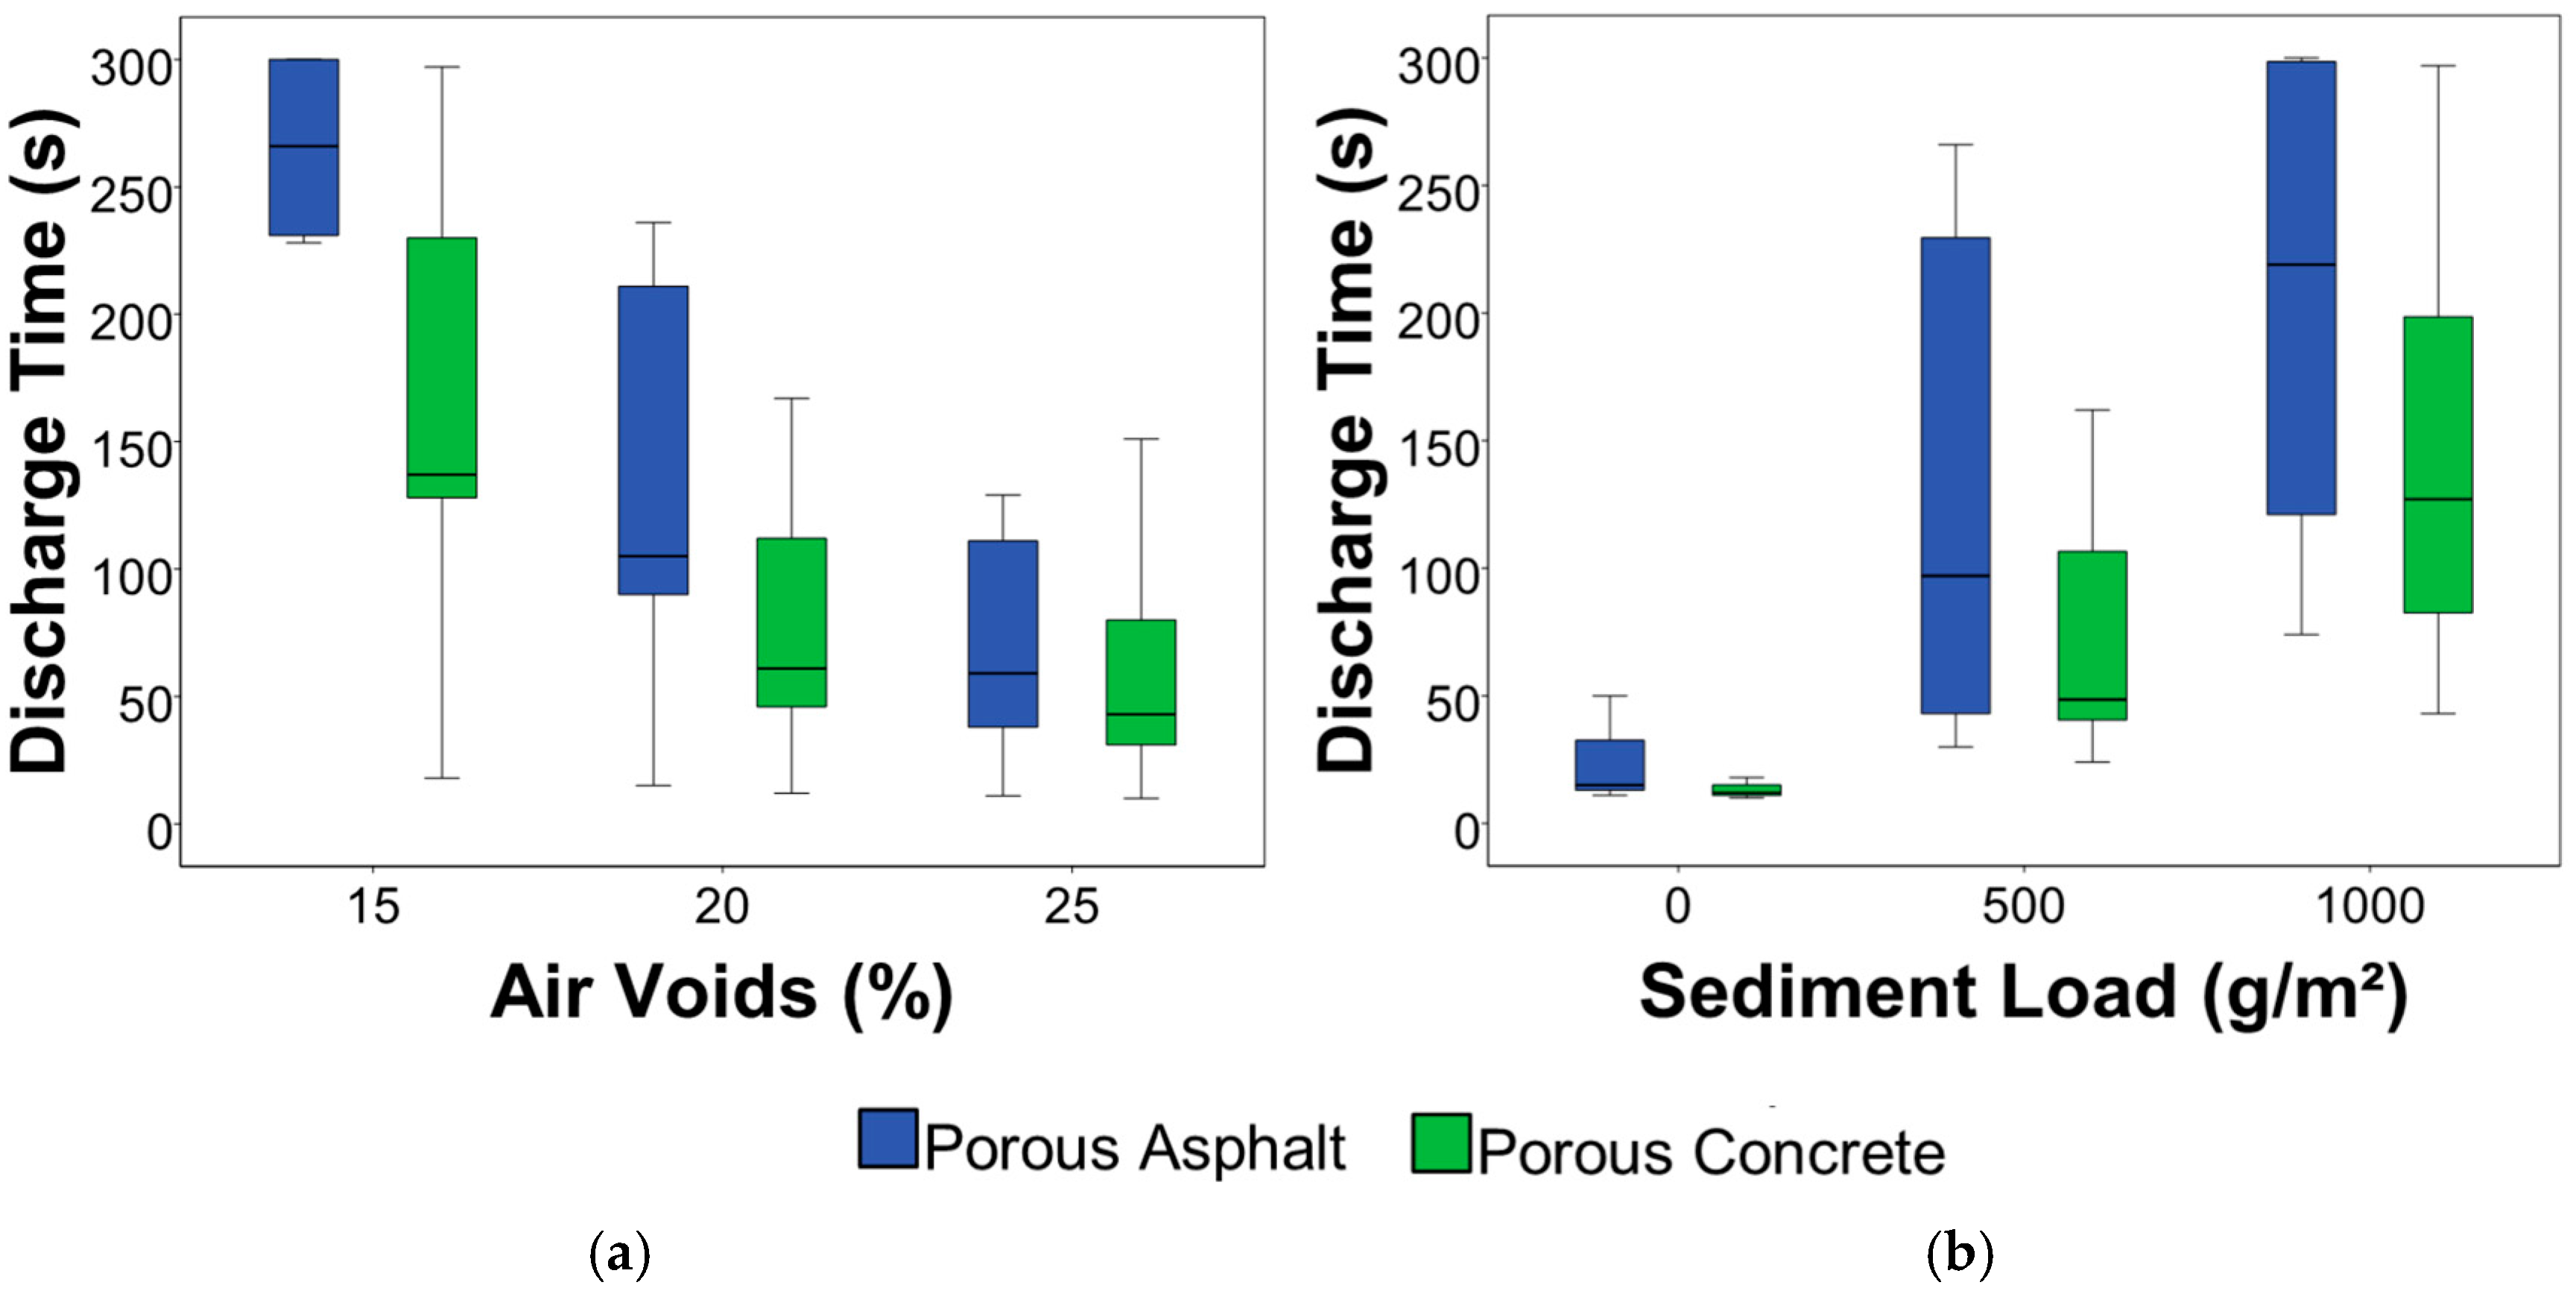
Grouping the results obtained depending on the material used and sediment load, it can be observed that the tested PC mixtures performed better in terms of infiltration capacity than the PA ones for all the air void contents (Figure 4a) and clogging scenarios (Figure 4b). The degree of variability observed in the box plots of Figure 4 is a consequence of grouping permeability results of slabs with different sediment loads (Figure 4a) and air void contents (Figure 4b). The results of the statistical analyses showed that for high air void contents, the infiltration capacity of both materials is quite similar, there being no significant differences among them in the average infiltration capacity observed throughout the scenarios tested (Sig. = 0.730). However, as the air void ratio decreases, the infiltration capacity tends to decrease faster in PA mixtures, so that for 15% of air voids the average infiltration capacity was significantly higher in PC mixtures (Sig. = 0.031). A similar pattern was observed in the infiltration capacity measured for the different clogging scenarios, very similar infiltration capacities being observed in PC and PA mixtures under newly built conditions (Sig. = 0.700). As the load of clogging material increases, the infiltration capacity tends to decrease faster in PA mixtures, resulting in significantly different infiltration capacities for the two materials after being clogged by 1000 g/m2 of sediment (Sig. = 0.048). These results are in agreement with previous studies that observed higher infiltration capacities in clogged PC mixtures [9] and higher infiltration capacity reductions in PA mixtures [20]. The higher infiltration capacity of PC mixtures compared to PA mixtures, together with the different void structure of the two materials caused by the different mixture designs, could be the cause of the higher infiltration capacities and lower clogging rates observed in PC mixtures, as reported by previous works [42,43].
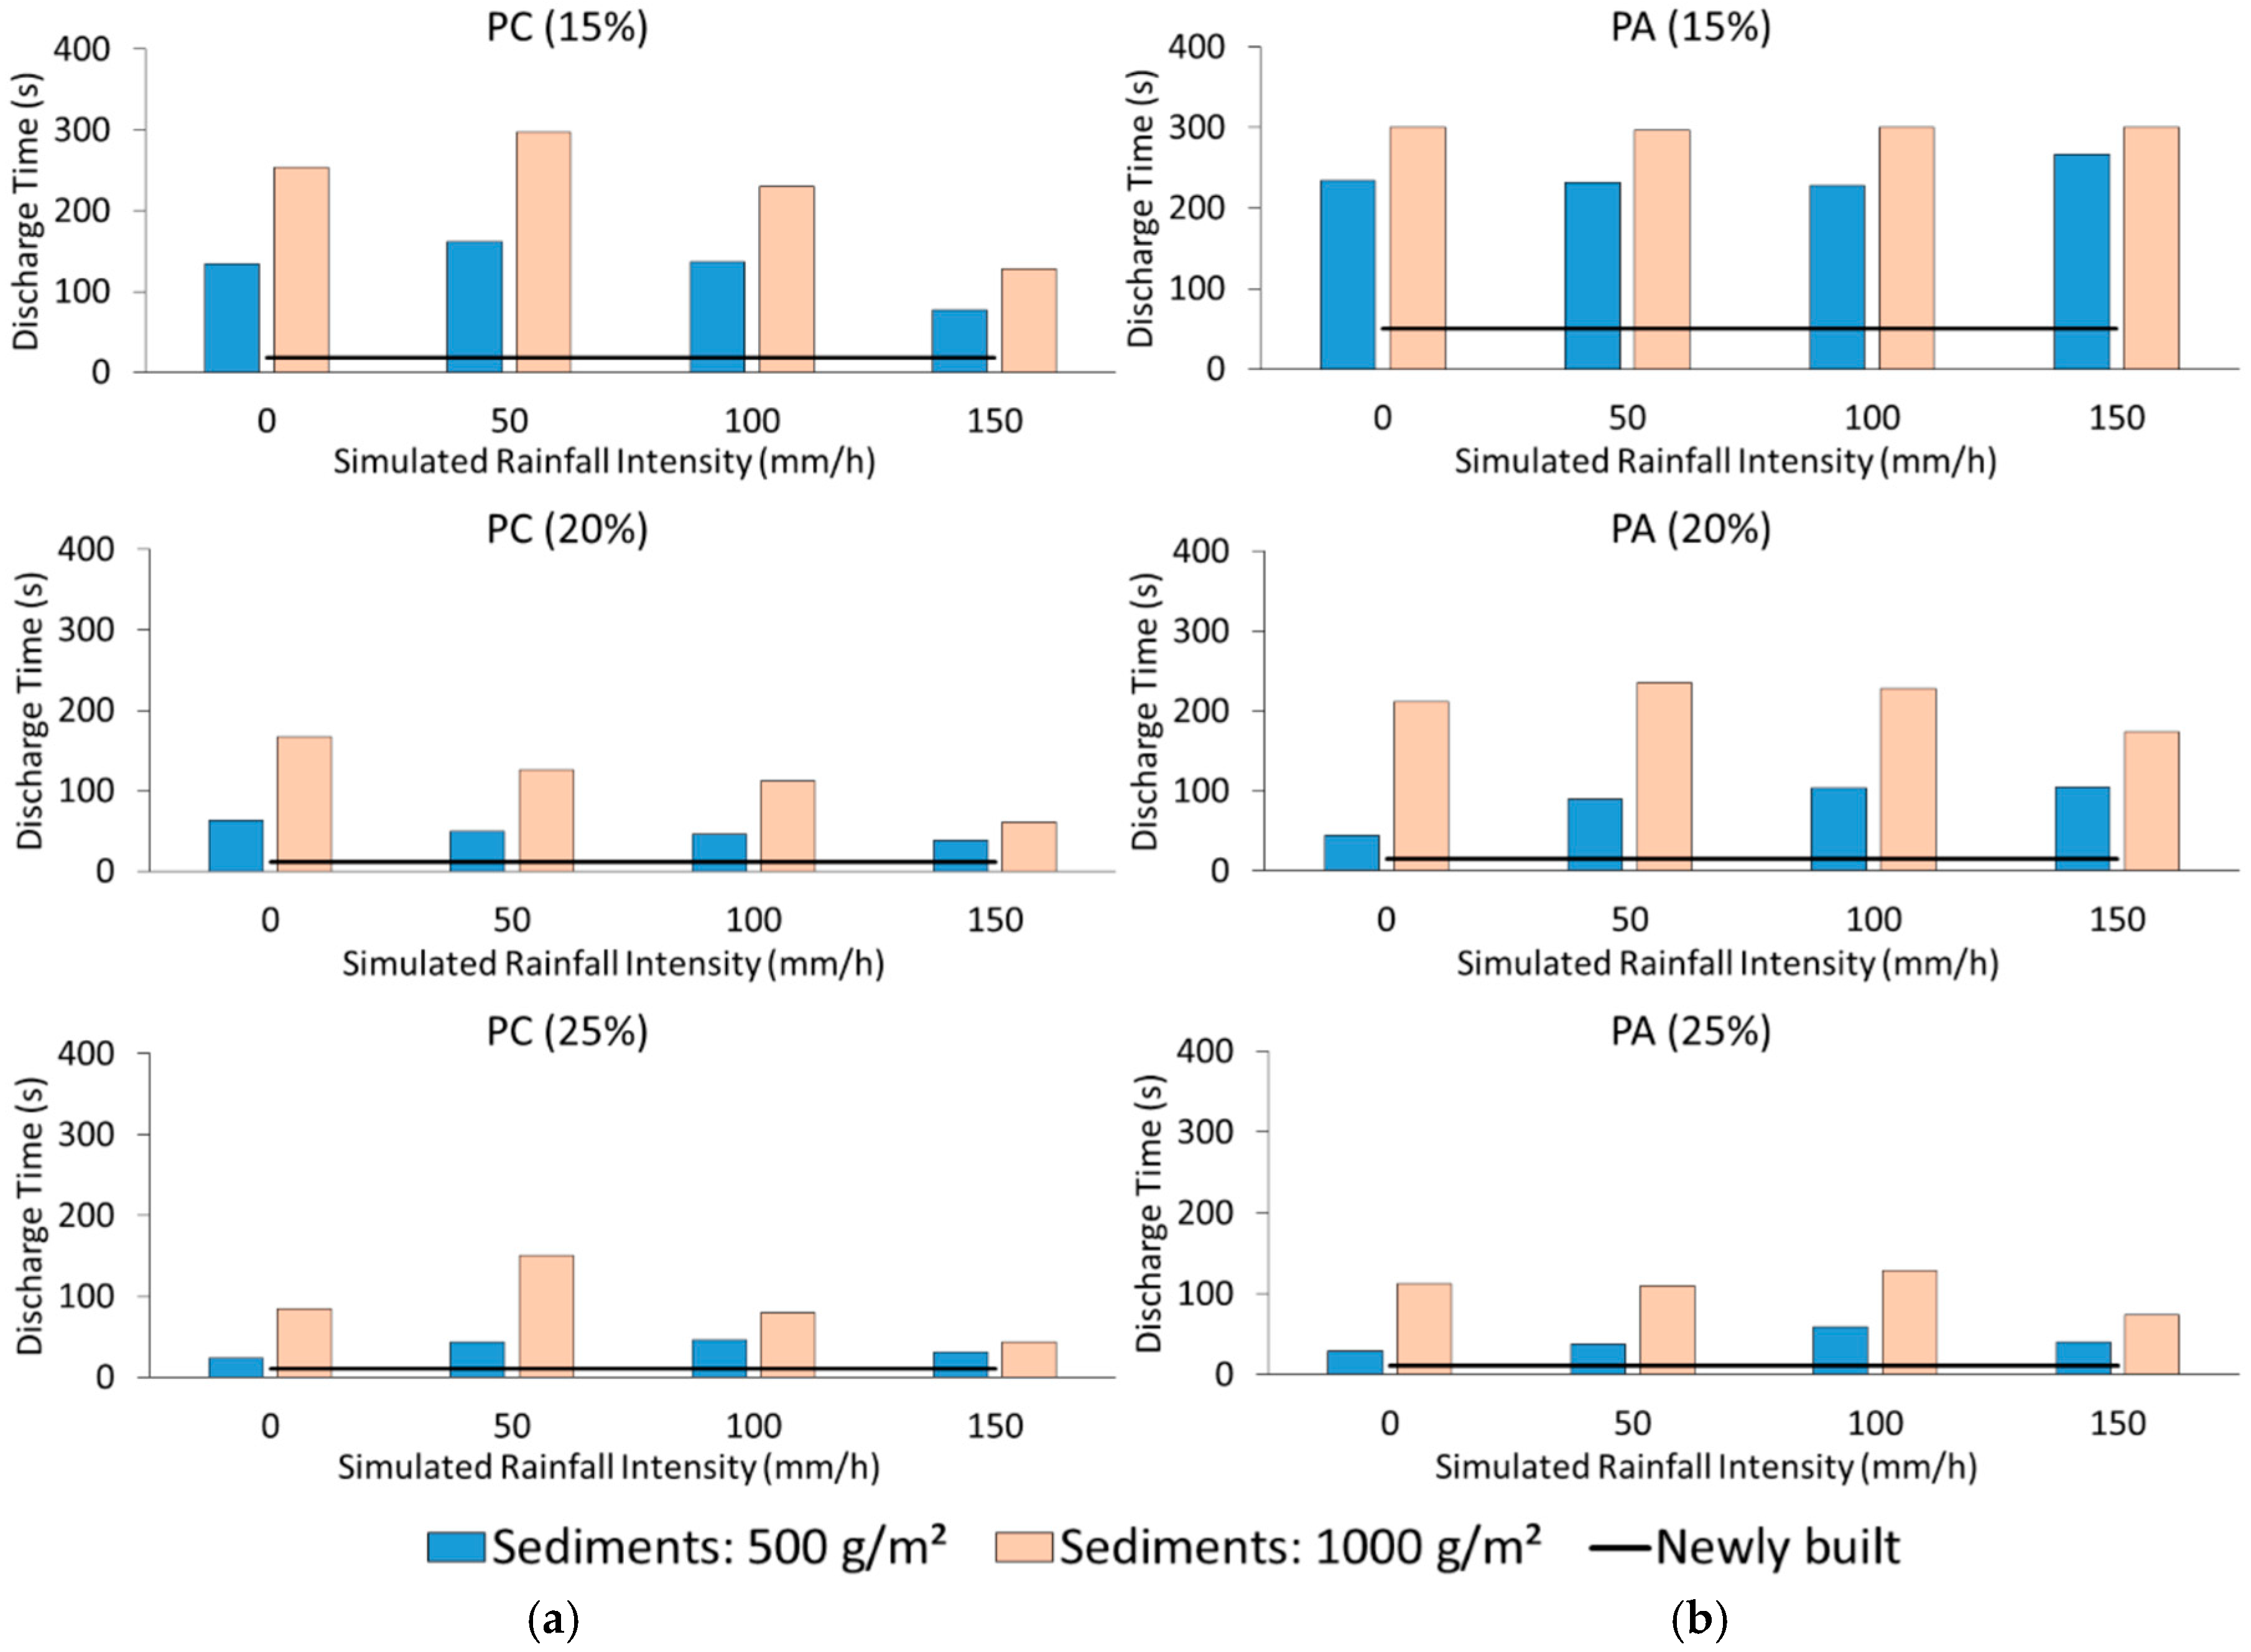
As can be observed in Figure 5, the intensity of the simulated rainfall influenced the infiltration capacity of the specimens. The loss in infiltration capacity was partially attenuated, especially with high rainfall intensities and sediment loads. However, the tendency observed in the infiltration capacity for the different scenarios is clearly different depending on the porous material used. In PC mixtures, the sediments are clearly washed away under high rainfall intensities, allowing up to 63% of the infiltration capacity to be recovered after a simulated rainfall event of 150 mm/h with a duration of 15 min. On the other hand, PA mixtures proved to be less affected by the cleaning effect produced by the simulated rainfall events; infiltration capacity even being negatively affected in some cases. This fact may be due to some consolidation of the material produced by the simulated rainfall, which led to a reduction in the infiltration capacity.
No runoff was observed in newly built specimens for all the rainfall intensities tested. The observed runoff was less than 2.5% in all the tested clogging scenarios with all the simulated rainfall intensities. However, it can also be observed that in this case, PA mixtures produced slightly higher runoff volumes than PC mixtures as a result of their lower infiltration capacity. These results are in agreement with previous studies [9], which observed residual runoff volumes of less than 6% for mixture air voids in the range of 25%, sediment loads of 2000 g/m2, and rainfall intensities of 60 mm/h. The infiltration capacity retained by pervious surfaces (also under clogging conditions) proved to be enough to manage most of the tested rainfall events without producing significant amounts of runoff, despite the infiltration capacity loss for all the simulated scenarios of clogging and rainfall events.

4. Conclusions

The infiltration capacity reduction produced due to the surface clogging proved to be critical in porous mixtures used in pavement infrastructures, even with low sediment loads. In fact, the discharge time obtained using the falling head permeameter was found to be between three to five times higher in clogged mixtures with 500 g/m2, and between six to fourteen times higher in clogged mixtures with 1000 g/m2.
Rainfall intensity was demonstrated to significantly affect the infiltration capacity of clogged pervious surfaces. The wash-off produced by the rain drops partially restored the infiltration capacity of the pavement, decreasing the discharge time to 35% in PA mixtures and 60% in PC mixtures.
In the spite of the fact that the infiltration capacity was dramatically reduced due to the clogging produced by the sediments, the observed runoff was less than 2.5% in all the scenarios with all of the rainfall intensities tested.
The infiltration capacity of PC mixtures proved to be less affected by the increase of the sediment loads or the reduction of the air voids in the mixture. The differences between the void structure of the PC and PA mixtures tested, resulting from the different mixture designs, led to higher infiltration capacities and lower clogging rates in the PC mixtures.
The PC mixtures tested were found to provide higher infiltration capacities than PA mixtures for air void contents between 15% and 25% when applying sediment loads between 0 and 1000 g/m2. The infiltration capacity reduction, depending on the air void content and the sediment load, proved to be higher in the PA mixtures tested. Moreover, the infiltration capacity recovery produced due to sediment wash-off by the simulated rainfall was more effective in the PC mixtures tested. Furthermore, the PC mixtures tested in this research performed better in terms of clogging potential and infiltration capacity compared to the PA mixtures tested, allowing maintenance activities to be delayed.
Further research is needed in order to assess the influence of the parameters studied in the present research, modifying the rainfall duration and the pavement’s geometrical conditions, such as the pavement slope. Moreover, a more detailed study of the relationship between the volumetric properties of the pore structure of porous mixtures and the infiltration capacity is necessary for a more accurate understanding and prediction of the clogging dynamics of these materials.

Acknowledgments

The authors wish to thank the “Gaudenzio Fantoli” Hydraulic Laboratory, and the Road Research Laboratory (LSS) of the Politecnico di Milano for their kind collaboration. Valerio C. Andrés-Valeri also wishes to thank the Spanish Ministry of Economy and competitiveness for funding his research activities in the Politecnico di Milano through the PhD Fellowship (BES-2013-062604) and the grant (EEBB-I-2015-10095) related to the research project (BIA2012-32463 MINECO/ERDF-EU). Mariana Marchioni would also like to thanks Capes for funding this work through the scholarship number BEX 9224/13-0 as part of the Ciências sem Fronteiras programme.

Author Contributions

All authors conceived and designed the experiments; Valerio C. Andrés-Valeri and Mariana Marchioni performed the experiments; Valerio C. Andrés-Valeri, Mariana Marchioni and Luis A. Sañudo-Fontaneda analyzed the data; Filippo Giustozzi and Gianfranco Becciu contributed materials and analysis tools; Valerio C. Andrés-Valeri and Luis A. Sañudo-Fontaneda wrote the paper. All authors discussed the results and stated the final conclusions.

Conflicts of Interest

The authors declare no conflict of interest. The founding sponsors had no role in the design of the study; in the collection, analyses, or interpretation of data; in the writing of the manuscript, and in the decision to publish the results.

References

  1. Rodriguez-Hernandez, J.; Andrés-Valeri, V.C.; Ascorbe-Salcedo, A.; Castro-Fresno, D. Laboratory study on the stormwater retention and runoff attenuation capacity of four permeable pavements. J. Environ. Eng. 2016, 142. [Google Scholar] [CrossRef]
  2. Castro-Fresno, D.; Andrés-Valeri, V.C.A.; Sañudo-Fontaneda, L.A.; Rodríguez-Hernández, J. Sustainable Drainage Practices in Spain, Specifically Focused on Pervious Pavements. Water 2013, 5, 67–93. [Google Scholar] [CrossRef]
  3. Rodriguez-Hernandez, J.; Andrés-Valeri, V.C.; Calzada-Pérez, M.A.; Vega-Zamanillo, A.; Castro-Fresno, D. Study of the raveling resistance of porous asphalt pavements used in sustainable drainage systems affected by hydrocarbon spills. Sustainability 2015, 7, 16226–16236. [Google Scholar] [CrossRef]
  4. Andrés-Valeri, V.C.A.; Castro-Fresno, D.; Sañudo-Fontaneda, L.Á.; Rodríguez-Hernández, J.; Ballester-Muñoz, F.; Canteras-Jordana, J.C. Rehabilitación hidrológica urbana. In Proceedings of the RHEABEND 2014 World Congress, Santander, Spain, 1–4 April 2014. (In Spanish)
  5. Willems, P.; Arnbjerg-Nielsen, K.; Olsson, J.; Nguyen, V.T.V. Climate change impact assessment on urban rainfall extremes and urban drainage: Methods and shortcomings. Atmos. Res. 2012, 103, 106–118. [Google Scholar] [CrossRef]
  6. Kuang, X.; Fu, Y. Coupled infiltration and filtration behaviours of concrete porous pavement and stormwater management. Hydrol. Process. 2012, 27, 532–540. [Google Scholar] [CrossRef]
  7. Rodriguez-Hernandez, J.; Castro-Fresno, D.; Fernández-Barrera, A.H.; Vega-Zamanillo, Á. Characterization of Infiltration Capacity of Permeable Pavements with Porous Asphalt Surface Using Cantabrian Fixed Infiltrometer. J. Hydrol. Eng. 2012, 17, 597–603. [Google Scholar] [CrossRef]
  8. Sansalone, J.; Kuang, X.; Ying, G.; Ranieri, V. Filtration and clogging of permeable pavement loaded by urban drainage. Water Res. 2012, 46, 6763–6774. [Google Scholar] [CrossRef] [PubMed]
  9. Sañudo-Fontaneda, L.A.; Rodriguez-Hernandez, J.; Calzada-Pérez, M.A.; Castro-Fresno, D. Infiltration behaviour of polymer-modified porous concrete and porous asphalt surfaces used in SuDS techniques. Clean Soil Air Water 2014, 42, 139–145. [Google Scholar] [CrossRef]
  10. Alvarez, A.E.; Martin, A.E.; Estakhri, C. A review of mix design and evaluation research for permeable friction course mixtures. Constr. Build. Mater. 2011, 25, 1159–1166. [Google Scholar] [CrossRef]
  11. Liu, Q.; Cao, D. Research on material composition and performance of porous asphalt pavement. J. Mater. Civ. Eng. 2009, 21, 135–140. [Google Scholar] [CrossRef]
  12. Dougherty, M.; Hein, M.; Martina, B.A.; Ferguson, B.K. Quick surface infiltration test to assess maintenance needs on small pervious concrete sites. J. Irrig. Drain. Eng. 2011, 137, 553–563. [Google Scholar] [CrossRef]
  13. Li, H.; Kayhanian, M.; Harvey, J.T. Comparative field permeability measurement of permeable pavements using ASTM C1701 and NCAT permeameter methods. J. Environ. Manag. 2013, 118, 144–152. [Google Scholar] [CrossRef] [PubMed]
  14. Ranieri, V.; Colonna, P.; Sansalone, J.J.; Sciddurlo, A. Measurement of hydraulic conductivity in porous mixes. J. Transp. Res. Board 2012, 2295, 1–10. [Google Scholar] [CrossRef]
  15. Fernández-Barrera, A.H.; Castro-Fresno, D.; Rodríguez-Hernández, J.; Calzada-Pérez, M.A. Infiltration capacity assessment of urban pavements using the LCS permeameter and the CP infiltrometer. J. Irrig. Drain. Eng. 2008, 134, 659–665. [Google Scholar] [CrossRef]
  16. Nichols, P.W.B.; Lucke, T.; Dierkes, C. Comparing two methods of determining infiltration rates of permeable interlocking concrete pavers. Water 2014, 6, 2353–2366. [Google Scholar] [CrossRef]
  17. Sansalone, J.; Kuang, X.; Ranieri, V. Permeable pavement as a hydraulic and filtration interface for urban drainage. J. Irrig. Drain. Eng. 2008, 134, 666–674. [Google Scholar] [CrossRef]
  18. Coughlin, J.P.; Campbell, C.D.; Mays, D.C. Infiltration and Clogging by Sand and Clay in a Pervious Concrete Pavement System. J. Hydrol. Eng. 2011, 17, 68–73. [Google Scholar] [CrossRef]
  19. Lucke, T.; Beecham, S. Field investigation of clogging in a permeable pavement system. Build. Res. Inf. 2011, 39, 603–615. [Google Scholar] [CrossRef]
  20. Sañudo-Fontaneda, L.A.; Andrés-Valeri, V.C.A.; Rodriguez-Hernandez, J.; Castro-Fresno, D. Field study of infiltration capacity reduction of porous mixture surfaces. Water 2014, 6, 661–669. [Google Scholar] [CrossRef]
  21. Balades, J.-D.; Legret, M.; Madiec, H. Permeable pavements: Pollution management tools. Water Sci. Technol. 1995, 32, 49–56. [Google Scholar] [CrossRef]
  22. Al-Rubaei, A.M.; Stenglein, A.L.; Viklander, M.; Blecken, G.T. Long-Term hydraulic performance of porous asphalt pavements in Northern Sweden. J. Irrig. Drain. Eng. 2013, 139, 499–505. [Google Scholar] [CrossRef]
  23. Martin, W.D.; Kaye, N.B.; Putman, B.J. Impact of vertical porosity distribution on the permeability of pervious concrete. Constr. Build. Mater. 2014, 59, 78–84. [Google Scholar] [CrossRef]
  24. Kayhanian, M.; Anderson, D.; Harvey, J.T.; Jones, D.; Muhunthan, B. Permeability measurement and scan imaging to assess clogging of pervious concrete pavements in parking lots. J. Environ. Manag. 2012, 95, 114–123. [Google Scholar] [CrossRef] [PubMed]
  25. Rodriguez-Hernandez, J.; Fernández-Barrera, A.H.; Andrés-Valeri, V.C.A.; Vega-Zamanillo, A.; Castro-Fresno, D. Relationship between urban runoff pollutant and catchment characteristics. J. Irrig. Drain. Eng. 2013, 139, 833–840. [Google Scholar] [CrossRef]
  26. Yong, C.F.; McCarthy, D.T.; Deletic, A. Predicting physical clogging of porous and permeable pavements. J. Hydrol. 2013, 481, 48–55. [Google Scholar] [CrossRef]
  27. Bonicelli, A.; Giustozzi, F.; Crispino, M.; Borsa, M. Evaluating the effect of reinforcing fibres on pervious concrete volumetric and mechanical properties according to different compaction energies. Eur. J. Environ. Civ. Eng. 2013, 19, 184–198. [Google Scholar] [CrossRef]
  28. Bonicelli, A.; Giustozzi, F.; Crispino, M. Experimental study on the effects of fine sand addition on differentially compacted pervious concrete. Constr. Build. Mater. 2015, 91, 102–110. [Google Scholar] [CrossRef]
  29. Cominsky, R.J.; Huber, G.A.; Kennedy, T.W.; Anderson, M. The Superpave 279 Mix Design Manual for New Construction and Overlays; SHRP A-407 Report; U.S. National Research Council: Washington, DC, USA, 1994. [Google Scholar]
  30. Deletic, A.; Orr, D.W. Pollution buildup on road surfaces. J. Environ. Eng. 2005, 131, 49–59. [Google Scholar] [CrossRef]
  31. Zanders, J.M. Road sediment: Characterization and implications for the performance of vegetated strips for treating road run-off. Sci. Total Environ. 2005, 339, 41–47. [Google Scholar] [CrossRef] [PubMed]
  32. Zafra, C.A.; Temprano, J.; Tejero, I. Particle size distribution of accumulated sediments on an urban road in rainy weather. Environ. Technol. 2008, 29, 571–582. [Google Scholar] [CrossRef] [PubMed]
  33. Bian, B.; Zhu, W. Particle size distribution and pollutants in road-deposited sediments in different areas of Zhenjiang, China. Environ. Geochem. Health 2009, 31, 511–520. [Google Scholar] [CrossRef] [PubMed]
  34. EN 12697-40. Bituminous Mixtures—Test Methods for Hot Mix Asphalt Part 40: In Situ Drainability; CEN (European Committee for Standarization): Bruxelles, Belgium, 2012. [Google Scholar]
  35. Hudson, N.W. The Flour Pellet Method for Measuring the Size of Raindrops; Department of Conservation and Extension: Salisbury, Rhodesia, 1964.
  36. Kathiravelu, G.; Lucke, T.; Nichols, P. Rain Drop Measurement Techniques: A Review. Water 2016, 8, 29. [Google Scholar] [CrossRef]
  37. Asseline, J.; Valentin, C. Construction et mise au point d’un infiltromètre à aspersion. Cah. ORSTOM Sér. Hydrol. 1978, 15, 321–349. (In French) [Google Scholar]
  38. Nnadi, E.O.; Coupe, S.J.; Sañudo-Fontaneda, L.A.; Rodriguez-Hernandez, J. An evaluation of enhanced geotextile layer in permeable pavement to improve stormwater infiltration and attenuation. Int. J. Pavement Eng. 2014, 15, 925–932. [Google Scholar] [CrossRef]
  39. Shirke, N.A.; Shuler, S. Cleaning porous pavements using a reverse flush process. J. Transp. Eng. 2009, 135, 832–838. [Google Scholar] [CrossRef]
  40. Mann, H.B.; Whitney, D.R. On a test of whether one or more random variables is stochastically larger than in the other. Ann. Math. Stat. 1947, 18, 52–54. [Google Scholar] [CrossRef]
  41. Alvarez, A.E.; Martin, A.E.; Estakhri, C. Internal structure of compacted permeable friction course mixtures. Constr. Build. Mater. 2010, 24, 1027–1035. [Google Scholar] [CrossRef]
  42. Mansour, T.N.; Putman, B.J. Influence of aggregate gradation on the performance properties of porous asphalt mixtures. J. Mater. Civ. Eng. 2013, 25, 281–288. [Google Scholar] [CrossRef]
  43. Martin, W.D.; Putman, B.J.; Neptune, A.I. Influence of aggregate gradation on clogging characteristics of porous asphalt mixtures. J. Mater. Civ. Eng. 2014, 26, 04014026. [Google Scholar] [CrossRef]
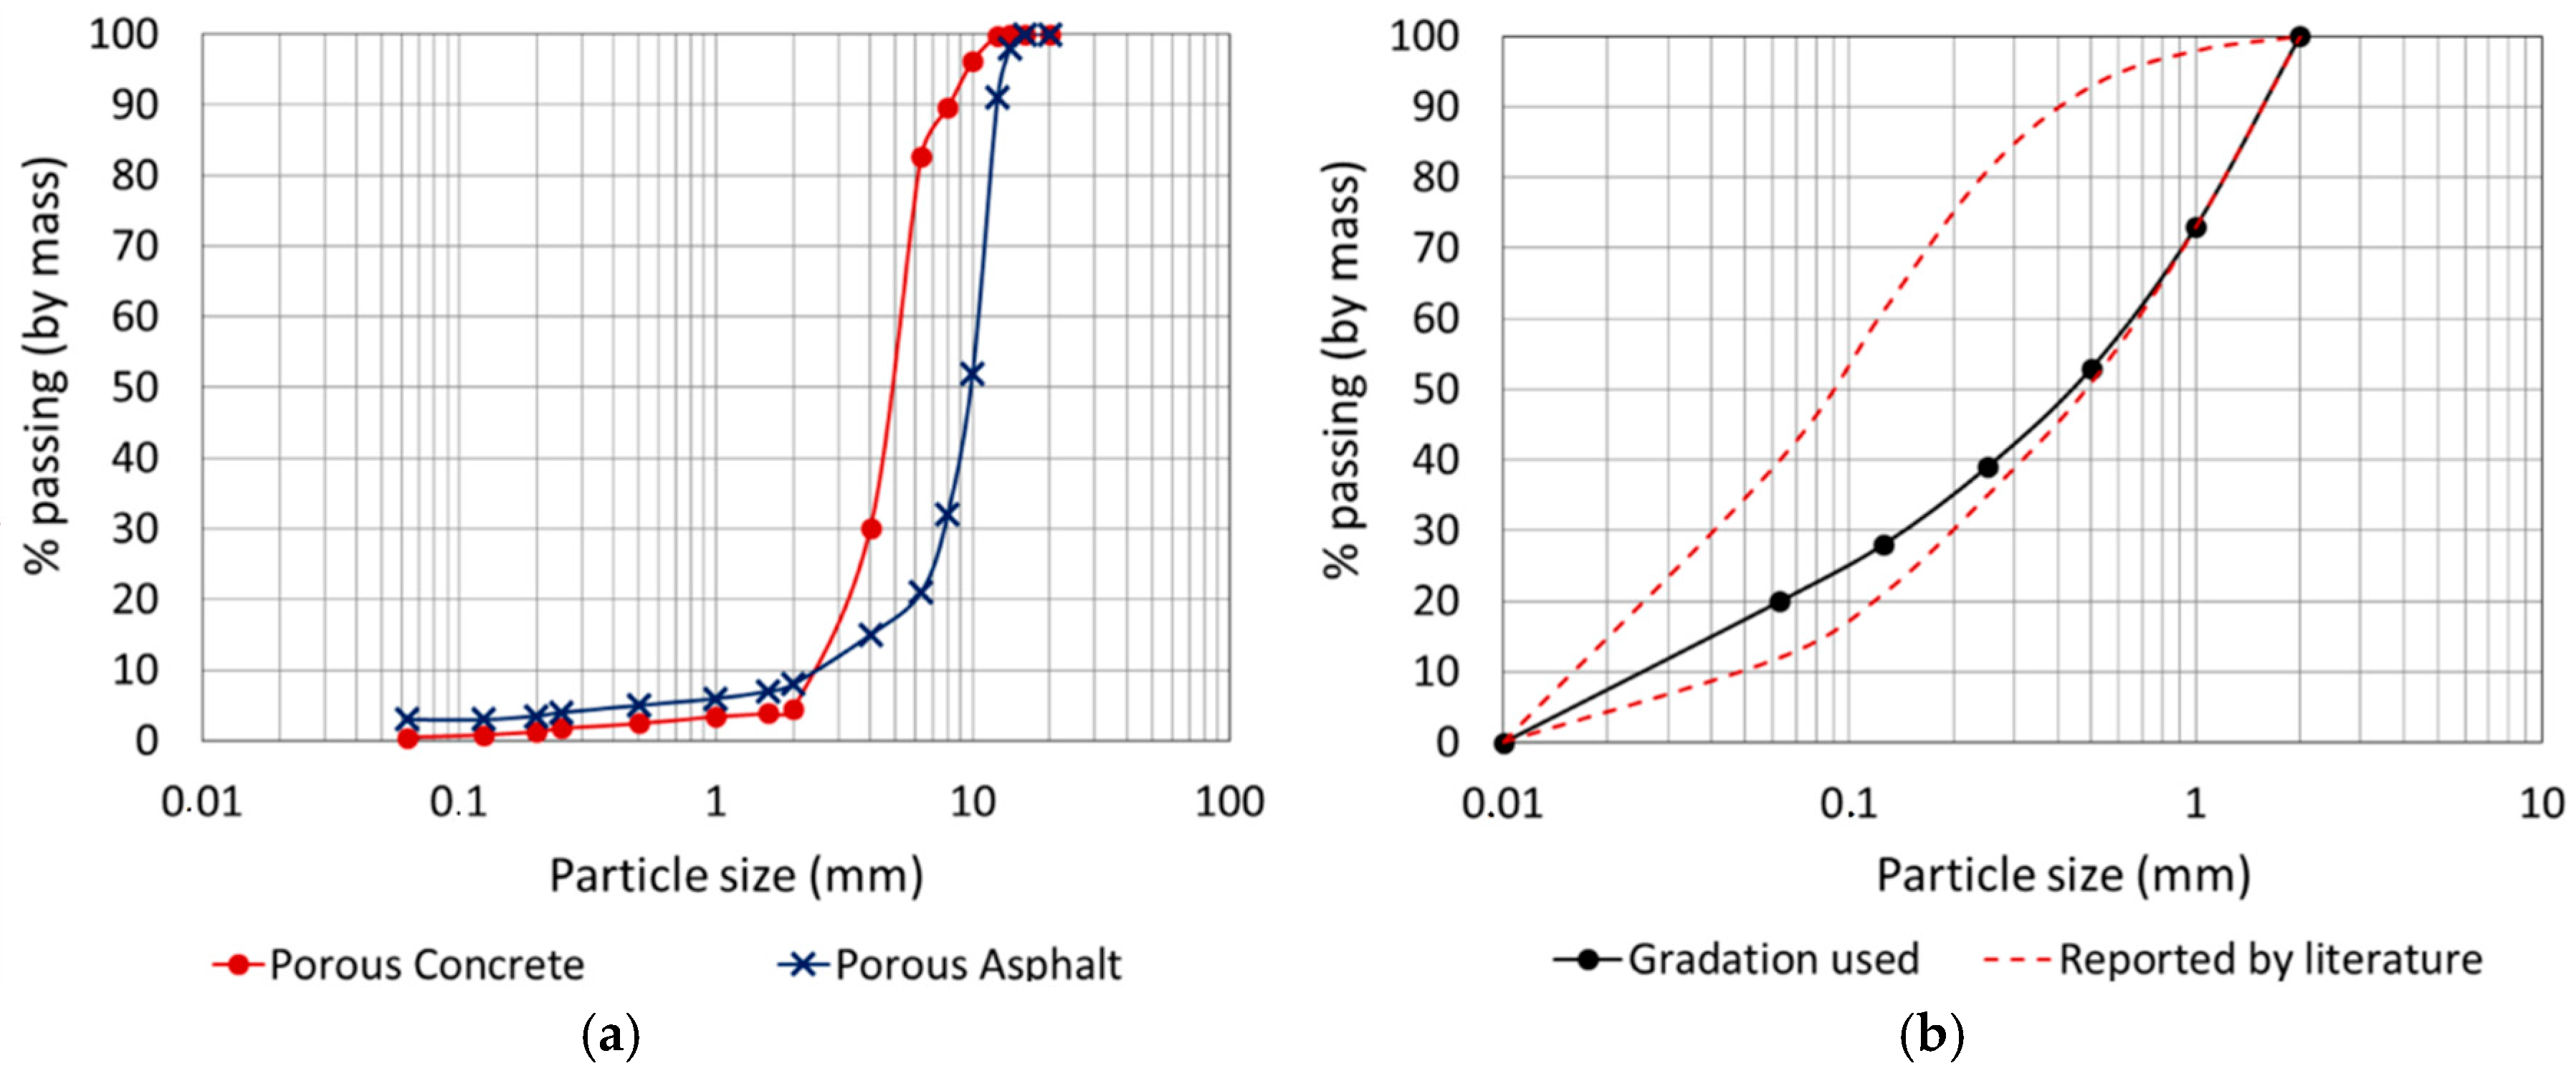
Figure 1. (a) Gradation of aggregates used in porous concrete (PC) and porous asphalt (PA) mixtures; and (b) Gradation of clogging sediments used and range of particle sizes reported by the literature [30,31,32,33].
Sustainability 08 00751 g001
Figure 2. Rainfall simulator photograph and details. 1: Raindrops maker; 2: Testing area; 3: Support structure; 4: Plastic grid; 5: Flowmeter; 6: Flowmeter Inlet pipe; 7: Flowmeter Outlet pipe; 8: Flexible pipes; 9: Drippers; 10: Specimen support; 11: Specimen; 12: Waterproofing; 13: Runoff conveyance ramp; 14: Runoff collecting pipe; 15: Infiltrated water conveyance ramp; 16: Infiltrated water collecting pipe.
Sustainability 08 00751 g002
Figure 3. Rainfall simulator calibration: (a) rainfall intensity; and (b) drop size distribution.
Sustainability 08 00751 g003
Figure 4. Average discharge time obtained in each slab of PC and PA mixtures tested, depending on the: (a) air void content; and (b) sediment load.
Sustainability 08 00751 g004
Figure 5. Average discharge time obtained in permeability test for the air void contents tested (X%) in: (a) porous concrete (PC) mixtures; and (b) porous asphalt (PA) mixtures.
Sustainability 08 00751 g005
Table 1. Average discharge time measured at the centre point of the tested slabs in newly built conditions and after being cleaned at the end of the test in each clogging scenario.
MaterialAir Voids (%)Discharge Time (s)
Newly BuiltAfter Testing a Sediment Load of 500 g/m2After Testing a Sediment Load of 1000 g/m2
PC15181616
20171213
25111112
PA15665755
20161617
25141619
Table 2. Infiltration capacity and observed runoff for the tested scenarios.
Air Void Content (%)Sediment Load (g/m2)Simulated Rainfall Intensity (mm/h)Discharge Time (s)Runoff (% of Rainfall)
PA MixturesPC MixturesPA MixturesPC Mixtures
MeanStd. Dev.MeanStd. Dev.
1550002355813569--
20500045186348--
25500030182414--
1510000300125441--
20100002111416787--
2510000113538584--
15500502312016252.0%0.0%
205005090505062.5%0.5%
255005038643200.0%0.0%
15100050297529760.5%0.0%
2010005023689126560.5%0.0%
25100050111291511100.5%0.0%
1550010022865137431%0.5%
205001001044146171.5%0.5%
25500100592347281.5%0.5%
1510001003001230241%0.5%
20100010022767112391.5%0.5%
2510001001291080281.5%0.5%
155001502662978210.5%0.0%
205001501054238110.5%0.0%
2550015041731140.0%0.0%
1510001503001128400.0%0.0%
201000150174161160.0%0.0%
251000150743243190.0%0.0%
15050/100/150 (*)50151820.0%0.0%
20050/100/150 (*)1511220.0%0.0%
25050/100/150 (*)1121030.0%0.0%
(*) The % of runoff is for the three simulated rainfall intensities and the discharge time is without previous rainfall events.