
Decision-Making and Sustainable Drainage: Design and Scale

Abstract
:1. Introduction
- To show how the decision-making process in terms of designing a SuDS management train is scale-related with reference to the city of Coventry, a local government authority in central England.
- To illustrate this with the application of a large scale site-specific model that identifies the individual SuDS devices suitable for the area using geographical information.
- To model at the smaller scale to achieve greenfield runoff taking climate change into account.
2. Methodology
3. Results
4. Discussion
5. Conclusions
Acknowledgments
Author Contributions
Conflicts of Interest
References
- CIRIA. Sustainable Urban Drainage Systems: Best Practice Manual; CIRIA: London, UK, 2001. [Google Scholar]
- Charlesworth, S.M.; Harker, E.; Rickard, S. Sustainable Drainage Systems (SuDS): A soft option for hard drainage questions? Geography 2003, 88, 99–107. [Google Scholar]
- Woods Ballard, B.; Wilson, S.; Udale-Clarke, H.; Illman, S.; Ashley, R.; Kellagher, R. The SuDS Manual; CIRIA: London, UK, 2015. [Google Scholar]
- Charlesworth, S. A review of the adaptation and mitigation of global climate change using sustainable drainage in cities. J. Water Clim. Chang. 2010, 1, 165–180. [Google Scholar] [CrossRef]
- Warwick, F.; Charlesworth, S. Sustainable Drainage Devices for Carbon Mitigation. Manag. Environ. Qual. 2013, 24, 123–136. [Google Scholar] [CrossRef]
- DCLG (Department for Communities and Local Government). National Planning Policy Framework. Available online: https://www.gov.uk/government/publications/national-planning-policy-framework--2 (accessed on 12 May 2016).
- Dierkes, C.; Lucke, T.; Helmreich, B. General Technical Approvals for Decentralised Sustainable Urban Drainage Systems (SUDS)—The Current Situation in Germany. Sustainability 2015, 7, 3031–3051. [Google Scholar] [CrossRef]
- Zhou, Z.; Qu, L.; Zou, T. Quantitative analysis of urban pluvial flood alleviation by open surface water systems in new towns: Comparing Almere and Tianjin Eco-City. Sustainability 2015, 7, 13378–13398. [Google Scholar] [CrossRef]
- Scholz, M.; Grabowiecki, P. Review of permeable pavement systems. Build. Environ. 2007, 42, 3830–3836. [Google Scholar] [CrossRef]
- Stovin, V.R. The potential of green roofs to manage urban stormwater. Water Environ. J. 2010, 24, 192–199. [Google Scholar] [CrossRef]
- Charlesworth, S.M.; Perales-Momparler, S.; Lashford, C.; Warwick, F. The sustainable management of surface water at the building scale: preliminary results of case studies in the UK and Spain. J. Water Supply Res. Technol. AQUA 2013, 62, 534–544. [Google Scholar] [CrossRef]
- Kim, H.; Lee, D.-K.; Sung, S. Effect of urban green spaces and flooded area type on flooding probability. Sustainability 2016. [Google Scholar] [CrossRef]
- Tota-Maharaj, K.; Paul, P. Sustainable approaches for stormwater quality improvements with experimental geothermal paving systems. Sustainability 2015, 7, 1388–1410. [Google Scholar] [CrossRef]
- Defra (Department of Environment, Food and Rural Affairs). Sustainable Drainage Systems. Non-Statutory Technical Standards for Sustainable Drainage Systems. Available online: https://www.gov.uk/government/publications/sustainable-drainage-systems-non-statutory-technical-standards (accessed on 21 June 2016).
- Hubert, J.; Edwards, T.; Jahromi, B.A. Comparative study of sustainable drainage systems. Eng. Sustain. 2013, 166, 138–149. [Google Scholar] [CrossRef]
- Lashford, C.; Charlesworth, S.; Warwick, F.; Blackett, M. Deconstructing the sustainable drainage management train in terms of water quantity; preliminary results for Coventry, UK. CLEAN Soil Air Water 2014, 42, 187–192. [Google Scholar] [CrossRef]
- Coventry City Council. Canley Regeneration Project. Environmental Statement-Non-Technical Summary; 2008. Available online: http://planning.coventry.gov.uk/portal/servlets/AttachmentShowServlet?ImageName=791587 (accessed on 12 May 2016). [Google Scholar]
- Warwick, F.; Charlesworth, S.; Blackett, M. Geographical information as a decision support tool for sustainable drainage at the city scale. In Proceedings of the Novatech 8th International Conference on Planning and Technologies for Sustainable Urban Water Management, Lyon, France, 24–26 June 2013.
- ESRI. ArcGIS (Version 10.0 Build 2414); ESRI: Redlands, CA, USA, 2010. [Google Scholar]
- Halcrow Group Ltd. Coventry City Council Strategic Flood Risk Assessment: Level 2, Canley Site; Halcrow Group Ltd.: London, UK, 2008. [Google Scholar]
- Swan, A. A Decision-Support System for the Design of Retrofit Sustainable Urban Drainage Systems (SuDS). Ph.D. Thesis, University of Sheffield, Sheffield, UK, 2003. [Google Scholar]
- Environment Agency. Flood Risk Assessments: Climate Change Allowances. Available online: https://www.gov.uk/guidance/flood-risk-assessments-climate-change-allowances (accessed on 21 June 2016).
- National Planning. Policy Framework. Department for Communities and Local Government. Available online: https://www.gov.uk/government/uploads/system/uploads/attachment_data/file/6077/2116950.pdf (accessed on 1 July 2016).


| SuDS Device Grouping | Function | Example Devices |
|---|---|---|
| Source Control | Slow down, store and treat runoff at locations close to where rain has fallen. Water can be released gradually or utilised for non-potable purposes. | Green Roof |
| Rainwater harvesting | ||
| Permeable paving | ||
| Sub-surface storage | ||
| Trees | ||
| Rain garden | ||
| Disconnected downpipe | ||
| Infiltration | Runoff storage and infiltration into the ground to recharge groundwater | Soakaway |
| Infiltration basin | ||
| Infiltration trench | ||
| Detention and retention | Basins with temporary or permanent storage of runoff. Removal of pollutants to improve water quality | Detention basin |
| Retention basin | ||
| Pond | ||
| Wetland | ||
| Filtration | Slow down flow and treat runoff to remove pollutants | Sand filter |
| Filter strip | ||
| Filter trench | ||
| Bioretention device | ||
| Conveyance | Channels that convey runoff. Can also store and infiltrate water into the ground | Swale |
| Rill |
| Source Control | Infiltration | Detention | Filtration | Conveyance | |
|---|---|---|---|---|---|
| Implementation Guidelines | First Priority | Infiltrate Where Detention is not Possible, Detain Where Infiltration is not Possible | These Should Be Used Wherever Possible | ||
| Factors | |||||
| Physical | |||||
| Bedrock & surface geology | x | x | |||
| Water bodies | x | x | x | x | x |
| Fluvial flood zones | x | x | |||
| Soil drainage type | x | x | |||
| Topography | x | x | |||
| Water Table | x | x | |||
| Anthropogenic * | |||||
| Waste & landfill sites | x | ||||
| Current & former industrial sites | x | ||||
| Surface & ground water quality | x | x | |||
| Land cover | x | x | x | x | x |
| Planning constraints | x | x | |||
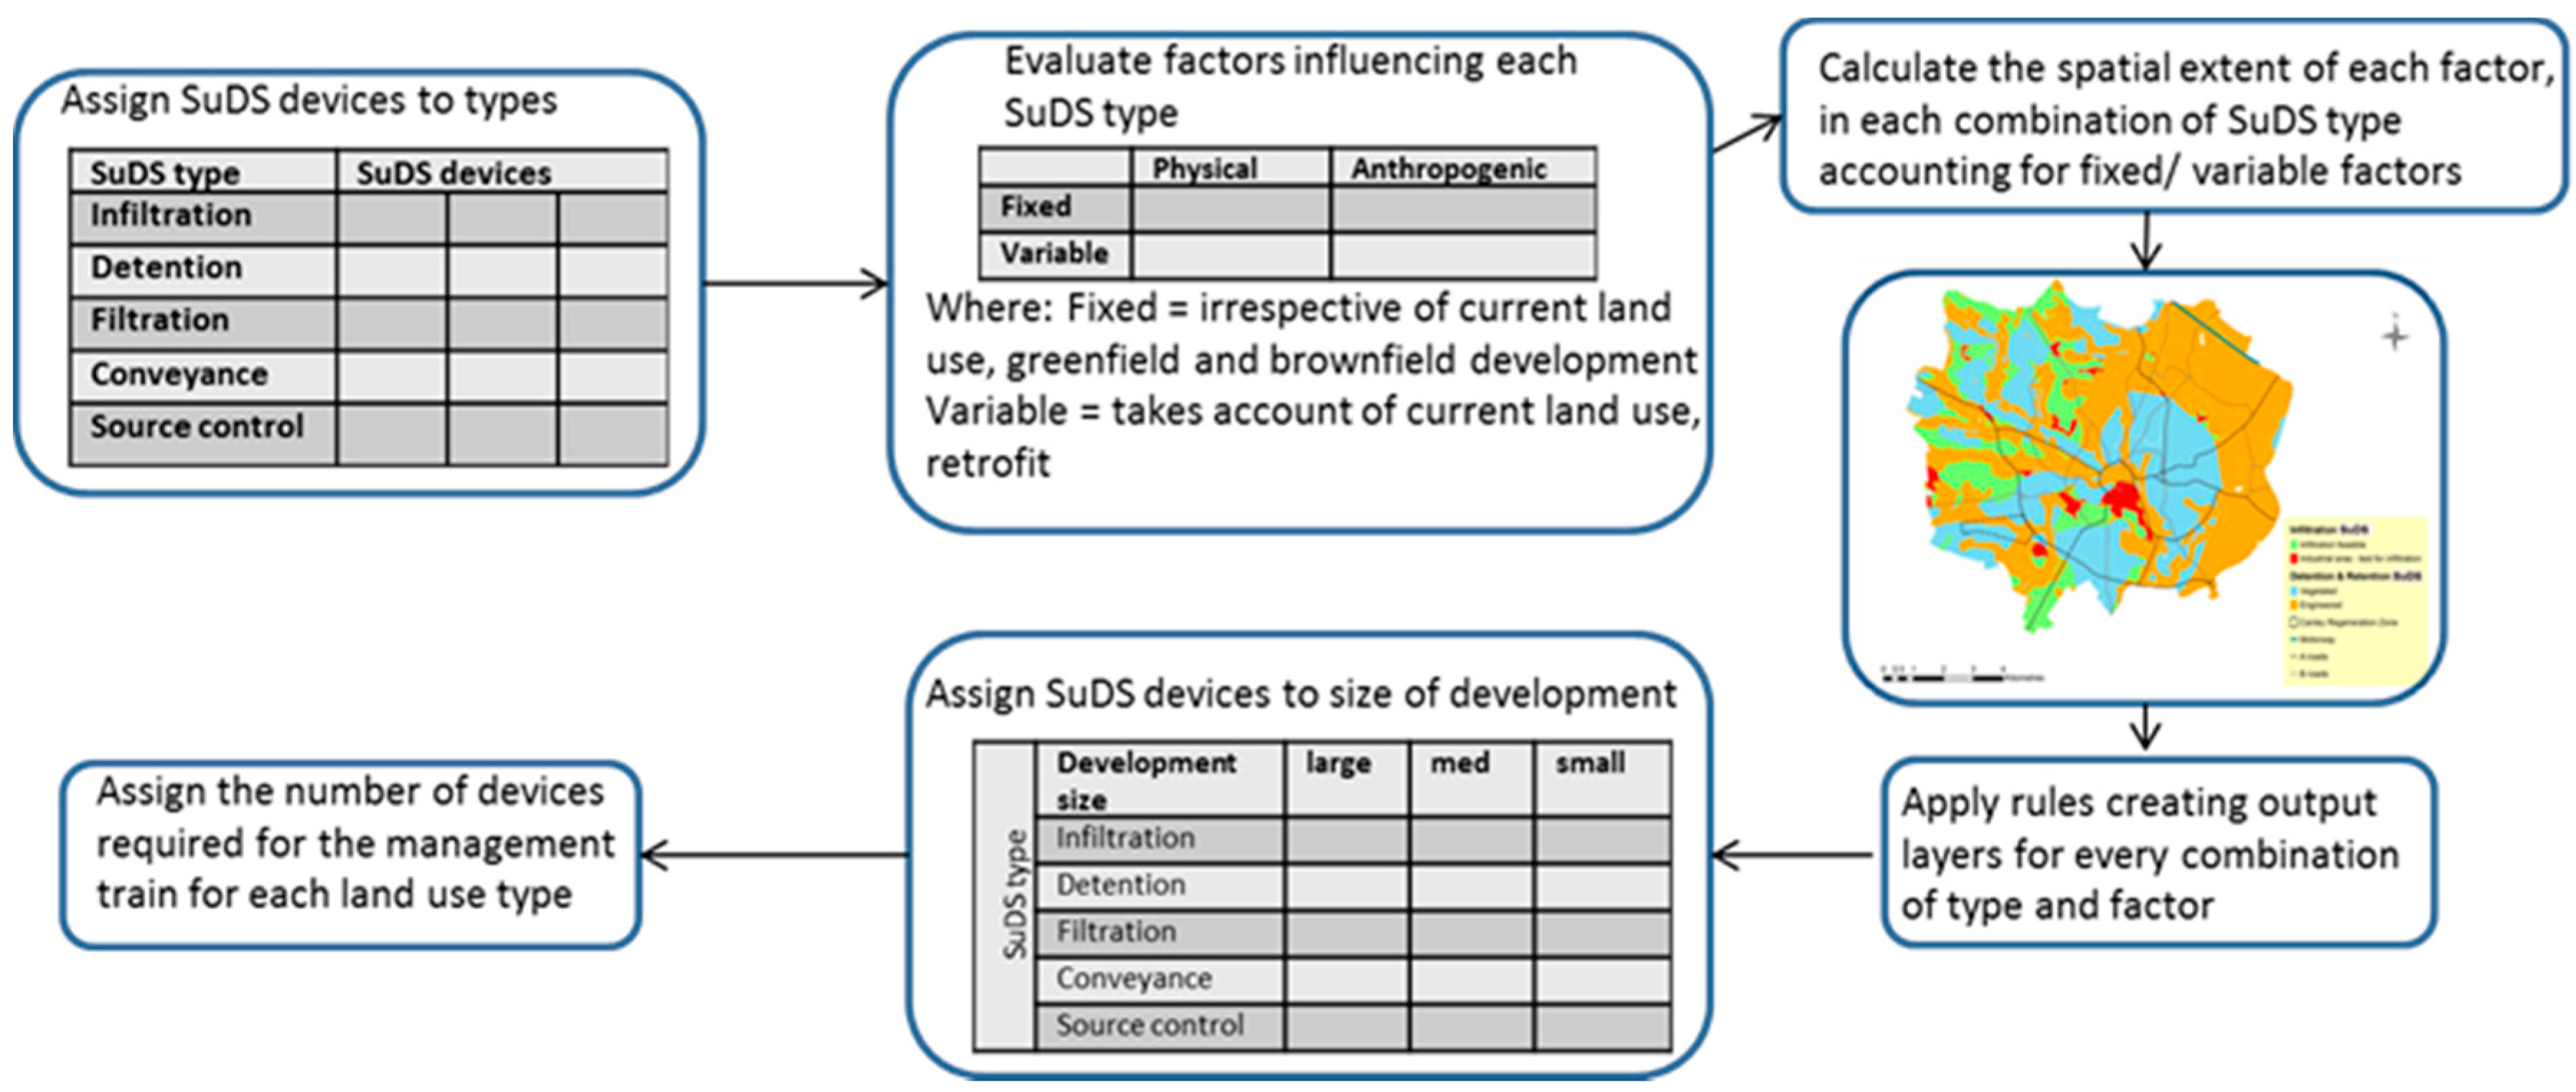
| Stage | Activity | Output |
|---|---|---|
| 1 | Define SuDS groupings | Table 1 |
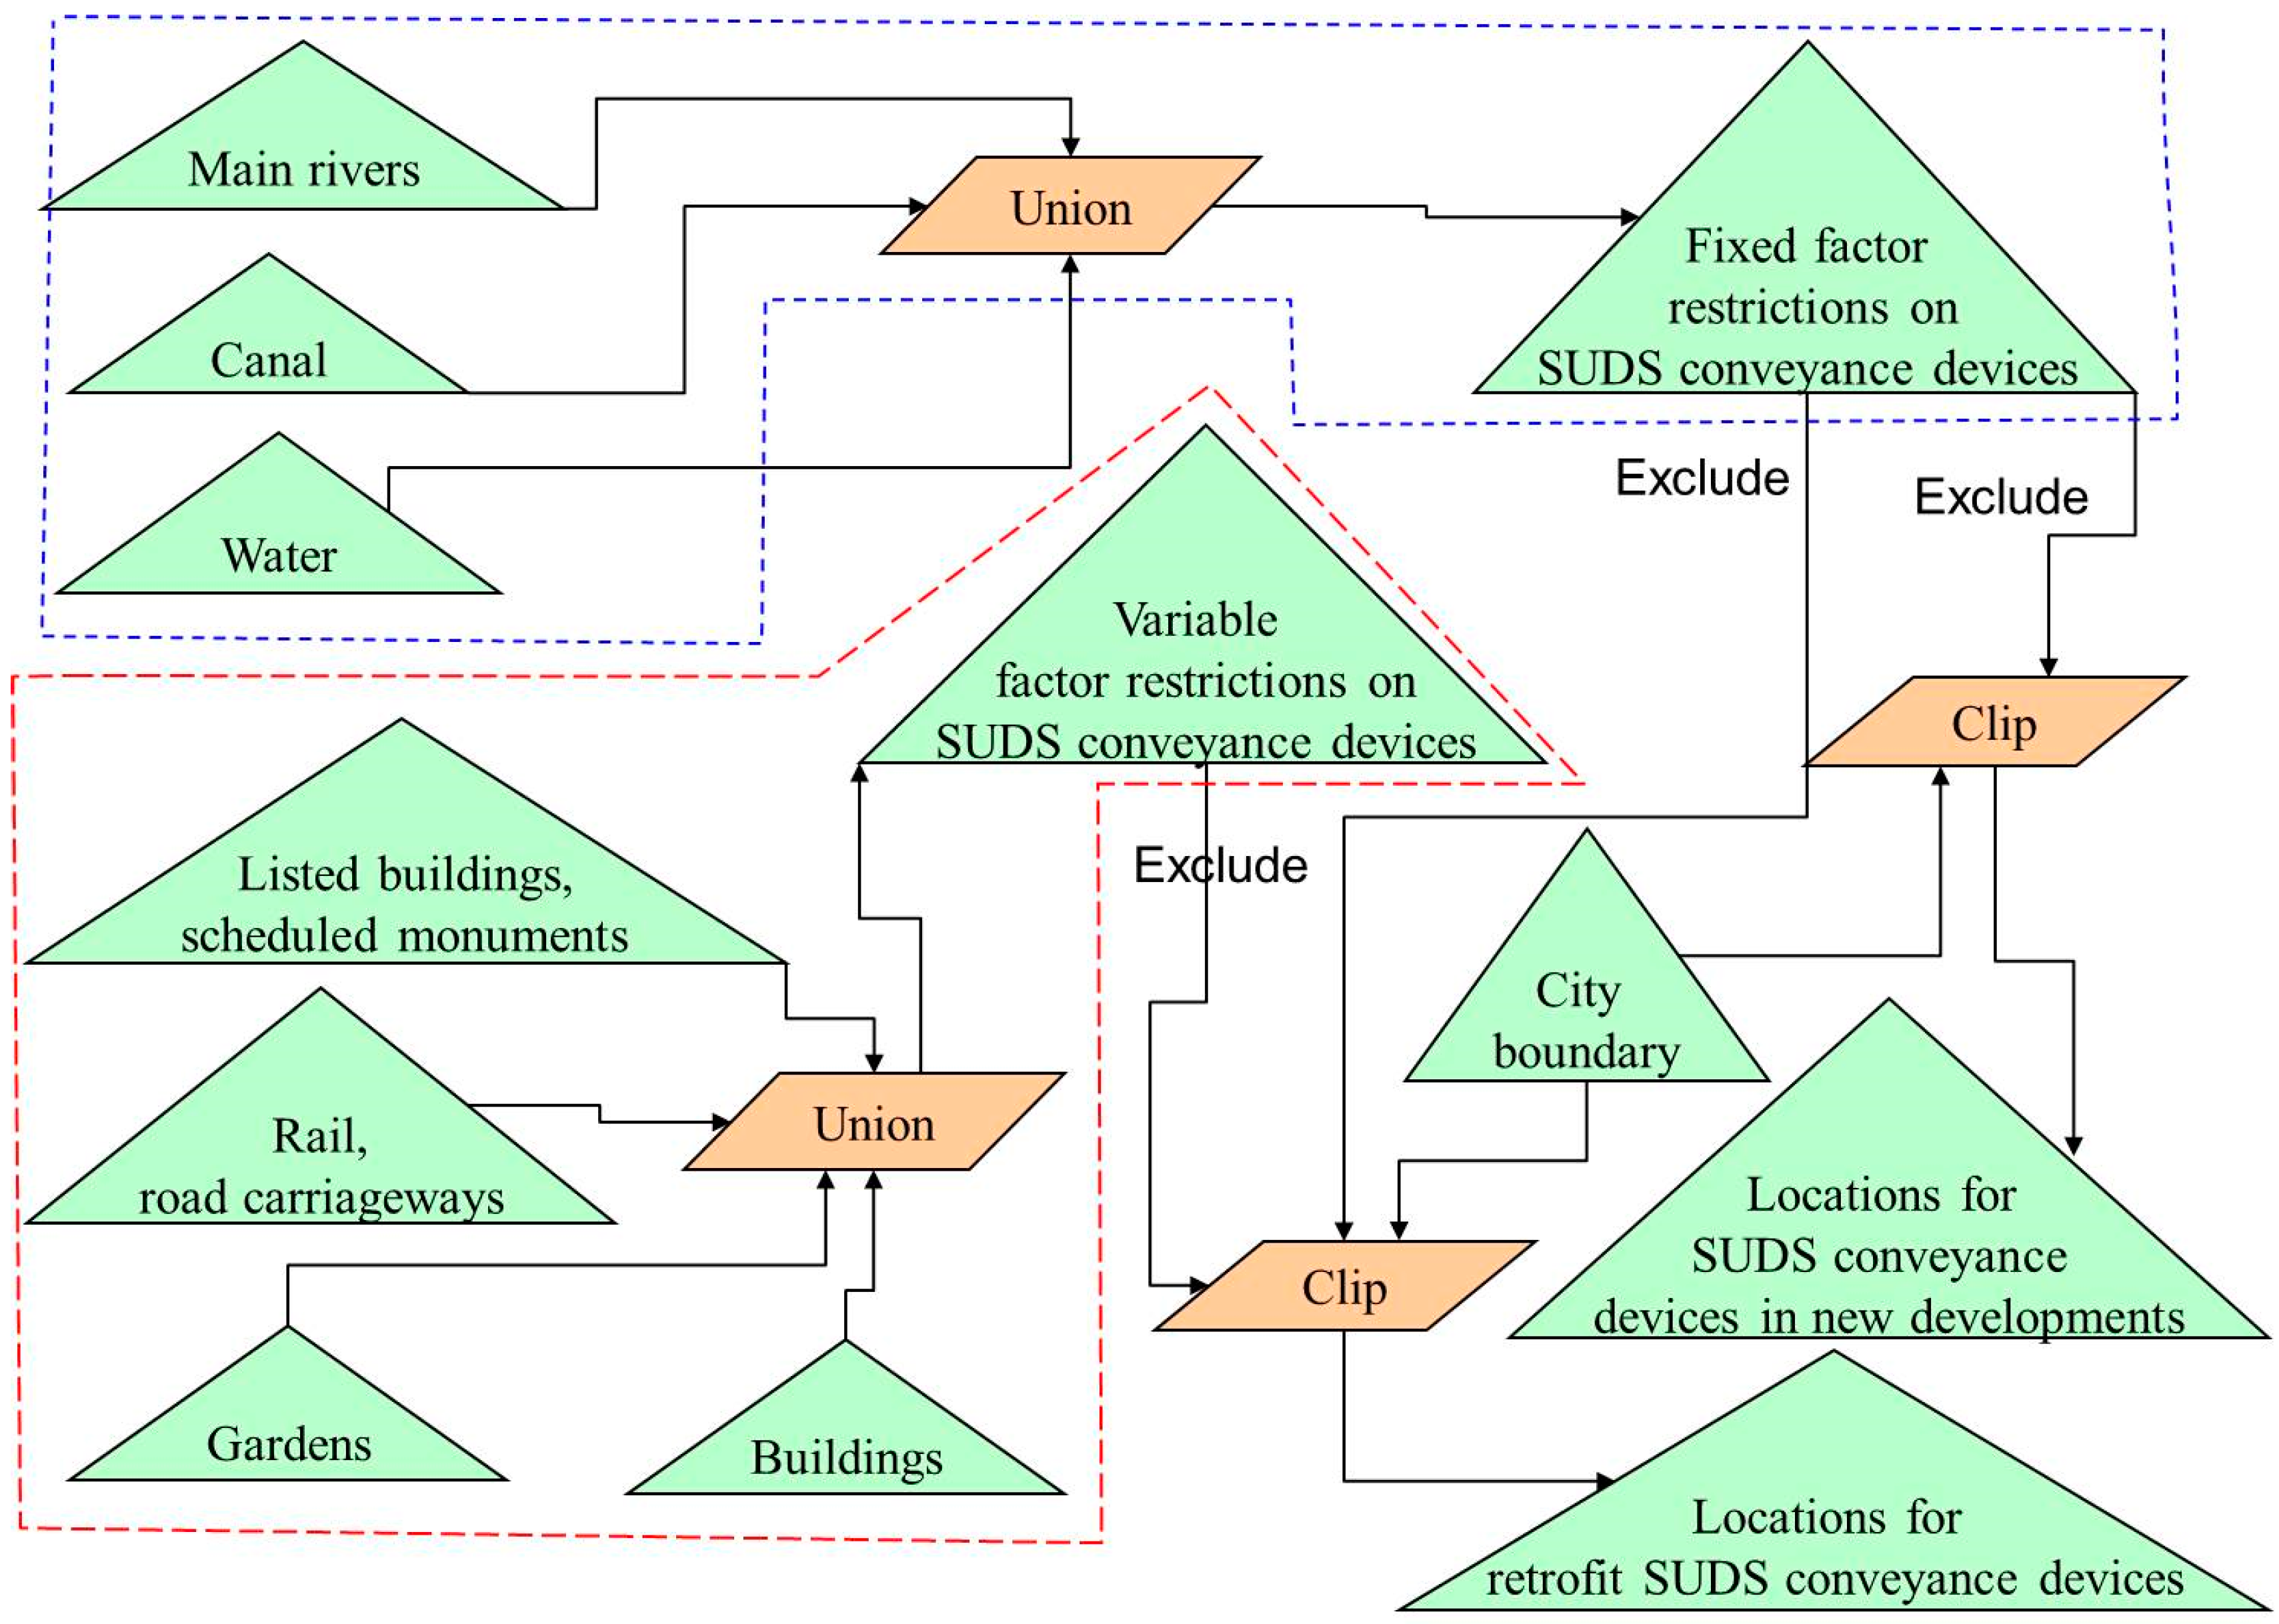
| 2 | Identify influencing factors | Table 2 and Figure 1 |
| 3 | Allocate influencing factors to SuDS groupings | Table 2 |
| 4 | Define rules for influencing factors | Figure 1 and Figure 2 |
| 5 | Determine spatial distribution of influencing factors | Figure 1 |
| 6 | Agree rules for influencing factors | Stakeholder workshops |
| 7 | Apply rules to each SuDS grouping | Figure 1 |
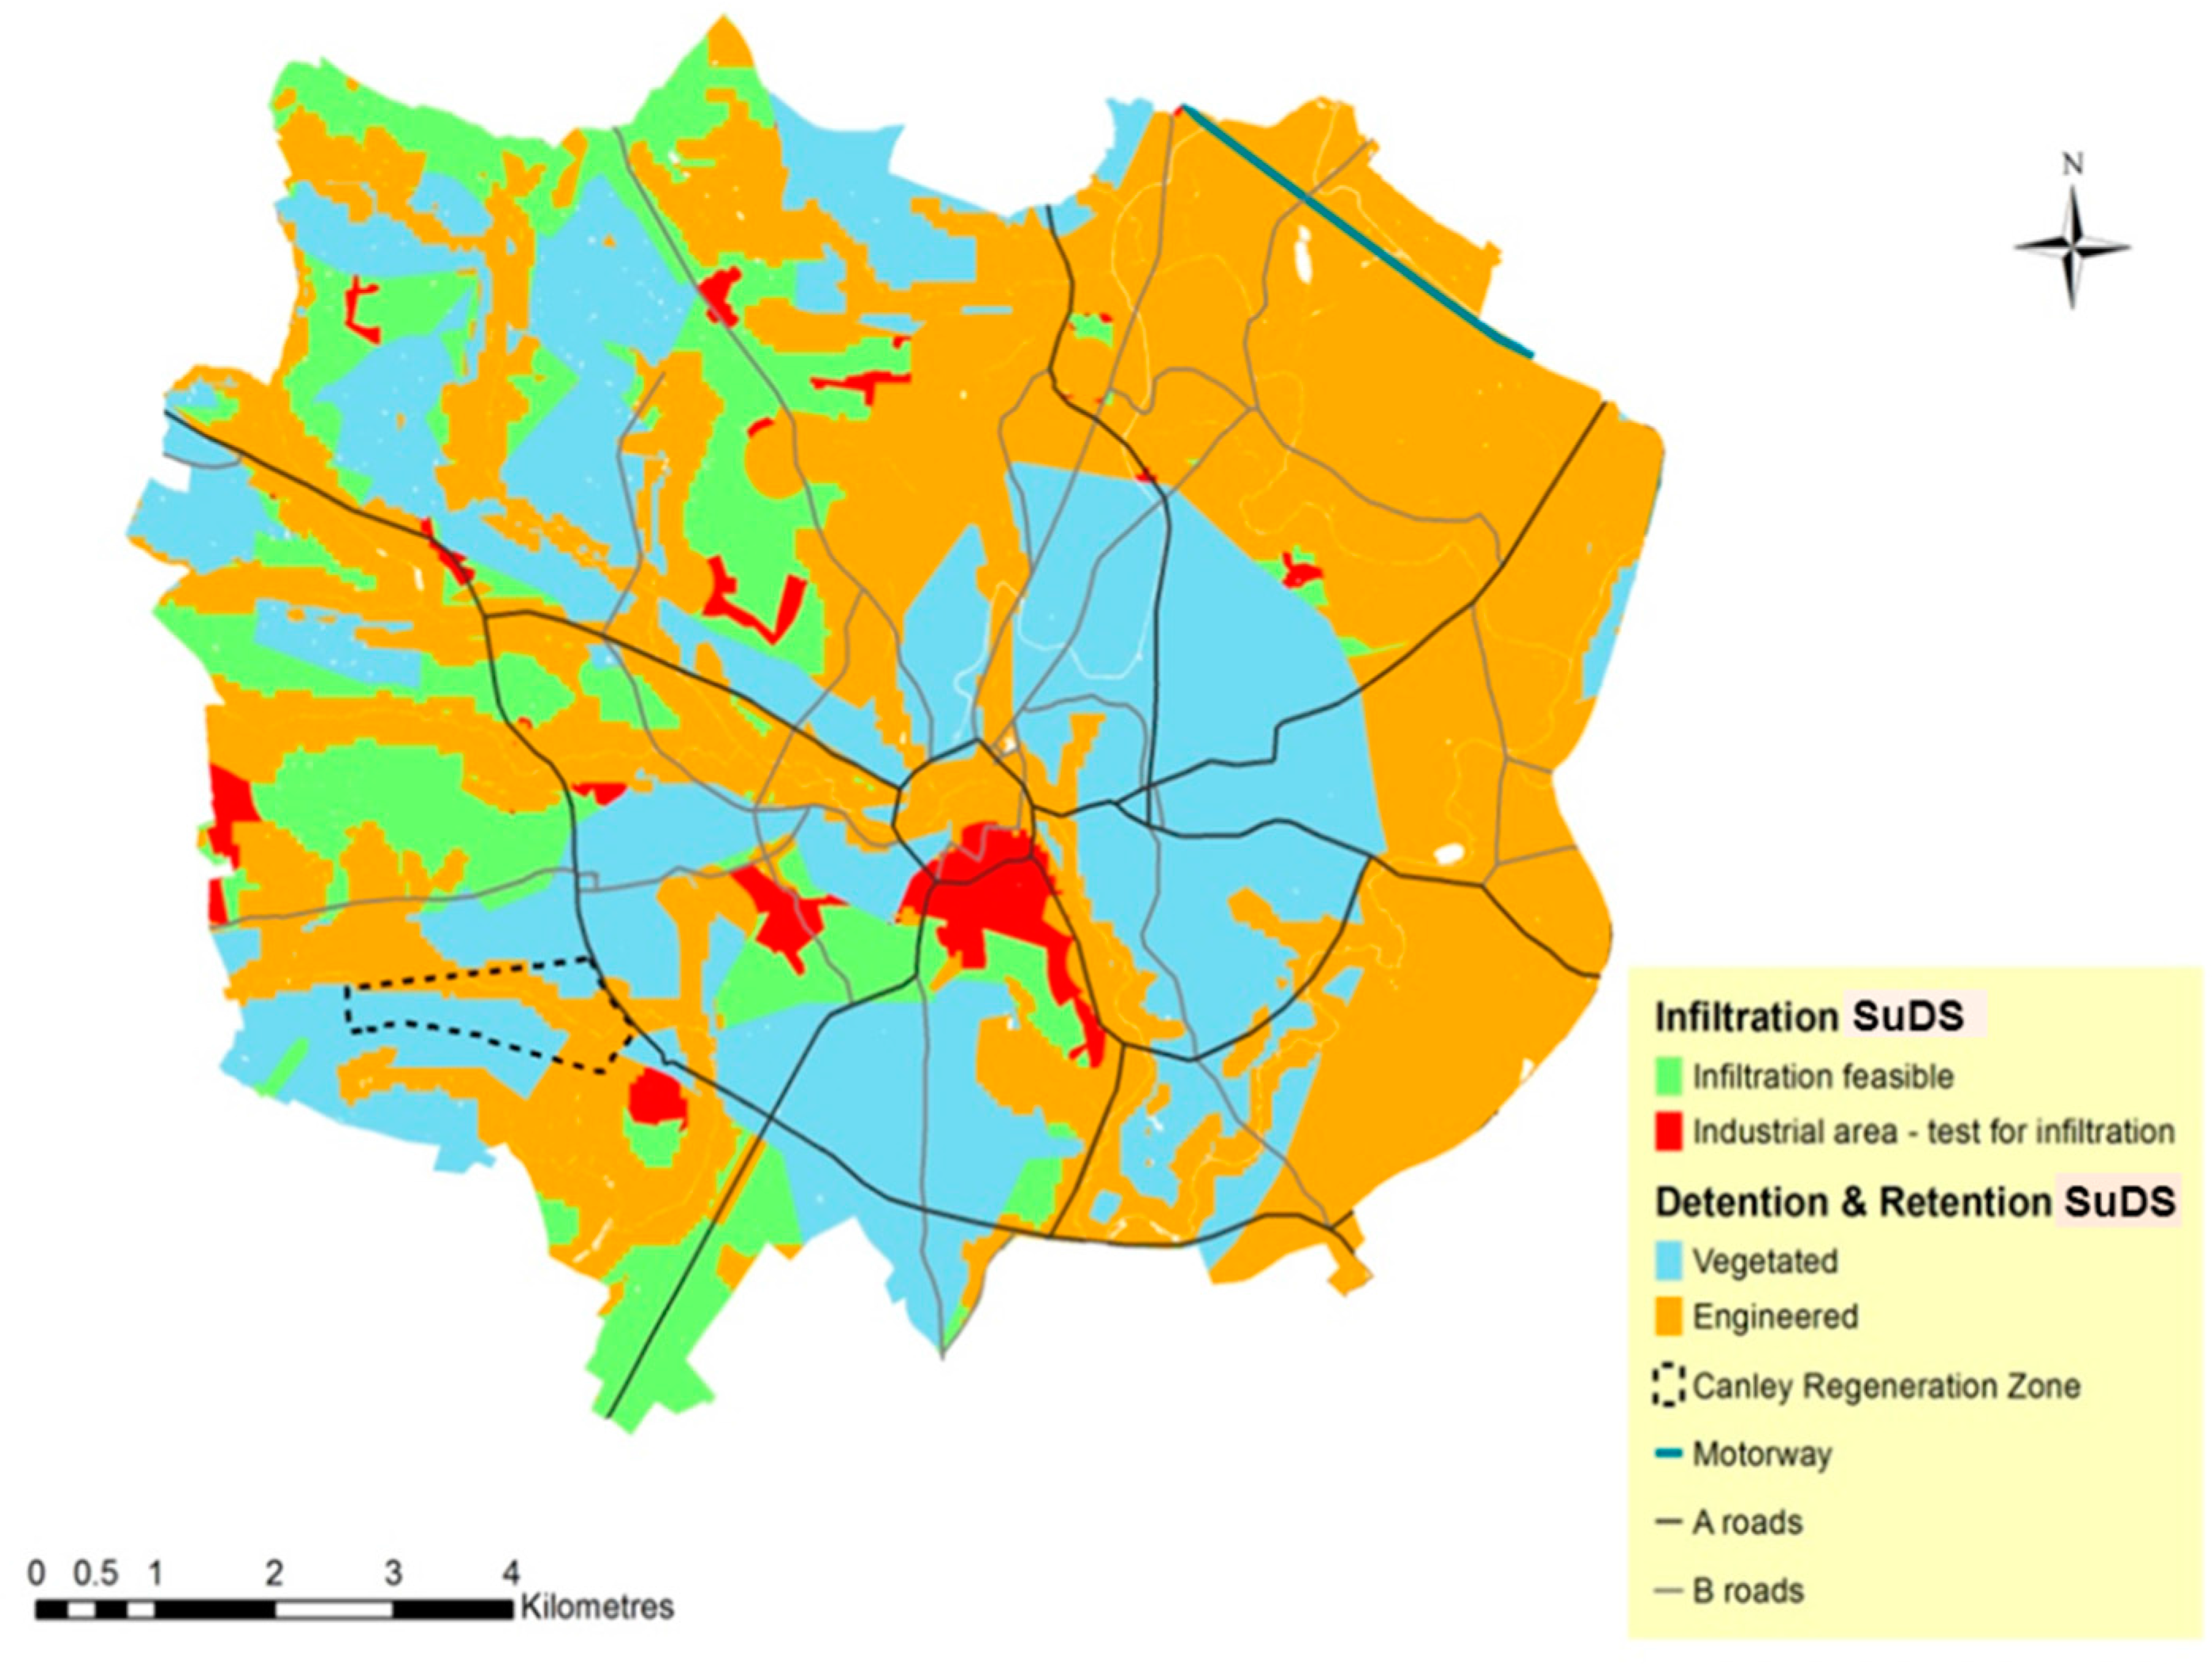
| 8 | Present outputs in map form | Figure 3 and Figure 4 |
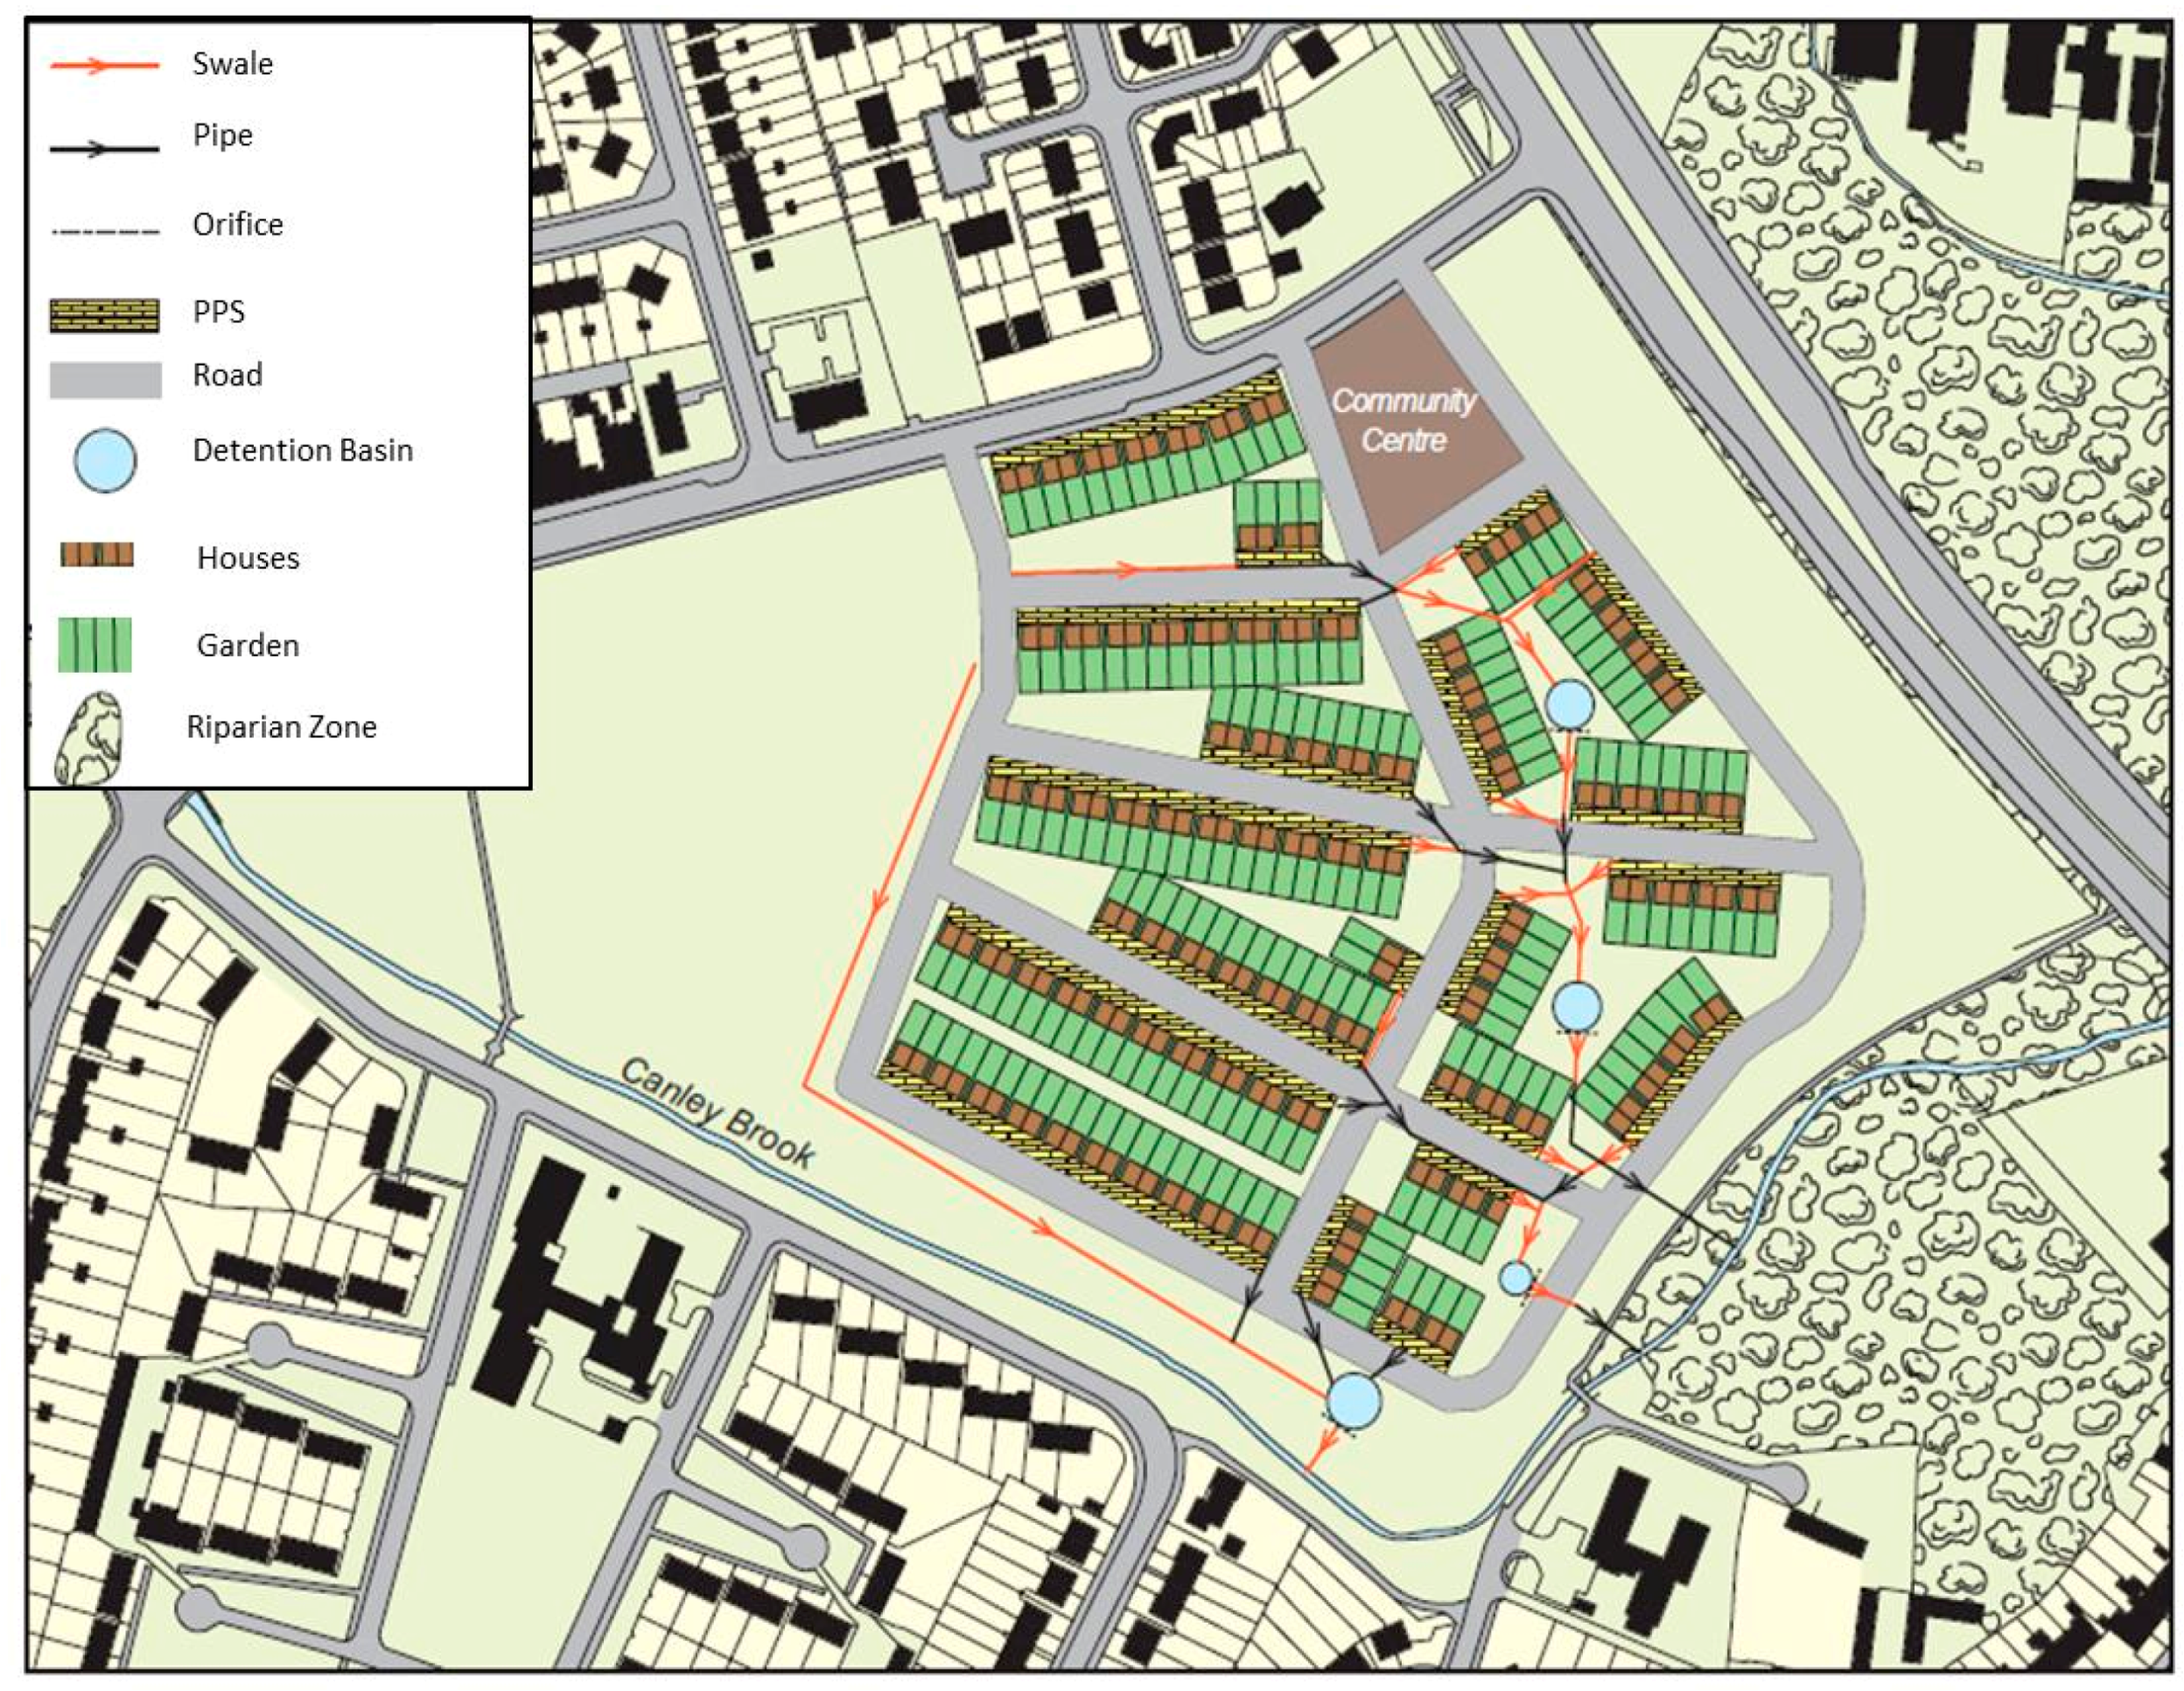
| 9 | Determine site specific SuDS Management Train options | Figure 5 |
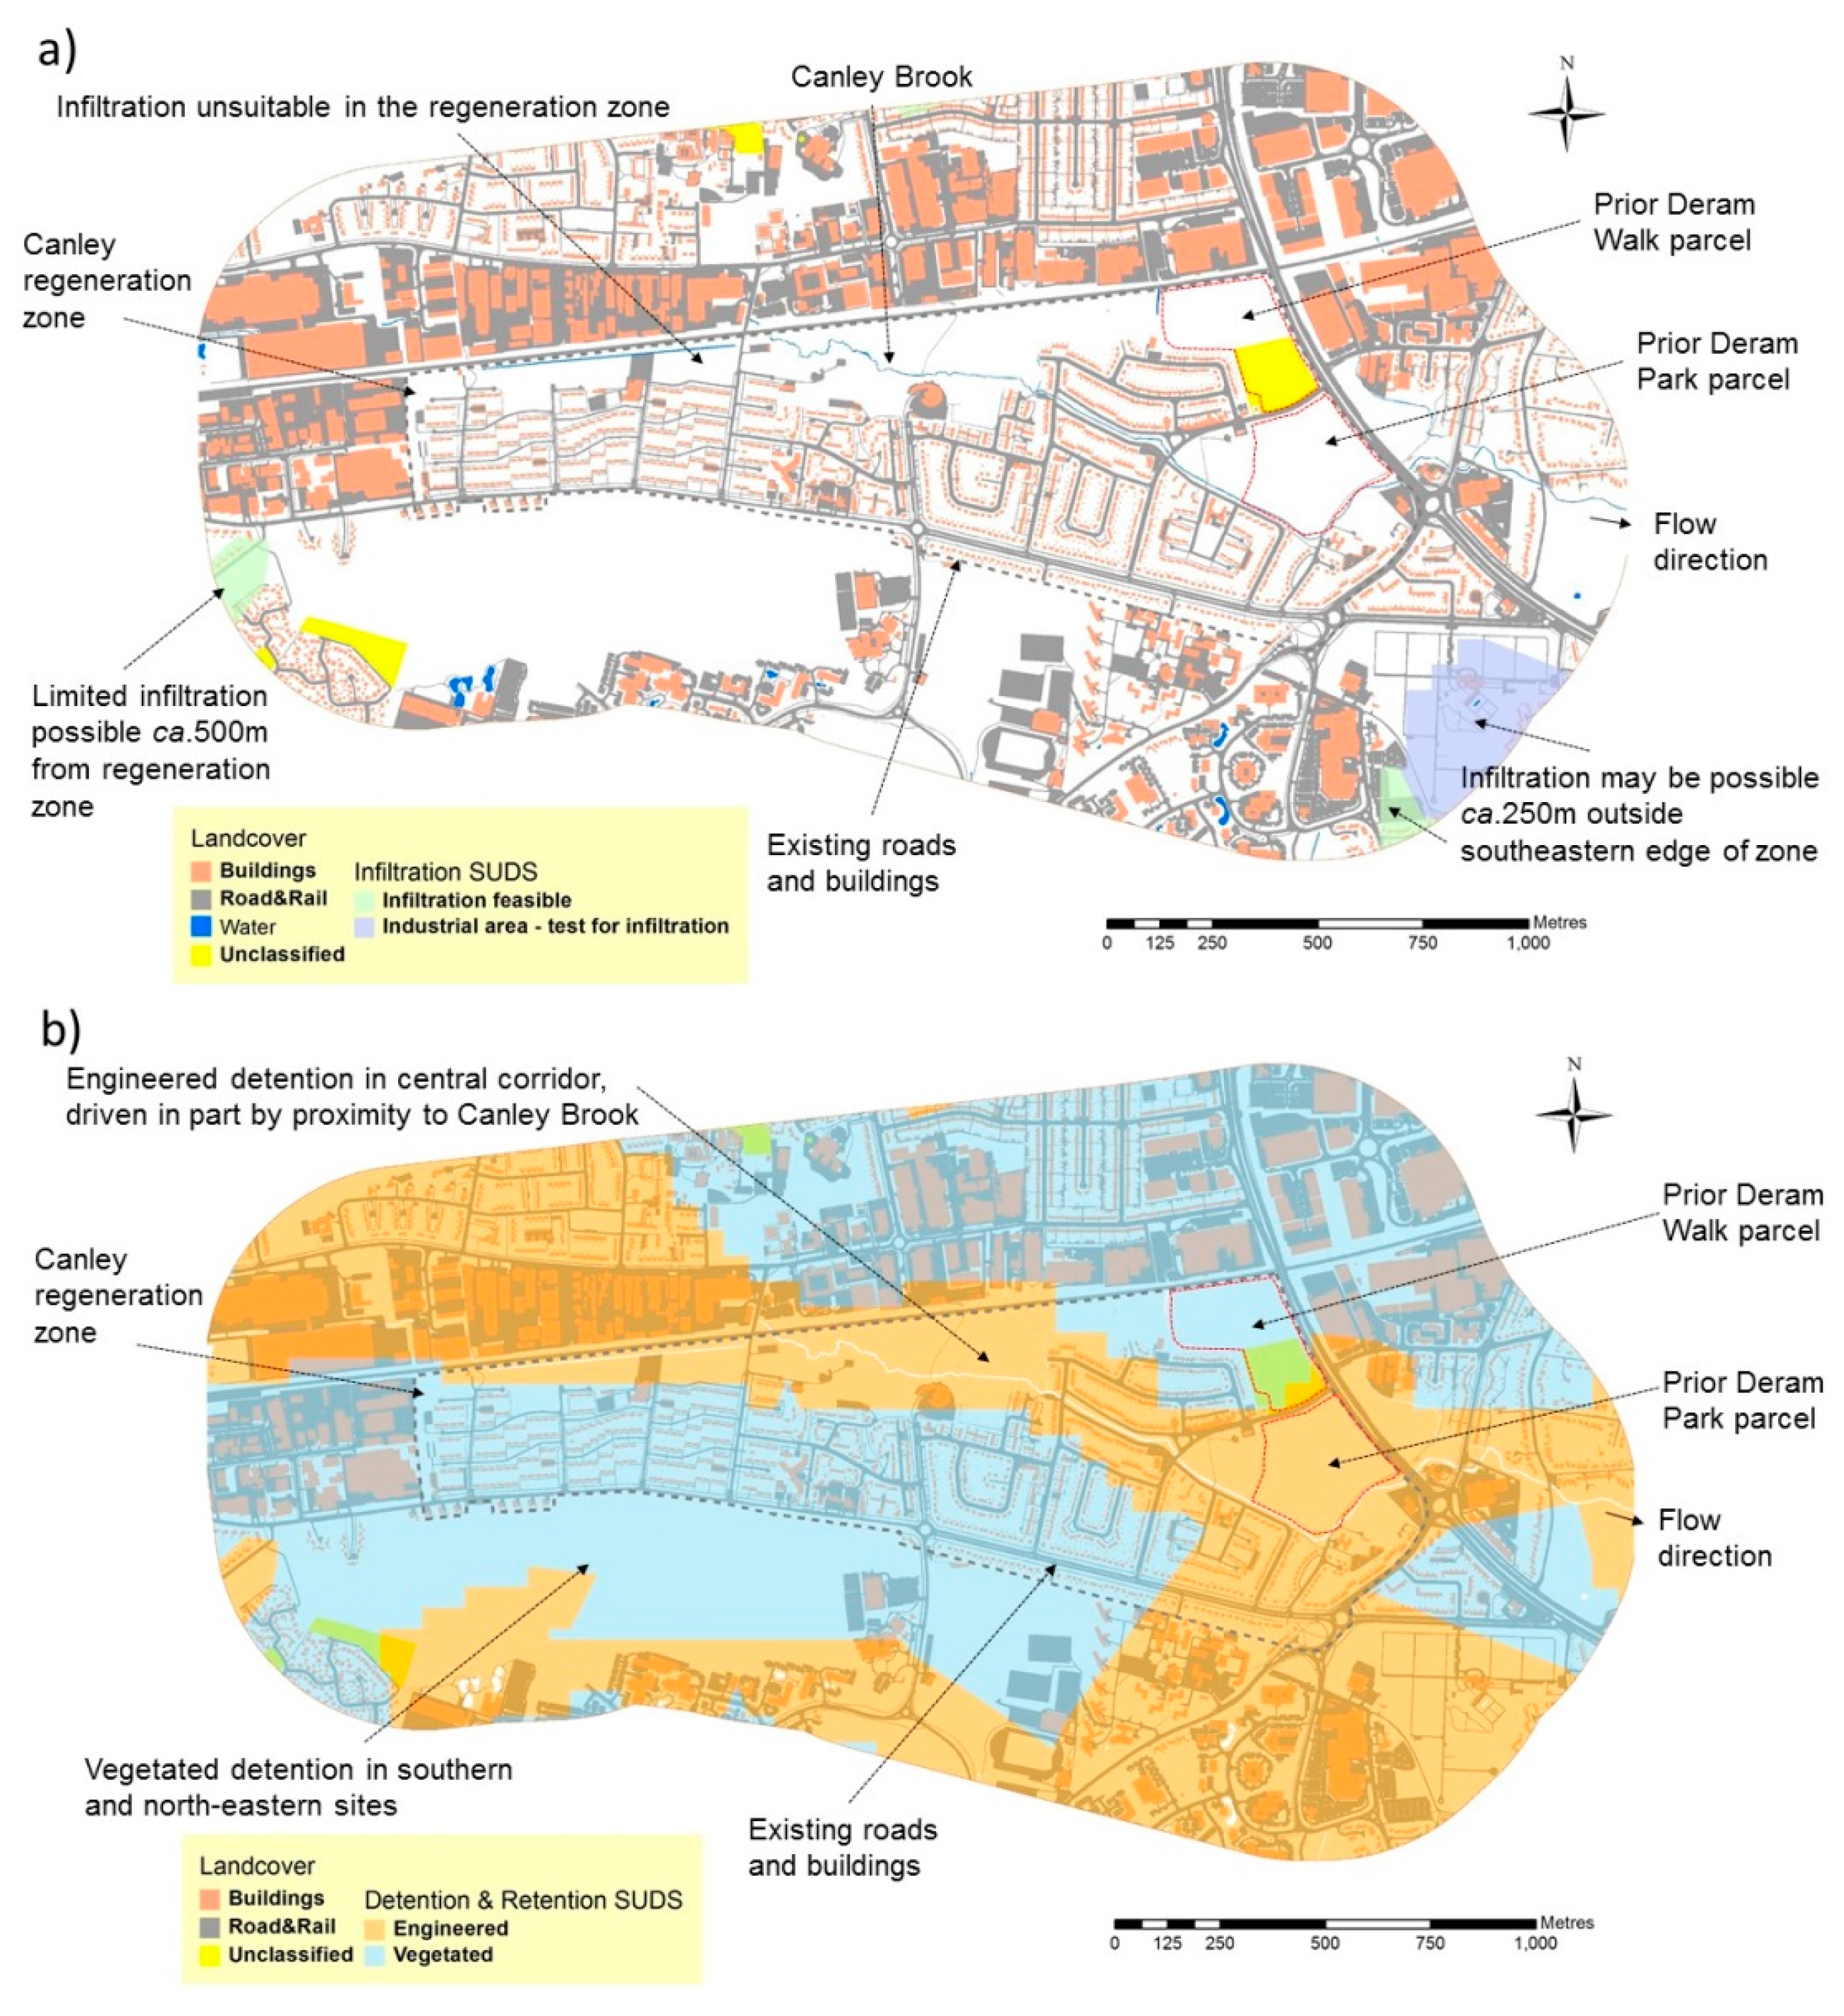
| Priority | SuDS Approach | Suitable Area of City |
|---|---|---|
| 1 | Source controls | 99% |
| 2 | Infiltration SuDS | 14.5% |
| 3 | Infiltration SuDS in former industrial land, if tests show no potential for contamination | 2.5% |
| 4 | Vegetated detention SuDS | 32% |
| 5 | Engineered detention and retention SuDS | 50% |
| Device Grouping | Detailed Assessment for Prior Deram Park (Figure 5) | Broad-Scale Feasibility Map Options for CRZ |
|---|---|---|
| Options in bold show agreement between the two methods across different scales | Proposals that could be considered for this site | |
| Source Control | Permeable paving; green roofs; sub-surface storage; trees | Green roof; rainwater harvesting; permeable paving; sub-surface storage; trees; rain garden; disconnected downpipe; soakaway; infiltration trench; bioretention device |
| Infiltration | none | none |
| Detention & retention | Detention ponds, Orifice plate | Engineered: detention basin; retention basin; pond; sub-surface storage; rainwater harvesting; bioretention device; swale |
| Conveyance | Swales | Swale, rill |
| Filtration | Filter strip; filter trench; bioretention device; detention basin; retention basin; pond; swale; permeable paving |
© 2016 by the authors; licensee MDPI, Basel, Switzerland. This article is an open access article distributed under the terms and conditions of the Creative Commons Attribution (CC-BY) license (http://creativecommons.org/licenses/by/4.0/).
Share and Cite
Charlesworth, S.; Warwick, F.; Lashford, C. Decision-Making and Sustainable Drainage: Design and Scale. Sustainability 2016, 8, 782. https://doi.org/10.3390/su8080782
Charlesworth S, Warwick F, Lashford C. Decision-Making and Sustainable Drainage: Design and Scale. Sustainability. 2016; 8(8):782. https://doi.org/10.3390/su8080782
Chicago/Turabian StyleCharlesworth, Susanne, Frank Warwick, and Craig Lashford. 2016. "Decision-Making and Sustainable Drainage: Design and Scale" Sustainability 8, no. 8: 782. https://doi.org/10.3390/su8080782