3.1. Study Region
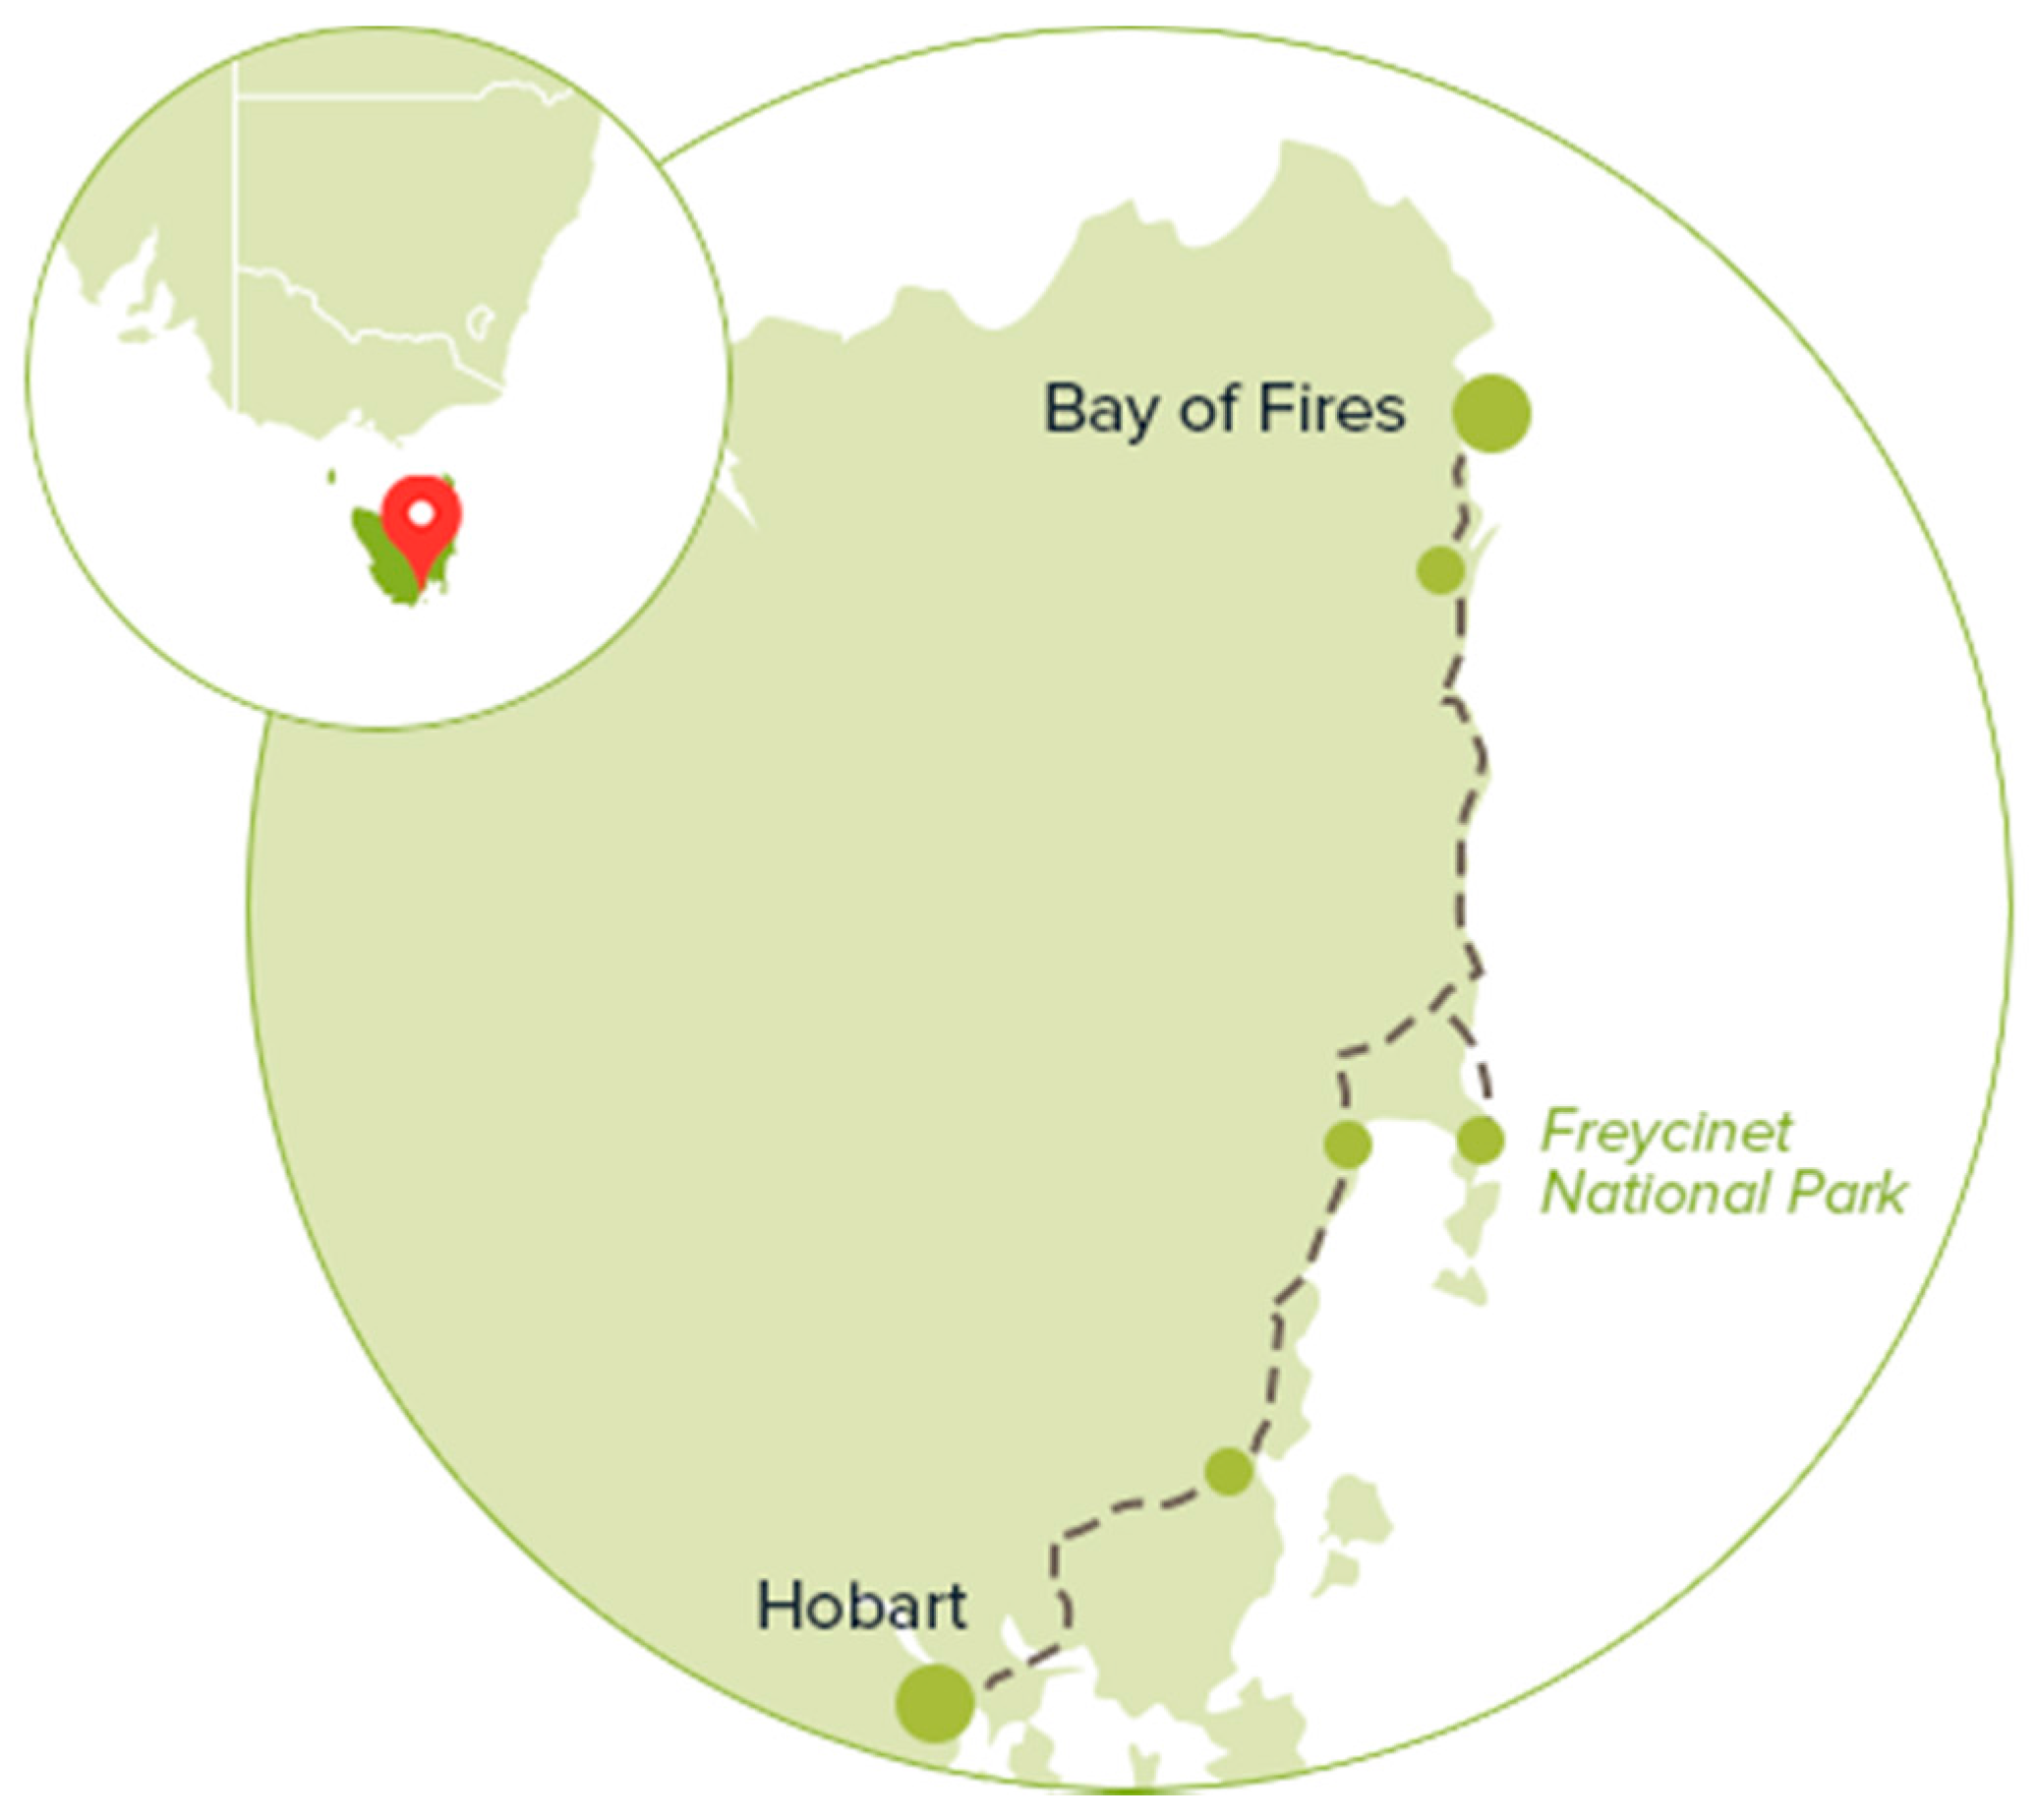
The Bay of Fires region is a coastal region, made up largely of white sandy beaches separated by occasional granite rocky outcrops that are covered in orange lichen. The region’s boundaries are unclear but it is often referred to as stretching from Binalong Bay in the south to Eddystone Point, 30 km to the north, including Mount William National Park. The region was named in 1773 by Captain Tobias Furneaux who sighted many fires along the coast, which were created by the Larapauna Family Group [
45]. The region is rich in cultural heritage, containing many Aboriginal middens (shell and bone deposits).
The region is largely made up of dry coastal land and low land vegetation. It does however stretch inland to the west, including the wetter and elevated region of Ben Lomond and Mount Pearson (
Figure 1) [
46]. Three distinct zones have been recognised within the region:
- (1)
The northern section from Ansons Bay to Eddystone Point. This section is located within Mt William National Park and has camping facilities but only limited public access;
- (2)
The middle section, which is located around and to the south of Ansons Bay. There are no shops or other facilities in this area;
- (3)
The southern section, between Binalong Bay and The Gardens. This section contains houses, caravan and tent camping sites, and relatively good road access to facilities in the south of the section, such as Binalong Bay, and St Helens.
A variety of threatened flora and fauna is located within all three zones in the region, which was articulated in a proposal to increase the region from conservation to National Park status in 2009 [
46].
Since 1950 and most recently following the listing of the region as “The World’s Hottest Travel Destination” in 2009 [
48], there has been a large degree of tourism development in Binalong Bay and the Bay of Fires region. At the time of writing there were around 200 shacks/dwellings within the Bay of Fires region; 100 of which were permanent residences and 100 that were holiday residences/tourist accommodations [
49]. Apart from a small community at Binalong Bay, where a café and fire station is located, there were no other services, apart from at St Helens, located 11 km to the south east of Binalong Bay.
3.2. The Research Experience
A key component of critical thinking research approaches is that researchers would take care to understand participants’ contextualised meanings and beliefs, such that the research may have the opportunity to contribute towards positive changes in society [
8]. With this in mind, the research team took time during the planning phase to become sensitised to the major socio-political issues facing the region, as well as current tensions that may exist within the local community. Local media sources and local radio were consulted and a regional visit was undertaken prior to the research commencing to determine where the research should be undertaken and to determine the socio-political sensitivities within the region that were relevant to tourism. This process identified that there were concerns that had been voiced in local media about the growth of tourism, local recreational use and the development of tourism infrastructure.
During the research-planning phase, information sheets that outlined the goals of the project were sent to regional tourism bodies and local councils. Media releases were also made and a small amount of local radio exposure resulted from these.
The planning phase also identified who were to be the interviewees. This is a difficult issue in tourism-based communities, where owners of holiday shacks and rental properties often live outside of the region. Given our budgetary and timing constraints, a decision was made to limit the local community interviews to the residents of the towns of Binalong Bay, and St Helens.
Following the planning stage, interviews were arranged. Interviews of tourism operators, those in regulatory positions and members of community groups were arranged through a process of purposive sampling that used email and phone calls to make the first point of contact.
3.3. The Research Approach
The aim of this research was to explore the attitudes that individuals had towards sustainable tourism in the first instance and following this, examine whether their attitudes aligned with their stakeholder groupings. The critical theory approach that underpinned this research sought to address intangible aspects, such as attitudes, in order to respond to the critique of Dangi and Jamal [
1] (2016) that research related to sustainability often overlooks local, intangible issues such as cultural change. Consequently, a mixed methods approach was taken, including that which involved quantitative analysis, but also placed a heavy emphasis on the attitudes and preferences of local people. In addition to this, in order to ensure that the voices of those who may have been overlooked in previous studies were heard, the researchers sought a design that would enhance discussion and be inclusive, by not relying on written responses. A focus on the use of photographs instead of written surveys was chosen, particularly given its credence by methodological researchers as a technique that is often considered as a surrogate for reality; its ability to standardise the ‘question’ as every participant views the same picture; and its ability to enhance response validity by keeping variables, such as crowding, in the photograph constant [
50,
51].
The pictorial technique utilised was the Q-methodology. A technique that has evolved from factor analysis, Q was first applied by Stephenson in 1935. It allows participants to sort through a variety of options, depicted by photographs or statements and then subjects their assessments to factor analysis, thus deciphering their individual subjectivities, as well as the relationships of their attitudes to other participants [
52]. Q-methodology as applied in this study required no level of literacy and its lack of use in our study region meant it was also a novel approach that the research team hoped would interest participants.
The research team followed Q-methodology outlined by Stergiou and Airey [
52] and Hunter [
44] which involved the following five steps: The initial step of Q-methodology requires the research team to develop a concourse of issues that underpin the rationale for the study and the subsequent choice of photographs that study participants will be asked to sort and rank. The concourse may be developed from existing scales, literature reviews or interviews that elicit major issues [
52]. Given the research team’s desire to explore attitudes towards sustainable tourism, the research team selected Boyd and Butler’s [
53] Ecotourism Spectrum (ECOS), that was derived from Clark and Stankey’s [
54] visitor experience (Recreation Opportunity Spectrum) framework. This was most relevant to the largely nature based tourism experiences on offer within the case study region. The spectrum was augmented to conceptualise not only the existing, but also a possible, range of tourism development in the region. This meant that four defining attributes of sustainable tourism development options were present within the concourse: access; accommodation; impacts and management; and visitor experiences. These focused on the attributes, not the impact of tourism, to align with the focus of the study (
Table 1).
A final Q set of photographs was selected following several iterations of pilot tests with a variety of stakeholders. The set included 33 photographs, which was in line with conventional expectations for small-sample Q-studies [
55]. It should be noted that the same set of photographs were also used in two other regions in Tasmania, which will be analysed in future publications. The set of photographs included a variety of options for each of the defining attributes, to allow stakeholders to be very specific about their preferences (
Figure 2). Random numbers were assigned to each of the photographs, which facilitated ease of data recording [
52].
The second step of the Q-methodology was to identify and recruit the P set or interview participants. The critical approach of this study was also demonstrated by the selection of participants. The research team took into account the criticism by Dangi and Jamal [
1] that sustainable tourism research, given its global focus, tends to place emphasis on non-local stakeholders such as absent investors. To counteract this issue and ensure a local focus was given to this research, the team decided only to include stakeholders living in our study region. As such a theory driven purposive sampling strategy was utilised [
44]. The P set consisted of 43 respondents from three tourism stakeholder groups: operators (9 respondents), regulators (5 respondents), community group members (2 respondents from local development or advocacy groups) and locals (27 respondents). The size of the P set was appropriate for Q-studies as the emphasis is on individual subjectivity, thus allowing for a small number of participants [
54] as has been the case with many previous studies where the size of P sets has been 34 [
44], 30 [
55,
56,
57,
58] and 27 [
59].
The third step involved the 43 participants conducting a Q sort, by arranging the 32 photographs into three piles (most preferred, least preferred, unsure/undecided) and then ranking the photographs across 9 distribution columns that were printed out on a large poster (
Figure 3) [
60,
61]. The Q sort interview was audio recorded and later transcribed to add depth to the data analysis.
The fourth step of Q-methodology involved analysis via the program PQMethod, Version 2.33 [
62]. This process assessed the correlation between each individual’s Q sort and other participants’ Q sort. Principal Components Analysis was used to create factors, or clusters of participants who sorted photographs in similar ways. This resulted in a list of participants with a nominal loading and in the first instance it revealed that most participants were loaded on the first factor. A Varimax rotation was then conducted to spread variance and participants’ loading on more than one factor. This resulted in identifying and counting significant loaders on each factor. The team used Brown’s [
61] (p. 222) method of including factors that had at least two significant loaders on the unrotated factor matrix. The team derived the significant level from the standard error formula of 1/
, where
N equals the number of items in the Q-method. The derived value for the 32 items in this study was 0.17, and at the 0.01 level of confidence this value was multiplied to 2.58 to set the significant level at 0.45. Loadings had to be 0.45 or above before they were determined as being significant. The research team also used traditional scree plots to assess where factor cut-offs should exist, to ensure a minimum sufficient set of factors that represented the data [
63]. The analysis resulted in three factors that accounted for 43 of the 45 sorts, with levels of significance ranging from 0.89 to 0.42. Only two sorts were statistically insignificant in any factor and excluded. The 43 sorts, their scores in relation to each factor and the explained variance are presented in
Table 1.
This analysis focused on the core factors and particularly on participants who loaded heavily on each factor. This resulted in the development of a rich knowledge set for each factor. Those participants that loaded strongly on a factor had a proportionately greater influence on the factor’s characteristics. Following this, the research team could then determine the images that were highly positively or negatively significant for each factor, along with the images that could be regarded as exemplifying each factor. As with any factor analysis, it was determined that not every person would load on the identified factors.
The analysis of the Q-methods also involved the transcription of participants’ responses while they sorted their photographs. This process revealed participants’ rationale for their preferences. The analysis process involved matching the comments made with each of the corresponding photographs and emergent thematic analysis. Comparisons were then made of individuals’ reactions to each of the photographs as well as their reasoning.
The fifth and final step involved the creation of descriptive names for each of the factors that would accurately reflect the predominant attitudes of the factors. Following this, the team determined the implications of their findings for both sustainable tourism development and the local tourism industry.


