Article

Revisiting the “Guns versus Butter” Argument in China (1950–2014): New Evidence from the Continuous Wavelet Analysis

1
Department of Finance, School of Economics and Management, Southeast University, Nanjing 210096, China
2
School of Economics, Peking University, Beijing 100871, China
*
Author to whom correspondence should be addressed.
Sustainability 2016, 8(7), 655; https://doi.org/10.3390/su8070655
Submission received: 3 June 2016 / Revised: 30 June 2016 / Accepted: 5 July 2016 / Published: 13 July 2016
(This article belongs to the Section Economic and Business Aspects of Sustainability)

Abstract

:
The long-lasting “guns versus butter” argument reflects the fact that China has been experiencing a difficult choice in terms of improving the defense and social welfare sectors, and thus achieving fiscal sustainability. The result, however, is controversial. The present paper therefore re-examines the relationship between defense and social welfare by employing continuous wavelet analysis during a long period of 1950–2014 in China. We focus in particular on their dynamic correlation and the lead-lag relationship across different frequency bands. Our results clearly show the inexistence of the crowding-out effect between defense expenditure and social welfare; moreover, the increase in defense (social welfare) expenditure could stimulate the expansion of social welfare (defense) spending. In addition, we find a positive relationship between defense and social welfare with defense leading during 1961–1968 in the short term, when China suffered from the economic breakdown and the social turbulence caused by the Great Famine, Sino-Soviet border conflict, etc. Notably, social welfare also led the progress in defense during 1984–1988 and 1995–1998 in the medium and long terms by the further deepening of the opening-up policy and enforcing the economic system reform.

1. Introduction

There has been a long lasting debate about whether the expansion of defense expenditure crowds out social welfare spending and hinders the development of social welfare, viz. the “guns versus butter” argument. Since defense and social welfare expenditures are major components of government fiscal expenditure, examining the potential existence of the crowding-out effect between defense expenditure and social welfare is important for China to achieve fiscal sustainability and promote defense and social welfare progress.
Figure 1 shows the changing trends of defense expenditure (as a ratio to GDP), social welfare expenditure (as a ratio to GDP) and government fiscal expenditure (as a ratio to GDP) over the period of 1950–2014. As indicated by Figure 1, in general, defense expenditure as a ratio to GDP showed a downward trend during this time period, decreasing from the highest 16.75% in 1951 to a low and stable level at approximately 1.30% in recent years. It is worth noting that defense expenditure as a ratio to GDP decreased dramatically after 1978 (the implementation of reform and opening-up policy) and reached a plateau at a relatively low level in the most recent decade. In contrast, the social welfare expenditure as a ratio to GDP presented a continuously rising tendency, which first exceeded defense expenditure in 1981 and the gap between them gradually kept enlarging. Thirdly, government fiscal expenditure displayed a downward trend with fluctuations, while it reached the lowest at 11.67% in 1995 and appeared to increase afterwards.
Significant changes can be observed in the three items during specific historical period. There was a sharp increase in social welfare expenditure during the Great Leap Forward and the Great Famine. At the same time, government fiscal expenditure first experienced a dramatic increase and a decline afterwards. This could be attributable to the pressure to provide relief supplies to the victims. In the 10 years of the Great Cultural Revolution, social welfare expenditure declined significantly because of the difficulties in the economy; meanwhile, a sharp increase could be found in defense expenditure in contrast. After the long-term social unrest and economic breakdown caused by events such as the Great Famine and the Great Cultural Revolution, China undertook the policy of reform and opening-up in 1978, which attached great importance to economic development and social welfare progress and decreased the investment in defense construction. Moreover, during the further deepening of the economic system reform, China balanced the defense growth and social welfare progress from the perspective of civil-military integration to achieve the coordinated development of defense and social welfare.
Our article focuses on the causal nexus between defense expenditures and social welfare spending in China and contributes to the existing research in three ways. Firstly, by investigating the crowding-out effect between defense expenditure and social welfare in China, a typical emerging economy, this study seeks to find out a reliable outcome, which can further be applied to other emerging economies. Secondly, we employ the long time series data during the period of 1950–2014 of China, which is capable of providing much more information and extending the time-varying analysis. Thirdly, the present paper uses the continuous wavelet analysis investigating the dynamic relationship between defense expenditure and social welfare spending. The continuous wavelet analysis has become a popular method in exploring the relationship between two variables, since it expands the time series to a time-frequency space in such a way that the correlation and the lead-lag relationship can be observed [2].
The remainder of this paper is structured as follows. Section 2 provides a brief summary of recent research including theoretical analysis and empirical evidence. Section 3 describes the empirical model. We use the continuous wavelet analysis to examine the existence of crowding-out effect between defense expenditure and social welfare. Section 4 describes the data. Section 5 presents the empirical evidence. The final section concludes.

2. Literature Review

2.1. Theoretical Basis

Previous studies have provided a variety of theoretical bases for the relationship between defense expenditure and social welfare (see Table 1). On the one hand, from the Keynesian point of view, the expansion of defense expenditure can increase the aggregate demand, and accordingly stimulate the social welfare spending [3,4,5,6]. On the other hand, due to government budget constraints, the existence of the crowding-out effect suggests the expansion of defense expenditure can be at the expense of non-defense spending, such as education, health, culture and technology [6,7,8,9,10,11,12]. However, several studies contended that an increase in defense spending does not necessarily have any effect on social welfare spending [13,14,15].

2.2. Empirical Analysis

There have been ample interesting empirical studies investigating the relationship between defense expenditure and social welfare, while the empirical support reflects a continuing lack of consensus. Table 2 reports the existing empirical findings on the crowding-out effect between defense expenditure and social welfare spending. The study on “guns versus butter” dates back to the pioneering work of Russett [12], which revealed that military spending is negatively correlated with the expenditures for health, education and other social welfare programs in the US, the UK, France and Canada. The negative relationship supported by the crowding-out theory has been confirmed in several studies since then [7,8,9,10,11,16]. Peroff [16] and Peroff and Podolak-Warren [11] found the existence of crowding-out effect in the US. Dabelko and McCormick [8], Deger [9] and Apostolakis [7] added to this view by providing the evidence in 77 countries, 50 less developed countries and 19 Latin American countries, respectively. There was also shown to be a crowding-out effect between defense and social welfare expenditures in Turkey [10]. In contrast, some studies suggested that the increase in defense expenditure could promote social welfare supported by the Keynesian theory [3,4,6,17,18]. Verner [18] confirmed that a rise in defense expenditure promoted education expenditure in 10 Latin American countries. Harris, Kelly and Pranowo [17] and Lin, Ali and Lu [4] showed the positive relationship between defense and social welfare expenditures in 3 Asian countries and 29 OECD (the Organisation for Economic Co-operation and Development) countries, respectively. A similar conclusion was also extended to Greece [3]. In addition, Zhang, et al. [6] confirmed the positive relationship by measuring the social welfare using inputs and outputs. However, a non-existent relationship has also been found in the literature [13,14,15,19,20,21,22,23]. For instance, Caputo [19] showed defense expenditure has no impact on social welfare in Australia, Sweden, the UK and the US. Russett [15] and Mintz [14] extended the conclusion to the US. In addition, Hess and Mullan [23] further confirmed the relationship in 77 less developed countries.
In summary, numerous studies have investigated the causal nexus between defense expenditure and social welfare; however, these empirical studies have obtained mixed results and the papers analyzing the case of China are relatively limited. For instance, Davis and Chan [20] used the data of Taiwan rather than mainland China. Therefore, this article investigates the relationship between defense and social welfare in China to enrich these empirical studies. In addition, following the above arguments, we derive this primary research to revisit the potential presence of crowding-out effect between defense expenditure and social welfare in China in the time-frequency domain by employing the continuous wavelet analysis.

3. Continuous Wavelet Analysis

The continuous wavelet analysis is employed to examine the dynamic relationship between defense expenditure and social welfare spending in this study. The continuous wavelet analysis has gained its popularity in the time-frequency analysis between two variables. First, it reveals how the relationship between two variables develops over time and varies across different frequency bands. Second, it provides a detailed picture about the lead-lag relationship between the two variables. Third, it does not require the two time series to be stationary or cointegrated [2,24]. Based on the above advantages, the method of continuous wavelet analysis can provide more detailed empirical results about the interaction between defense expenditure and social welfare spending compared to other available empirical methods, which is capable of modeling the dynamic correlation and lead-lag relationship between defense and social welfare across different frequency bands during the period of 1950–2015 in China. Therefore, the main purpose of applying the continuous wavelet analysis, one of the most sophisticated time-frequency methods is to extend a thorough and elaborated analysis to examine the potential presence of the crowding–out effect and its changing trends in China. The continuous wavelet analysis used in this article has been developed by Aguiar-Conraria and Soares [2].

3.1. The Continuous Wavelet Transform

We conduct the continuous wavelet transform for a time series. Based on a mother wavelet ψ , a family ψ τ , s of “wavelet daughters” is defined as:
ψ τ , s ( t ) : = 1 | s | ψ ( t τ s ) ,   τ , s R , s 0
where τ is a translation parameter that controls the location of the wavelet, and s is a scaling factor that defines its width. In this study, we choose the most popular Morlet wavelet as the mother wavelet, which is given as:
ψ ( t ) = π 1 4 exp ( i ϖ 0 t ) exp ( 1 2 t 2 )
where | ψ ( t ) | 2 d t < , and ψ ( t ) d t = 0 .
Based on the choice of the mother wavelet, the continuous wavelet transform is defined as:
W x ; ψ ( τ , s ) = x ( t ) 1 | s | ψ * ( t τ s ) d t
where * denotes the complex conjugation of the Morlet wavelet. The continuous wavelet transform decomposes the original series into a function of τ and s , thus expands the time series into a time-frequency space. When the wavelet ψ ( t ) is complex-valued, the wavelet transform W x ( τ , s ) is also complex-valued and can be decomposed into its real part { W x ( τ , s ) } and its imaginary part { W x ( τ , s ) } , or in its amplitude, | W x ( τ , s ) | , and its phase, ϕ x ( τ , s ) : W x ( τ , s ) = | W x ( τ , s ) | e x p ( i ϕ x ( τ , s ) ) .

3.2. The Power of Wavelet and Cross-Wavelet

Following the continuous wavelet transform, the wavelet power spectrum is conducted to measure the local variance for a time series at each frequency, which is given as:
W P S x ( τ , s ) = | W x ( τ , s ) | 2
Furthermore, the cross-wavelet transform and the cross-wavelet power spectrum of the two series are extended to investigate the relationship between two variables. The cross-wavelet transform of the two time series, x ( t ) and y ( t ) is defined as:
W x y ( τ , s ) = W x ( τ , s ) W y * ( τ , s )
where W x ( τ , s ) and W y * ( τ , s ) are the continuous wavelet transforms of time series x ( t ) and y ( t ) , respectively. When y = x , the wavelet power spectrum W x x ( τ , s ) = | W x ( τ , s ) | 2 = ( W P S ) x ( τ , s ) . The cross-wavelet power is given as:
X W P x y ( τ , s ) = | W x y ( τ , s ) |
In general, the wavelet power spectrum of one time series presents the local variance, while the cross-wavelet power spectrum measures the local covariance of the two time series at each time and frequency.

3.3. The Wavelet Coherency and the Phase-Difference

Based on the wavelet power spectrum and the cross-wavelet power, the wavelet coherency is conducted to investigate the dynamic correlation in the time-frequency domain. The complex wavelet coherency ϱ x y is given as:
ϱ x y = S ( W x y ) [ S ( | W x | 2 ) S ( | W y | 2 ) ] 1 2
where S denotes a smoothing operator in both time and scale. The wavelet coherency is defined as the absolute value of the complex wavelet coherency:
R x y = | S ( W x y ) | [ S ( | W x | 2 ) S ( | W y | 2 ) ] 1 2 ,  with  0 R x y 1
However, we are not able to differentiate the positive and negative correlation through the wavelet coherency since its value is always positive. Therefore, the phase-difference is applied to reveal the positive or negative correlation and lead-lag interaction between the two time series. The complex wavelet coherency ϱ x y can be expressed in polar form, as ϱ x y = | ϱ   x y | e x p ( i ϕ x y ) . The angle ϕ x y of the complex coherency is the phase-difference, which is given as:
ϕ x y = tan 1 ( ( S ( W x y ) ) ( S ( W x y ) ) ) ,  with  ϕ x y [ π , π ]
When ϕ x y ( 0 , π 2 ) and ϕ x y ( π 2 , 0 ) , x ( t ) and y ( t ) move in phase (similarly to positive correlation), and the former case indicates x ( t ) leads y ( t ) , while the latter case indicates y ( t ) leads x ( t ) . When ϕ x y ( π , π 2 ) and ϕ x y ( π 2 , π ) , x ( t ) and y ( t ) move anti-phase (similarly to negative correlation), and the former case suggests x ( t ) leads y ( t ) , while the latter case suggests the opposite. Besides, ϕ x y = 0 reveals the positive relationship between x ( t ) and y ( t ) , while ϕ x y = π or π reveals the negative relationship between x ( t ) and y ( t ) at the specified time-frequency.

3.4. The Partial Wavelet Coherency and the Partial Phase-Difference

The dynamic relationship between two time series may be influenced by other variables, thus the partial wavelet coherency is employed to eliminate the effect of other variables. After controlling a third variable z ( t ) , the partial complex wavelet coherency is defined as:
ϱ x y , z = ϱ x y ϱ x z ϱ y z * ( 1 R x z 2 ) ( 1 R y z 2 )
where ϱ i j and R i j   ( i = x , y , z ;   j = x , y , z ; i j ) is defined as Equations (7) and (8), respectively, and * denotes the complex conjugation. Based on the Equations (8) and (9), we can obtain the partial wavelet coherency ( R x y , z ) and the partial-difference ( ϕ x y , z ). The interpretation of the partial phase-difference ( ϕ x y , z ) is consistent with the phase-difference ( ϕ x y ).
In this study, we use the annual growth rate over the previous year for each variable to present the wavelet property in our dataset. Hence, x ( t ) denotes the growth rate of the defense expenditure as a ratio to GDP. y ( t ) denotes the growth rate of the social welfare spending as a ratio to GDP. z ( t ) denotes the growth rate of government fiscal expenditure as a ratio to GDP, which is used as a control variable in the continuous wavelet analysis. The continuous wavelet analysis performed in the present paper is processed by the MATLAB ASToolbox developed by Aguiar-Conraria and Soares [2].

4. Data Description

This article uses long time series data to explore the dynamic relationship between defense expenditure and social welfare spending. We use the expenditures of education, health, culture and technology to measure the level of social welfare spending. Since defense expenditure (Defense) and social welfare spending (SW) are a portion of government fiscal expenditure, the government fiscal expenditure as a ratio to GDP (GFE) is used as a control variable to eliminate the potential confounding effects. All the data are selected from National Bureau of Statistics of China, 2015 [1]. Because of data availability, we restrict our sample to the 1950–2014 period (Cazelles, et al. [25] suggested the continuous wavelet analysis requires approximately 30–40 data points. In this study, we use 65 observations, which is thus sufficient to extend the continuous wavelet analysis). The descriptions of the variables and the original data sources are listed in Table 3. The continuous wavelet analysis is applied to investigate the dynamic correlation and the lead-lag relationship across different frequency bands.

5. Empirical Analysis of Defense and Social Welfare

In this section, using the continuous wavelet analysis, we estimate the dynamic correlation and lead-lag relationship between defense and social welfare across different frequency bands during the period of 1951–2014.

5.1. Wavelet Power Spectrum Analysis

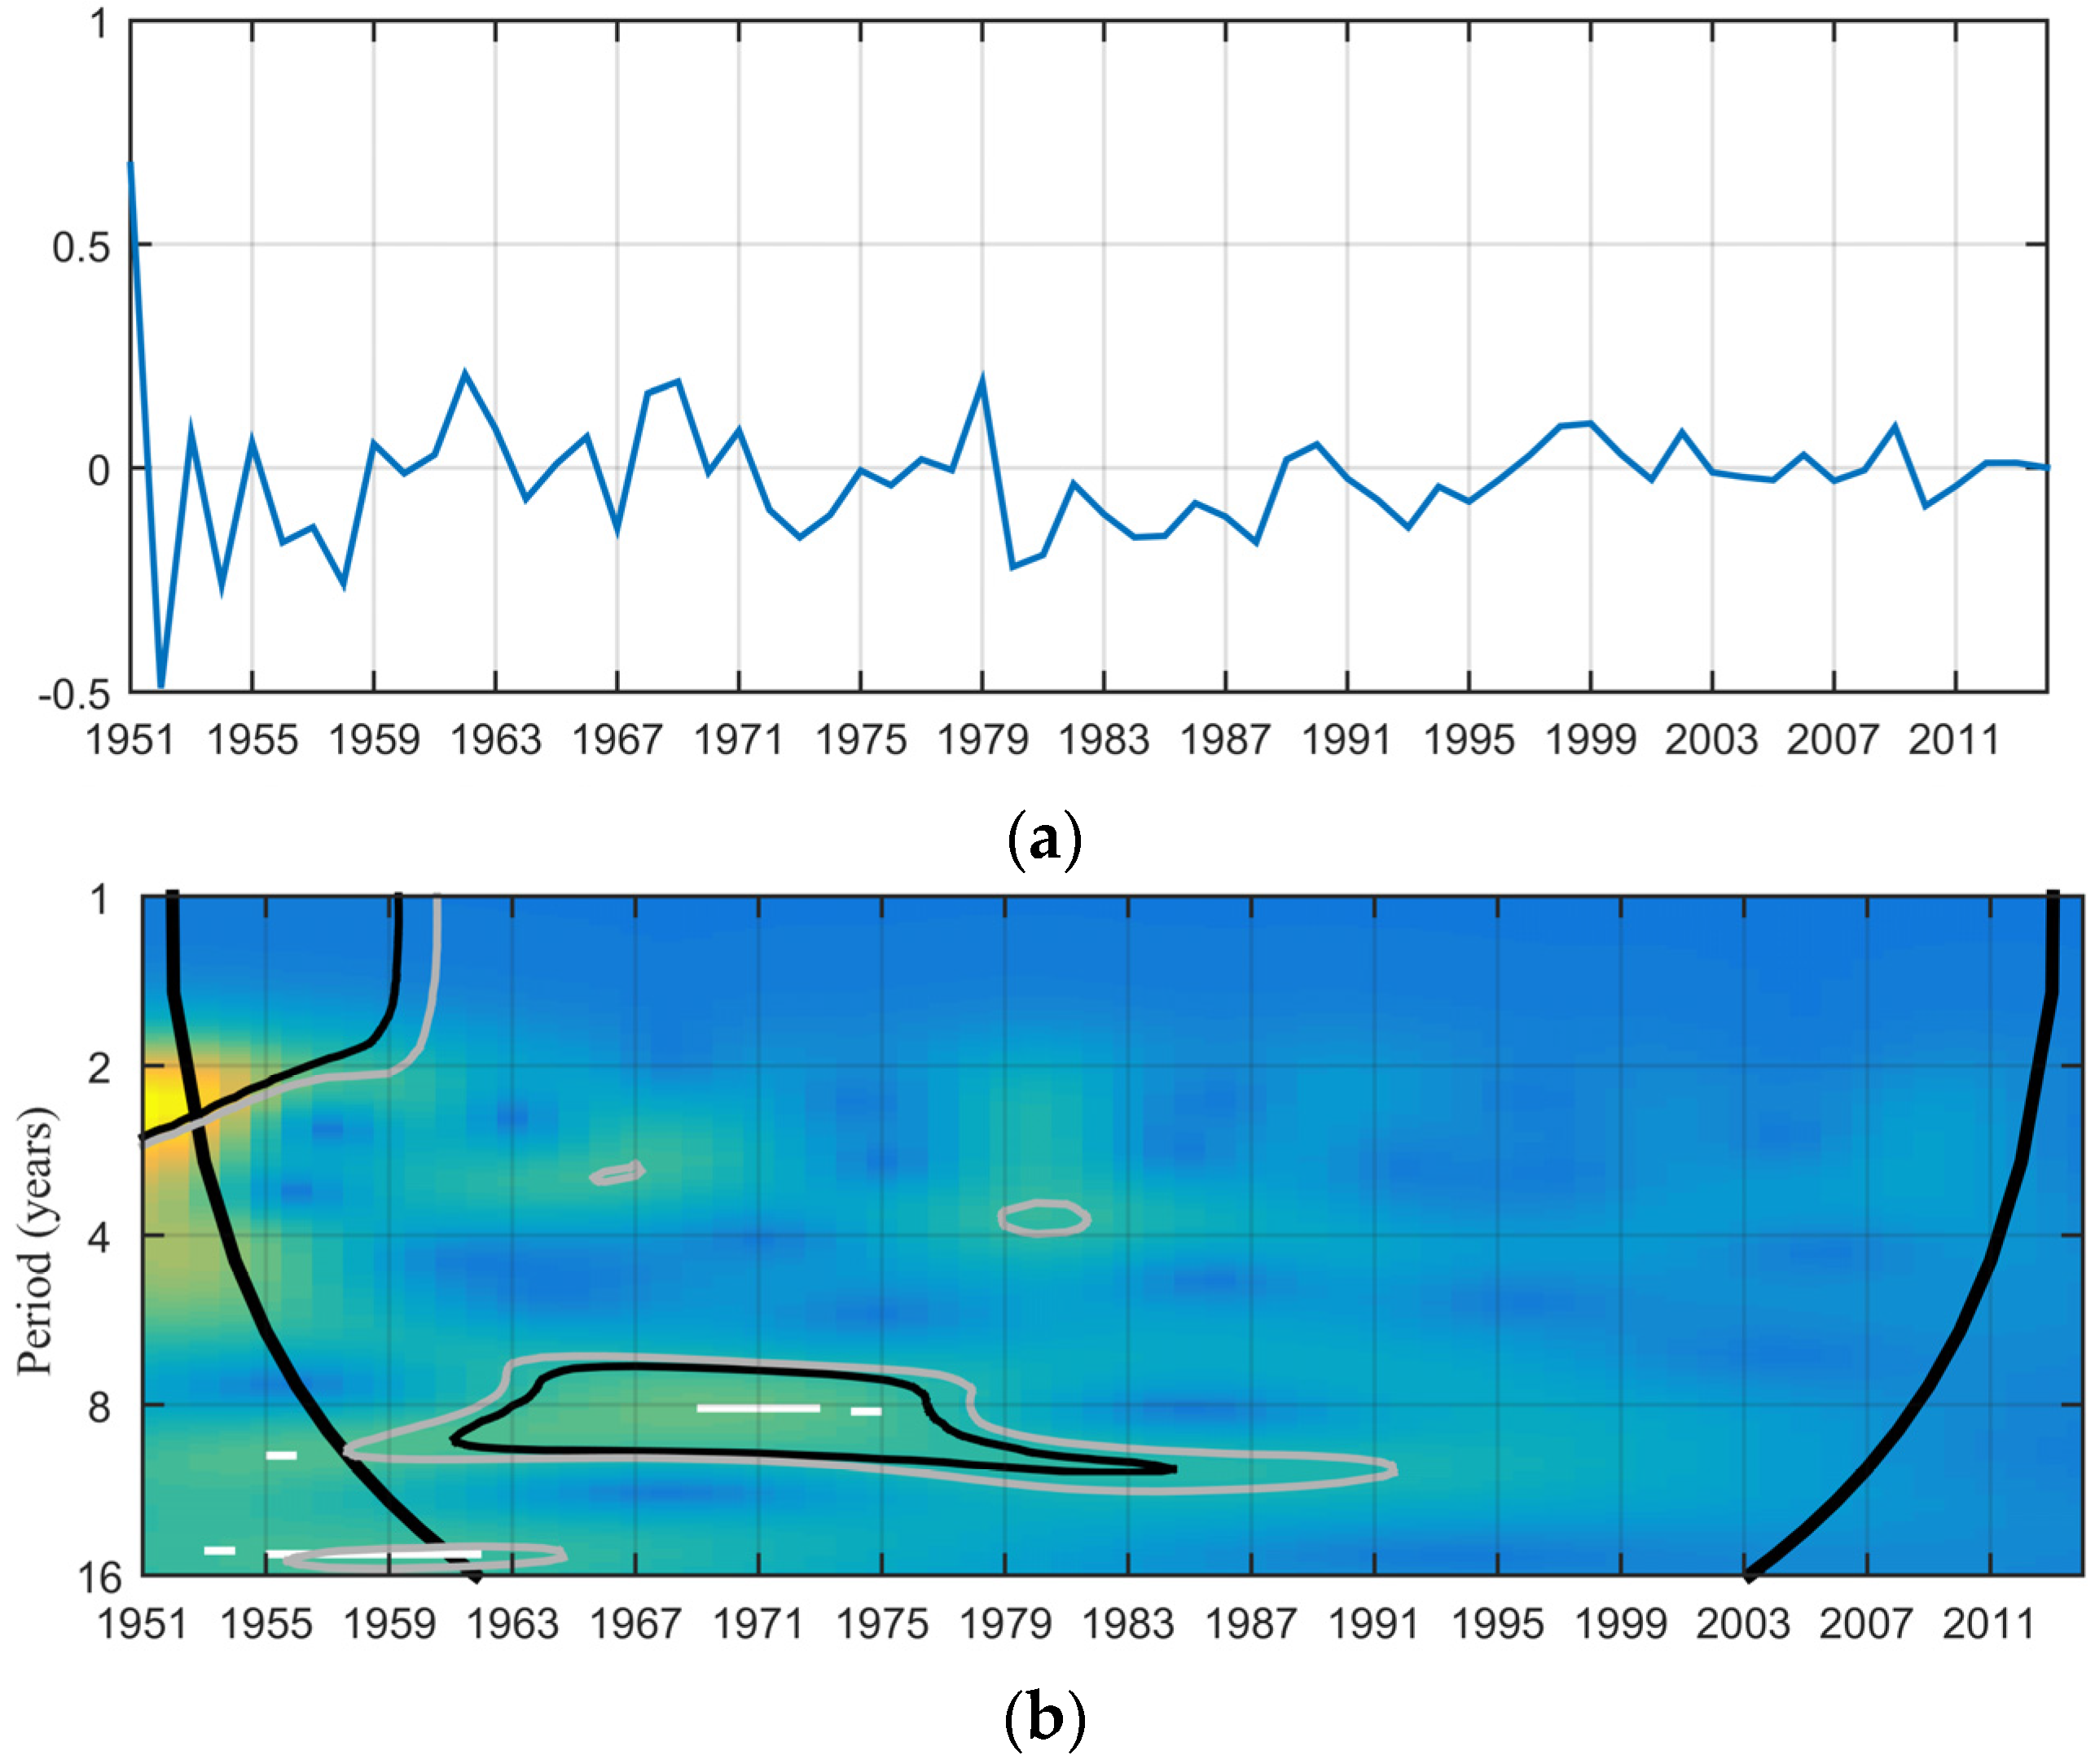
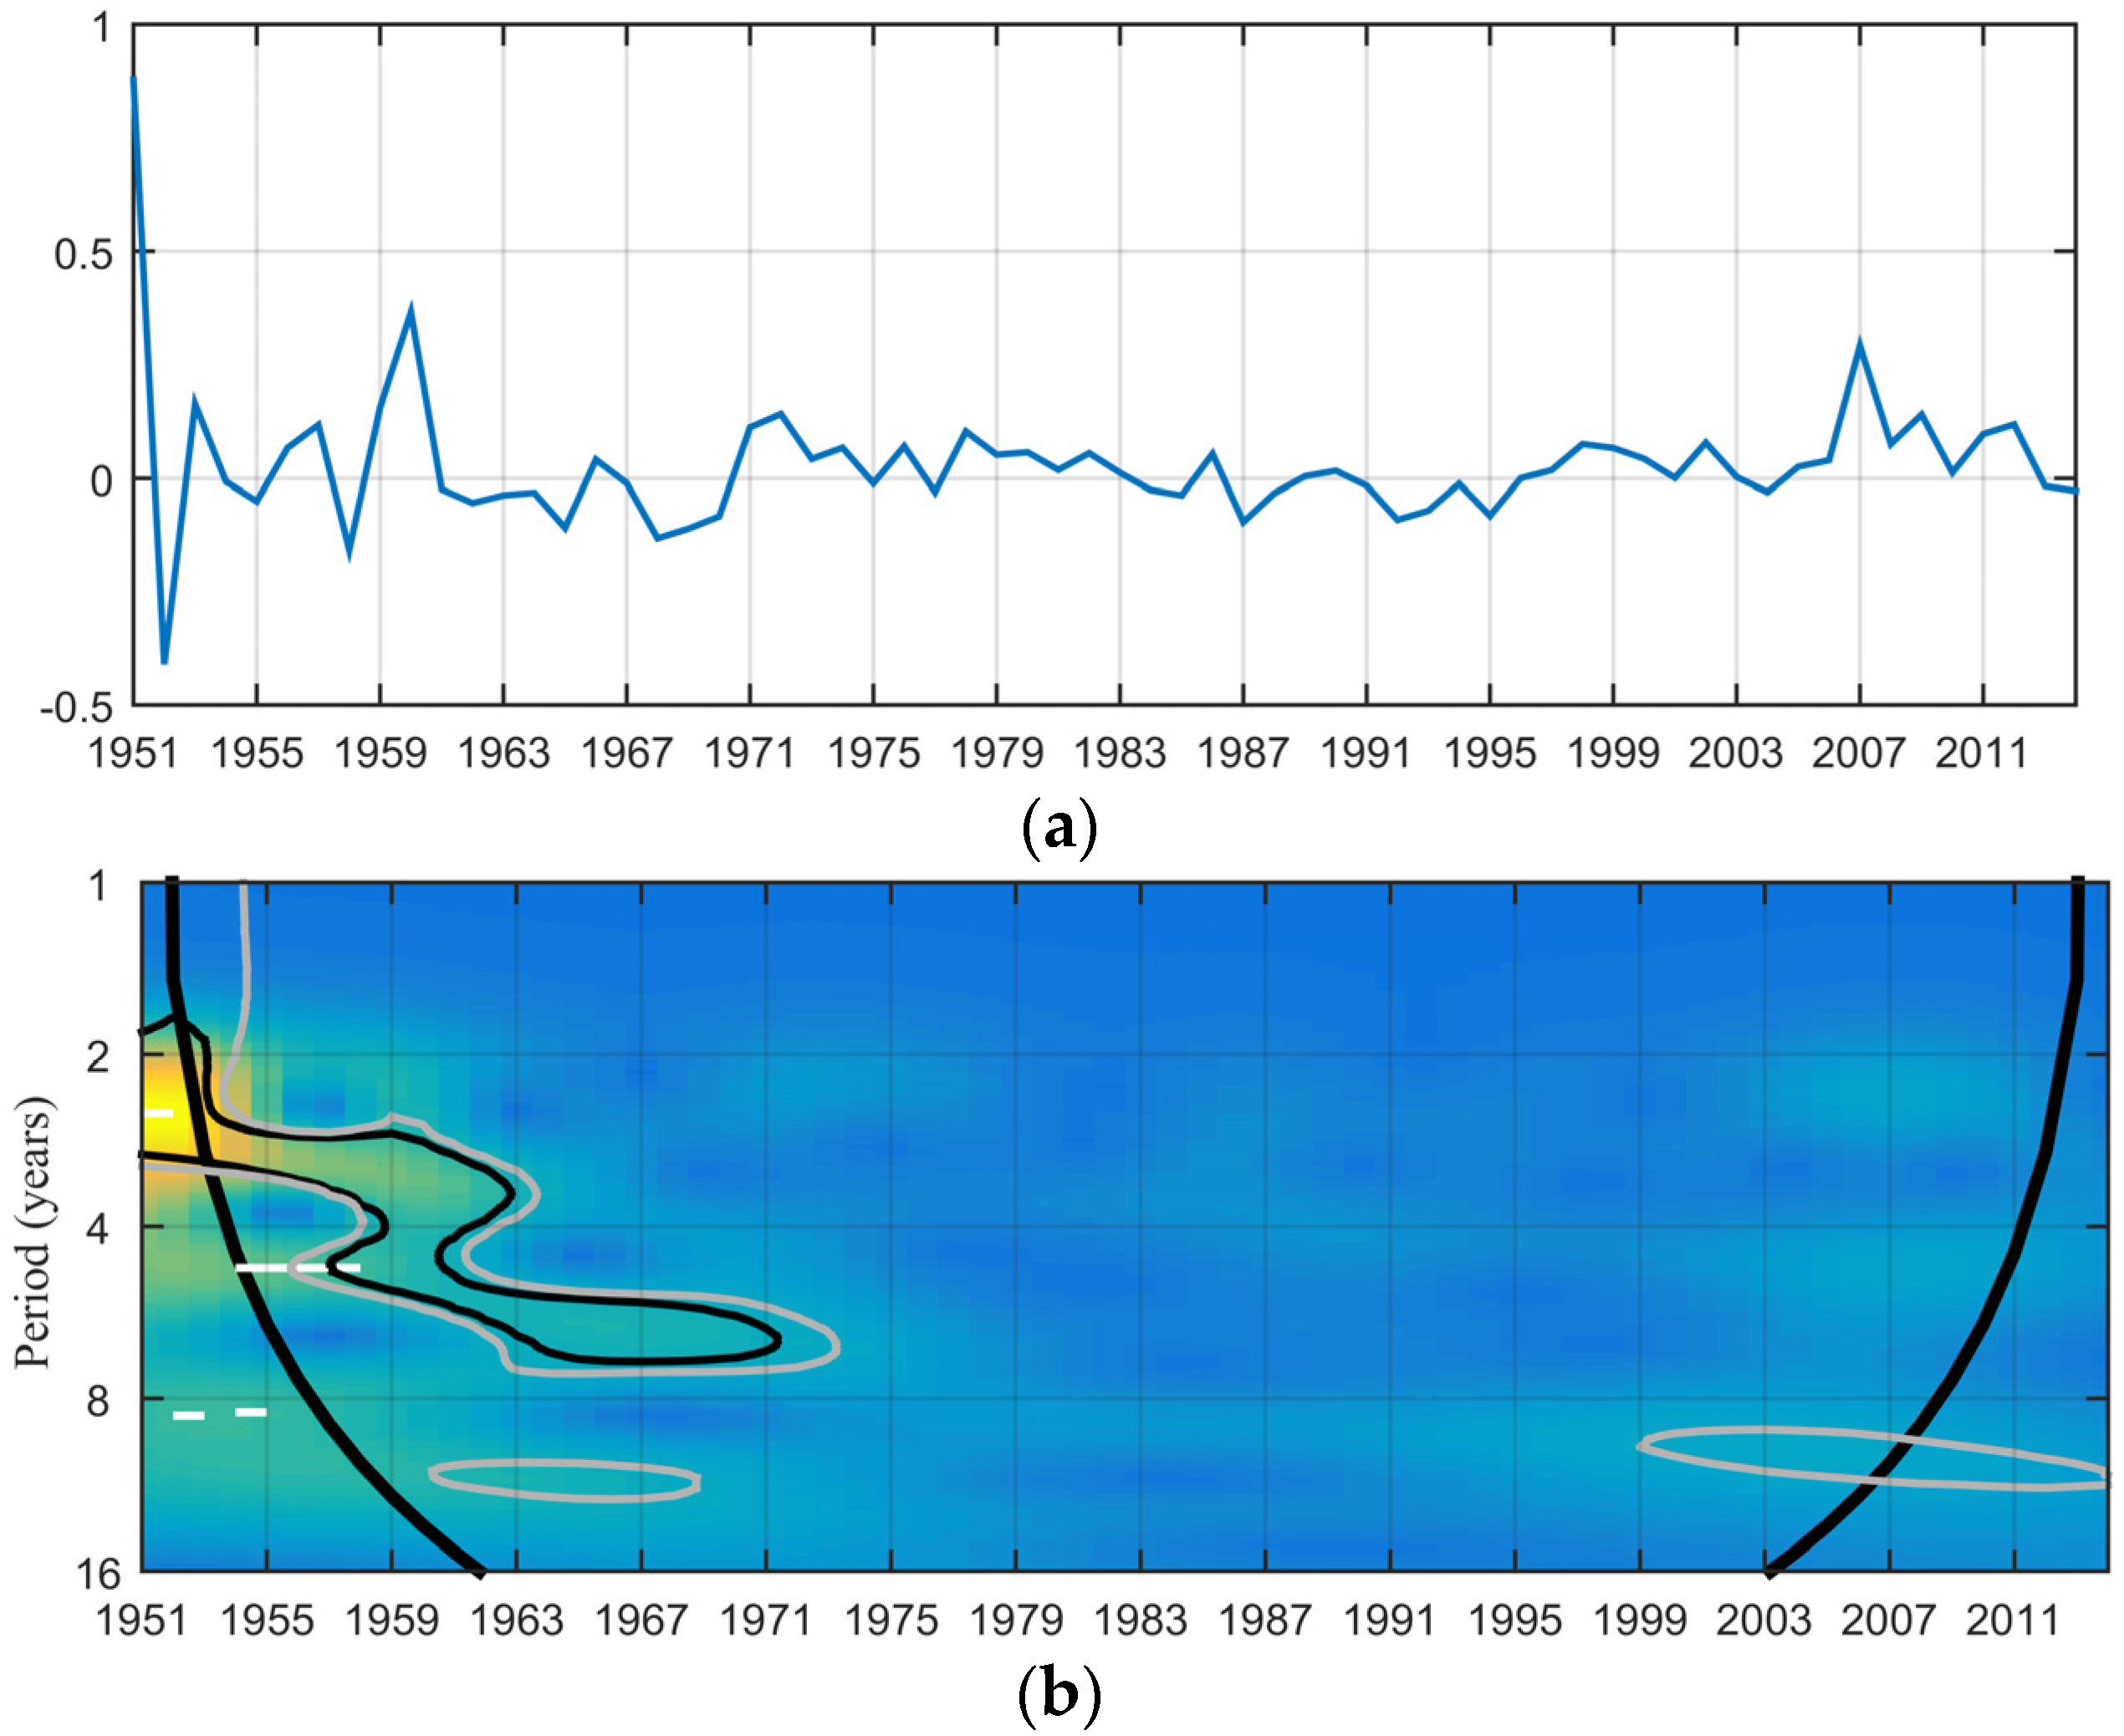
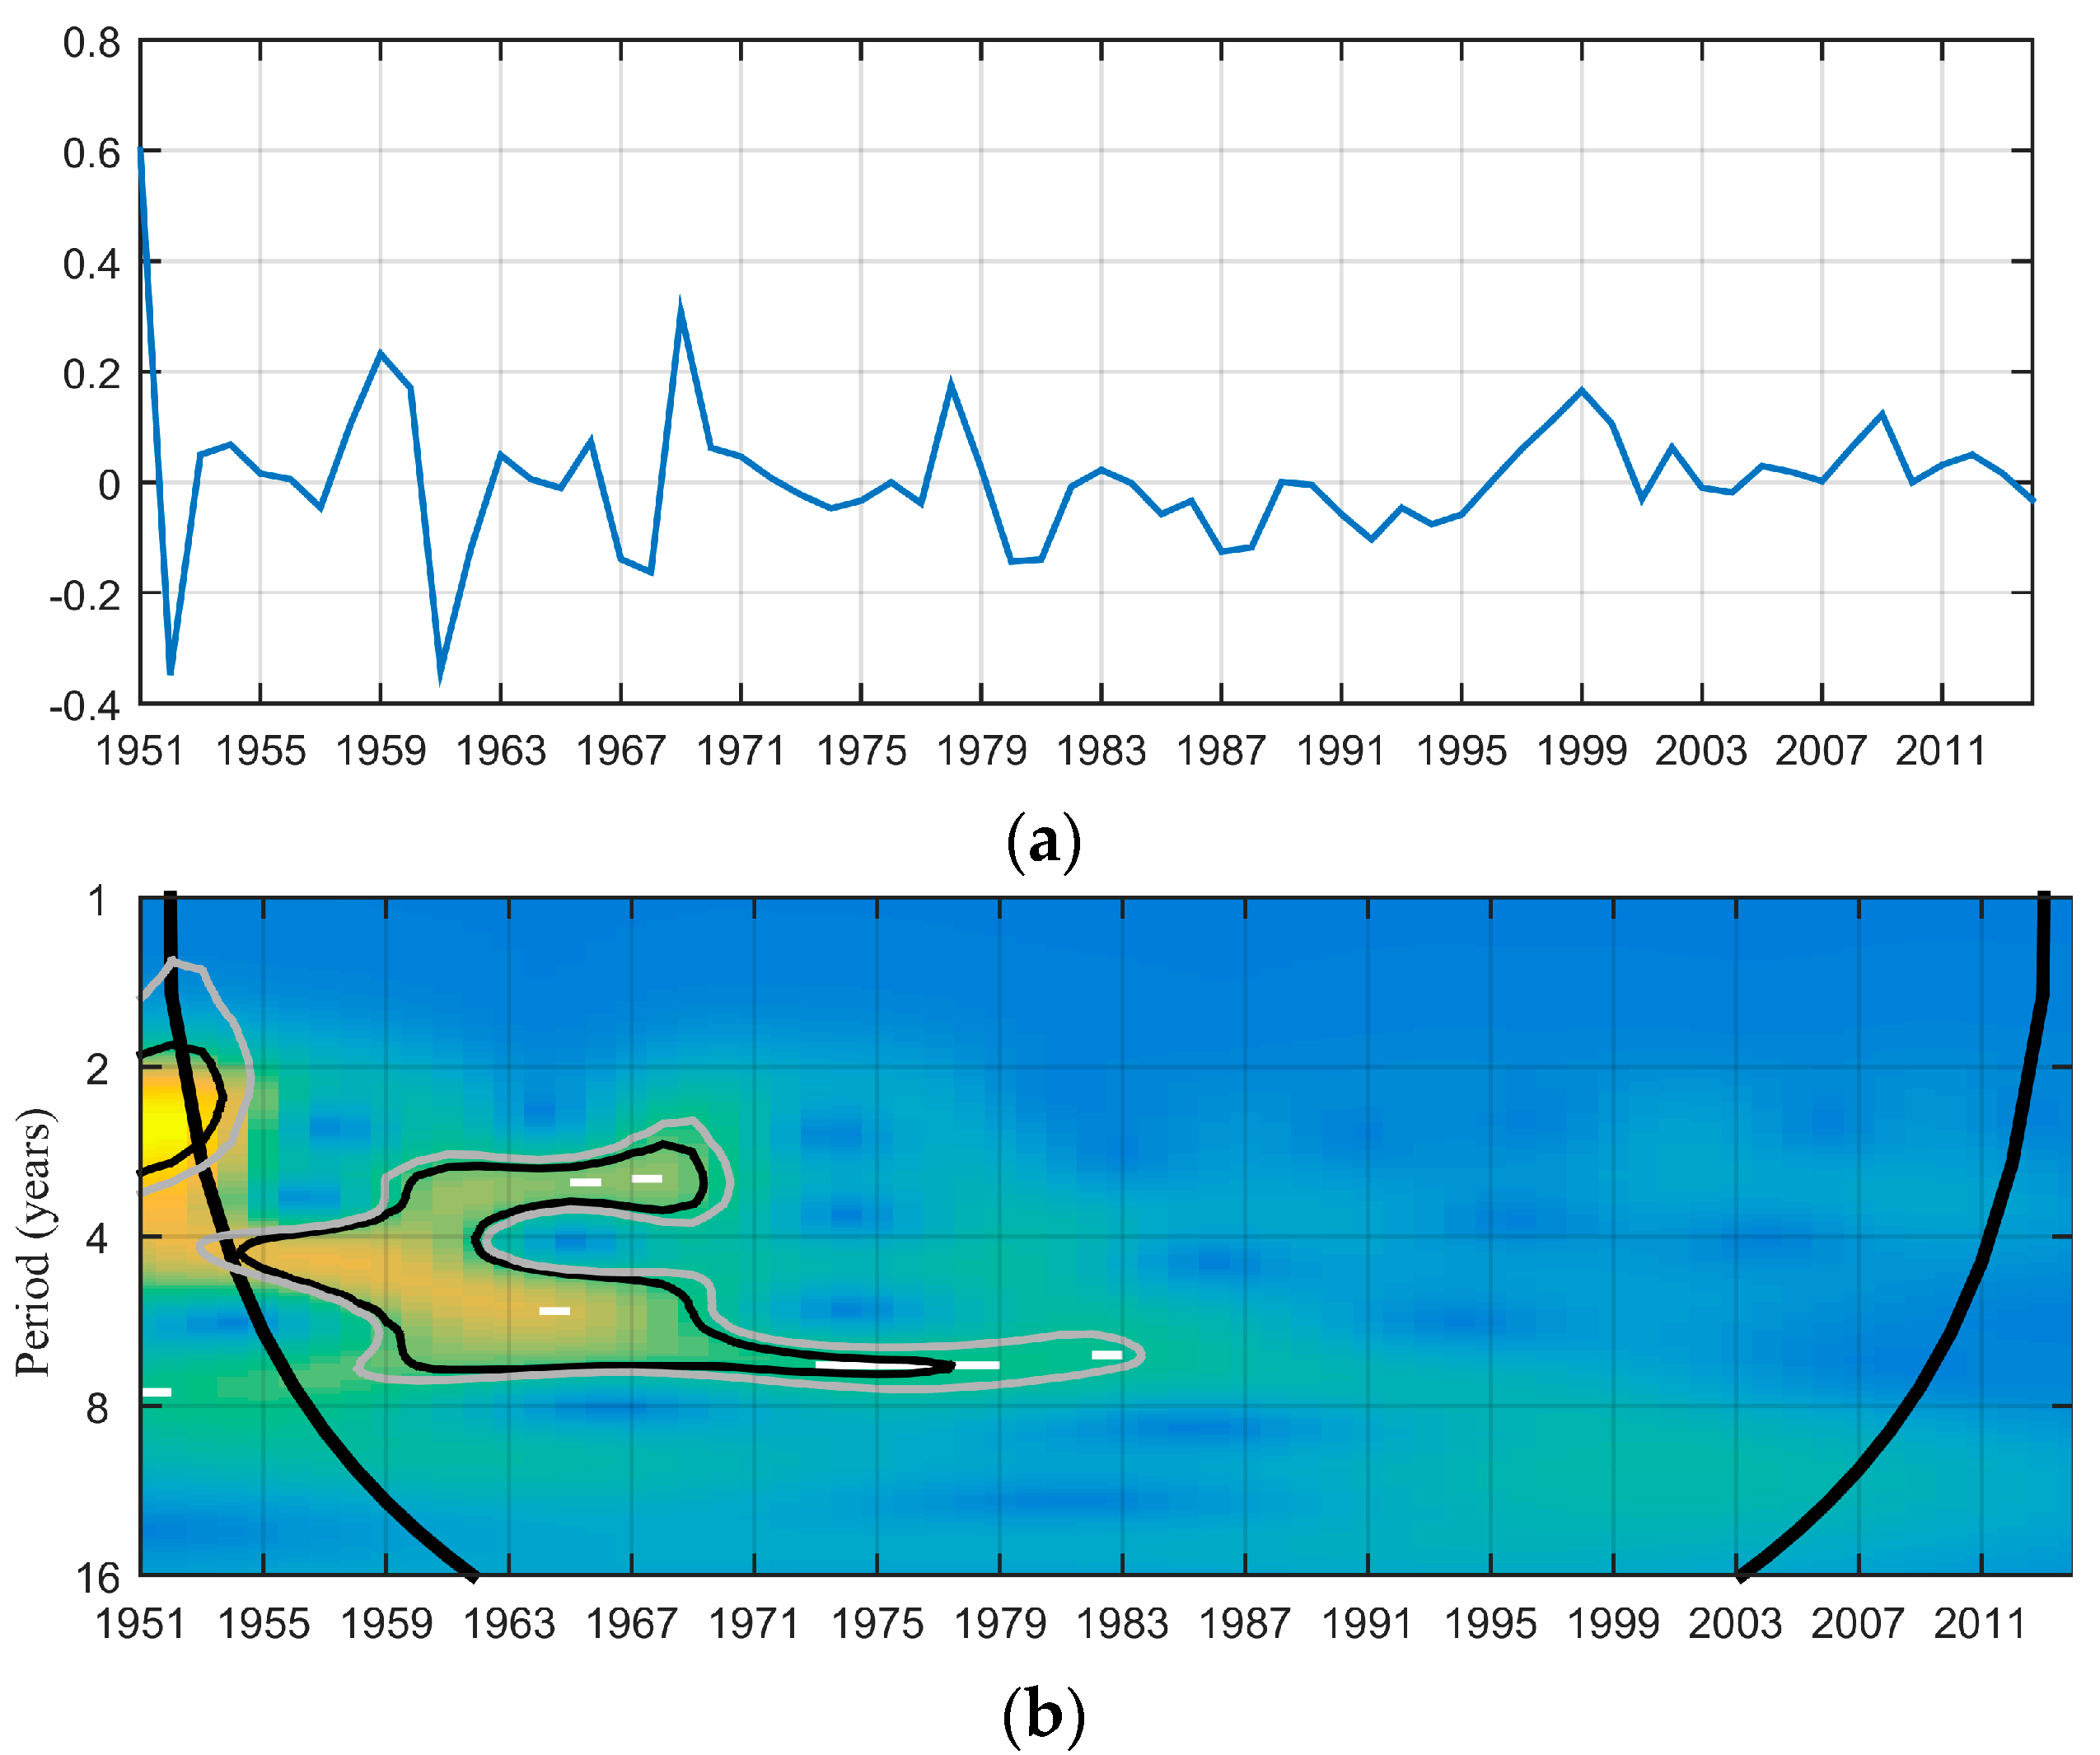
Figure 2, Figure 3 and Figure 4 present the wavelet power spectrum of defense expenditure as a ratio to GDP, social welfare spending as a ratio to GDP and government fiscal expenditure as a ratio to GDP in terms of growth rate, respectively. The horizontal axis displays the time dimension, and the vertical axis presents the frequency dimension in time units (years). We separate the vertical axis into four frequency bands: 1–2 years, 2–4 years, 4–8 years, 8–16 years, corresponding to a short term, medium term, long term and very long-term relationship between defense expenditure and social welfare. The color represents the strength of power, ranging from blue (low power) to red (high power). The cone of influence (COI) is given by a thick black line, which defines the regions affected by the edge effects, we therefore mainly focus on the regions inside the COI.
Figure 2 shows the volatilities of the growth rate of the Defense are significant (at 5% significance level) in the 1st–4th frequency band over the period of 1952–1959 and in the 4th–16th frequency band over the period of 1962–1983. Since the political and economic situation was unstable after the establishment of the People’s Republic of China over the period of 1952–1959, the defense expenditure experienced remarkable fluctuations. The high power in the 4th–16th frequency band over the period of 1962–1983 may due to the Great Cultural Revolution and the policy of reform and opening-up. The Great Cultural Revolution caused massive social and economic confusion, which generated a powerful impact on the defense expenditure. In addition, China paid more attention to economic development and decreased the investment in defense construction based on the policy of reform and opening-up. Hence, the growth rate of defense expenditure presented significant volatility in the early years of the policy of reform and opening-up.
Figure 3 shows the power of the growth rate of SW is significant (at 5% significance level) in the 2–8 years band over the period of 1953–1971. China underwent enormous social and economic upheaval after the establishment of the People’s Republic of China due to the Great Leap Forward, the Great Famine and the Great Cultural Revolution. The growth rate of social welfare spending therefore experienced fluctuations over this period in a medium term and a long term.
Figure 4 shows significant (at 5% significance level) volatilities of the growth rate of GFE in the 2nd–4th frequency band over the period of 1955–1969 and in the 4th–8th frequency band over the period of 1955–1978. Since social welfare spending is an important portion of government fiscal expenditure, the volatility of growth rate of government fiscal expenditure presents the similar pattern to the social welfare spending. The power was significantly high in a medium term and a long term during the period of the Great Leap Forward, the Great Famine and the Great Cultural Revolution, and tended to decrease after the reform and opening-up.

5.2. Partial Wavelet Coherency

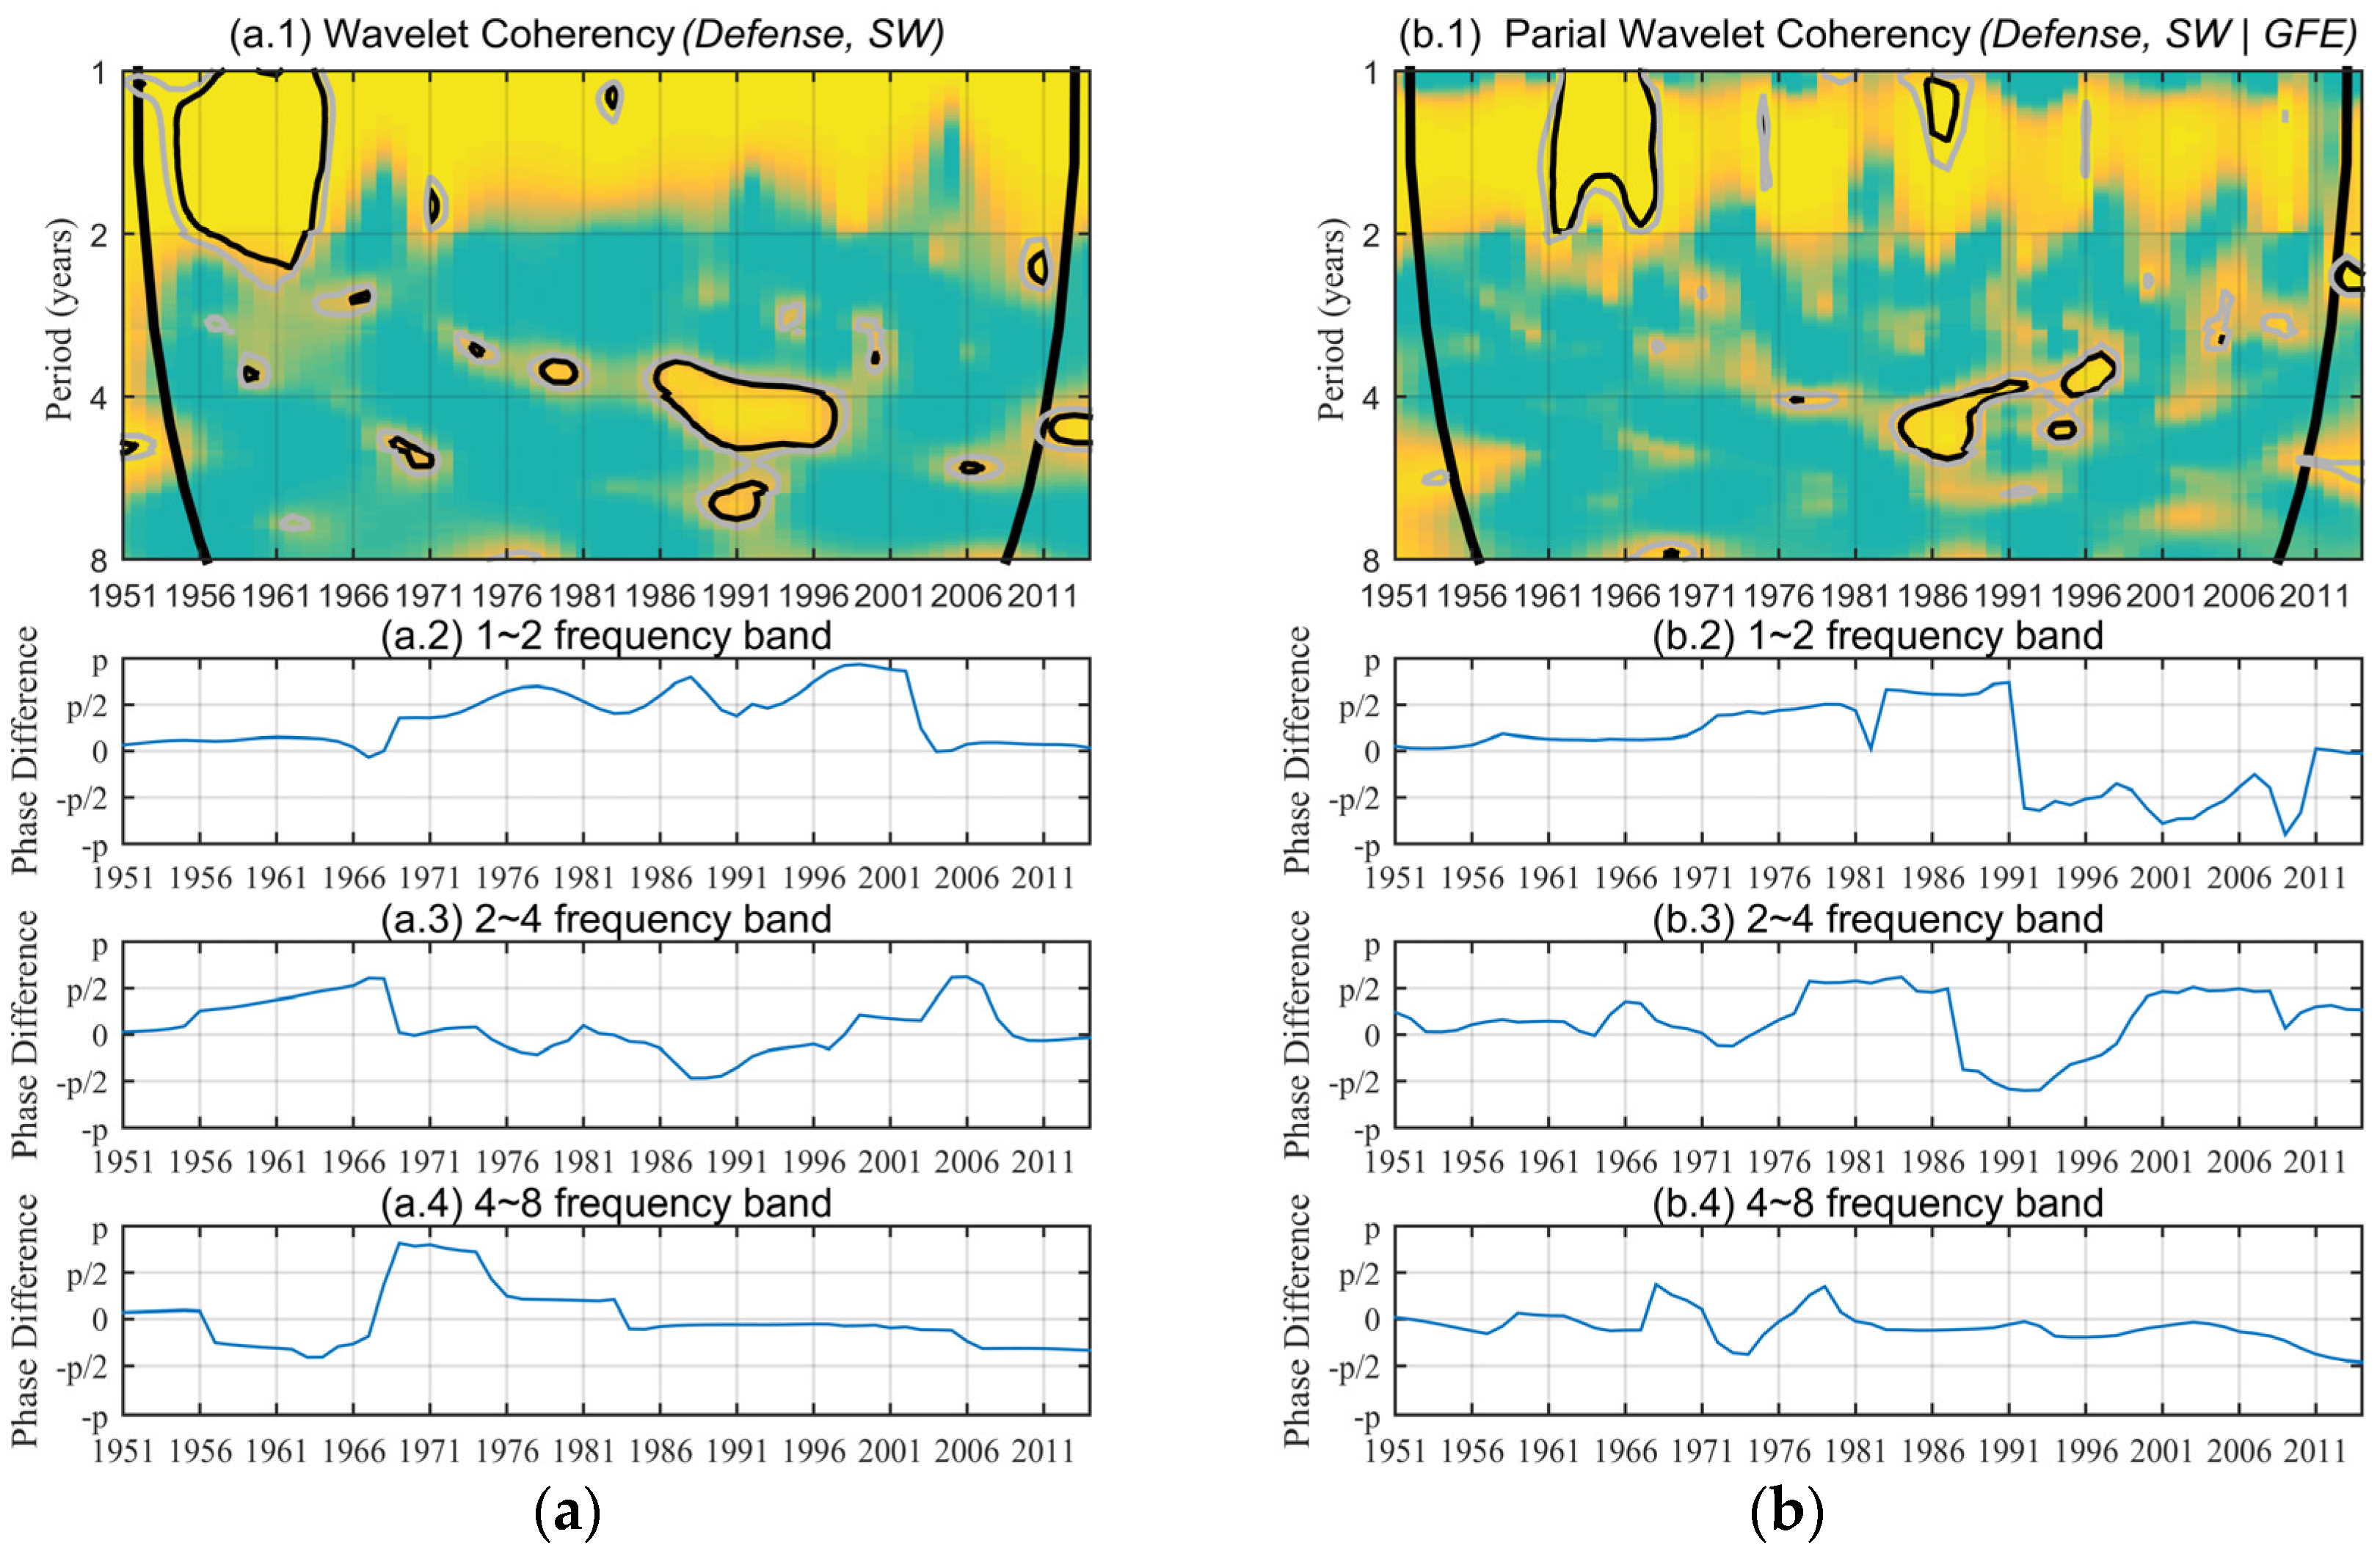
Figure 5a,b present the wavelet coherency and partial wavelet coherency (conditional upon the growth rate of government fiscal expenditure as a ratio to GDP), respectively. We decompose the vertical axis into three frequency bands: 1–2 years, 2–4 years, 4–8 years, corresponding to a short term, medium term and long term correlationship and lead-lag relationship between defense expenditure and social welfare spending. In addition, Figure 5b shows changes in the partial wavelet coherency and phase differences with GFE as a control variable. In general, we use the partial wavelet coherency to examine the crowding-out effect and lead-lag relationship between the two variables.
Figure 5(b1) shows the high significant coherency in the 1st–2nd frequency band over the period of 1961–1968 (a period post-the Great Leap Forward and close to the Great Famine and the Great Cultural Revolution), 1986–1988 (a period close to the reform and opening-up and the economy system reform). Figure 5(b2) suggests the correlation and lead-lag relationship between the two variables in a short term. During the period of 1961–1968, ϕ x y , z ( 0 , π 2 ) indicates the positive relationship between Defense and SW, and Defense is leading SW. During this period, China attached great importance to defense and social welfare since it was in recovery from the economic breakdown and the unstable social situation, then defense expenditure was positively related with social welfare, accordingly. In contrast, during the period of 1986–1988, ϕ x y , z ( π 2 , π ) indicates that Defense is negatively correlated with SW, and SW leads. China became more supportive of economic and social welfare progress and reduced the defense expenditure because of the reform and opening-up and the economic system reform, which resulted in the negative relationship between defense expenditure and social welfare spending in the short term.
Figure 5(b1) shows that the coherency of the two variables are significant during the period of 1989–1991 (a period post-the Sino-Vietnamese War), 1995–1998 and 2005 (two periods close to the economic system reform) in the 2nd–4th frequency band (medium term). As indicated by the Figure 5(b3), during the period of 1989–1991, ϕ x y , z ( π , π 2 ) means Defense and SW move anti-phase with one another, which suggests a negative relationship, and Defense leads. The Sino-Vietnamese War caused disorder in the social situation. China increased the defense expenditure to maintain the social stability and consequently crowded out the social welfare spending. In contrast, during the period of 1995–1998 and 2005, Defense is positively correlated with SW. In addition, the former case with ϕ x y , z ( π 2 , 0 ) reveals that SW is leading Defense, while the latter case with ϕ x y , z ( 0 , π 2 ) suggests the opposite. As the further deepening of the economic system reform took place, China tended to balance the defense growth and social welfare progress from the perspective of civil-military integration. The empirical results examined the inexistence of the crowding-out effect of defense expenditure and social welfare in the medium term.
We observe significant correlations between Defense and SW that correspond to the periods of 1969 (a period close to the Great Cultural Revolution, Sino-Soviet border conflict and the Sino-Burmese conflict), 1977 (post-the Great Cultural Revolution), 1984–1988 (the reform and opening-up), 1994–1995 (the economic system reform) in Figure 5(b1) for the time scale of 4–8 years. In 1969 and 1977, ϕ x y , z ( 0 , π 2 ) (i.e., in phase) reveals the positive relationship between defense expenditure and social welfare spending, and Defense is leading SW. Consistent with the high coherency in the 1st–2nd frequency band over the period of 1961–1968, Defense was positively correlated with SW, and Defense led in 1969 and 1977. During the period of 1984–1988 and 1994–1995, the correlations and lead-lag relationships exhibit the same pattern. The partial wavelet coherency ( ϕ x y , z ) ranges from π 2 to 0, which indicates the positive relationship between Defense and SW, with SW leading. Consistent with the high coherency in 1995–1998 in the 2nd–4th frequency band, as the further deepening of the economic system reform and economic growth, social welfare was positively correlated with defense expenditure. The crowding-out effects and the lead-lag relationships between Defense and SW during the sample period across all the frequency bands are listed in Table 4.
In summary, the partial wavelet coherency and phase differences provide a detailed picture about the dynamic relationship between defense expenditure and social welfare spending across three frequency bands during the 1951–2014 period. The results show the overall inexistence of the crowding-out effect, which indicates that the increase in defense (social welfare) expenditure is capable of promoting social welfare (defense) since China proceeds the mutual development of defense and social welfare. Furthermore, the lead-lag relationship between defense expenditure and social welfare spending varies after 1978, since China pays more attention to social welfare progress than defense construction based on the policy of reform and opening-up and the economic system reform, which causes social welfare to lead defense instead of the opposite.

6. Conclusions

Currently, the sustainability of China’s fiscal budget has been challenged by the crowding-out effect between defense and social welfare sectors. This article therefore revisits the “guns and butter” argument by using the long time series data of China during the period of 1950–2014. The continuous wavelet analysis is employed to examine the dynamic crowding-out effect and lead-lag relationship across different frequency bands between defense expenditure and social welfare spending with government fiscal expenditure as a control variable.
Based on the empirical analyses, we draw three primary conclusions. Firstly, the volatilities of defense expenditure, social welfare and government fiscal expenditure have decreased since 1978 with the implementation of opening-up policy and the economic system reform. Secondly, there is no crowding-out effect between defense expenditure and social welfare, moreover, defense expenditure is positively correlated with social welfare in the time-frequency domain. Thirdly, the lead-lag relationship shows the significant variations from the perspective of frequency domain. Social welfare tended to lead defense since the opening-up policy and the economic system reform while the situation was the opposite before 1978.
Hence, it is suggested that China should, firstly, maintain the stability of the social and economic situation to achieve the steady progress of fiscal expenditure and revenue including defense and social welfare. Secondly, China should further balance the defense construction and social welfare development from the perspective of civil-military integration given the positive correlation of defense expenditure and social welfare spending. Thirdly, more attention should be paid to the leading role of social welfare in the lead-lag relationship between defense expenditure and social welfare. Social welfare progress will lead to simultaneous improvement in defense, which is beneficial to national security, economic growth and government fiscal sustainability.

Acknowledgments

We gratefully acknowledge the financial support from National Social Science Foundation of China (No. 15CGL045), National Natural Science Foundation of China (No. 71473036), Ministry of Education of Jiangsu Province (2014SJD013), Social Science Research Grant of Southeast University (No. 2242015S22005), Ministry of Education of the People’s Republic of China (No. 14YJC790110) and European Commission. Responsibility for all errors is ours. The usual disclaimer applies.

Author Contributions

Ying Zhang and Xiaoxing Liu conceived and designed the experiments; Rui Wang performed the experiments; Rui Wang and Ruobing Tang wrote the paper.

Conflicts of Interest

The authors declare no conflict of interest.

References

  1. China Statistical Yearbook, 2015; China Statistics Press: Beijing, China, 2015.
  2. Aguiar-Conraria, L.; Soares, M.J. The continuous wavelet transform: Moving beyond uni- and bivariate analysis. J. Econ. Surv. 2014, 28, 344–375. [Google Scholar] [CrossRef]
  3. Kollias, C.; Paleologou, S.M. Budgetary trade-offs between defence, education and social spending in Greece. Appl. Econ. Lett. 2011, 18, 1071–1075. [Google Scholar] [CrossRef]
  4. Lin, E.S.; Ali, H.E.; Lu, Y.L. Does military spending crowd out social welfare expenditures? Evidence from a panel of OECD countries. Defence Peace Econ. 2015, 26, 33–38. [Google Scholar] [CrossRef]
  5. Yildirim, J.; Sezgin, S. Military expenditure and employment in Turkey. Defence Peace Econ. 2003, 14, 129–139. [Google Scholar] [CrossRef]
  6. Zhang, Y.; Liu, X.; Xu, J.; Wang, R. Does military spending promote social welfare? A comparative analysis of the BRICS and G7 countries. Defence Peace Econ. 2016. [Google Scholar] [CrossRef]
  7. Apostolakis, B.E. Warfare–welfare expenditure substitutions in Latin America, 1953–87. J. Peace Res. 1992, 29, 85–98. [Google Scholar] [CrossRef]
  8. Dabelko, D.; McCormick, J.M. Opportunity costs of defense: Some cross-national evidence. J. Peace Res. 1977, 14, 145–154. [Google Scholar] [CrossRef]
  9. Deger, S. Human resource, government’s education expenditure and the military burden in less developed countries. J. Dev. Areas 1985, 20, 37–48. [Google Scholar]
  10. Ozsoy, O. Budgetary trade-offs between defense, education and health expenditures: The case of Turkey. Defence Peace Econ. 2002, 13, 129–136. [Google Scholar] [CrossRef]
  11. Peroff, K.; Podolak-Warren, M. Does spending on defence cut spending on health? A time-Series analysis of the U.S. Economy: 1929–74. Brit. J. Polit. Sci. 1979, 9, 21–39. [Google Scholar] [CrossRef]
  12. Russett, B.M. Who pays for defense? Am. Polit. Sci. Rev. 1969, 63, 412–426. [Google Scholar] [CrossRef]
  13. Frederiksen, P.C.; Looney, R.E. Budgetary consequences of defense expenditures in Pakistan: Short-run impacts and long-run adjustments. J. Peace Res. 1994, 31, 11–18. [Google Scholar] [CrossRef]
  14. Mintz, A. Guns versus butter: A disaggregated analysis. Am. Polit. Sci. Rev. 1989, 83, 1285–1293. [Google Scholar] [CrossRef]
  15. Russett, B. Defense expenditures and national well-being. Am. Polit. Sci. Rev. 1982, 76, 767–777. [Google Scholar] [CrossRef]
  16. Peroff, K. The warfare-welfare trade-off: Health, public aid, and housing. J. Sociol. Soc. Welfare 1976, 4, 366–381. [Google Scholar]
  17. Harris, G.; Kelly, M.; Pranowo. Trade-offs between defence and education/health expenditures in developing countries. J. Peace Res. 1988, 25, 165–177. [Google Scholar] [CrossRef]
  18. Verner, J.G. Budgetary trade-offs between education and defence in Latin American: A research note. J. Dev. Areas 1983, 18, 77–92. [Google Scholar]
  19. Caputo, D.A. New perspectives on the public policy implications of defense and welfare expenditures in four modern democracies: 1950–1970. Policy Sci. 1975, 6, 423–446. [Google Scholar] [CrossRef]
  20. Davis, D.R.; Chan, S. The security–welfare relationship: Longitudinal evidence from Taiwan. J. Peace Res. 1990, 27, 87–100. [Google Scholar] [CrossRef]
  21. Domke, W.K.; Eichenberg, R.C.; Kelleher, C.M. The illusion of choice: Defense and welfare in advanced industrial democracies, 1948–1978. Am. Polit. Sci. Rev. 1983, 77, 19–35. [Google Scholar] [CrossRef]
  22. Eichenberg, R.C. The Expenditure and revenue effects of defense spending in the frederal republic of Germany. Policy Sci. 1984, 16, 391–411. [Google Scholar] [CrossRef]
  23. Hess, P.; Mullan, B. The military burden and public education expenditures in contemporary developing nations: Is there a trade-off? J. Dev. Areas 1988, 22, 497–514. [Google Scholar]
  24. Cazelles, B.; Chavez, M.; de Magny, G.C.; Guegan, J.F.; Hales, S. Time-dependent spectral analysis of epidemiological time-series with wavelets. J. R. Soc. Interface 2007, 4, 625–636. [Google Scholar] [CrossRef] [PubMed]
  25. Cazelles, B.; Chavez, M.; Berteaux, D.; Ménard, F.; Vik, J.O.; Jenouvrier, S.; Stenseth, N.C. Wavelet analysis of ecological time series. Oecologia 2008, 156, 287–304. [Google Scholar] [CrossRef] [PubMed]
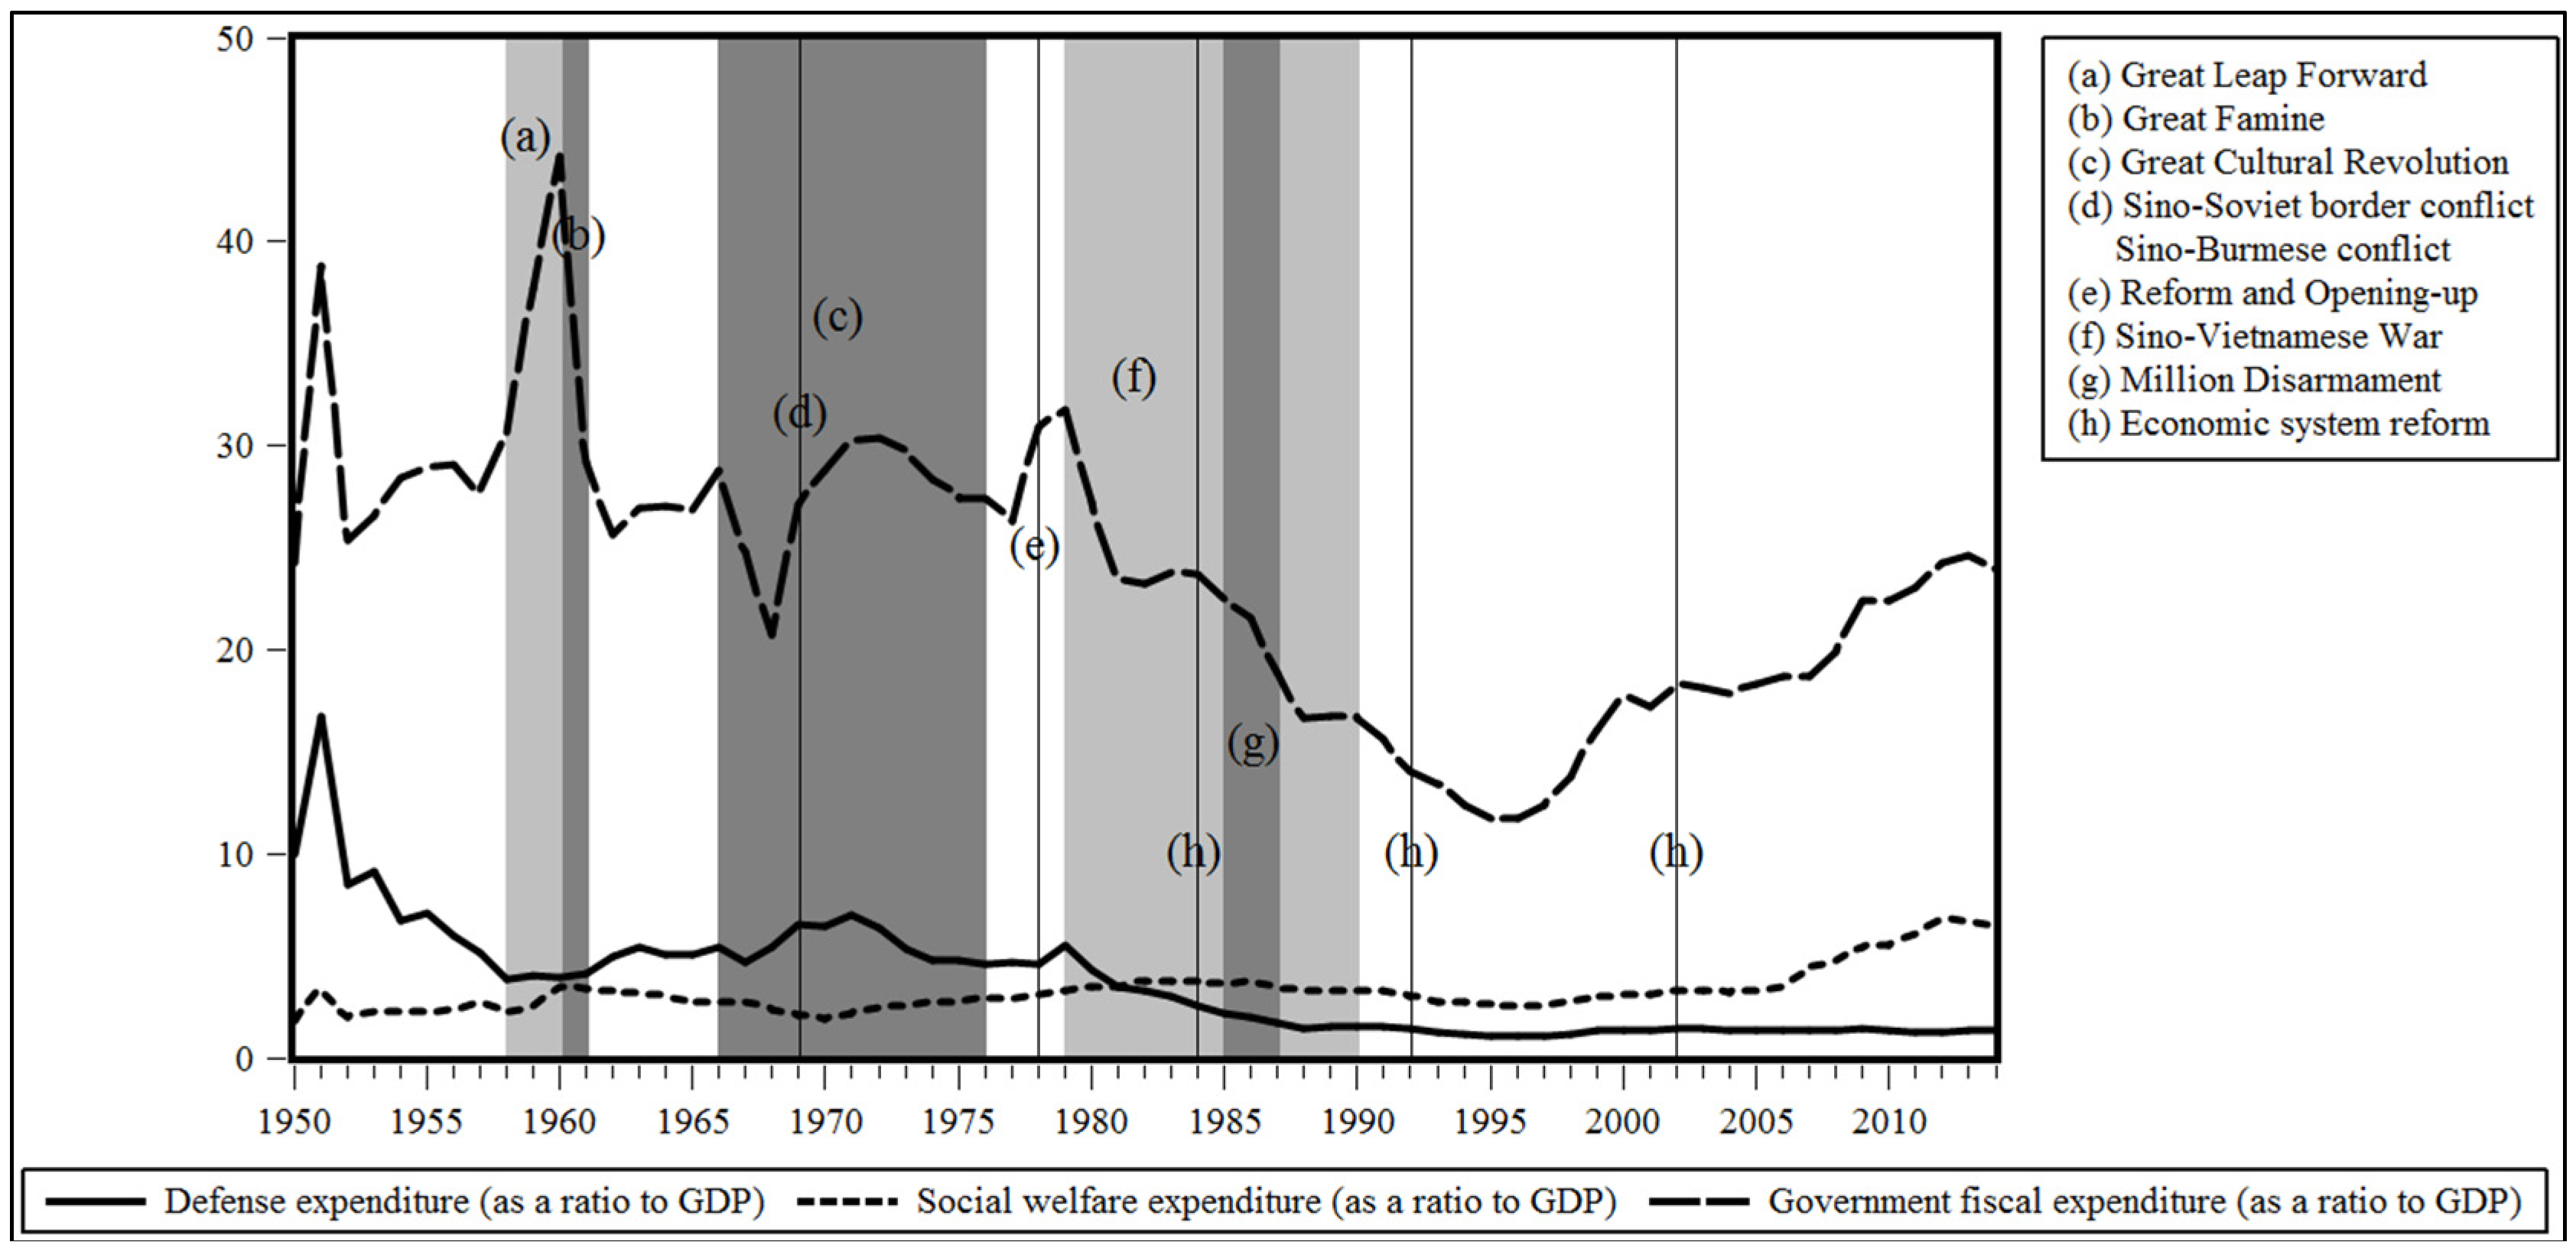
Figure 1. Changing trends of defense, social welfare and government fiscal expenditures. Source:National Bureau of Statistics of China, 2015 [1].
Sustainability 08 00655 g001
Figure 2. (a) Growth rate of Defense; (b) Wavelet power spectrum of the growth rate of Defense. Note: The black (gray) contour denotes the 5% (10%) significance level. The thick black contour represents the COI. Similarly hereinafter.
Sustainability 08 00655 g002
Figure 3. (a) Growth rate of social welfare (SW); (b) Wavelet power spectrum of the growth rate of SW.
Sustainability 08 00655 g003
Figure 4. (a) Growth rate of government fiscal expenditure (GFE); (b) Wavelet power spectrum of the growth rate of GFE.
Sustainability 08 00655 g004
Figure 5. (a) Wavelet coherency between the growth rate of Defense and SW; (b) Partial wavelet coherency between the growth rate of Defense and SW.
Sustainability 08 00655 g005
Table 1. Theoretical studies on the relationship between defense and social welfare.
TheoriesAuthorsDetails
Keynesian theoryYildirim and Sezgin [5]; Kollias and Paleologou [3]; Lin, Ali and Lu [4]; Zhang, et al. [6]Defense expenditure can stimulate social welfare spending by increasing the aggregate demand.
Crowding-out effectRussett [12]; Dabelko and McCormick [8]; Peroff and Podolak-Warren [11]; Deger [9]; Apostolakis [7]; Ozsoy [10]; Zhang, et al. [6]Defense expenditure can crowd out the social welfare spending.
No relationshipRussett [15]; Mintz [14]; Frederiksen and Looney [13]Defense expenditure has no relationship with social welfare spending.
Table 2. Empirical studies on the relationship between defense and social welfare.
FindingsAuthorsSampleMethod
PositiveVerner [18]10 Latin American countries, 1948–1979Time-series regression analysis
Harris, Kelly and Pranowo [17]Korea, Malaysia and Sri Lanka, 1967–1982Time-series data, a longitudinal regression analysis
Kollias and Paleologou [3]Greece, 1972–2004Time-series analysis, VAR
Lin, Ali and Lu [4]29 OECD countries, 1988–2005Panel data analysis, GMM
Zhang, et al. [6]BRICS and G7 countries, 1993–2007Panel cointegration, impulse response function
NegativeRussett [12]The US, the UK, France and Canada, 1939–1968Time-series analysis, OLS (ordinary least squares)
Peroff [16]The US, 1929–1971Time-series analysis, OLS
Dabelko and McCormick [8]77 countries, 1950–1972Cross-sectional time-series, OLS
Peroff and Podolak-Warren [11]The US, 1929–1974Time-series analysis, OLS
Deger [9]50 LDCs, 1967–1973Cross-sectional time-series, 3SLS
Apostolakis [7]19 Latin American countries, 1953–1987Time-series analysis
Ozsoy [10]Turkey, 1925–1998Time-series analysis, OLS
No RelationshipCaputo [19]Australia, Sweden, the UK and the US, 1950–1970Standardized regressions and Pearson coefficients
Russett [15]The US, 1941–1971Time-series analysis, OLS
Domke, Eichenberg, and Kelleher [21]The US, the UK, Germany and France, 1948–1980Time-series analysis, OLS
Eichenberg [22]Germany, 1950–1979Time-series analysis, OLS and GLS
Hess and Mullan [23]77 LDCs, 1982–1983Cross-sectional time-series, 2SLS
Mintz [14]The US, 1947–1980Time-series analysis, OLS
Davis and Chan [20]Taiwan, 1961–1985Time-series analysis, 3SLS
Frederiksen and Looney [13]Pakistan, 1973–1986Time-series analysis, short-run and long-run model
Table 3. Descriptions of variables.
VariableDescriptionTime PeriodData Source
DefenseGovernment defense expenditure/GDP1950–2014National Bureau of Statistics of China, 2015 [1]
SW (social welfare)Government expenditures of education, health, culture and technology/GDP1950–2014National Bureau of Statistics of China, 2015 [1]
GFE (government fiscal expenditure)Government fiscal expenditure/GDP1950-2014National Bureau of Statistics of China, 2015 [1]
Table 4. Crowding-out effect and lead-lag relationship between Defense and SW.
Frequency Time1–2 Years Band2–4 Years Band4–8 Years Band
LeadingCorrelationLeadingCorrelationLeadingCorrelation
1951–1960
1961–1968Defensepositive
1969 Defensepositive
1970–1976
1977 Defensepositive
1978–1983
1984–1985 SWpositive
1986–1988SWnegative SWpositive
1989–1991 Defensenegative
1992–1993
1994 SWpositive
1995 SWpositiveSWpositive
1996–1998 SWpositive
1999–2004
2005 Defensepositive
2006–2014