Article

The Effects of Roof and Wall Insulation on the Energy Costs of Low Income Housing in Mexico

by
Jorge Lucero-Álvarez
1,*,
Norma A. Rodríguez-Muñoz
2,3 and
Ignacio R. Martín-Domínguez
3
1
Advanced Materials Research Center (CIMAV-Chihuahua), Miguel de Cervantes 120, Complejo Industrial Chihuahua, Chihuahua 31109, México
2
Consejo Nacional de Ciencia y Tecnología (CONACYT), Av. Insurgentes Sur 1582, Ciudad de México 03940, México
3
Advanced Materials Research Center (CIMAV-Durango), Victoria 147 Norte, Zona Centro, Durango 34000, México
*
Author to whom correspondence should be addressed.
Sustainability 2016, 8(7), 590; https://doi.org/10.3390/su8070590
Submission received: 6 April 2016 / Revised: 9 June 2016 / Accepted: 13 June 2016 / Published: 25 June 2016
(This article belongs to the Special Issue Renewable Energy Applications and Energy Saving in Buildings)

Abstract

:
Environmental conditions, such as air temperature and solar radiation, have a complex relationship with the energy requirements for heating and cooling of residential buildings. In this work, a comparative analysis of the insulation methods most commonly applied to low income single-family houses in Mexico is presented, in order to find the most energy-efficient combinations of methods for the various climates in this country. A common kind of building, small houses built with hollow cinder block walls and concrete slab roofs, was analyzed considering three insulation scenarios: walls only, roof only and both. We used dynamic simulation to evaluate energy consumption under the climate conditions found in several Mexican cities. From the energy consumption data and the cost of electricity in Mexico, we calculated net annual energy costs, including both annual energy savings and the annualized cost of the initial investment in better insulation. Results of this analysis show that insulating both roof and walls is most effective in cities with cold winters; insulating just the roof is best for temperate climates; and insulating walls (combined with high-albedo roofs) is most effective for cities with year-long warm weather.

1. Introduction

1.1. Energy Use for Climate Control in Buildings

Energy use in buildings represents a significant fraction of total energy consumption in industrialized countries. For example, residential buildings account for about 22% of the energy consumed in the United States [1]. The equivalent fraction for Europe is around 26.8%, implying that energy use in buildings is responsible for a high proportion of the European output of greenhouse gases [2].
In 2014, the residential sector accounted for 22.6% of the total electricity consumption in Mexico. Only the industrial sector, which accounts for 63.1%, had a greater consumption [3]. Between 1996 and 2008, the number of homes with air conditioning in Mexico grew at an average rate of 7.5%. In 2008, total electricity consumption for air conditioning in the residential sector was 9.3 TWh, corresponding to 19.6% of the electricity consumption for the entire sector [4]. Air conditioners had the third highest energy consumption among electrical appliances in urban Mexican households between 1996 and 2006, accounting on average for 24% of the energy usage [5].
The optimal thickness of thermal insulation, as well as proper values of solar reflectance and infrared emissivity in a building’s exterior are some of the most effective passive measures for reducing the energy needs of heating and cooling equipment [6,7,8,9,10]. The importance of these measures, captured in concepts, such as R-value and cool roofs, has motivated the development and implementation of norms regulating the minimum requirements for all of these passive measures. Norms for thermal insulation exist in the United States and all EU member states [11]; cool roof standards have been implemented in the United States, China, India and some European countries [12,13].

1.2. Optimal Thickness of Thermal Insulation

Different factors affect heat transfer through roofs and vertical walls. During the daytime, heat transfer through the roof is dominated by two factors: absorption of solar radiation and infrared emission to the atmosphere. These effects are much less important in walls, where heat transfer is predominantly convective [14,15,16]. This difference occurs because solar radiation hits roofs at a much higher angle during the hours of greatest intensity. Roofs also have a greater view of the atmosphere than any vertical wall, so they will lose a much greater amount of heat to the atmosphere through infrared radiation. Convection strongly depends on wind direction; the convective heat loss coefficient is highest for upwind walls, followed by roofs, side walls and downwind walls, in that order [17,18].
Optimal thickness is an economic term, where the cost of purchasing and applying thermal insulation is subtracted from the energy savings accrued during the useful life of the insulation [10]. Given the different mechanisms of heat transfer that affect roofs and walls, the optimal thicknesses of thermal insulation for roofs and walls are not necessarily the same for any given building. Sisman et al. [19] studied the costs and benefits of thermal insulation under various climate conditions in Turkey, determining that the optimal insulation is indeed different for walls and roofs.

1.3. Combined Effect of Solar Reflectance and Thermal Insulation in Roofs

Several studies on the use of energy for cooling buildings have shown that a building requires less thickness of thermal insulation on the roof if the external surfaces have high values of solar reflectance and infrared emissivity compared to low reflective-emissive roofs. One representative study consisted of experimental measurements on scale models of houses in Tucson, Arizona; this study showed that thermal insulation had a greater effect on the models’ cooling loads when their roofs had inadequately low solar reflectance [20]. These authors showed graphically that increasing the thermal resistance (R-value) from 0.53 to 3.52 m²·K/W can reduce heat transfer into the building by 170 kJ/day for models with a roof albedo of 0.2. The same increase of thermal resistance by insulation, applied to a model with a roof albedo of 0.8, reduces heat transfer by only about 40 kJ/day.
Other simulation studies that have analyzed various locations show that, in cities where cooling is much costlier than heating, thermal insulation can significantly reduce total energy consumption when roofs are highly absorbent to solar radiation [21]. These energy savings are considerably diminished when the roofs have an adequate, i.e., high, value of solar reflectance [22].
Gentle et al. (2011) [8] used EnergyPlus to study the combined effect of three factors on heat gains and losses through roofs: solar reflectance, infrared emissivity and thermal resistance. For their simulation, the authors used a simple building model with no windows and with high insulation in walls and floors, as well as the temperate climate parameters of Sydney, Australia. Their main conclusion is that, for houses with little roof insulation, the greatest energy savings come from reflective and emissive roofs. The authors mention that, from the economic viewpoint, it is preferable to combine high emissivity and high reflectance with low insulation, since a low R-value in the roof facilitates more efficient radiative cooling.

1.4. The State of Building Insulation and Previous Studies in Mexico

The Mexican government has developed some standards related to thermal envelope performance in buildings, including the NOM-008-ENER-2001 and NOM-020-ENER-2011 (NOM-020) building standards, which limit heat gains through the envelope of non-residential and residential buildings, respectively [23]. The recommended measures for reducing heat transfer during the summer include thermal insulation of walls and roofs, as well as shading of windows. NOM-020 was officially made mandatory at the federal level in 2011, but many logistical details are still missing for the standards to be implemented in practice [24]. Certified building standards inspectors must be trained and deployed in every municipality throughout the country, and municipalities must start requiring proof of compliance with NOM-020 before issuing new construction licenses.
A new non-mandatory standard for evaluating the solar reflective performance of roof coatings (PROY-NMX-U-125-SCFI-2015) is currently also under development [25].
In the Mexican regulations, climate zones are classified using degree-days. Degree-day is an important climatic design indicator that captures the extremity and duration of ambient temperature and is essentially the temperature difference between a single day’s mean temperature and a reference temperature [26,27]. The NMX-C-460-ONNCCE-2009 (NMX-C-460) uses a reference temperature of 10 °C for cooling degree-days (CDD10) and a reference temperature of 18 °C for heating degree-days (HDD18). The criteria used to define each climate zone are shown in Table 1.
Several works have studied the energy demands of space cooling and heating in low-income housing (i.e., affordable housing subsidized by the government; see Table 2). Almada-N. et al. (2011) [28] monitored eight low income single-family homes with an area of 38 m² in Mexicali, a city without space heating energy demand located in Climate Zone 2, and measured a total yearly electricity consumption ranging from 3835–7629 kWh/year. The monthly electrical consumption reported from appliances and lighting, excluding A/C equipment, is about 100 kWh. Thus, the annual energy consumption for space cooling per unit floor area can be estimated subtracting the annual consumption of appliances and lighting from total yearly consumption and then dividing by building area. By this calculation, in Mexicali, the energy consumption for space cooling was between 69 and 169 kWh/m².
Results of other dynamic simulation studies are shown in Table 2. These studies estimate three different values of space cooling and heating energy consumption in Hermosillo: 96 kWh/m² [29], 142 kWh/m² [30] and 549 kWh/m² [31] (per unit floor area of base case). For Mexico City, an energy consumption of 41 kWh/m² was estimated [32].
Heard et al. (2013) [32] performed a systemic analysis to determine the optimal values of thermal insulation (including roofs and walls) for Mexico City, reporting energy savings between 334 and 402 kWh/year. The greatest savings were calculated for Mexicali (1941–4181 kWh/year); while the cost-benefit analysis showed that the most favorable net impact of thermal insulation was for the cities of Mérida, Villahermosa, Monterrey and Nuevo Laredo.
Griego et al. (2012) [33] investigated the interactions between various energy efficiency measures for residential buildings in Salamanca, a city in central Mexico. The reference building had an area of 110 m². Although this article mentioned that homes in Salamanca do not have space cooling and heating equipment, the authors assumed that a large portion (50%) of new constructions will be air conditioned by 2030. According to these authors, most of the energy savings in new air-conditioned buildings come from reductions in space cooling energy usage due to thermal insulation and high-efficiency air conditioning equipment (seasonal energy efficiency ratio of 17 (SEER17)). The optimal combination of R-values for new residential building in Salamanca is 1.4 m²·K/W for roofs and 1 m²·K/W for walls.
Investing in better energy efficiency through insulation is a significant economic effort for a family that has purchased a home using a mortgage, as happens in most cases in Mexico. This is why it is important to explore the various options available to achieve an optimal use of thermal insulation for residential buildings.
The optimal use of thermal insulation in roofs and walls of a small single-family house was determined. In order to do this, three scenarios for insulation were considered: only the roof, only the vertical walls and both. This work compared the economic impact of these three scenarios for the climate conditions of six cities in Mexico. Results with both the official price of residential electricity available in each city (which is subsidized by the federal government) and the average real cost of producing this electricity were also compared. The economic analysis with subsidized prices directly affects the decisions of individual homeowners that purchase thermal insulation, especially in existing residential buildings. Calculations based on the real cost of electricity, in contrast, better illustrate the impact of insulation on the whole country.

2. Methods

In order to evaluate the performance of different insulation scenarios, a series of dynamic simulations were carried out in TRNSYS. The baseline model used is a small single-family home, representative of the sort that is commonly built as low-income housing in Mexico. The total energy that would be required for heating and air conditioning this building with a commercially available vapor-compression heater/cooler system (mini-split heat pump) was calculated. The annual energy savings for the three previously-mentioned insulation scenarios, integrated over the useful life of the building, were determined. The total net savings consisted of the present value of those annual savings minus the initial cost of the insulation. Weather parameters from six cities in Mexico were considered and include two with mostly cooling needs (Acapulco in Thermal Zone 1 and Hermosillo in Thermal Zone 2), two cities with mostly heating needs (Toluca and Pachuca, both in Thermal Zone 4) and two with a similar need for both (Chihuahua and Mexico City, both in Thermal Zone 3).

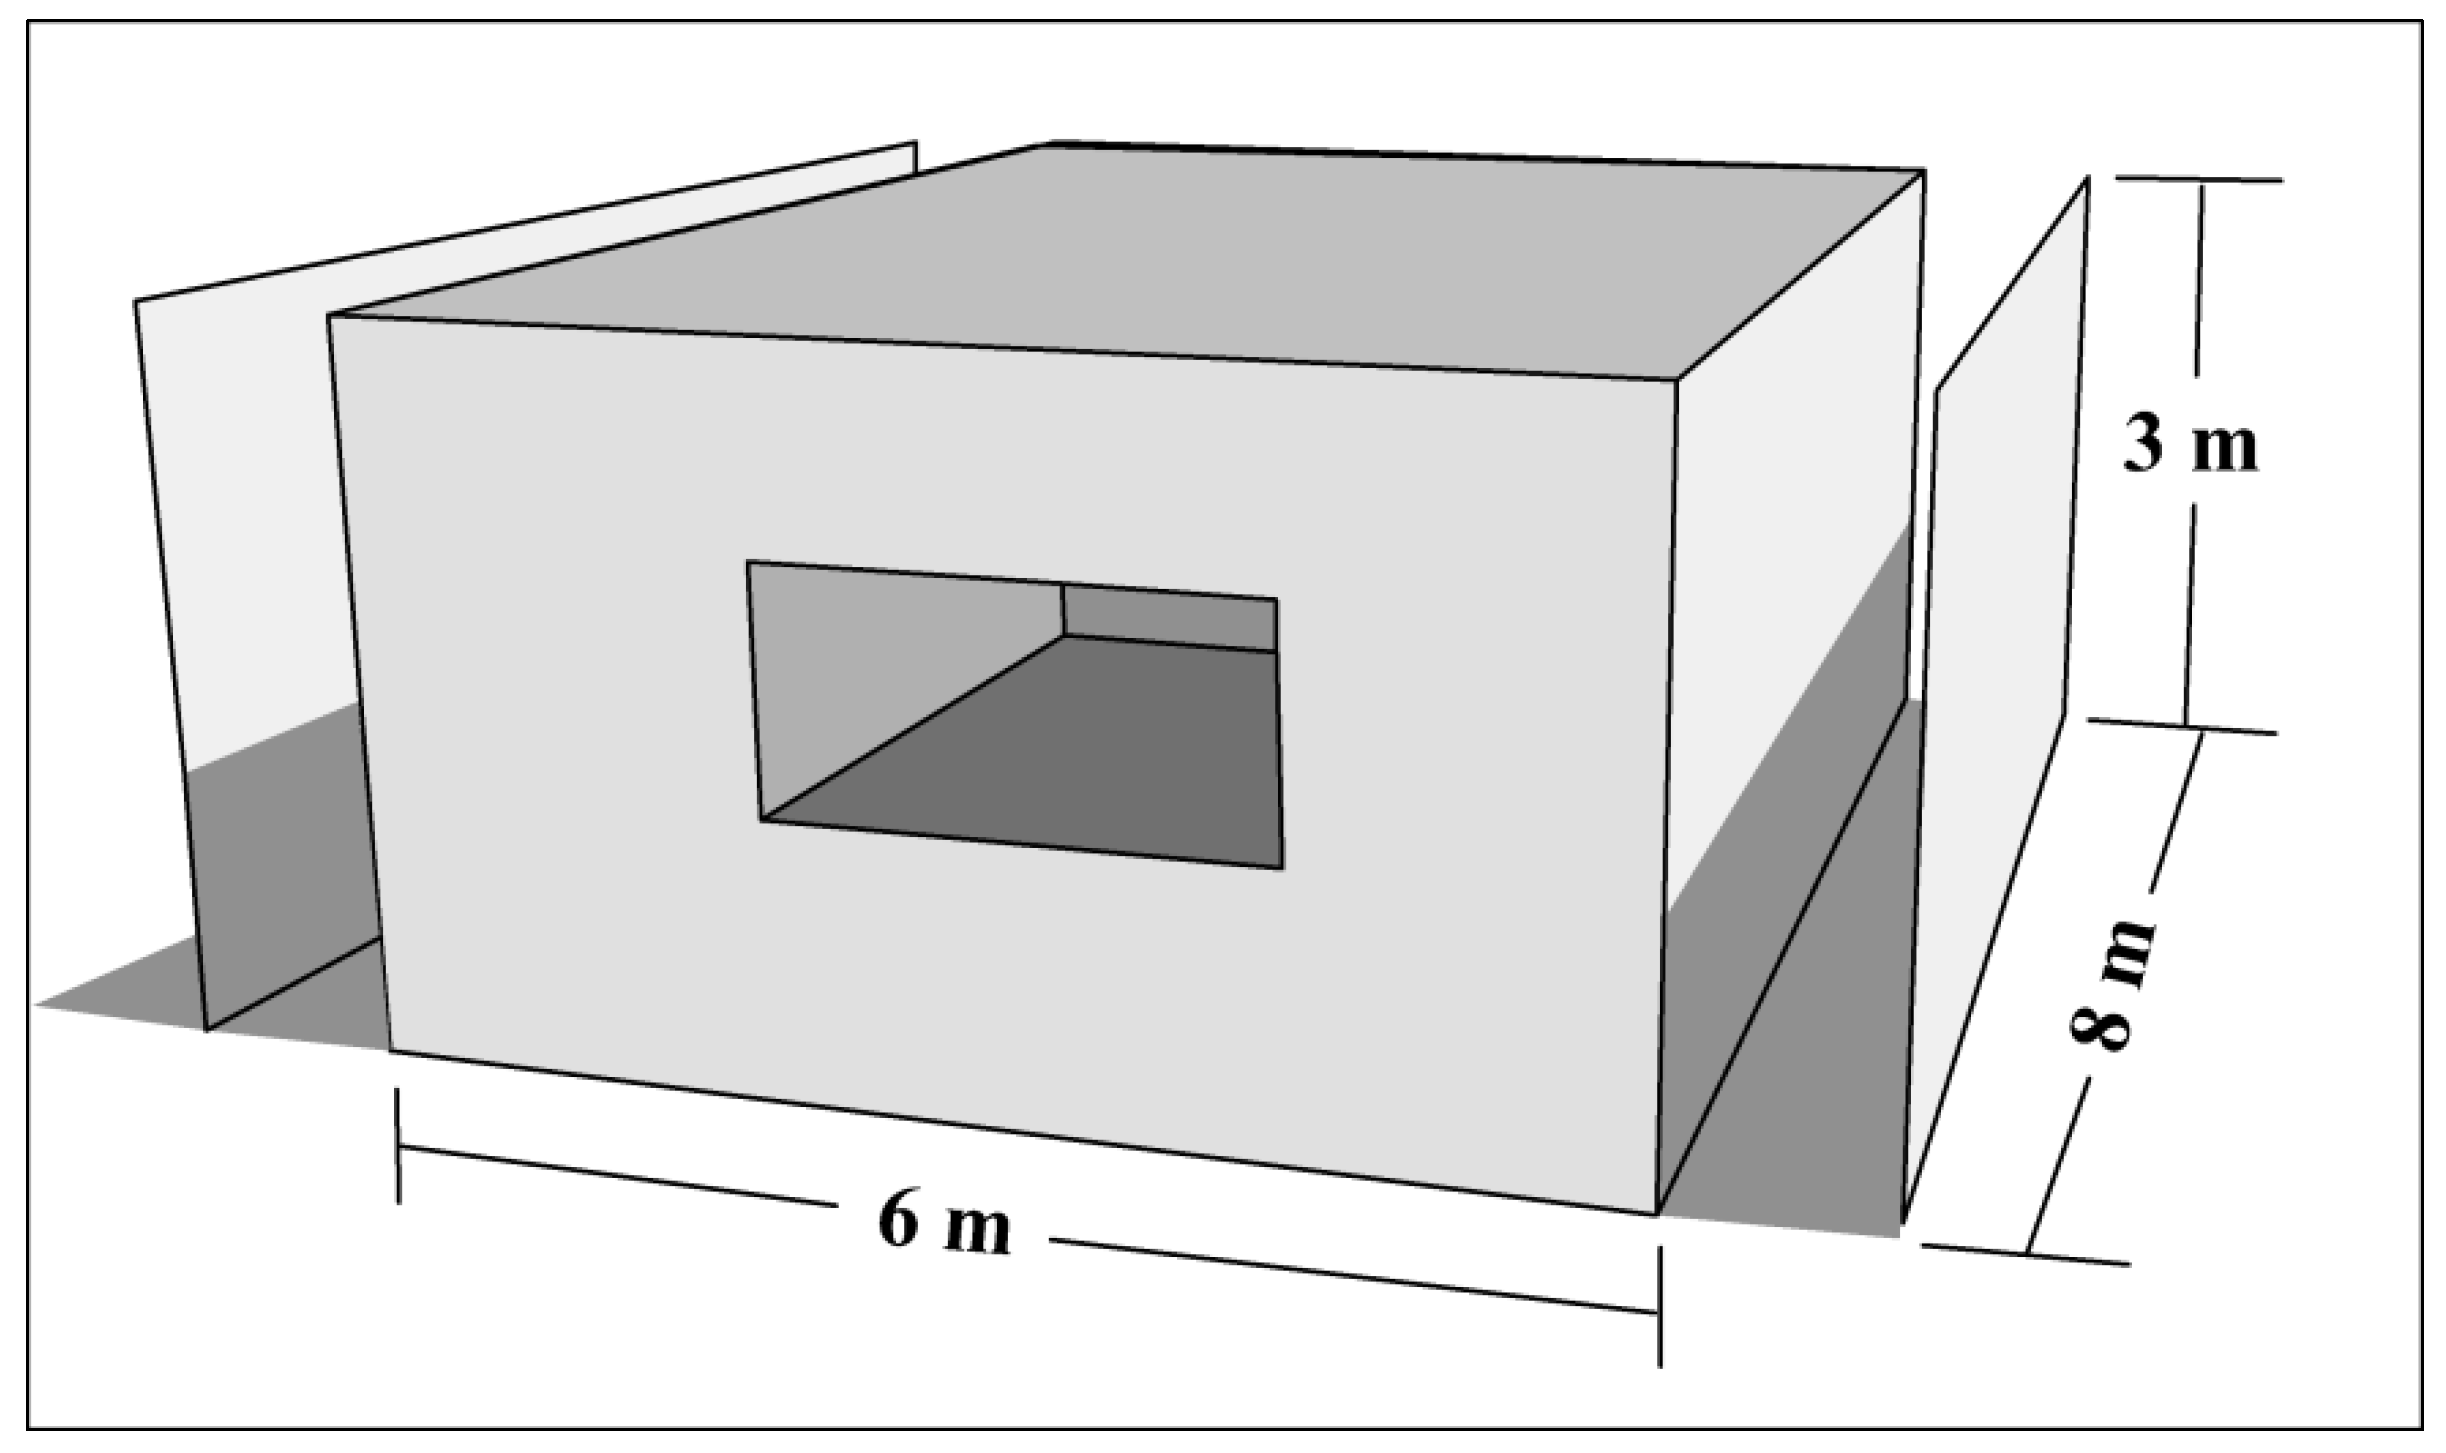
2.1. Description of the Base Case

The base (uninsulated) case for simulations was a single-family home with four vertical walls and two windows, with a floor area of 48 m². The walls are made of 15 cm-thick hollow cinder blocks, with plaster finish on the inside and mortar finish on the outside (the effective R-value of the whole wall was 0.248 m²·K/W). The roof comprised a 15-cm concrete slab with plaster finish on the inside and acrylic waterproofing on the outside (overall R-value of 0.152 m²·K/W). Single-pane windows represented 20% of the surface area in the walls that faced directly north and south, and we simulated the shade produced by neighboring houses. Figure 1 shows a diagram of this house and the outermost planes of the two neighboring houses (located to the east and west).
The vertical walls have a solar reflectance value of 0.7; for the roof, the values most appropriate for each city were defined according to the conclusions reported by Lucero-Alvarez et al. (2014) [22]: 0.1 for Toluca and Pachuca, 0.5 for Chihuahua and Mexico City and 0.9 for Acapulco and Hermosillo. For infrared emissivity, in all cases, a value of 0.9 was considered, because it is representative of the most common materials used in these buildings. These optimal thermo-optical values are presented in Table 3.
The model building simulated in TRNSYS includes the internal heat gains that would occur in the building from lighting, the use of electrical appliances and occupation by four people from 3:00 p.m–8:00 a.m. on weekdays, plus all day on weekends. We then calculated the electricity cost of using a mini-split heater/cooler, with an efficiency of SEER13 to keep the building between 19 °C and 26 °C for the whole year. Performance parameters based on units commercially available in Mexico were used for the simulations, and the capacity of the apparatus was selected based on a previous thermal simulation that estimated the heating and cooling loads required for each scenario. The material used for insulation was extruded polystyrene (XPS) with a thermal conductivity λ = 0.1008 kJ/(h·m·K), specific heat Cp = 1.47 kJ/(kg·K) and density ρ = 30 kg/m³. We tested 15 different arrangements of insulation: five different thicknesses (12, 25, 50, 75 and 100 mm of XPS) applied only to the roof (ROOF12, ROOF25…ROOF100), the same five thicknesses applied only to the walls (WALL12, WALL25...WALL100) and these same values applied to both (ALL12, ALL25...ALL100). Table 4 shows the R-values for roofs and walls in all of these cases.

2.2. Economic Analysis

Total cost savings were calculated using both the real cost of electricity and the official price for the residential sector, which is subsidized by the Mexican government. An electricity production cost of 0.1939 US$/kWh was used as the real cost; this number is based on an official government report from 2015 [34]. The values for the subsidized price of electricity come from federal government figures for each of the cities we studied [35,36]. In Mexico, there are seven different electricity price categories for residential use (1, 1A, 1B, 1C, 1D, 1E and 1F), each of which has three prices for different usage levels (basic, medium and excessive). The price category assigned to each city is based on the average minimum daily temperature during the summer. In this study, we used Price Category 1 for Mexico City, Pachuca and Toluca; 1B for Acapulco and Chihuahua, whose average minimum daily temperatures are between 25 °C and 28 °C; and 1F for Hermosillo, where the average minimum daily temperature during the summer is 33 °C.
Table 5 shows the structure of these price categories. For the Mexican pricing scheme and the economic analysis in this work, the summer categories only apply during the hottest 6 months of the year. The price of Category 1 is applied to all cities for the rest of the year, but monthly consumptions for every usage level may vary. Under this pricing scheme, the first kWh consumed each month fall under the ‘basic’ usage level, and they are the least expensive. Subsequent kWh then fill the next levels in turn, increasing the price more and more. Hermosillo also has an extra usage level (high medium) not found in other cities.
From our thermal simulation, we obtained the annual electricity consumption needed for space cooling (Ecool) and heating (Eheat) in all of the cases we studied. The annual energy cost was based on this consumption, using either the subsidized price of electricity (Ce, sub) as shown in Table 5 or the real cost of electrical production (Ce, prod).
C e , sub = E heat P non summer + E cool P summer
C e , prod = ( E heat   + E cool ) P prod
Psummer is the expected price in summer, calculated from the average monthly consumption during the summer and the corresponding summer electricity price scheme for each city. In order to determine this expected price, we added both the electrical consumption from the mini-split unit and an additional 100 kWh/month for appliances and lighting, estimated using data from Almada-N. et al. (2011) [28]. Pnon-summer is the average price given the expected heating costs and non-summer electricity prices. Pprod is the real, unsubsidized price of producing electricity. The annual electrical cost savings (Se) are the difference between the annual electricity cost in the base case (that is, without insulation, Ce, base) and the annual cost in each of the other cases (Ce, ins).
S e = C e , base C e , ins ,
The present value of the insulation was calculated by subtracting its installation cost from the present value of the energy savings that would accrue over the 30-year useful life of the house, assuming constant electricity prices and calculating the savings at the end of each year. The present value calculations are based on an interest rate of 6% and an inflation rate of 3%. The calculation of present worth factor is similar to that of Ozel (2011) [38].
PWF = ( ( 1 + r ) N 1 ) / ( r ( 1 + r ) N ) , { r = ( i g ) / ( 1 + g ) }
PWF = present worth factor, r = effective rate, i = interest rate, g = inflation rate and N = periods (in this case, 30 years).
The total initial cost of insulation (Cins) was determined by adding the cost of the insulation material itself (Cmat, corresponding to 254.40 US$/m³), times the thickness (L) in meters, plus an installation cost (Cinst) of $20.80 US$/m². We considered a total insulated surface area (Ains) of 48 m² for the roof and 77.76 m² for the walls (we did not consider the surface area of the windows).
C ins = A ins ( C mat L + C inst )
The net present savings (NPS) were defined as the net present value of all of the yearly savings, minus the initial investment in the insulation.
NPS = S e PWF C ins

3. Results

3.1. Energy Savings

Figure 2 shows the energy consumption of the house in our base case; the various cities we studied varied significantly in their relative use of heating and cooling. Annual energy consumption per unit of surface area came to 117 kWh/m² for Hermosillo; this value falls between those reported previously by Calderón et al. (2011) [29] and Campos (2011) [30]. For Mexico City, we calculated 33 kWh/m², which is 8 kWh/m² less than was reported by Heard et al. (2011) [32] (see Table 2). Table 6 shows the annual energy consumption for space cooling and heating per unit floor area for each combination of insulation and each city.
Figure 3 shows the energy savings accrued for each combination of insulation; they are the result of subtracting the overall consumption from the base case. In most cases, increasing the thickness of insulation also increased energy savings. Mexico City and Pachuca were the only cases where energy savings actually decreased slightly with insulation above 25 mm and 50 mm, respectively, for the cases with insulated walls and walls plus roof. Excluding fully-insulated cases (insulation in walls plus roof, here labeled “ALL”), in Acapulco, Hermosillo and Toluca, the greatest savings came from insulating the walls; in Mexico City and Pachuca, from insulating the roof; in Chihuahua, both strategies were comparable.
Including “ALL” cases, the energy savings for Chihuahua, Hermosillo and Toluca ranged between 600 and 3000 kWh/year. For Acapulco, Mexico City and Pachuca, savings were between 100 and 1500 kWh/year.

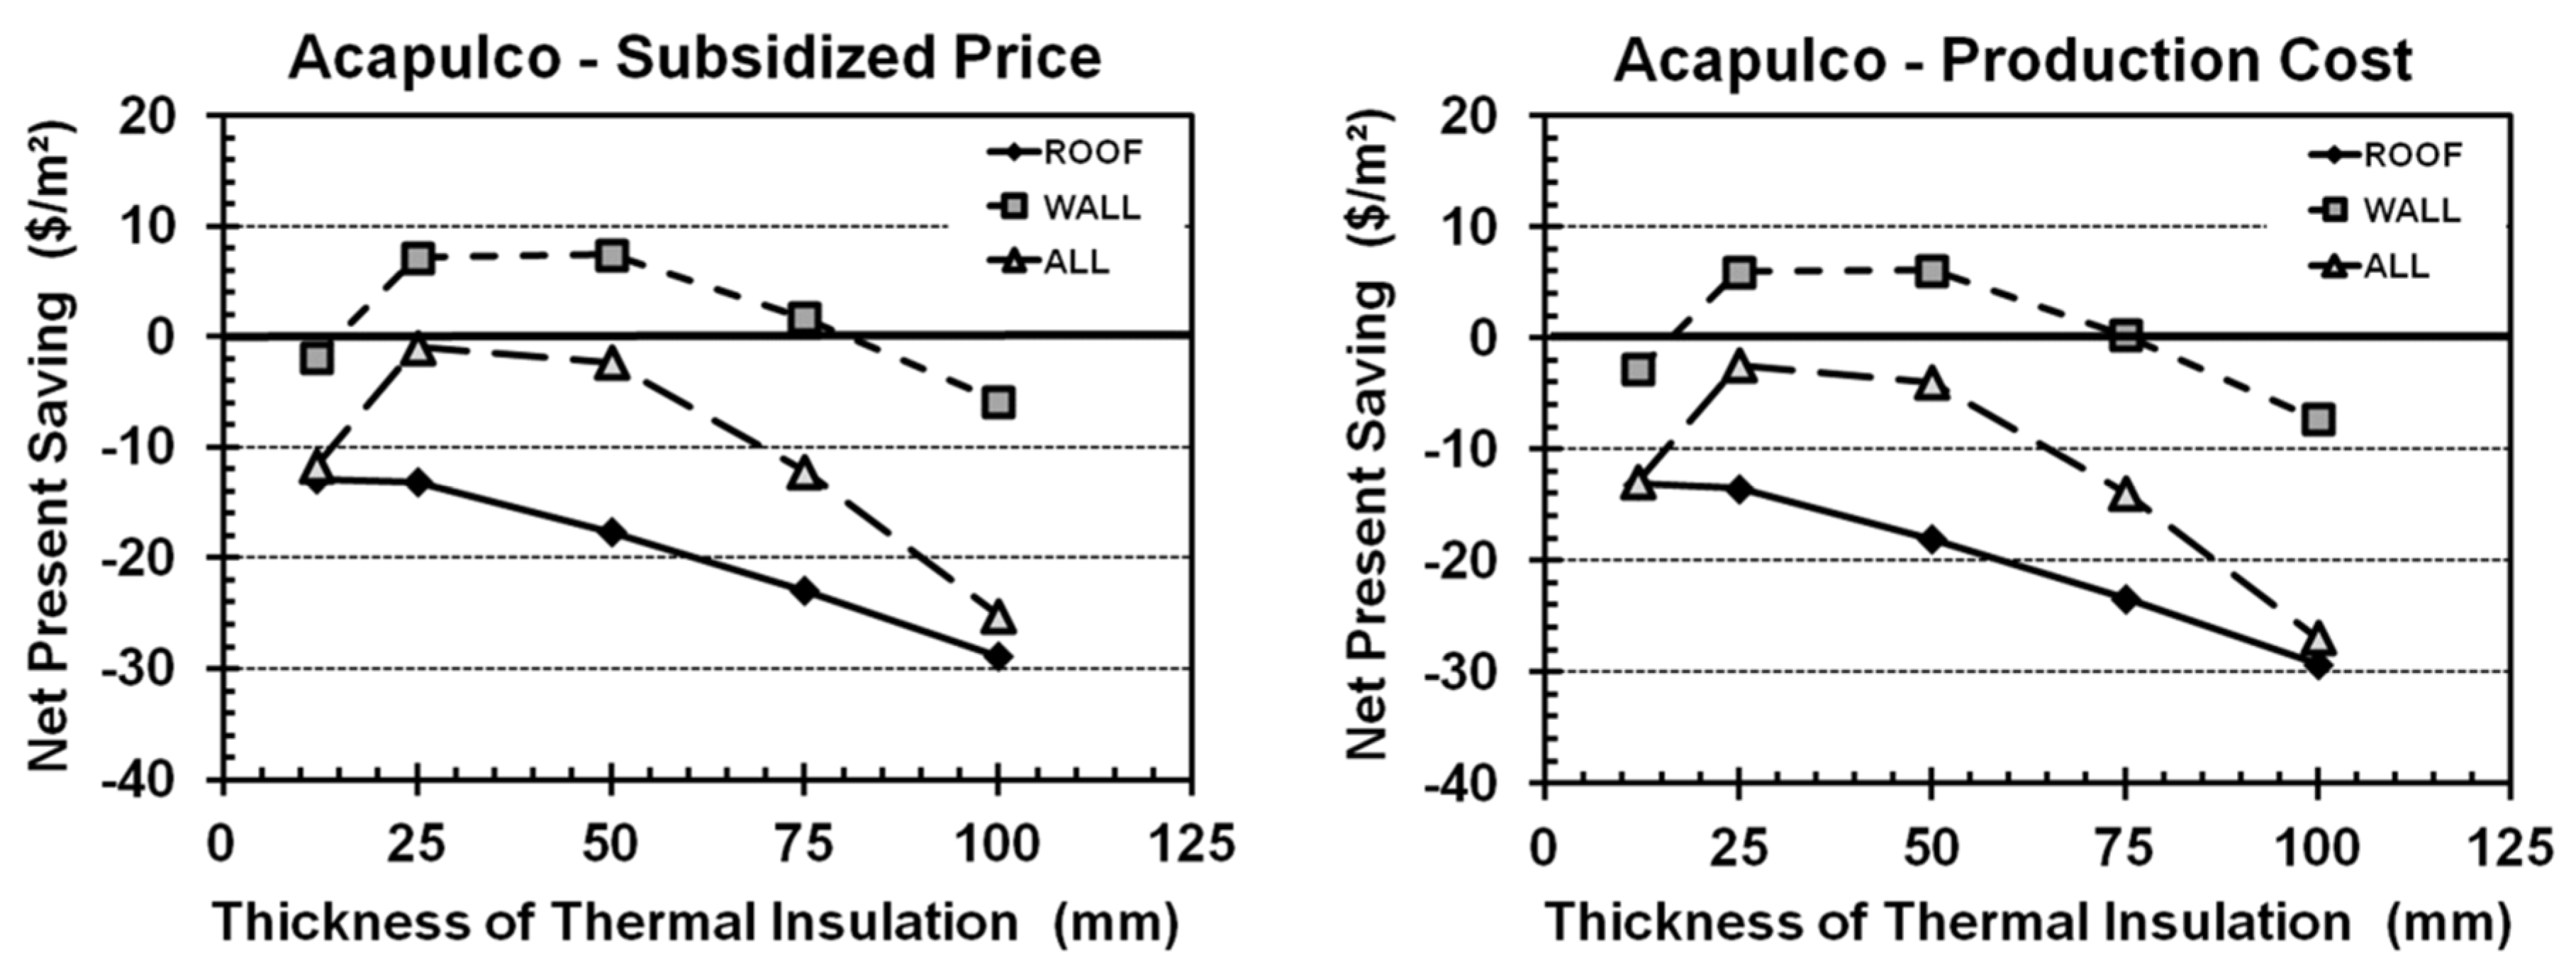
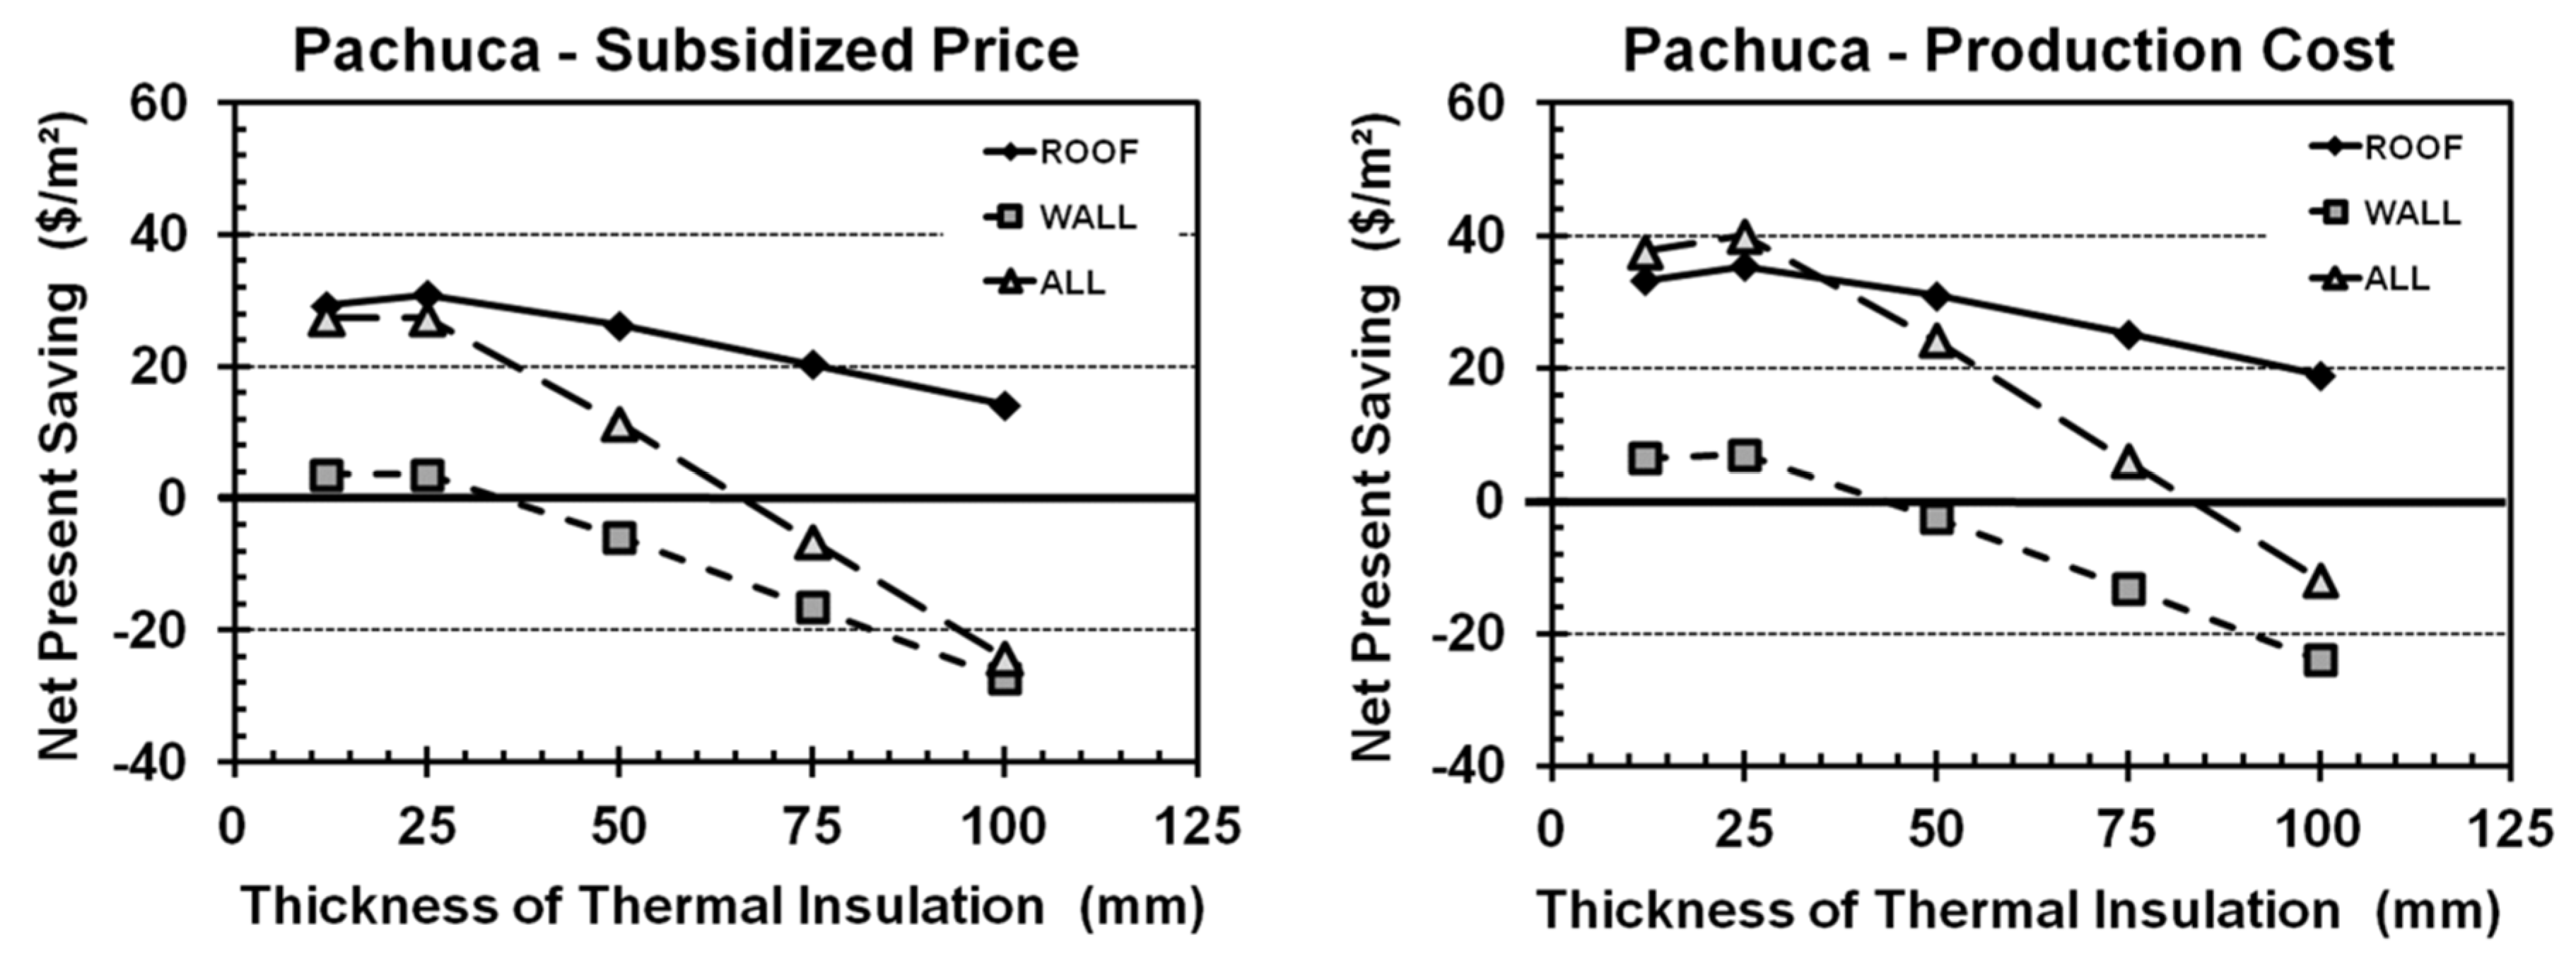
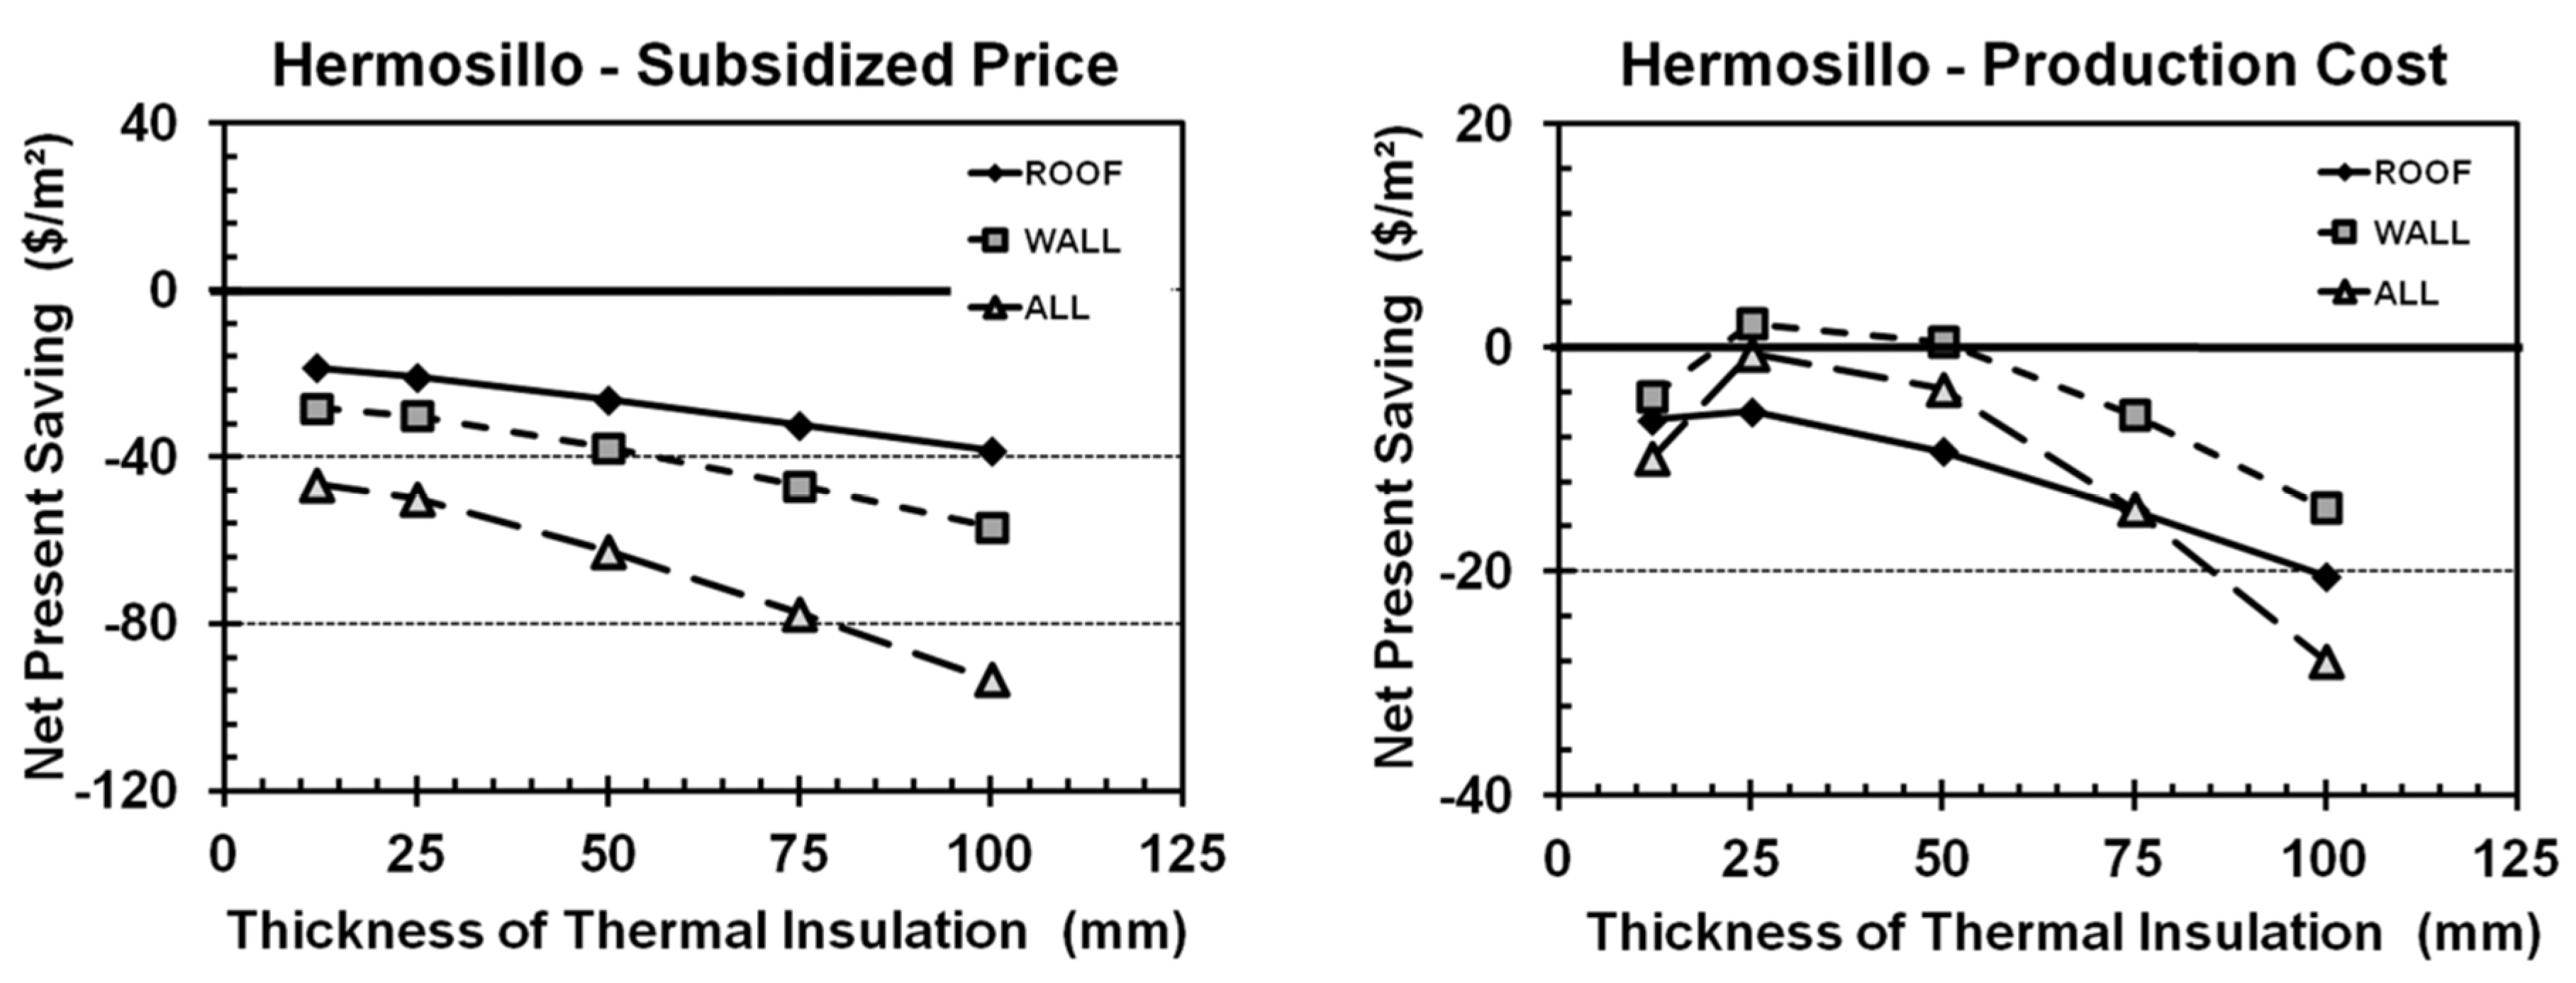
3.2. Cost-Benefit Analysis

Given the multi-tiered pricing scheme for electricity in Mexico, the reductions in monthly consumption made possible by insulation also affect the average price that consumers pay for electricity. That is, insulation both reduces the overall electricity needed by the users and also allows them to purchase less expensive electricity at lower usage levels. Table 7 shows the average electricity prices paid by users for each amount of insulation, as well as the upfront cost of that insulation and, at the bottom of the table, the difference between the highest and lowest prices accessible through different levels of insulation. Average prices in Acapulco and Chihuahua were particularly high because high A/C usage forces consumers to go well into the “excess” electricity usage level. Monthly usage in Hermosillo, in contrast, fell entirely within the “basic” level. This city had the lowest average electricity price, as well as the lowest variation in price caused by different thermal insulation levels.
Figure 4, Figure 5, Figure 6, Figure 7, Figure 8 and Figure 9 present the net savings for each city, comparing the present value of capital costs and energy savings and considering both the subsidized price and the real cost of electricity. Acapulco (Figure 4) shows how, in extremely warm climates without heating needs, the best option is to insulate the walls (WALL25; these results are similar for both the subsidized and real cost of electricity). We observe this phenomenon because a highly emissive, uninsulated roof allows the building to transfer the most heat to the atmosphere through infrared radiation. If that roof is also reflective, nighttime passive cooling through the roof is large enough to offset unwanted heating during the day. Roof insulation is thus counterproductive in this climate, as reflected in the graph and previously reported by Gentle et al. (2011) [8].
In the city of Hermosillo (Figure 5), the heavy government subsidy on the price of electricity makes it highly counterproductive for users to install insulation in their houses, despite the fact that the city would experience substantial savings in the real cost of energy (based on production cost). The most economically-optimal case in our simulation, 50 mm in walls and roofs (ALL50), had a net present value of 80 US$/m2 when we considered the real cost of electricity ($3780 US$/year for the whole building). This present value dropped to negative 38 US$/m2 under the subsidized price. Negative net present savings for all insulated cases imply that it is not feasible to use thermal insulation. In this situation, the sum of annual energy cost savings during the lifecycle period is not enough to compensate for the investment made to install the insulation.
We found the greatest net present values for insulation in the cities of Chihuahua and Toluca (Figure 6 and Figure 9), where both walls and roofs should be insulated (ALL50 and ALL25, respectively). Both cities have a high energy cost during the cold months, showing how insulation is most effective in winter.
Mexico City (Figure 7) has a low overall heating and cooling cost and, therefore, low savings; insulation was only cost-effective on the roof (ROOF25). In Pachuca (Figure 8), it is optimal to insulate the roof (ROOF25) given the subsidy; given the real price, the optimal solution is to insulate roof and walls (ALL25), but the walls have a minor contribution.
According to NOM-020, air conditioning of residential buildings in Mexico greatly affects peak demand on the electrical system. The highest impact occurs in coastal areas, where cooling is more common than heating, and in the northern states, where both cooling and heating are commonly used even in low-income households. Air conditioning and heating systems are less common in the cities of central Mexico, such as Salamanca [33] and Toluca [39].
A study linking temperature, income and air conditioning in Mexico predicts market saturation of air conditioning in all warm climate cities within just a few decades. Increasing temperatures, growing income and falling equipment prices all contribute to an accelerated adoption of air conditioning. Conversely, a more modest scenario is predicted for the future adoption of heating equipment [40].
Of the six cities considered in this work, the results for Acapulco, Hermosillo and Chihuahua have the greatest relevance; since these are the cities with the current largest use of cooling equipment (and heating systems also, in the case of Chihuahua).
Based on calculations of this work, the energy demand for heating in Hermosillo is above 1000 kWh/year; this energy is necessary to maintain the indoor temperature of homes above 19 °C. Climate conditions in Hermosillo, however, are not as extreme as those in Chihuahua. The average of “extreme minimum temperature” for the coldest month in Hermosillo is −1.2 °C; in Chihuahua, that average is −10 °C [41]. Unlike in Chihuahua, thus, space-heating equipment is not common in Hermosillo. Figure 10 shows an economic analysis that omits the cost of heating; this analysis differs from that shown in Figure 5. If only cooling energy is considered, the optimum scenario of thermal insulation for Hermosillo is similar to that for Acapulco: insulated walls with a highly reflective un-insulated roof. The use of insulation in Hermosillo is only feasible in the absence of electrical subsidies.
The NOM-020 standard does not specify a particular R-value for roof and walls. It focuses on comparing the heat gains of a reference building and any planned building. The methodology calls for a calculation of heat flow through the building envelope in a one-dimensional steady state. The acceptability criterion is that the heat gain in the planned building must be less than the heat gain in the reference building. Thermal conductance data for the walls and roof of the reference building, as well as the temperatures necessary for heat flow calculation are included for some cities in the annex of this standard.
The NMX-C-460 standard suggests specifications for R-values, in three categories, that apply to the building envelope in order to improve the buildings’ habitability and decrease their energy demand for interior air conditioning. The NMX-C-460 standard is non-mandatory, in contrast with the NOM-020.
Table 8 compares the R-values for walls and roofs between several benchmarks: the reference building from NOM-020, the “Minimum” and “Energy Saving” categories suggested by NMX-C-460 and the optimal insulation scenario considered in this work.
The R-values of Mexican standards are directly related to the need for additional thermal insulation in residential buildings built with the most widespread construction materials. Furthermore, there is relative agreement in R-values between the minimums suggested by NOM-C-460, the reference building of NOM-020 and the optimal cases of this work for Mexico City, Pachuca and Toluca.
The optimal R-values calculated in this work differ from the existing standards in a few cases. For Acapulco and Hermosillo, cities with very high energy requirements for space cooling, the R-values in the standards appear to be an overestimate. For Chihuahua, these values are underestimated.
The present work recommends greater insulation in colder cities. This is in agreement with NMX-C-460, which recommends the highest R-values for Climate Zones 3 and 4, but in contrast to NOM-020's recommendation that high R-value be used in Climate Zones 1 and 2. Furthermore, this work disagrees with NMX-460’s recommendation that roofs be more insulated than walls in the warm Climate Zones 1 and 2. The results presented for Acapulco in Figure 3 and Figure 4 and for Hermosillo in Figure 10 suggest that the optimal combination in warm climates is insulated walls with un-insulated, reflective roofs.

4. Conclusions

This study presents performance simulations of three different scenarios for insulating the walls and roof of a small single-family house, under the climate conditions of six cities in Mexico with very different heating and cooling requirements. The results show that insulating the entire opaque exterior of the house, including walls and roof, is economically viable for cities with cold winters and significant heating requirements, such as the cities of Chihuahua and Toluca. These cities show the greatest potential for thermal insulation, with net present savings of $127.7/m² for Chihuahua and $88.9/m² for Toluca (calculated using subsidized electricity prices).
For cities in temperate climates with relatively low requirements for heating and cooling, such as Mexico City and Pachuca, it is best to insulate only the roof. The net present savings for the optimal case in these cities are $7.6/m² and $30.9/m², respectively.
The city of Hermosillo presents a somewhat distorted case. It has very high need for cooling and some weak need for heating, and the use of insulation results in very substantial economic savings if one considers the real cost of electricity. A very high federal subsidy on the price of electricity, however, makes the use of insulation economically counterproductive (with negative net present savings in all cases). The economic analysis could skew more favorably towards insulation for buildings with a higher energy demand, where the price of electricity reaches the “excess” level and the effect of subsidies would be less pronounced. If one ignores the energy cost for heating in Hermosillo, net present savings are positive only for combinations of 25-mm insulation on walls and highly reflective, un-insulated roofs.
The most novel results were found for cities with high cooling requirements without heating demands, such as Acapulco (and Hermosillo, if one ignores heating costs). In these places, it is best to insulate the walls and to have uninsulated roofs with high solar reflectance and infrared emissivity. This insulation combination is not a widespread practice in Mexico. Future work, particularly experimental work, should focus on validating these results in order to improve governmental strategies towards more efficient energy use in buildings.
This work shows that Mexican standards for the thermal properties of buildings, which are based on steady-state calculations, are appropriated for climate zones with high heating energy demands. For climate zones where the energy requirements for cooling are more significant than those for heating, this methodology should be reviewed to include such properties as the solar reflectance and infrared emissivity of exterior surfaces. Ultimately, the use of experimental and simulation-based studies that include transient state calculations would provide an even more accurate basis for future energy efficiency standards.

Acknowledgments

This work is part of a research project related to the simulation and testing of surface coatings for roofs. We thank Grupo Comex funding this research project. The authors also acknowledge the financial support from Centro Mexicano de Inovación en Energía Solar (CeMIE-Sol) Project P13: “Test laboratories for low and medium temperatures; laboratory for the computer-aided design and integration of thermal solar systems” (CONACYT-Secretaría de Energía Convocation on Energy Sustainability 2013: 02). The authors also thank Daniel A. Martin-Alarcon for help with translation and editing.

Author Contributions

Jorge Lucero-Álvarez gave the research idea and conceived the framework; Jorge Lucero-Álvarez and Ignacio R. Martín-Domínguez wrote the paper; Norma A. Rodríguez-Muñoz and Ignacio R. Martín-Domínguez provided extensive advices about the methodological approach and revised the manuscript.

Conflicts of Interest

The authors declare no conflict of interest. The founding sponsors had no role in the design of the study; in the collection, analyses or interpretation of data; in the writing of the manuscript; nor in the decision to publish the results.

Abbreviations

The following abbreviations are used in this manuscript:
Ains
Total insulated surface area
CDD
Cooling degree-days
Ce, base
Electricity cost in the base case
Ce, ins
Electricity cost in the case with thermal insulation
Ce, prod
Energy cost based on the cost of electrical production
Ce, sub
Energy cost based on subsidized price of electricity
Cins
Total initial cost of insulation
Cinst
Cost of installing thermal insulation
Cmat
Cost of the insulating material
Ecool
Electricity consumption for space cooling
Eheat
Electricity consumption for space heating
HDD
Heating degree-days
L
Thickness of thermal insulation
NPS
Net present saving
NMX (Norma Mexicana)
non-mandatory federal standard
NOM (Norma Oficial Mexicana)
mandatory federal standard
NMX-C-460 (NMX-C-460-ONNCCE-2009)
non-mandatory building standard
NOM-020 (NOM-020-ENER-2011)
mandatory building standard
Pnon-summer
Expected price for the non-summer period
Pprod
Price based on electricity cost production
Psummer
Expected price for the summer period
PWF
Present worth factor
Se
Annual electrical cost savings

References

  1. United State Departament of Energy. 2011 Buildings Energy Data Book. Available online: http://buildingsdatabook.eren.doe.gov/docs/DataBooks/2011_BEDB.pdf (accesed on 9 May 2016).
  2. Europa Union. EU Energy in Figures Statistical Pocketbook 2015. Available online: https://ec.europa.eu/energy/en/statistics/energy-statistical-pocketbook (accesed on 9 May 2016).
  3. Secretaria de energía. Balance Nacional de Energía 2014. Available online: http://www.gob.mx/cms/uploads/attachment/file/44353/Balance_Nacional_de_Energ_a_2014.pdf (accessed on 22 February 2016).
  4. Oropeza-Perez, I.; Ostergaard, P.A. Energy saving potential of utilizing natural ventilation under warm conditions—A case study of Mexico. Appl. Energy 2014, 130, 20–32. [Google Scholar] [CrossRef]
  5. Rosas-Flores, J.A.; Rosas-Flores, D.; Gálvez, D.M. Saturation, energy consumption, CO2 emission and energy efficiency from urban and rural households appliances in Mexico. Energy Build. 2011, 43, 10–18. [Google Scholar] [CrossRef]
  6. Akbari, H.; Konopacki, S.; Pomerantz, M. Cooling energy savings potential of reflective roofs for residential and commercial buildings in the United States. Energy 1999, 24, 391–407. [Google Scholar] [CrossRef]
  7. Bolattürk, A. Optimum insulation thicknesses for building walls with respect to cooling and heating degree-hours in the warmest zone of Turkey. Build. Environ. 2008, 43, 1055–1064. [Google Scholar] [CrossRef]
  8. Gentle, A.R.; Aguilar, J.L.C.; Smith, G.B. Optimized cool roofs: Integrating albedo and thermal emittance with R-value. Sol. Energy Mater. Sol. Cells 2011, 95, 3207–3215. [Google Scholar] [CrossRef]
  9. Shi, Z.; Zhang, X. Analyzing the effect of the longwave emissivity and solar reflectance of building envelopes on energy-saving in buildings in various climates. Sol. Energy 2011, 85, 28–37. [Google Scholar] [CrossRef]
  10. Kaynakli, O. A review of the economical and optimum thermal insulation thickness for building applications. Renew. Sustain. Energy Rev. 2012, 16, 415–425. [Google Scholar] [CrossRef]
  11. Rodríguez-Soria, B.; Domínguez-Hernández, J.; Pérez-Bella, J.M.; del Coz-Díaz, J.J. Review of international regulations governing the thermal insulation requirements of residential buildings and the harmonization of envelope energy loss. Renew. Sustain. Energy Rev. 2014, 34, 78–90. [Google Scholar] [CrossRef]
  12. Akbari, H.; Levinson, R. Evolution of cool-roof standards in the US. Adv. Build. Energy Res. 2008, 2, 1–32. [Google Scholar] [CrossRef]
  13. Akbari, H.; Matthews, H.D. Global cooling updates: Reflective roofs and pavements. Energy Build. 2012, 55, 2–6. [Google Scholar] [CrossRef]
  14. Nowak, H. The longwave radiative heat transfer of the building envelopes. Infrared Phys. 1991, 32, 357–363. [Google Scholar] [CrossRef]
  15. Chwieduk, D.A. Recommendation on modelling of solar energy incident on a building envelope. Renew. Energy 2009, 34, 736–741. [Google Scholar] [CrossRef]
  16. Kaşka, Ö.; Yumrutaş, R. Experimental investigation for total equivalent temperature difference (TETD) values of building walls and flat roofs. Energy Convers. Manag. 2009, 50, 2818–2825. [Google Scholar] [CrossRef]
  17. Emmel, M.G.; Abadie, M.O.; Mendes, N. New external convective heat transfer coefficient correlations for isolated low-rise buildings. Energy Build. 2007, 39, 335–342. [Google Scholar] [CrossRef]
  18. Palyvos, J. A. A survey of wind convection coefficient correlations for building envelope energy systems’ modeling. Appl. Therm. Eng. 2008, 28, 801–808. [Google Scholar] [CrossRef]
  19. Sisman, N.; Kahya, E.; Aras, N.; Aras, H. Determination of optimum insulation thicknesses of the external walls and roof (ceiling) for Turkey’s different degree-day regions. Energy Policy 2007, 35, 5151–5155. [Google Scholar] [CrossRef]
  20. Simpson, J.R.; McPherson, E.G. The effects of roof albedo modification on cooling loads of scale model residences in Tucson, Arizona. Energy Build. 1997, 25, 127–137. [Google Scholar] [CrossRef]
  21. Synnefa, A.; Santamouris, M.; Akbari, H. Estimating the effect of using cool coatings on energy loads and thermal comfort in residential buildings in various climatic conditions. Energy Build. 2007, 39, 1167–1174. [Google Scholar] [CrossRef]
  22. Lucero-Álvarez, J.; Alarcón-Herrera, M.T.; Martin-Domínguez, I.R. The effect of solar reflectance, infrared emissivity, and thermal insulation of roofs on the annual thermal load of single-family households in México. In Proccedings of the EuroSun, Aix-Les-Bains, France, 16–19 September 2014.
  23. Griego, D.; Krarti, M.; Hernandez-Guerrero, A. Energy efficiency optimization of new and existing office buildings in Guanajuato, Mexico. Sustain. Cities Soc. 2015, 17, 132–140. [Google Scholar] [CrossRef]
  24. Álvarez-García, G.S.; Shah, B.; Rubin, F.; Gilbert, H.; Martin-Domínguez, I.R.; Shickman, K. Evaluación del impacto del uso de “Cool Roof” en el ahorro de energía en edificaciones no-residenciales y residencial en México. Available online: http://www.cleanenergyministerial.org/Portals/2/pdfs/GSEP-CoolRoofs-InformeCoolRoofsCONUEE-Mayo-22-2014-Espanol.pdf (accessed on 18 February 2016). (In Spanish)
  25. Méndez-Florián, F.; Velasco-Sodi, P.; Gabilondo, A.I.; Galindo, R.; López-Silva, M. Estrategia Nacional para la vivienda sustentable. Available online: http://fundacionidea.org.mx/assets/files/F.IDEA_Estrategia%20vivienda%20sustentable%20_130311_FINAL.pdf (accessed on 19 May 2016). (In Spanish)
  26. Day, T. Degree-Days: Theory and Application; Chartered Institution of Building Services Engineers (CIBSE): London, UK, 2006. [Google Scholar]
  27. De Rosa, M.; Bianco, V.; Scarpa, F.; Tagliafico, L.A. Heating and cooling building energy demand evaluation, a simplified model and a modified degree days approach. Appl. Energy 2014, 128, 217–229. [Google Scholar] [CrossRef]
  28. Almada-N., D.V.; Yeomans-R., F.S.; Nungaray Perez, C.E.; Hernandez Cordova, V.G. Monitoreo de Viviendas con Criterios de Ahorro Energético. In Ninth LACCEI Latin American and Caribbean Conference (LACCEI’2011), Engineering for a Smart Planet, Innovation, Information Technology and Computational Tools for Sustainable Development, Medellín, DC, USA, 3–5 August 2011. (In Spanish)
  29. Calderón, R.; Arredondo, J.A.; Gallegos, R.; Mayagoitia, F. Reducción del Consumo Eléctrico y CO2 mediante Sistemas de Ahorro y de Aislamiento Térmico aplicados a Viviendas en Zonas Áridas de México. Inform. Tec. 2011, 22, 69–78. (In Spanish) [Google Scholar]
  30. Campos, A.L. Estudio de optimización de la eficiencia energética en viviendas de interés social. Programa de Energía Sustentable en México, componente edificación, GIZ. Available online: http://idbdocs.iadb.org/wsdocs/getdocument.aspx?docnum=36288713 (accessed on 20 August 2015). (In Spanish).
  31. Solís, D. Análisis térmico de una vivienda económica en clima cálido-seco bajo diferentes orientaciones y medidas de sombreado. Estud. sobre Arquit. y Urban. del Des. 2010, 3, 31–57. (In Spanish) [Google Scholar]
  32. Heard, Ch.L.; Olivera-Villarroel, S.M. Evaluación económica de la resistencia térmica de la vivienda de interés social en las ciudades tropicales de México. Acta Univ. UGt. 2013, 23, 17–29. (In Spanish) [Google Scholar]
  33. Griego, D.; Krarti, M.; Hernandez-Guerrero, A. Optimization of energy efficiency and thermal comfort measures for residential buildings in Salamanca, Mexico. Energy Build. 2012, 54, 540–549. [Google Scholar] [CrossRef]
  34. Gobierno de los Estados Unidos Mexicanos. Anexo Estadístico del Tercer Informe de Gobierno 2014–2015. Available online: http://www.presidencia.gob.mx/tercerinforme/ (accessed on 21 January 2016). (In Spanish)
  35. Secretaria de Hacienda y Crédito Público (SHCP). Acuerdo 15/2014: Acuerdo por el que se establecen las tarifas finales de energía eléctrica del suministro básico a usuarios domésticos. Available online: http://www.dof.gob.mx/nota_detalle.php?codigo=5377946&fecha=01/01/2015 (accessed on 21 January 2016). (In Spanish)
  36. Secretaria de Hacienda y Crédito Público (SHCP). Acuerdo 27/2015: Acuerdo por el que se autoriza ajustar tarifas finales de energía eléctrica del suministro básico a usuarios domésticos. Available online: http://www.dof.gob.mx/nota_detalle.php?codigo=5421731&fecha=30/12/2015 (accessed on 21 January 2016). (In Spanish)
  37. Banco de México. Tipos de cambio y resultados históricos de las subastas. Available online: http://www.banxico.org.mx/SieInternet/consultarDirectorioInternetAction.do?accion=consultarCuadro&idCuadro=CF86&sector=6&locale=es (accessed on 24 February 2016). (In Spanish)
  38. Ozel, M. Effect of wall orientation on the optimum insulation thickness by using a dynamic method. Appl. Energy 2011, 88, 2429–2435. [Google Scholar] [CrossRef]
  39. Santin, O.G. Environmental Indicator for Building Design: Development and applications on Mexican Dwellings; IOS Press: Nieuwe Hemweg, Netherlands, 2008. [Google Scholar]
  40. Davis, L.W.; Gertler, P.J. Contribution or air conditioning adoption to future energy use under global warming. Proc. Nati. Acad. Sci. 2015, 112, 5962–5967. [Google Scholar] [CrossRef] [PubMed]
  41. Sistema Meteorológico Nacional. Normales climatológicas 1981–2000. Available online: http://smn.cna.gob.mx/es/component/content/article?id=42 (accessed 15 June 2016). (In Spanish)
Figure 1. Base case for our simulations of a single-family household.
Sustainability 08 00590 g001
Figure 2. Annual electricity consumption for space cooling and heating in the base case.
Sustainability 08 00590 g002
Figure 3. Annual energy savings from thermal insulation in various cities (note that the y-axes are scaled differently for each city).
Sustainability 08 00590 g003
Figure 4. Net present savings (NPS) for Acapulco, calculated with (left) and without (right) electrical subsidies.
Sustainability 08 00590 g004
Figure 5. Net present savings (NPS) for Hermosillo, calculated with (left) and without (right) electrical subsidies.
Sustainability 08 00590 g005
Figure 6. Net present savings (NPS) for Chihuahua, calculated with (left) and without (right) electrical subsidies.
Sustainability 08 00590 g006
Figure 7. Net present savings (NPS) for Mexico City, calculated with (left) and without (right) electrical subsidies.
Sustainability 08 00590 g007
Figure 8. Net present savings (NPS) for Pachuca, calculated with (left) and without (right) electrical subsidies.
Sustainability 08 00590 g008
Figure 9. Net present savings (NPS) for Toluca, calculated with (left) and without (right) electrical subsidies.
Sustainability 08 00590 g009
Figure 10. Net present savings (NPS) for Hermosillo considering only energy consumption for space cooling, calculated with (left) and without (right) electrical subsidies.
Sustainability 08 00590 g010
Table 1. Criteria for defining thermal zones in Mexico.
Climate ZonesCooling Degree-Days per Year (CDD10)Heating Degree‑Days per Year (HDD18)Type of Region
1>5000 Low elevation, tropical and arid-warm
23500–5000 Sub-tropical and arid-dry
3 12500–3500<3000Mexican Plateau, semi-arid and temperate
4 1<2500>2000Semi-arid and temperate, cold winters
1 Climate Zones 3 and 4 are subdivided into three categories (A, B and C), according to the average annual precipitation.
Table 2. Summary of previous works related to comparative annual energy consumption in Mexican households.
ReferenceMethodBuilding AreaComparisonResults by City 1 (kWh/year)
Almada-N. et al., 2011 * [28]Power consumption monitoring38.4 m²Base case vs. thermal insulation on roof, efficient A/C equipment and illumination. Annual power consumption (A/C equipment + illumination + appliances)Base case: Mexicali 6044.
With thermally-insulated roof and efficient case: Mexicali from 3835–7629.
Calderon et al., 2011 * [29]Simulation
DOE v2.1
38 m²Base case vs. thermal insulation on roof, efficient A/C equipment and illuminationBase case: Mexicali 3778; Hermosillo 3648; Obregon 3628.
Efficient case: Mexicali 1945; Hermosillo 1850; Obregon 1776.
Campos, 2011 [30]Simulation
Energy Plus v6
44.7 m²Base case vs. diverse strategies (thermal insulation, double pane windows, reflective coatings)Base case: Hidalgo state 1922; Puebla 1296; Monterrey 3889; Hermosillo 6347; Merida 5140; Cancun 4201.
Solis, 2010 [31]Simulation
EnergyPlus v2.1
32.6 m²Base case vs. different wall orientations and shading strategiesBase case: Hermosillo 17,904, Nuevo Laredo 18,490; Monterrey 17,741; Torreon 13,320; Mexicali 12,205, Chihuahua 8767.
Heard et al., 2013 * [32]Simulation
DOE v2
52 m² (two levels)Base cases vs. thermal insulation on opaque envelope (walls + roof)Base case: Mexicali 9811; Monterrey 6235; Mexico City 2130; Merida 7702; Villahermosa 9574; Juarez 4930; Matamoros 6216, Nuevo Laredo 7984.
Energy saving by 16 mm of thermal insulation: Mexicali 4181; Monterrey 6235; Mexico City 402; Merida 7702; Villahermosa 2782; Juarez 1995; Matamoros 6216; Nuevo Laredo 2988.
1 Thermal Zone 1: Merida, Villahermosa, Obregon; Thermal Zone 2: Hermosillo, Monterrey, Nuevo Laredo, Matamoros, Mexicali, Torreon; Thermal Zone 3: Mexico City, Juarez; Thermal Zone 4: Pachuca (Hidalgo State); Some results include efficient cases in addition to the base case of uninsulated houses; results that include efficient cases are marked with an asterisk (*).
Table 3. Optimal thermo-optical properties of building exteriors, by city.
City (Thermal Zone)Solar reflectance of WallsSolar reflectance of RoofsInfrared emissivity of Roofs
Acapulco (1)0.70.90.9
Hermosillo (2)0.70.90.9
Chihuahua (3)0.70.50.9
Mexico City (3)0.70.50.9
Pachuca (4)0.70.10.9
Toluca (4)0.70.10.9
Table 4. R-value of walls and roof for every combination of thermal insulation.
CaseRoofWall
m²·K/Wft²·°F·h/Btum²·K/Wft²·°F·h/Btu
Base case0.150.860.251.41
ROOF120.583.290.251.41
ROOF251.045.930.251.41
ROOF501.9411.000.251.41
ROOF752.8316.070.251.41
ROOF1003.7221.140.251.41
WALL120.150.860.683.84
WALL250.150.861.146.48
WALL500.150.862.0311.55
WALL750.150.862.9316.62
WALL1000.150.863.8221.69
ALL120.583.290.683.84
ALL251.045.931.146.48
ALL501.9411.002.0311.55
ALL752.8316.072.9316.62
ALL1003.7221.143.8221.69
Table 5. Electricity pricing scheme in Mexico. U.S. dollar prices were calculated using the 2015 average exchange rate between U.S. dollars (US$) and Mexican pesos (MXN) published by the Bank of Mexico (15.8680 MXN/US$) [37].
CityPrice Category BasicMediumHigh MediumExcess
Non-Summer Season
Acapulco
(November–April)
1BUsage (kWh/month)0–7576–175 >175
Price (US$/kWh)0.05010.0615 0.1803
Hermosillo
(November–April)
1FUsage (kWh/month)0–7576–200 >200
Price (US$/kWh)0.05010.0615 0.1803
Chihuahua
(October–March)
1BUsage (kWh/month)0–7576–175 >175
Price (US$/kWh)0.05010.0615 0.1803
Mexico City
(September–February)
1Usage (kWh/month)0–7576–140 >140
Price (US$/kWh)0.05010.0615 0.1803
Pachuca
(September–February)
1Usage (kWh/month)0–7576–140 >140
Price (US$/kWh)0.05010.0615 0.1803
Toluca
(October–March)
1Usage (kWh/month)0–7576–140 >140
Price (US$/kWh)0.05010.0615 0.1803
Summer Season
Acapulco
(May–October)
1BUsage (kWh/month)0–125126–225 >226
Price (US$/kWh)0.04480.0529 0.1803
Hermosillo
(May–October)
1FUsage (kWh/month)0–300301–12001201–2500>2500
Price (US$/kWh)0.03750.04670.11370.1803
Chihuahua
(April–September)
1BUsage (kWh/month)0–125126–225 >226
Price (US$/kWh)0.04480.0529 0.1803
Mexico City
(March–August)
1Usage (kWh/month)0–7576–140 >140
Price (US$/kWh)0.05100.0615 0.1803
Pachuca
(March–August)
1Usage (kWh/month)0–7576–140 >140
Price (US$/kWh)0.05100.976 0.1803
Toluca
(April–September)
1Usage (kWh/month)0–7576–140 >140
Price (US$/kWh)0.05100.976 0.1803
Table 6. Simulated annual energy consumption for space cooling and heating per unit floor area (kWh/m²).
CaseAcapulcoChihuahuaHermosilloMexico CityPachucaToluca
Base Case123125116335073
ROOF12120105102243558
ROOF2511910199233356
ROOF501199797223356
ROOF751189696213355
ROOF1001189596213355
WALL12113107100263852
WALL2511010295253647
WALL501079892253644
WALL751069690253643
WALL1001059589253643
ALL121108886192337
ALL251057778182129
ALL501016972202026
ALL75996569212125
ALL100986368212125
Table 7. Electricity prices for each insulation case and city (US$/kWh). U.S. dollar prices were calculated using the 2015 average exchange rate between U.S. dollars (US$) and Mexican pesos (MXN) published by the Bank of Mexico (15.8680 MXN/US$) [37].
Case Average Price
Initial Cost of Thermal InsulationAcapulco 1BHermosillo 1FChihuahua 1BMexico City 1Pachuca 1Toluca 1
US$US$/kWhUS$/kWhUS$/kWhUS$/kWhUS$/kWhUS$/kWh
Base case0.000.14020.05270.14200.12220.14120.1395
ROOF121145.210.13860.05170.12970.10580.12430.1220
ROOF251303.880.13820.05150.12600.10260.12220.1194
ROOF501609.030.13790.05130.12320.10060.12140.1180
ROOF751914.170.13770.05120.12210.09980.12120.1176
ROOF1002219.320.13770.05110.12150.09940.12110.1173
WALL121855.240.13460.05160.13120.11000.12850.1113
WALL252112.290.13210.05110.12690.10780.12650.1013
WALL502606.630.13010.05080.12350.10730.12620.0947
WALL753100.960.12920.05060.12210.10740.12630.0924
WALL1003595.300.12870.05050.12120.10750.12650.0914
ALL123000.450.13210.05020.11360.09380.10470.0706
ALL253416.180.12850.04910.09980.09250.09810.0631
ALL504215.660.12530.04870.08710.09580.09750.0620
ALL755015.140.12380.04870.08100.09820.09850.0617
ALL1005814.620.12300.04870.07730.09970.09930.0615
Price variation:0.01720.00400.06470.02970.04370.0780
Table 8. R-values (m²·K/W) for roofs and walls, from various benchmarks.
City (Climate Zone)NOM-020 1 Wall and Roof Reference BuildingNMX-C-460 Wall Minimum (Energy Savings)NMX-C-460 Roof Minimum (Energy Savings)This work 2 Wall Optimal CaseThis work 2 Roof Optimal Case
Acapulco (1)1.901.00 (1.40)1.40 (2.65)1.140.15
Hermosillo (2)2.101.00 (1.40)1.40 (2.65)1.140.15
Chihuahua (3)1.601.00 (1.80)1.40 (2.80)2.031.94
Mexico City (3)1.101.00 (1.80)1.40 (2.80)0.251.04
Pachuca (4)1.101.00 (2.10)1.40 (3.20)1.141.04
Toluca (4)1.101.00 (2.10)1.40 (3.20)1.141.04
1 R-values for walls are the same as for roofs in building with up to three floor levels; 2 R-values from the optimal insulation case, considering unsubsidized electricity prices and only cooling energy for Hermosillo.

