
China’s Energy Intensity, Determinants and Spatial Effects

Abstract
:1. Introduction
2. Methods and Variables
2.1. Methods
2.1.1. Spatial Econometric Model
2.1.2. Spatial Lag Model
2.1.3. Spatial Error Model
2.1.4. Spatial Durbin Model
2.1.5. Direct, Indirect and Spatial Spillover Effects
2.2. Variables
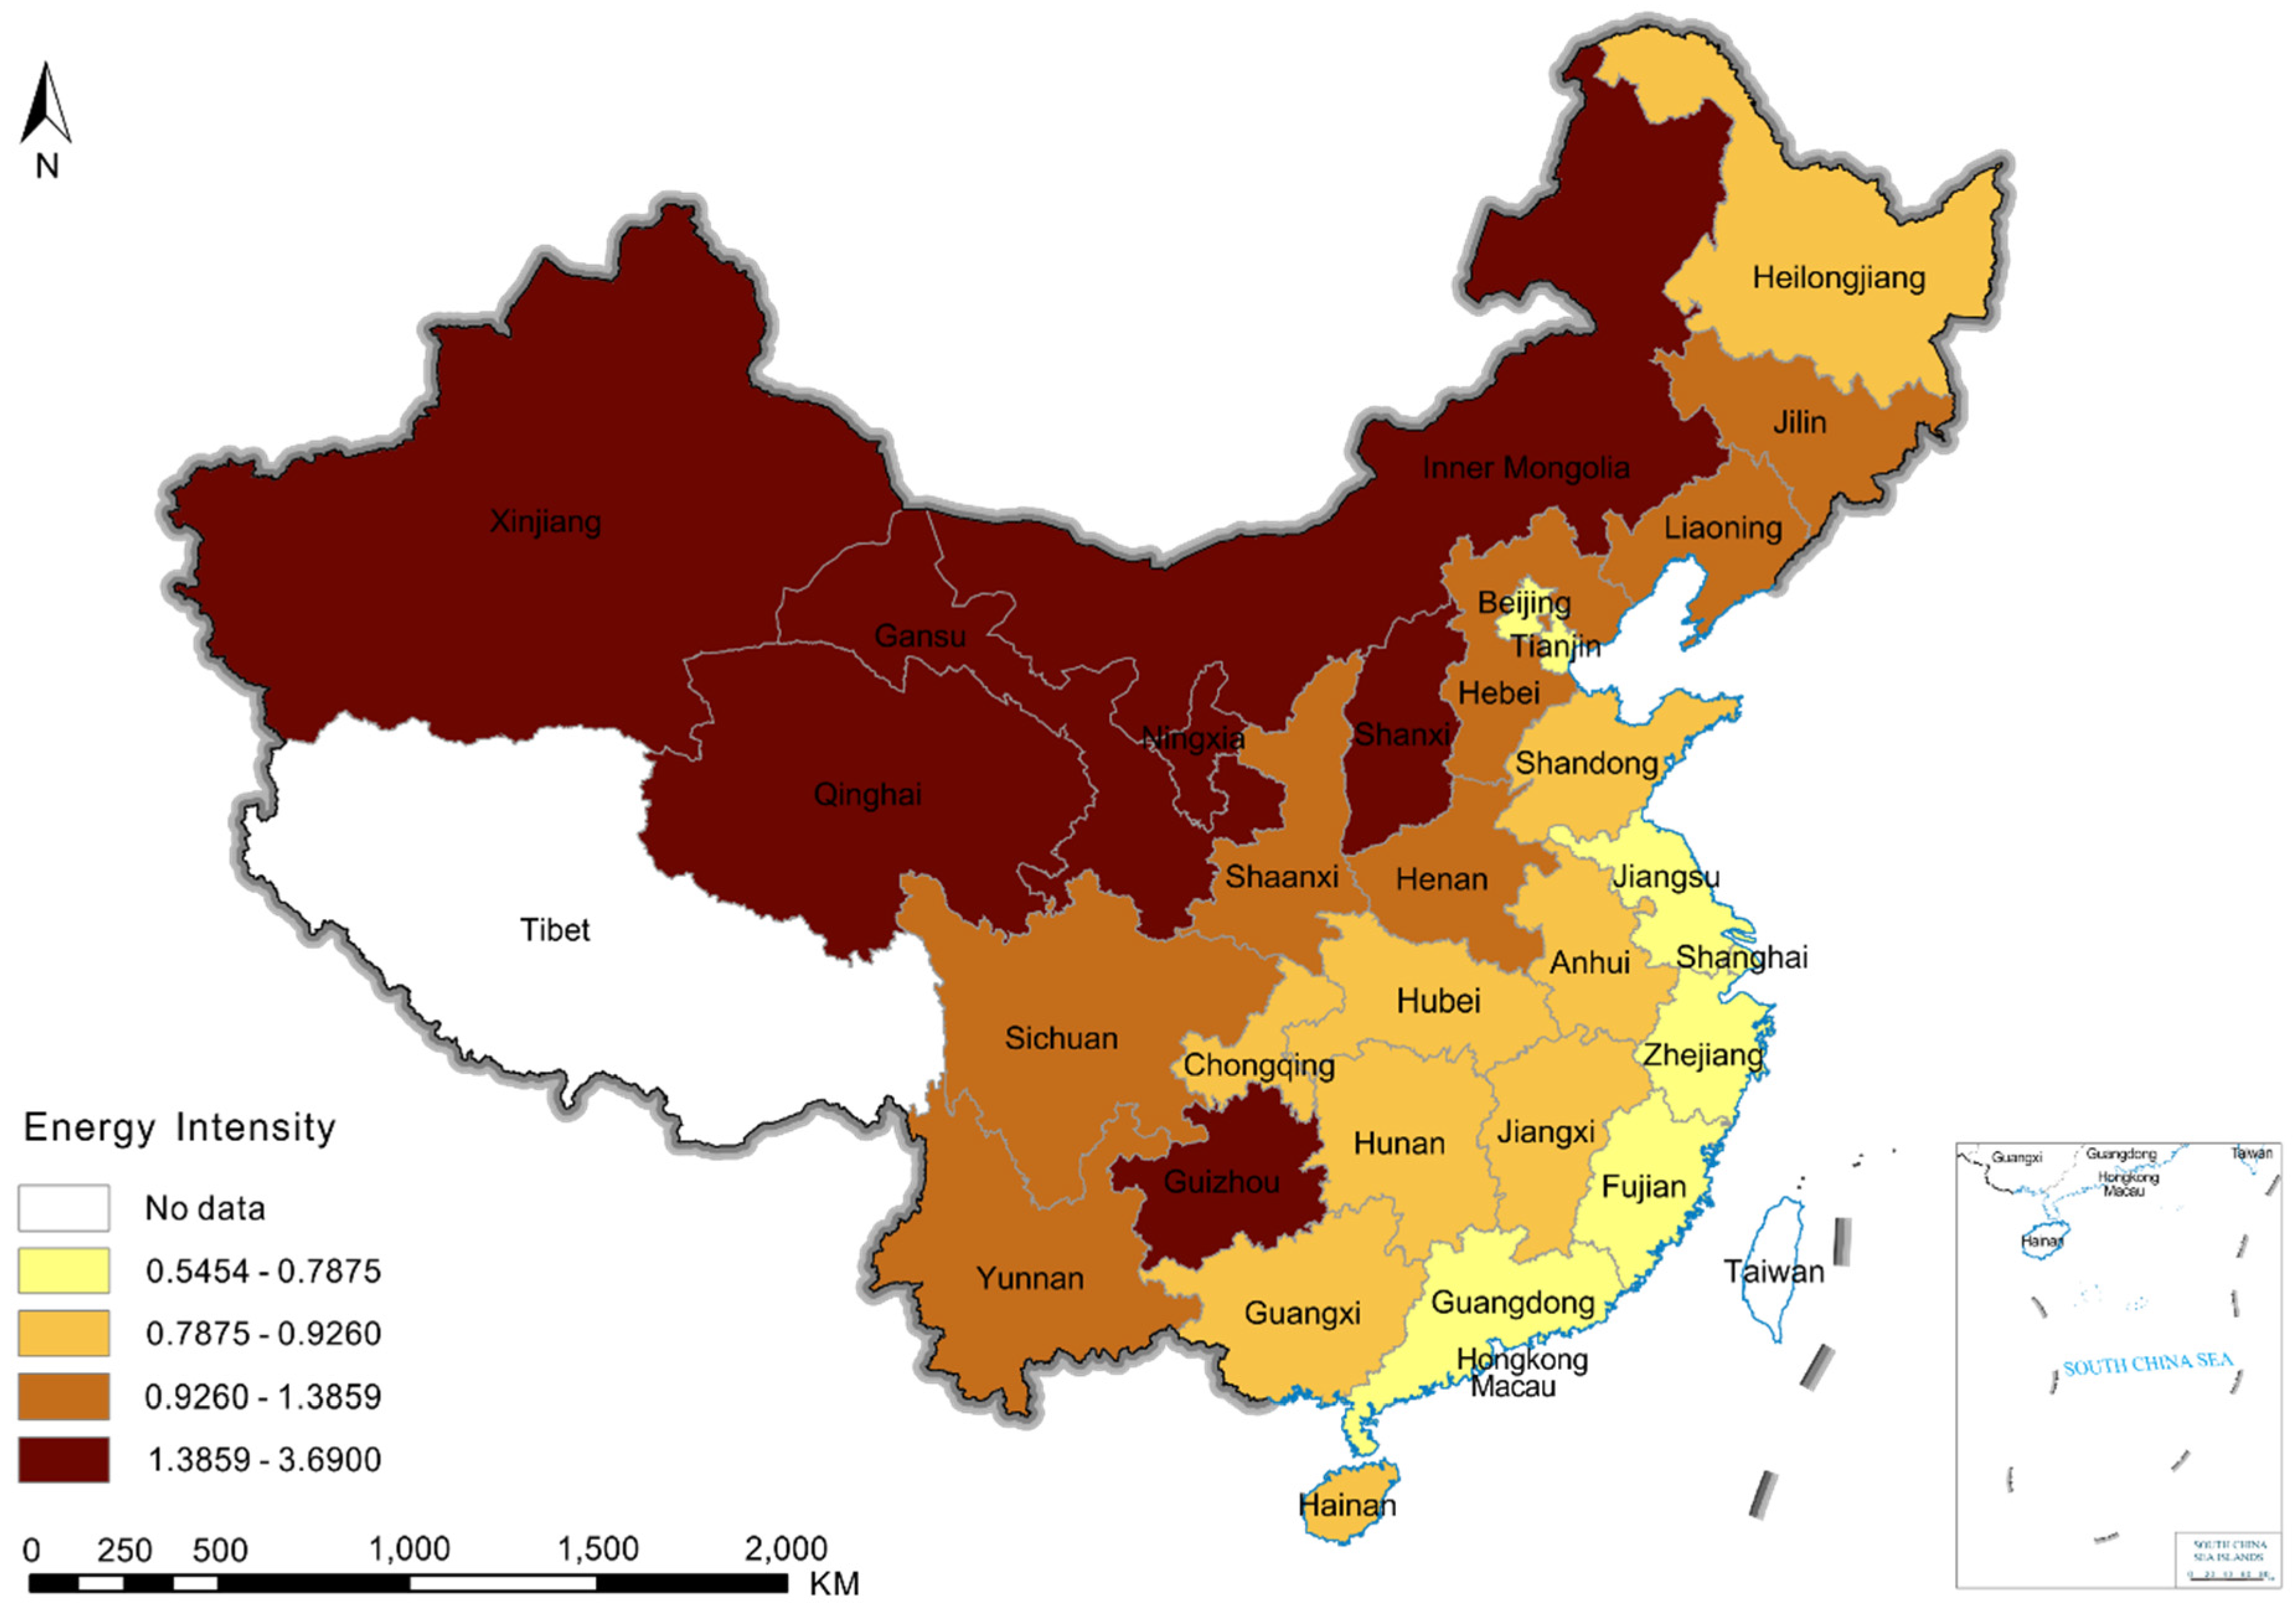
2.2.1. Energy Intensity
2.2.2. Per Capita GDP (GDP)
2.2.3. The Share of the Secondary Sector (Second)
2.2.4 Foreign Direct Investment (FDI)
2.2.5. International Trade (Trade)
2.2.6. Energy Price (Price)
2.2.7. The Share of Coal in the Energy Consumption Structure (Coal)
2.2.8. Transport Sector (Transport)
2.3. Data Sources
3. Results
4. Conclusions
Author Contributions
Conflicts of Interest
References
- Yang, L.; Yang, T. Energy consumption and economic growth from perspective of spatial heterogeneity: Statistical analysis based on variable coefficient model. Ann. Oper. Res. 2015, 228, 151–161. [Google Scholar] [CrossRef]
- Zhao, X.; Ma, C.; Hong, D. Why did China’s energy intensity increase during 1998–2006: Decomposition and policy analysis. Energy Policy 2010, 38, 1379–1388. [Google Scholar] [CrossRef]
- The Eleventh Five-Year Plan for National Economic and Social Development of the People’s Republic of China. Available online: http://www.npc.gov.cn/wxzl/gongbao/2006-03/18/content_5347869.htm (accessed on 14 March 2006). (In Chinese)
- Wang, X. On China’s energy intensity statistics: Toward a comprehensive and transparent indicator. Energy Policy 2011, 39, 7284–7289. [Google Scholar] [CrossRef]
- The Twelfth Five-Year Plan for National Economic and Social Development of the People’s Republic of China. Available online: http://www.gov.cn/2011lh/content_1825838.htm (accessed on 16 March 2011). (In Chinese)
- Hang, L.; Tu, M. The impacts of energy prices on energy intensity: Evidence from China. Energy Policy 2007, 35, 2978–2988. [Google Scholar] [CrossRef]
- Song, F.; Zheng, X. What drives the change in China’s energy intensity: Combining decomposition analysis and econometric analysis at the provincial level. Energy Policy 2012, 51, 445–453. [Google Scholar] [CrossRef]
- Herrerias, M.J.; Cuadros, A.; Orts, V. Energy intensity and investment ownership across Chinese provinces. Energy Econ. 2013, 36, 286–298. [Google Scholar] [CrossRef]
- Yu, H. The influential factors of China’s regional energy intensity and its spatial linkages: 1988–2007. Energy Policy 2012, 45, 583–593. [Google Scholar] [CrossRef]
- Greene, W.H. Econometric Analysis, 5th ed.; Pearson Education: Upper Saddle River, NJ, USA, 2005. [Google Scholar]
- Yuxiang, K.; Chen, Z. Government expenditure and energy intensity in China. Energy Policy 2010, 38, 691–694. [Google Scholar] [CrossRef]
- Sadorsky, P. Do urbanization and industrialization affect energy intensity in developing countries? Energy Econ. 2013, 37, 52–59. [Google Scholar] [CrossRef]
- Blumsack, S.; Xu, J. Spatial variation of emissions impacts due to renewable energy siting decisions in the Western US under high-renewable penetration scenarios. Energy Policy 2011, 39, 6962–6971. [Google Scholar] [CrossRef]
- Douglas, S.M.; Popova, J.N. Econometric estimation of spatial patterns in electricity prices. Energy J. 2011, 32, 81–106. [Google Scholar] [CrossRef]
- Elhorst, J.P. Specification and estimation of spatial panel data models. Int. Reg. Sci. Rev. 2003, 26, 244–268. [Google Scholar] [CrossRef]
- Baltagi, B. Econometric Analysis of Panel Data, 3rd ed.; John Wiley & Sons: Chichester, UK, 2005. [Google Scholar]
- Manski, C.F. Identification of endogenous social effects: The reflection problem. Rev. Econ. Stud. 1993, 60, 531–542. [Google Scholar] [CrossRef]
- Elhorst, J.P. Applied spatial econometrics: Raising the bar. Spat. Econ. Anal. 2010, 5, 9–28. [Google Scholar] [CrossRef]
- LeSage, J.; Pace, R.K. Introduction to Spatial Econometrics; CRC Press: Boca Raton, FL, USA, 2009. [Google Scholar]
- Destais, G.; Fouquau, J.; Hurlin, C. Economic development and energy intensity: A panel data analysis. In The Econometrics of Energy Systems; Palgrave Macmillan: Basingstoke, UK, 2007. [Google Scholar]
- A Better World for All. Available online: https://www.imf.org/external/pubs/ft/jointpub/world/2000/eng/bwae.pdf (accessed on 26 June 2000).
- Suri, V.; Chapman, D. Economic growth, trade and energy: Implications for the environmental Kuznets curve. Ecol. Econ. 1998, 25, 195–208. [Google Scholar] [CrossRef]
- Dinda, S. Environmental Kuznets curve hypothesis: A survey. Ecol. Econ. 2004, 49, 431–455. [Google Scholar] [CrossRef] [Green Version]
- Komen, M.H.; Gerking, S.; Folmer, H. Income and environmental R&D: Empirical evidence from OECD countries. Environ. Dev. Econ. 1997, 2, 505–515. [Google Scholar]
- Stern, D.I. The rise and fall of the environmental Kuznets curve. World Dev. 2004, 32, 1419–1439. [Google Scholar] [CrossRef]
- Wu, Y. Energy intensity and its determinants in China’s regional economies. Energy Policy 2012, 41, 703–711. [Google Scholar] [CrossRef]
- Liao, H.; Fan, Y.; Wei, Y.M. What induced China’s energy intensity to fluctuate: 1997–2006? Energy Policy 2007, 35, 4640–4649. [Google Scholar] [CrossRef]
- Sit, V.F. The special economic zones of China: A new type of export processing zone? Dev. Econ. 1985, 23, 69–87. [Google Scholar] [CrossRef]
- Markusen, J.R.; Venables, A.J. Foreign direct investment as a catalyst for industrial development. Eur. Econ. Rev. 1999, 43, 335–356. [Google Scholar] [CrossRef]
- Cuadros, A.; Orts, V.; Alguacil, M. Openness and growth: Re-examining foreign direct investment, trade and output linkages in Latin America. J. Dev. Stud. 2004, 40, 167–192. [Google Scholar] [CrossRef]
- Kugler, M. Spillovers from foreign direct investment: Within or between industries? J. Dev. Econ. 2006, 80, 444–477. [Google Scholar] [CrossRef]
- Blalock, G.; Gertler, P.J. Welfare gains from foreign direct investment through technology transfer to local suppliers. J. Int. Econ. 2008, 74, 402–421. [Google Scholar] [CrossRef]
- Alguacil, M.; Cuadros, A.; Orts, V. Inward FDI and growth: The role of macroeconomic and institutional environment. J. Pol. Model. 2011, 33, 481–496. [Google Scholar] [CrossRef]
- Fisher-Vanden, K.; Jefferson, G.H.; Jingkui, M.; Jianyi, X. Technology development and energy productivity in China. Energy Econ. 2006, 28, 690–705. [Google Scholar] [CrossRef]
- Doytch, N.; Narayan, S. Does FDI influence renewable energy consumption? An analysis of sectoral FDI impact on renewable and non-renewable industrial energy consumption. Energy Econ. 2015, 54, 291–301. [Google Scholar] [CrossRef]
- Mielnik, O.; Goldemberg, J. Foreign direct investment and decoupling between energy and gross domestic product in developing countries. Energy Policy 2001, 30, 87–89. [Google Scholar] [CrossRef]
- Eskeland, G.S.; Harrison, A.E. Moving to greener pastures? Multinationals and the pollution haven hypothesis. J. Dev. Econ. 2003, 70, 1–23. [Google Scholar] [CrossRef]
- Cole, M.A. Does trade liberalization increase national energy use? Econ. Lett. 2006, 92, 108–112. [Google Scholar] [CrossRef]
- Peterson, S. Greenhouse gas mitigation in developing countries through technology transfer? A survey of empirical evidence. Mitig. Adapt. Strat. Glob. Chang. 2008, 13, 283–305. [Google Scholar] [CrossRef]
- Zheng, Y.; Qi, J.; Chen, X. The effect of increasing exports on industrial energy intensity in China. Energy Policy 2011, 39, 2688–2698. [Google Scholar] [CrossRef]
- Mold, A. Non-Tariff Barriers: Their Prevalence and Relevance for African Countries; African Trade Policy Centre: Addis Ababa, Ethiopia, 2005. [Google Scholar]
- Feng, T.; Sun, L.; Zhang, Y. The relationship between energy consumption structure, economic structure and energy intensity in China. Energy Policy 2009, 37, 5475–5483. [Google Scholar] [CrossRef]
- Magnani, N.; Vaona, A. Regional spillover effects of renewable energy generation in Italy. Energy Policy 2013, 56, 663–671. [Google Scholar] [CrossRef]
- Vaona, A. The effect of renewable energy generation on import demand. Renew. Energy 2016, 86, 354–359. [Google Scholar] [CrossRef]
- Kaygusuz, K. Energy for sustainable development: Key issues and challenges. Energy Sourc. B Energy Econ. Plan. 2007, 2, 73–83. [Google Scholar] [CrossRef]
- Wu, L.; Huo, H. Energy efficiency achievements in China’s industrial and transport sectors: How do they rate? Energy Policy 2014, 73, 38–46. [Google Scholar] [CrossRef]
- National Bureau of Statistics of China (NBSC). China Energy Statistical Yearbook 2015; China Statistics Press: Beijing, China, 2015. (In Chinese) [Google Scholar]
- National Bureau of Statistics of China (NBSC). China Statistical Yearbook 2015; China Statistics Press: Beijing, China, 2015. (In Chinese) [Google Scholar]
- National Bureau of Statistics of China (NBSC). China Industry Economy Statistical Yearbook 2015; China Statistics Press: Beijing, China, 2015. (In Chinese) [Google Scholar]
- OECD Key Environmental Indicators. Available online: https://www.oecd.org/env/indicators-modelling-outlooks/37551205.pdf (accessed on 20 April 2004).
- Ajmi, A.N.; Montasser, G.E.; Nguyen, D.K. Testing the relationships between energy consumption and income in G7 countries with nonlinear causality tests. Econ. Model. 2013, 35, 126–133. [Google Scholar] [CrossRef]
- Akinlo, A.E. Energy consumption and economic growth: Evidence from 11 sub-Sahara African countries. Energy Econ. 2008, 30, 2391–2400. [Google Scholar] [CrossRef]
- Narayan, S. Predictability within the energy consumption–economic growth nexus: Some evidence from income and regional groups. Econ. Model. 2016, 54, 515–521. [Google Scholar] [CrossRef]

| Variable | Model 1 | Model 2 | Model 3 | Model 4 |
|---|---|---|---|---|
| Ln(GDP) | −0.0155 (−0.2366) | −0.4322 *** (−12.7908) | 0.2684 *** (3.6007) | −0.1459 ** (−2.0390) |
| Ln(Second) | 0.3022 *** (2.7020) | 0.8472 *** (13.3927) | 0.0844 (0.7654) | 0.4443 *** (6.1838) |
| Ln(FDI) | −0.1401 *** (−6.5537) | −0.0210 ** (−2.1113) | −0.1526 *** (−7.3061) | −0.0230 ** (−2.5401) |
| Ln(Trade) | −0.0894 *** (−3.2823) | 0.0037 (0.2110) | −0.1975 *** (−6.5975) | −0.0585 *** (−3.2614) |
| Ln(Price) | 0.1061 (0.9690) | 0.2881 *** (4.8268) | 0.8762 *** (4.6610) | 0.5836 *** (6.4126) |
| Ln(Coal) | 0.2772 *** (4.8085) | 0.0386 (0.9688) | 0.2035 *** (3.6106) | −0.0494 (−1.2661) |
| Ln(Transport) | −0.1194 *** (−2.9935) | −0.0348 (−1.5400) | −0.0232 (−0.5789) | 0.0359 * (1.6730) |
| Adjusted R2 | 0.5279 | 0.9580 | 0.5845 | 0.9672 |
| Log Likelihood | −154.6280 | 438.0489 | −126.7124 | 498.8760 |
| LM lag | 21.5178 *** | 29.9868 *** | 0.2714 | 0.2442 |
| Robust LM lag | 8.0180 *** | 25.6892 *** | 4.0655 ** | 4.9754 ** |
| LM error | 13.6086 *** | 6.1974 ** | 7.4319 *** | 0.0988 |
| Robust LM error | 0.1087 | 1.8999 | 11.2260 *** | 4.8300 ** |
| Variable | Rook Contiguity (Model 5) | Four-Nearest (Model 6) |
|---|---|---|
| Ln(GDP) | 0.0076 (0.1072) | −0.1059 (−1.4799) |
| Ln(Second) | 0.4341 (6.1878) *** | 0.3616 (4.7169) *** |
| Ln(FDI) | −0.0366 (−4.0168) *** | −0.0281 (−3.1434) *** |
| Ln(Trade) | −0.0529 (−2.8094) ** | −0.0789 (−4.0788) *** |
| Ln(Price) | 0.5930 (6.4074) *** | 0.6278 (6.6743) *** |
| Ln(Coal) | −0.1504 (−3.8618) *** | −0.1752 (−4.0296) *** |
| Ln(Transport) | 0.0010 (0.0482) | 0.0465 (2.0917) ** |
| W × Ln(GDP) | −0.1889 (−1.2790) | −0.0488 (−0.7802) |
| W × Ln(Second) | 0.6369 (4.3118) *** | 0.3556 (2.8183) *** |
| W × Ln(FDI) | −0.1436 (−6.7544) *** | −0.0535 (−2.5948) *** |
| W × Ln(Trade) | 0.0787 (2.0040) ** | −0.0293 (−1.0121) |
| W × Ln(Price) | −0.3375 (−1.5485) | −0.1720 (−1.8505) * |
| W × Ln(Coal) | 0.2709 (3.1055) *** | −0.1439 (−1.9813) ** |
| W × Ln(Transport) | 0.0951 (2.1958) ** | 0.0071 (0.1763) |
| ρ | 0.0110 (0.1770) | −0.1446 (−3.1556) *** |
| Adjusted R2 | 0.3684 | 0.2900 |
| Log Likelihood | 550.81605 | 523.50563 |
| Wald test spatial lag | 102.6981 *** | 65.8544 *** |
| LR test spatial lag | 100.7323 *** | 52.6266 *** |
| Wald test spatial error | 107.9347 *** | 50.5973 *** |
| LR test spatial error | 103.5826 *** | 49.1485 *** |
| Spatial Weights | Variable | Direct Effect | Indirect Effect | Total Effect |
|---|---|---|---|---|
| Four-nearest | Ln(GDP) | −0.1012 (−1.4285) | −0.0318 (−0.5284) | −0.1330 * (−1.7600) |
| Ln(Second) | 0.3424 *** (4.4914) | 0.2887 ** (2.5393) | 0.6312 *** (4.4249) | |
| Ln(FDI) | −0.0256 *** (−2.7510) | −0.0458 ** (−2.3442) | −0.0714 *** (−3.5250) | |
| Ln(Trade) | −0.0781 *** (−3.9468) | −0.0174 (−0.6511) | −0.0955 *** (−2.9218) | |
| Ln(Price) | 0.6491 *** (7.0180) | −0.2455 *** (−2.6436) | 0.4036 *** (3.3038) | |
| Ln(Coal) | −0.1689 *** (−3.8127) | −0.1133 * (−1.6527) | −0.2822 *** (−3.3263) | |
| Ln(Transport) | 0.0463 * (1.9792) | −0.0002 (−0.0060) | 0.0460 (1.2417) | |
| Rook contiguity | Ln(GDP) | 0.0089 (0.1249) | −0.1893 (−1.2046) | −0.1804 (−1.0341) |
| Ln(Second) | 0.4335 *** (6.1859) | 0.6444 *** (4.2187) | 1.0779 *** (6.3163) | |
| Ln(FDI) | −0.0367 *** (−4.0603) | −0.1456 *** (−6.3676) | −0.1823 *** (−6.8081) | |
| Ln(Trade) | −0.0528 *** (−2.8123) | 0.0790 * (1.9716) | 0.0262 (0.5786) | |
| Ln(Price) | 0.5913 *** (6.2329) | −0.3340 (−1.5149) | 0.2573 (1.0339) | |
| Ln(Coal) | −0.1489 *** (−3.8173) | 0.2675 *** (2.9484) | 0.1186 (1.2777) | |
| Ln(Transport) | 0.0006 (0.0290) | 0.0976 ** (2.1227) | 0.0982 ** (2.1356) |
© 2016 by the authors; licensee MDPI, Basel, Switzerland. This article is an open access article distributed under the terms and conditions of the Creative Commons Attribution (CC-BY) license (http://creativecommons.org/licenses/by/4.0/).
Share and Cite
Jiang, L.; Ji, M. China’s Energy Intensity, Determinants and Spatial Effects. Sustainability 2016, 8, 544. https://doi.org/10.3390/su8060544
Jiang L, Ji M. China’s Energy Intensity, Determinants and Spatial Effects. Sustainability. 2016; 8(6):544. https://doi.org/10.3390/su8060544
Chicago/Turabian StyleJiang, Lei, and Minhe Ji. 2016. "China’s Energy Intensity, Determinants and Spatial Effects" Sustainability 8, no. 6: 544. https://doi.org/10.3390/su8060544