
Energy Efficient Networks for Monitoring Water Quality in Subterranean Rivers


1
Department of Computer Science, Central China Normal University, Wuhan 430079, China
2
School of Computer, China University of Geoscience, Wuhan 430074, China
*
Author to whom correspondence should be addressed.
Sustainability 2016, 8(6), 526; https://doi.org/10.3390/su8060526
Submission received: 13 April 2016
/
Revised: 27 May 2016
/
Accepted: 27 May 2016
/
Published: 31 May 2016
(This article belongs to the Section Environmental Sustainability and Applications)
Abstract
:The fresh water in rivers beneath the Earth’s surface is as significant to humans as that on the surface. However, the water quality is difficult to monitor due to its unapproachable nature. In this work, we consider building networks to monitor water quality in subterranean rivers. The network node is designed to have limited functions of floating and staying in these rivers when necessary. We provide the necessary conditions to set up such networks and a topology building method, as well as the communication process between nodes. Furthermore, we provide every an node’s energy consumption model in the network building stage, the data acquiring and transmission stage. The numerical results show that the energy consumption in every node is different, and the node number should be moderate to ensure energy efficiency.
1. Introduction
Without water there is no life on the earth. Water is a significant part of humans and other living being bodies. The development and wide use of chemical products, as well as other industrial products, is becoming a serious threat to drinking water. Drinking water comes from rivers, ground water, streams, and lakes, etc. It is important to protect these drinking water sources to sustain safe drinking water sources. The human life in many areas of the world depends on underground water. Underground rivers are part of the underground water supply. In recent years, more and more attention has been paid to the ecosystems and quality of underground rivers worldwide [1,2,3,4]. The reason for this may result from several aspects: (1) The subterranean rivers in some countries such as the southwest area of P.R. China are widely distributed and have rich reserves It has been reported by the Guangxi experiment base of China Geological Survey [5], that there are more than 3000 subterranean rivers in the southwest of China. Among these rivers, more than 90% are not protected. The reserved water may be used to maintain life in drought seasons; (2) The ecosystems of underground rivers are interesting and different from those above the ground. Many animals and plants in the subterranean river are rare, not known to the world and may have significant scientific value; (3) With the modern industry development, the subterranean river quality is becoming worse and worse, especially in the developing countries that focus on economic improvement.
In contrast to the rivers on the ground, subterranean rivers cannot be easily touched. Thus, these attentions to subterranean river bring huge challenges in several fields. The first is that the water circulation in subterranean river systems in many areas is not clear. For example, the scientists only know the entry and the exit of a subterranean river in the southeast of China, but do not know the water circulation under the ground. The second is that the quality of the water in the subterranean rivers is difficult to monitor. The best way for monitoring underground water from wells does not work well because the researchers do not know where the underground river-bed is. The most popular monitoring method, like the researchers do in [6], is to place the sensors in the exits or/and the entrances of a subterranean river. However, the number of the sample positions is constrained so that the sample data may be not be sufficient to describe the water quality in the whole river systems.
We consider a kind of wireless sensor network for solving the above problems in this research. Wireless sensor networks have been a hot research topic for several years. A lot of interesting projects such as the WINS project at UCLA [7] are dedicated to the research topic. We do not list the numerous publications on wireless sensor networks here, but are concerned with a very few related ones. Depending on the environment, the networks that are deployed on land, underground, and underwater face different challenges and constraints [8]. Underground sensor networks are buried in a cave or mine, for monitoring underground conditions [9]. In these networks, the sensor nodes can be deployed freely. However, we cannot put one sensor node in the predicted place in a subterranean river, if the place cannot be reached by people. Underwater sensor networks consist of a number of sensor nodes and vehicles deployed underwater [10]. The architectures of underwater sensor networks may be different [11]. One is that the networks are composed of sensors which are anchored to the bottom of the ocean. Another is that the sensor nodes’ depth can be controlled. The third architecture is that the networks include mobile portions constituted by autonomous vehicles and fixed portions constituted by anchored sensors. The networks in a subterranean river are composed of sensors anchored to the river bottom. However, each node has limited moving capability offered by the water current. The moving directions of the sensor noses are determined by the water current.
Underwater communication technologies are developing to support high performance communications. Acoustic technology is usually used in underwater communication systems today. Underwater acoustic communications provide long communication distances with low rates, while underwater optical communications have a very high rate over a few meters [12]. Underwater electromagnetic communications were investigated during the 1970s and it was believed that only the extremely low frequency (30–300 Hz) submarine communications system works. A reason for this is that the sea water contains dissolved salts and other matter which makes it a partial conductor. Therefore, the attenuation of radio waves in sea water is great. Even so, coupled with digital technology and signal processing techniques, the investigation [13] proved that the electromagnetic wave would offer some advantages which may be used in underwater communications. The Robotic Embedded Systems Laboratory (RESL) at the University of Southern California reported the transmission at 433 MHz by experiments over 120 cm underwater. Moreover, a 10MHz bandwidth model for the underwater channel is established in [14] . The pros and cons of acoustic, optical and electromagnetic communications are listed in [15].
The fresh water in subterranean rivers contains fewer salts than that in the ocean, and the fresh water conductivity is typically 1/400 of the sea water conductivity. Attenuation of radio waves in subterranean rivers may be 1/20 of that in the ocean. Attenuation of radio waves in fresh water increases with an increase in frequency, attenuation at 10 kHz is only 0.4 dB per metre, rising to 5.4 dB per metre at 1.8 MHz [16]. The characteristics of acoustic, optical and radio communications in the ocean and in the fresh water are summarized in Table 1.
In our work, we consider building a kind of sensor network in unreachable subterranean rivers. In Section 1, we analyze the environment characteristics in the subterranean rivers, the special functions a node should have and the network topology. In Section 2 and Section 3, we consider the network topology forming process, energy consumption of each node in different stages, and the numerical results of energy consumption in a scenario with detail settings. In Section 4 and Section 5, the future research issues are discussed and conclusions are provided.
2. Sensor Networks in Subterranean Rivers
2.1. Environment Background
We describe the working environment that the sensor network will work in, and the required functions of the sensor nodes.
A subterranean river is a river that runs wholly or partly beneath the ground surface, one where the river bed does not represent the surface of the Earth [17]. It is convenient to monitor the water quality in the parts beyond the ground surface because people can directly put and fix sensor nodes, which may be armed wired or wireless communication, in the river or under water surface. However, the same method is not feasible if the water is under the ground surface. When the water circulation is unknown, the scientists do not know where the sensor nodes should be put. Therefore, they cannot monitor the water quality in a certain subterranean river because they do not know where the river is. In most cases, the scientists know the entrance and the exit of a subterranean river. A candidate method to monitor the water is to distribute the sensor nodes on these positions and to sample the water quality. However, the data obtained in the entrance and the exit of a subterranean river is not always enough to evaluate the water quality in the subterranean river systems. Beyond this, although the water circulation of a subterranean river systems is discovered, the question on how to distribute the sensor nodes in the unreachable water under the ground surface still exists.
Although most subterranean river systems are not discovered, some developed ones provide us with the overall landscape. An example is the Puerto Princesa Subterranean River [18], which is located in a protected area in the Philippines. The underground river cave is about 24 km long and contains an 8.2 km long underground part of a river which flows directly into the sea. The cave includes major formations of stalactites and stalagmites, and several large chambers, including the 360-meter-long Italian’s Chamber with an approximate 2.5 million square meter volume. In 2010, some environmentalists and geologists discovered that the underground river has a second floor, which means that there are small waterfalls inside the cave. They also found a cave dome measuring 300 m above the underground river, rock formations, a deep water hole in the river, more river channels, and another deep cave, as well as marine creatures and more. Deeper areas of the underground river are almost impossible to explore due to oxygen deprivation.
We list some characteristics of subterranean rivers that we confider in this paper in Table 2.
Unlike the Puerto Princesa Subterranean River, most subterranean river systems have not been developed until now. It is still a challenging work to monitor water quality in an unreachable subterranean river. A remotely operated underwater vehicle (ROV), capable of monitoring the water quality, is a tethered underwater mobile device. This device must be linked to a mother ship by a neutrally buoyant tether. It can be realized when monitoring the sea water. In the subterranean river, however, it is not realistic to provide a mother ship for a ROV to connect to. Another kind of robot which can travel underwater without requiring tether from an engineer is an autonomous underwater vehicle (AUV). Dictated by the technology, such as navigating underwater, AUVs are just used for a limited number of tasks. Furthermore, current AUVs cannot provide real time monitoring in the subterranean river. In order to have real time water quantity monitoring in the whole river, we consider a kind of underwater sensor network in the unattainable water in subterranean rivers.
2.2. Sensor Nodes
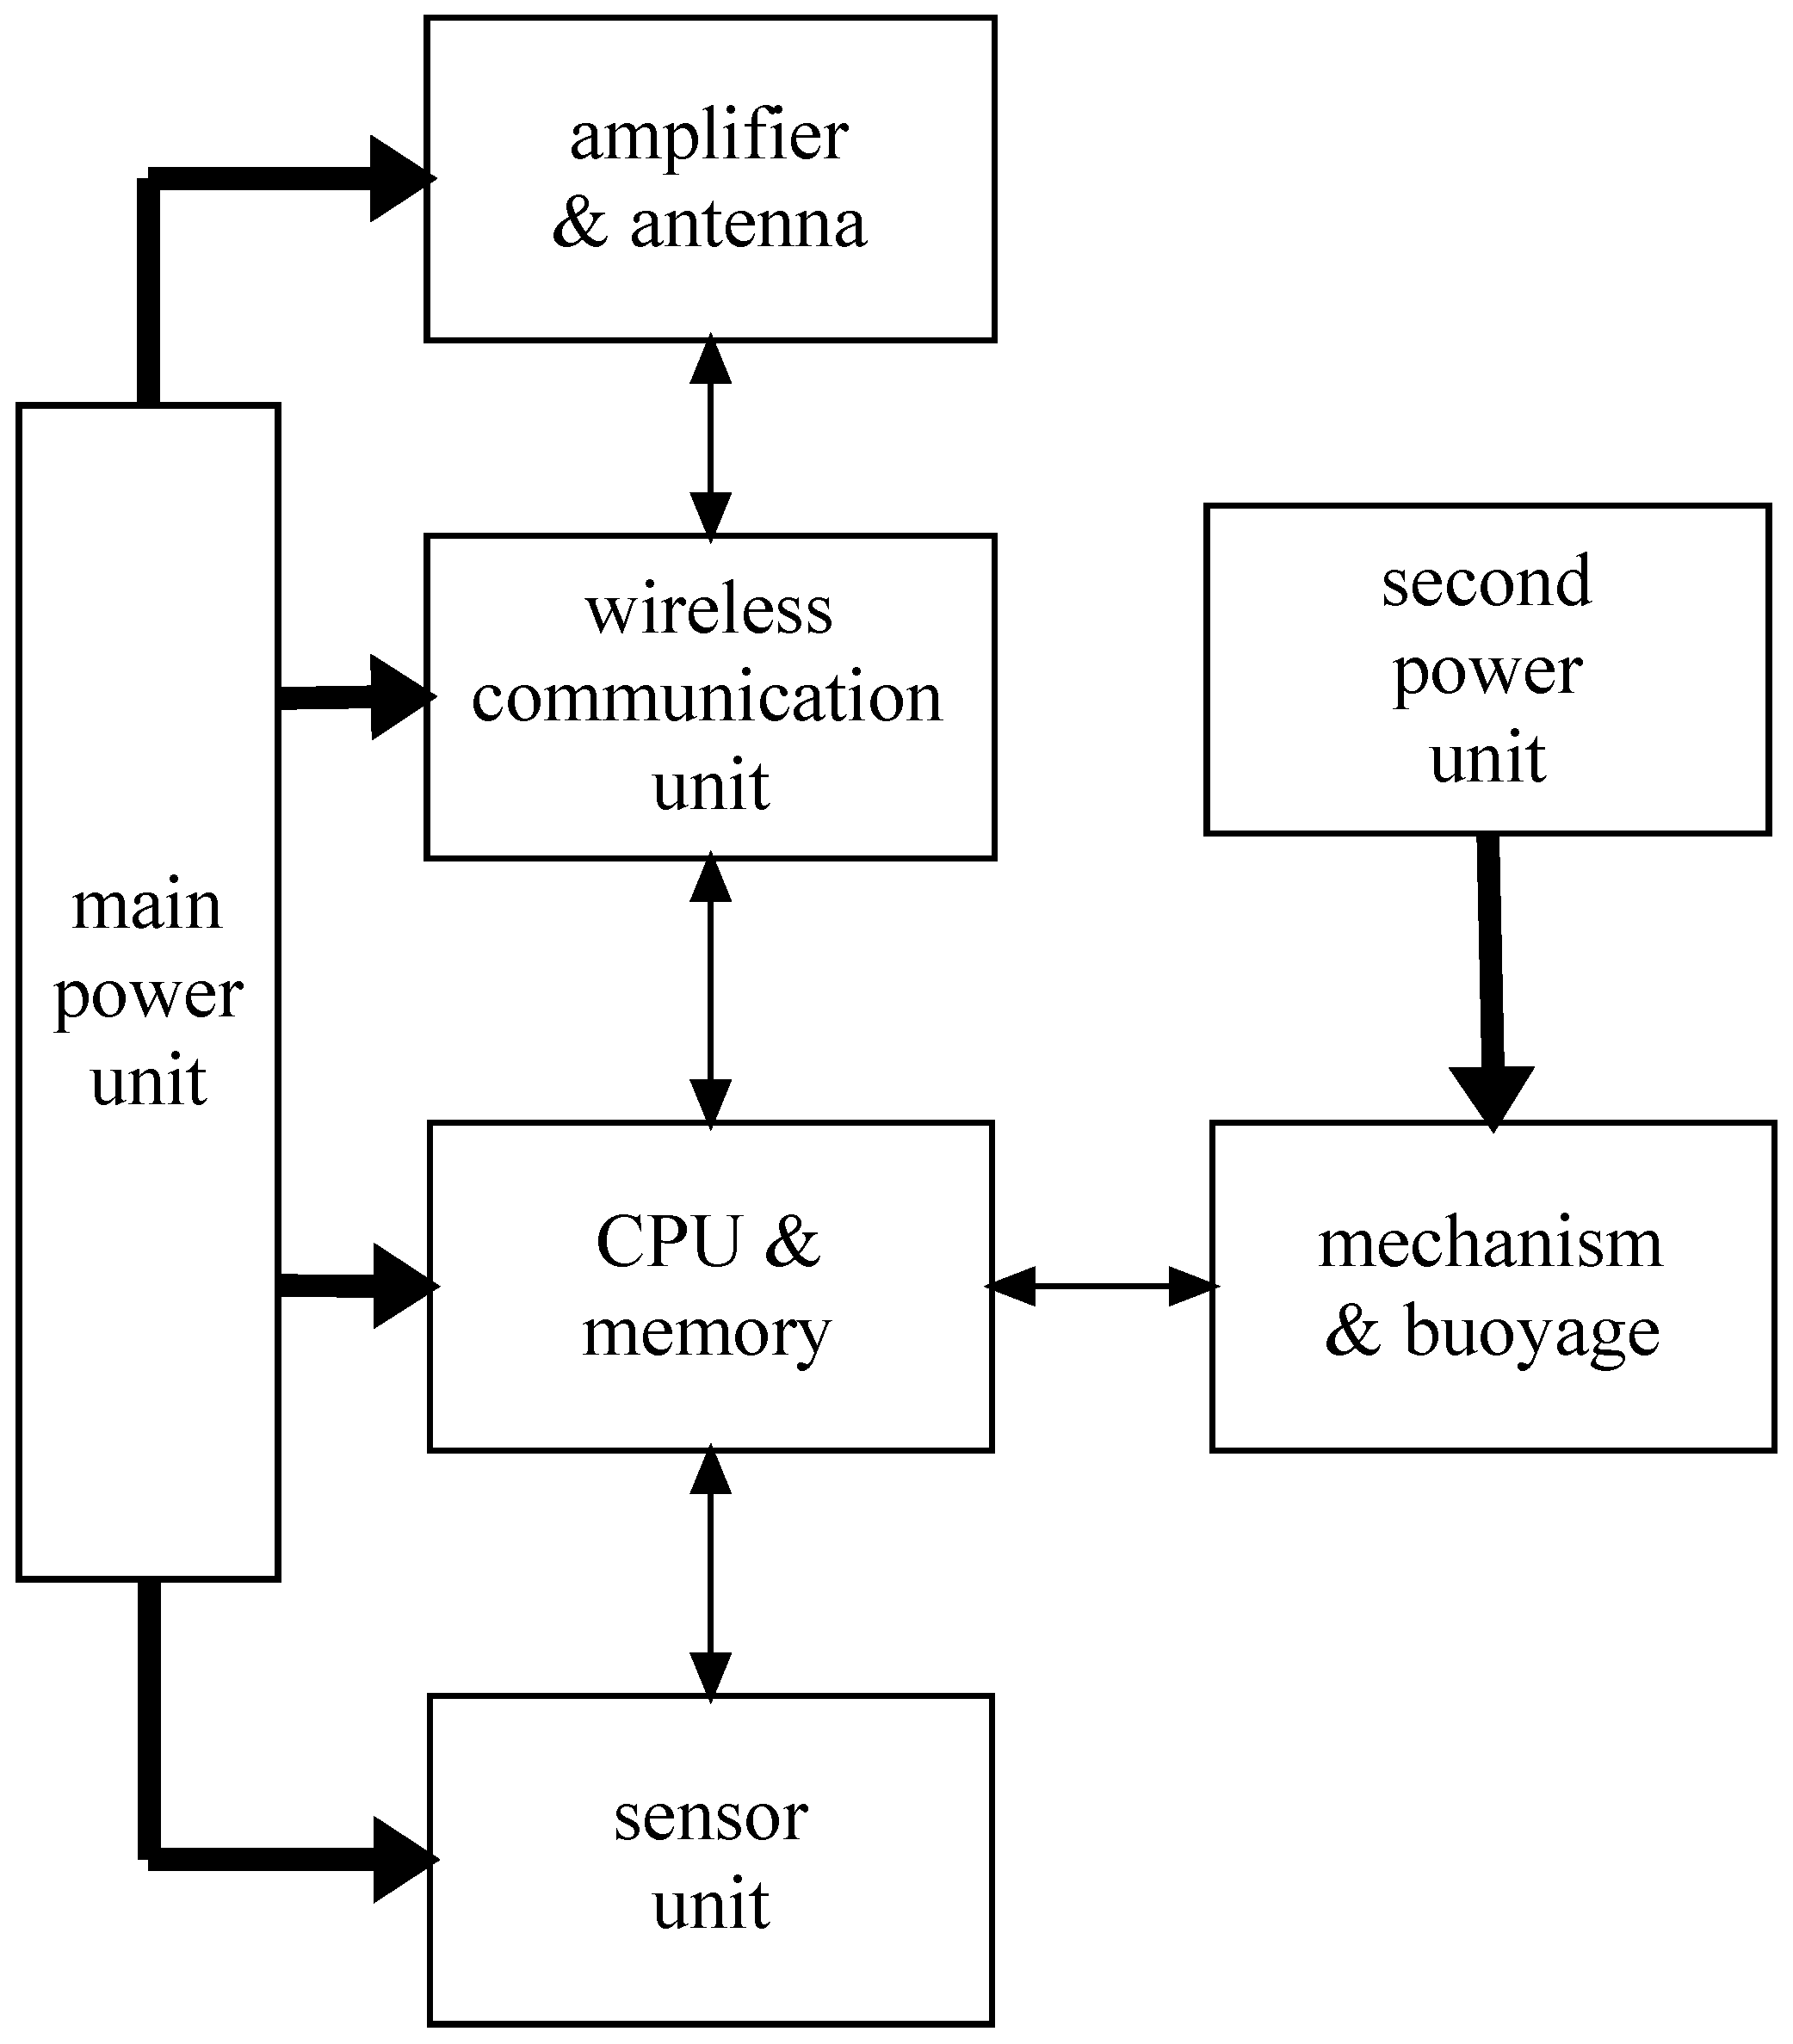
We design the hardware structure of a network node, as Figure 1 shows. A node includes a main power unit, a CPU and memory unit, an amplifier and antenna unit, a wireless communication unit, a mechanism and buoyage unit and a second power unit.
The main power unit in a node is composed of high power batteries, i.e., lithium cells, which provide power to the node excluding the mechanism and buoyage system. The second power unit is responsible for supplying the mechanism and buoyage system because the system may need high power. The aim of this design is to extend the node’s lifetime.
The CPU and memory unit is in charge of control, computation and storage of acquired data. The wireless communication unit includes channel coding/decoding, modulation and demodulation. The amplifier and antenna unit includes radio frequency signal amplifier and the transmit/receive antenna. The structure of the wireless communication unit is shown in Figure 2.
The basic function a node should have is sensing the environment by its sensor unit. The unit is capable of sensing water quality parameters, i.e., dissolved oxygen (DO), conductivity, turbidity, pH, oxidation reduction potential (ORP) and temperature. The sensor unit is mainly composed of the interface circuits for the sensors and the sensors themselves. The output signals of these sensors are different. A typical output is the analog signal, i.e., an analog voltage or current, which is a continuous physical quantity. Because CPU can only process digital signals, an analog-to-digital converter (ADC) is required to convert an analog quantity to a digital value proportional to the magnitude of the analog quantity. To decrease quantization error, a 16-bit ADC is preferred. In some types of chips where CPU and ADC are integrated together, a multiplexer is required to select one of several sensor signals and forward the selected one into CPU. Another type of sensor directly outputs the digital quantity, which is encapsulated in a communication protocol such as inter-integrated circuit (IIC). If so, an interface chip is required to parse the protocol.
The mechanism and buoyage unit is regarded as a candidate unit. If a node is not equipped with this unit, the node always floats on the water and the movement of this node is decided by the water current. When it is floating, it can sense the environmental parameters. With luck, the nodes, which are released in the entrance of a subterranean river, can be collected at the exit of the river. It is lucky if all the nodes released at the entrance of a subterranean river are collected at the exit of the river. Unfortunately, the movement of a node may be stopped, i.e., by a cave below the water surface, and stay there. The mechanism and buoyage unit helps a node to change its moving state. It can make a node behave like a submarine which can freely float below or above the water surface. Furthermore, it can fix itself in a suitable position by an anchor. However, this operation cannot be repeated an unlimited number of times. This unit is mainly composed of an anchor, a micro DC motor, an air bladder and a small can of pressurized air. The specific gravity of the node is made to be equal to the fresh water in the subterranean river at first. The motor provides power for dropping or pulling up the anchor. The pressurized air is used to adjust the specific gravity of the node.
According to the characteristics of the subterranean river, the nodes of the wireless sensor networks in the subterranean river should have some additional functions.
A required function is that the sensor node is waterproof and capable of moving with the water flow in the subterranean river, just like a floating boat above the water or a floating submarine in the water. However, it is not enough to let the sensor node just float on the water surface. The reason for this is that if the node is like a boat, it may not go through the caves with the water current. On the other hand, the node should not be too heavy, or else it will gravitate towards the bottom of the water. Therefore, a sensor node is designed to be similar to a submarine with or without an engine.
Another function is that the sensor nodes can fix themselves in one place in the water if required. This function means that the nodes have the capacity to freely move with the water stream or stay in one place. To satisfy this, each node has an equipment like a ship’s anchor. When the node needs to stay in one place, it can lay down its anchor, or else pull up the anchor. These operations will consume more energy, therefore, a second power module is necessary. In general, a node should have the power to drop anchor at least once. To extend the function, the sensor node should know its movement direction. This can be realized by an electronic compass device.
A problem that should be considered is communication systems in the subterranean river. The acoustic technology is usually used in underwater communication systems today, especially in the ocean. The commercial acoustic modems can communicate with several kilobits per second (kbps) over long distances up to several kilometres. Complementary wireless communication techniques, such as radio-frequency communication, have been proposed, with a very high rate over a few meters in the sea water. Because attenuation of radio waves in fresh water is less than that in the sea water, radio-frequency communication may have a more brilliant future than the acoustic technology in the fresh water. The power of the transmitters should be adjustable according to the communication distance, in order to adapt to the network scalability.
2.3. Building the Network Structure
Our aim is to have some methods that can monitor the water quality in the subterranean river. A method is to put one sensor node into the subterranean river at the entrance and let it float with the water flow. When the node is floating with the water current, it acquires the environment parameters and saves the data in its memory. Then, if we are fortunate, we can collect it at the exit of the subterranean river. However, the monitoring process is not a real time one and the data collected are all historical data. To obtain real time data, here we consider constructing a wireless sensor network in the subterranean river to monitor the water quality.
We expect to build a linear wireless sensor network or a chain network, and discuss the energy consumption in the network later. Although building a linear network may be the simplest one on the ground, it is not easy to build such networks under the ground due to the uncertainty of the subterranean river beneath the ground surface.
To build such a wireless network topology, some important issues should be considered. The first one is that the traditional position locating methods do not work. In the underground river, it is impossible to put a wired cable for communication. The base station of the mobile communication system cannot be built in the subterranean river. Therefore, when a sensor node is put in the subterranean river, its position cannot be located.
The second one is that the node movement direction is unknown. We may know the water current direction and wish that the sensor nodes have the same moving direction with the current. However, there are a lot of obstacles such as caves, whirlpools and plants which may change the moving direction of a node.
We try to build a linear wireless network to monitor the water, although the node density of the network is partly under control. The energy consumption in a node may be very large if the node density is small, while the whole network energy consumption may be large if the node density is large. The lifetime of the network is defined as the time until the first sensor node or group of sensor nodes in the network runs out of energy. To enlarge the lifetime of the network, the node density should be moderate when deploying the nodes in the subterranean river.
3. Energy Efficiency
In this section, the network building is firstly described and then the energy consumption of each node is analysed. For convenience, the main notations are list in the front of this section in Table 3.
3.1. Building the Network
Consider a node deployment scheme, the basic idea of which is to place the sensor nodes one by one into the upstream of the subterranean river at the entrance. Every node then will be pushed forward by the water current. An interval is inserted between placing two sensor nodes to guarantee the former one has enough distance from the latter one. After all nodes are placed, these sensor nodes forms a moving chain, with a distance between every nodes. Through these sensor nodes, the water quality data are acquired, stored and delivered. The scientists may collect these nodes in the exit or the downstream of the subterranean river and obtain the sampled data of the subterranean water quality. However, it do not require communications between nodes. This scheme, in fact, can not build a network, and cannot realize real time or perform immediate sensing and monitoring.
Next we consider another scheme that can build a wireless network in the subterranean river. The aim is to make all sensor nodes into a linear network through wireless communications. To monitor the water quality in time, the node cannot always float with the water current and should fix itself in a suitable place. The mechanism and buoyage unit in the node is designed to implement the function. The basic method in this scheme is to place the nodes at the entrance of a subterranean river, as the former scheme does. The difference with the former scheme is that the nodes are almost deployed at the same time. When one node departs from the entrance for a suitable distance, it throws its anchor and fixes itself at the position. Then the node becomes the first static node. Another node throws its anchor after it passes the first fixed node for a suitable distance and fixes itself. One by one, those nodes are all static after enough time, with suitable distance between it and its neighbours. Thus, these nodes deploy themselves in the subterranean river and form a chain. The acquired data of water quality can be stored and transmitted between two neighbouring nodes. The data can be forwarded from the last node to the first node and the base. Before a node runs out of energy, the node can change from the stationary state to the floating state. Thus, the nodes may be recycled to be recharged. This scheme can provide real time monitoring data, which is the one we suggest.
In this scheme, a sensor node has two states, i.e., the moving state and the stationary state, any of which a node can stay in. If in the moving state, a sensor node can float with water current in the subterranean river. If in the stationary state, a sensor node stays above or beneath the water surface of the subterranean river. In this state, every node senses the environment parameters and sends the sampled water quality data to neighbouring sensor nodes. Moreover, the node may forward the data from other nodes. A node in any state can change to another state by scheduled predefined events. However, the energy consumption for a state conversion is large and the state conversion time is limited.
We consider two types of events that can change one node’s state. The first type is the election results among all nodes in the moving state. For all nodes in the moving state, an election progress will be made to determine which node will stop moving and change its state to the stationary state. The second one is the energy exhaustion event, which will take place when the energy in a node remains very low. The node can change its state to the moving state by using the residual energy, and then the node can be recycled.
The time is divided into fragments. Each fragment is composed of a number of slots. A sensor node may sense the water quality several times in each fragment and/or transmit data to other nodes in an assigned slot. The data transmission direction is unidirectional, from the node with large node ID to that with small node ID, or in the inverse direction. The transmission order of the nodes is related to the slots. In general, a node with the largest/smallest node ID transmits data in the earliest time slot.
In spite of the fact that the subterranean river bed is zigzagging, the total length of a subterranean river is denoted as L. In fact, the bends, the caves in subterranean river will influence the movement of a sensor node. For example, a bend may bring a sensor node a little resistance that the sensor node requires much time or extra power to depart from the bend. Suppose the number of the bends in a subterranean river are B and these bends are distributed in the subterranean river according to a kind of probability distribution. If the bends are averagely distributed in the subterranean river, the length of each section of the subterranean river is . In the bend, the sensor node will take more time to go through it. At the i-th bend, the extra time is .
The number of the caves that the subterranean river passes through is C. The sensor node is supposed to consume extra energy to pass one cave. At the i-th cave, the extra energy is .
Suppose there are some places such as bays, obstacles in the subterranean river that can park the sensor nodes. The nodes parking in the subterranean river will be regarded as fixed sensor nodes. The number of the parks is denoted as P. For a floating sensor node i, the probability that the node stops in the parking space j is .
Suppose N sensor nodes are deployed in the water. Each one is with an ID number, such as . The sensor node is with a battery that has an original energy . These nodes are distributed at the same time into the entry of a subterranean river whose length is denoted as L. We define an interval as a time fragment to synchronize the behavior of all nodes. And one interval is divided into S slots which is at least larger than node numbers, i.e., . The duration of each slot is
In each slot, a node can finish one data acquisition, which requires time . If the transmission speed is x, the data to be sent is D, in one slot a node should finish one transmission.
In the first fragment, all nodes are in the moving state at the beginning and start election. The node chosen in the election will fix itself and change its state to the stationary state. The election method is the node with the smallest ID succeeds. After the election event that one node is selected as a fixed node takes place, the node will be in the stationary state. The position where the node fixes itself is determined by the communication distance between this node and the sink. In the second fragment, one node in the moving state will change its state to the stationary state, and its position cannot be far away to the firstly fixed node. In each following fragment, one node in the moving state will change to the stationary state until there is no moving node or all residual nodes move to the exit of the subterranean river. Thus, a data link from the exit to the entrance of the subterranean river is built in the subterranean river.
Suppose that the velocity of the current is constant and the nodes in the moving state move in a constant velocity V. To build the data link in the subterranean river, the necessary conditions should be satisfied the follows. The number of nodes satisfies
The communication distance of a node should satisfy
The duration of the fragment should satisfy
One slot should be longer than the time one node takes to transmit certain number of data and than the acquiring time.
The first inequality Equation (1) implies that the required number of the sensor nodes should be large enough to cover the whole river. In an subterranean river with the length L, when no exceptions are considered, the boundary of the node number
where is the ceil of x. The exceptions may happen if the nodes do not work, are locked by stones or float grass and cannot move, or float into caves. When considering the effect of the possible parks in the subterranean river, the node number boundary should be
The second inequality Equation (2) ensures that the least communication distance between two nodes should be larger than the distance between the adjacent nodes in the stationary state, in order for building the communication link. One node will float for after the last node changes its state into stationary state; therefore, is the least distance between two adjacent nodes in the stationary state. In practice, due to the variation of V and the errors of , the communication distance should be set large enough.
The third condition Equation (3) enables all the nodes finish data transmission in a time fragment . An equal condition is
that is, the number of slots should be larger than or equal to that of nodes. In this way, the collision in communication can be avoided.
The fourth condition Equation (4) is necessary to avoid channel collisions in communication. A transmission should finish in one slot, which requires that the data is not too large or the transmission rate is fast enough. It is obvious that the node at the end of the link must receive and forward the acquired data of all other nodes. The result is that this node will consume more energy. The fifth condition Equation (5) ensures that the time for acquiring data is less than one slot.
3.2. Energy Consumption
In the node, the energy is consumed by communication, CPU and memory, sensors and mechanism devices. The amount of energy consumed by the sensor unit is determined by the sensors built in the node, such as the DO sensor and the temperature sensor. The energy for sensing the water quality once is a constant, thus the amount of energy consumed by the sensor unit is proportional to the sensing frequency. The sensing frequency is fixed in the scenario.
In a fragment, a node is woken up in its active slots, otherwise it is in sleep. In the active slots, a node acquires the water quality and forwards the data. In the sleep mode, all except devices are powered off except CPU and memory. The current of an ultra-low-power CPU in this mode is in a μA level. Even if in the normal mode, the current of a CPU is several hundreds μA. Thus, the power consumed by CPU and memory chips is very less and can be omitted, compared to the power consumed by the communications. The energy consumed by the sensor unit is determined by the sensors and is constant in a period of data acquiring. The energy consumed by communications is always dominant, positively proportional to the communication distance and the amount of data. Therefore, we focus on the energy consumption of communication system in this subsection.
Although various communication techniques can be adopted in the node, the effective communication distance of a node can be calculated and the transmission rate of a node x can be controlled. The amount of the data transmitted by one node D are determined by the sensors and the communication protocol. Suppose the length of the subterranean river L is estimated, and the moving velocity V is a constant. We can obtain the energy consumption in the network building stage.
We let , then let the fragment
and the node number
Thus, we have N and .
There are three stages in the lifetime of the network. They are (1) the network building stage; (2) the data acquiring and transmission stage; and (3) the network breaking stage.
In the network building stage, one node in the floating state does not acquire the data of the water quality, does not transmit and forward the acquired data, but just exchanges its state information with other nodes. After a node receives all the state information that it can receive, it will compare its node ID with other floating node IDs. If a node ID is the smallest/largest one, the node will change its state to the stationary state. This process guaranties that the node ID is distributed in the river in an increase/decrease order.
The node does not begin to acquire the environmental data as soon as it comes into a stationary state. In fact, the network will really work after any node judges that all nodes are in the stationary state. Some events may be set to drive the nodes to quit the network building stage. Many candidate events can be defined to do this, one of which is to set a time threshold. After the time threshold, all nodes enter the next stage. For example, the time threshold can be set to a value larger than N fragments, i.e., larger than .
An important thing in the first stage is that each node in the moving state should decide if it stops. Therefore, an election progress is required. The election progress only commits in the nodes still in the moving state. The election result in one fragment is that the node with the smallest/largest ID will change to the stationary state. The election process is that every node in the moving state sends its ID and state information to others in a fragment, and every node in moving state receives these messages and decides if it should stop. The nodes in the stationary state send and respond to nothing in this stage.
Each node is assigned to one slot, we assume the node sends its state information in slot and makes decision at the end of the fragment. The election progress in a node is to judge if its ID is the smallest/largest one among all IDs of the moving nodes. If yes, the node fixes itself and changes its state, otherwise the node continues to float.
The process is described by the following Algorithm 1.
| Algorithm 1 The election process in a node. |
|
From the above analysis, we can see that the least time the network building stage required is . By the first order model in wireless communication [19], the energy consumed by node i in this stage is
where is the energy required to send a bit, is the data amount in this stage, ε is the radio wave attenuation coefficient in the water, b is the communication distance, is the energy needed for a node to change its state from the moving state to the stationary state, is the probability that node i passes cave j. From this equation, it can be seen that the energy consumed by every node is different. Besides, the energy consumption is related to node number N.
In the data acquiring and transmission stage, each node acquires the environment and transmits (and forwards ) the data to the other node in a fragment. In a fragment, one node knows when it does not transmit data and acquires the environment in these slots. The energy for a node to acquire data once is denoted as . The energy consumed by nodes is composed with two parts, transmission energy and forwarding energy. If the node i forwards data in slot i, the energy consumed by node i for transmitting its acquired data is
where is the data amount every node sends in this stage. For node , the energy for receiving bits of data from node is . The energy for sending these bits of data to node is . When node is forwarding bits of data, node i can receive these data and the energy consumed for this is . Therefore, the energy consumed in node i for forwarding data to node , is
Together with the energy consumed by node i for acquiring and transmitting its data, the node consumes
For node N, the energy consumed is
For node 1, the energy consumed is
In the network breaking stage, the node just consumes the energy that makes the node changes its state, .
4. Analysis Results
In the network building stage, the energy that one node consumed is related to the data amount in this stage , the communication distance between two nodes b and the total number of nodes N. More precisely, the energy that one node consumed in this stage is positively proportional to , N and . Thus it is energy efficient to try to decrease these values in this stage. In fact, there values are not isolated.
The data in this stage is used to identify the node, so the bits of data can be obtained by
The deployed node number and the communication distance satisfy the following equation
To guarantee the communication, , the node number should satisfy
Substitute from Equation (10) and into Equation (6), the energy consumption, if the constant energy is omitted, is
From Equation (11), we can observe that the energy consumed by every node is just related to N and L.
The circuit in a node impacts the energy consumption, especially the analog power amplifier of high frequency signal, because the attenuation is larger for spreading high frequency electromagnetic wave in water than in the free space. Therefore, the energy consumption is positive proportional to the parameter ε and the value of ε may be very large in water.
The energy that one node consumed is different from other nodes. Generally speaking, the node that stops earlier will consume less energy. Therefore, the energy consumption of one node in this stage is determined by the election process. If a node with smaller ID stops earlier, this node will definitely reserve more energy.
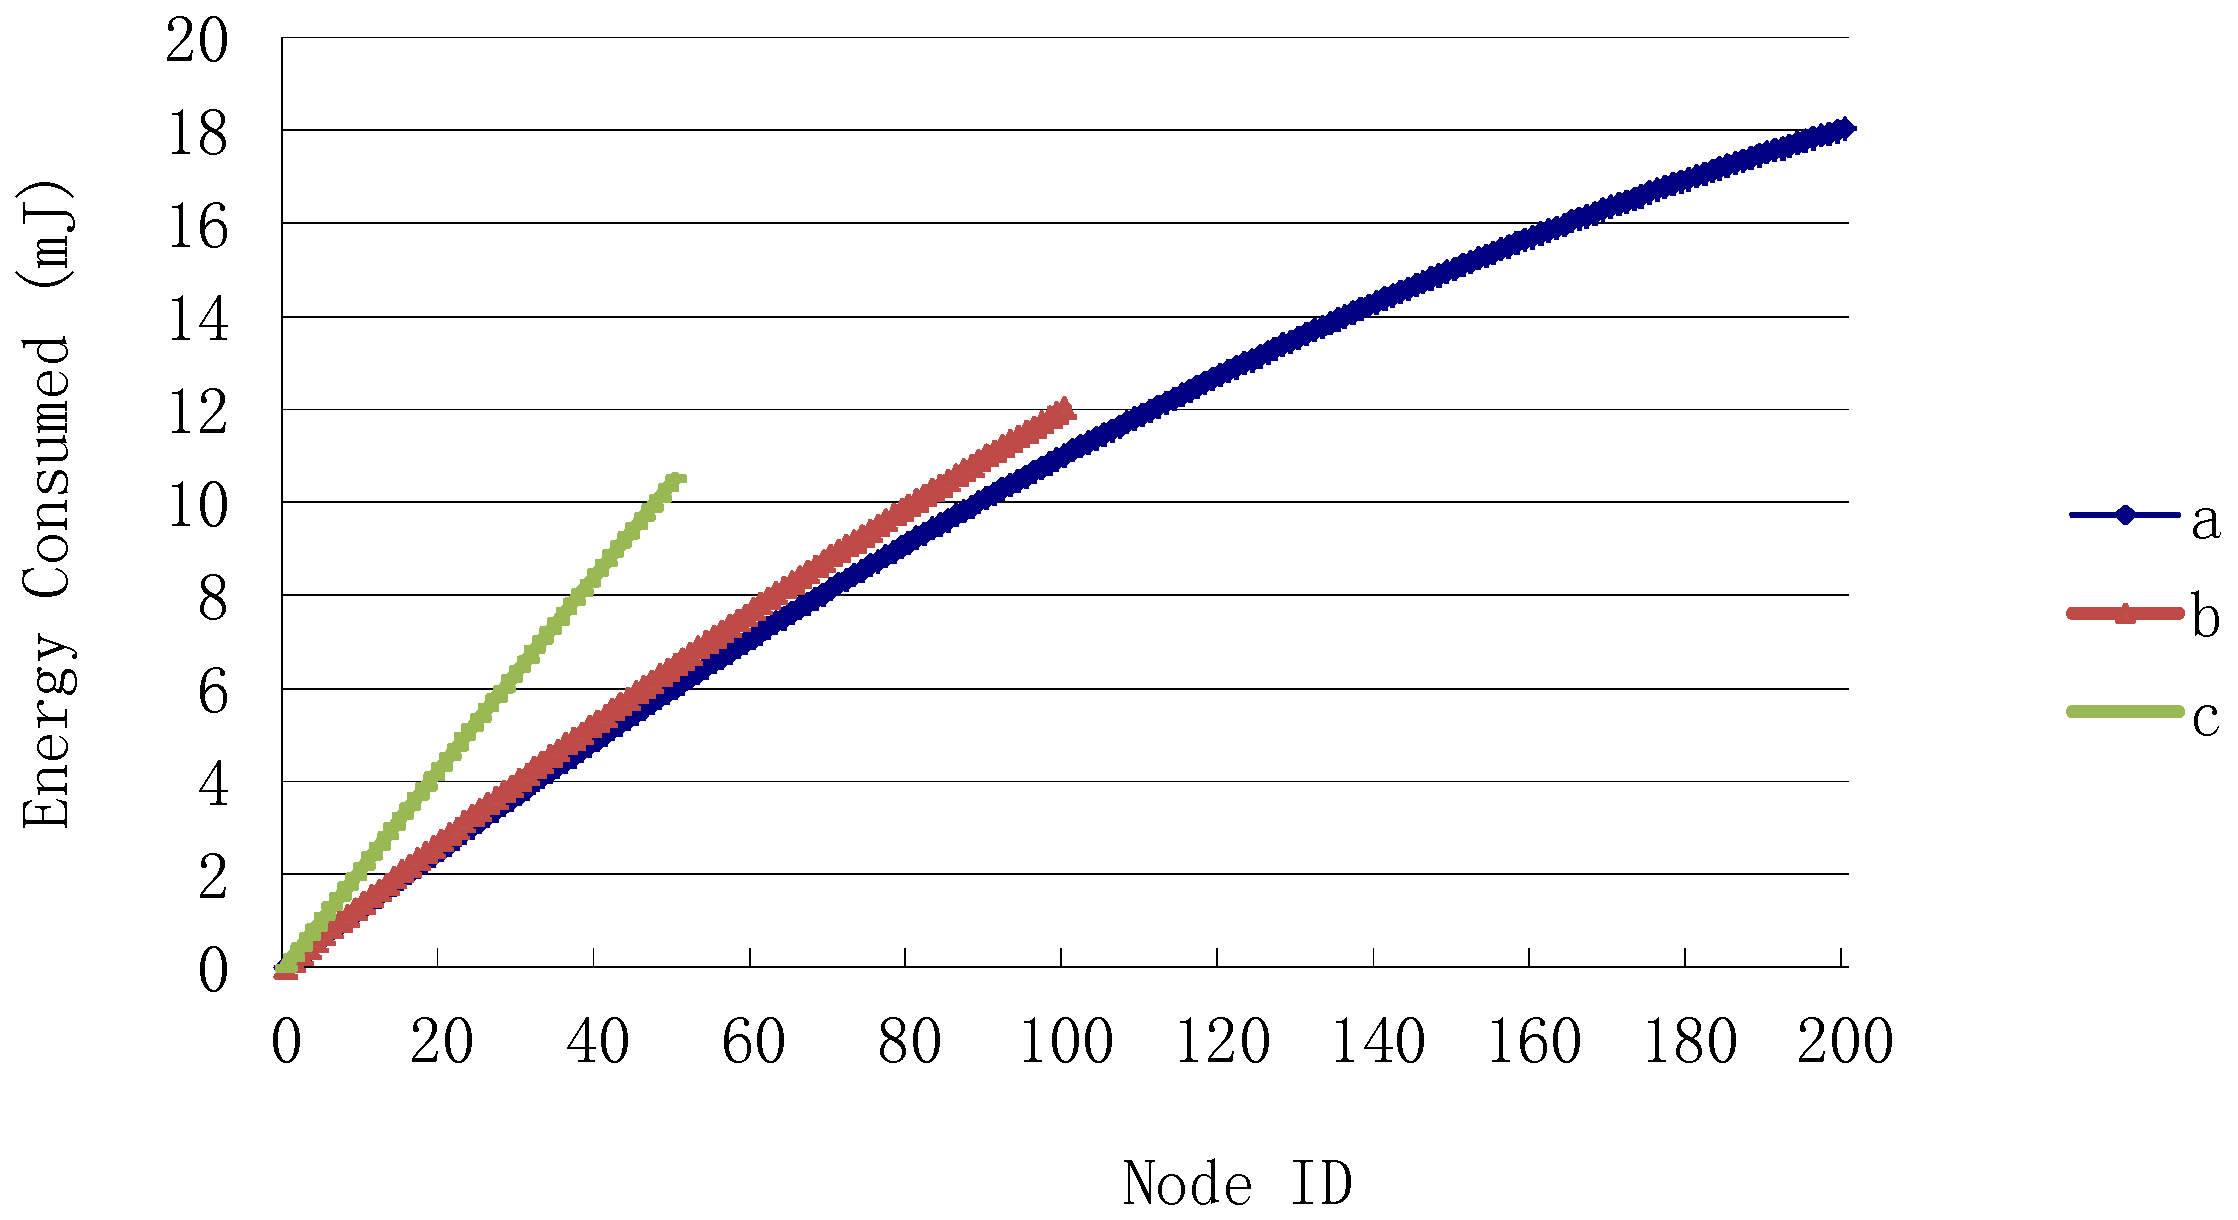
The energy consumption curve by each node is a quadratic function, as Figure 3 shows. We can have the energy increasing rate by taking the derivative of Equation (6) with respect to i,
Due to , , the energy consumption Equation (6) is increasing with respect to i, which means that the energy consumption in a node with larger ID is larger than a node with smaller ID. Moreover, the variation of energy increasing rate is linear and negative. The energy increasing rate is positively proportional to the data amount transmitted in this stage, i.e., .
The node who consumes the maximum energy among all nodes is node 200, with the energy consumption 18.04 . The node that consumes the minimum energy among all nodes is node 1, with the energy consumption 0.13 .
We have a glance at the energy consumption of every node by setting the variants a value. Let , and are constants. Here, let , . We can have the energy consumption of every node in the first stage, as shown in Figure 3 by the curve a.
If the node communication distance is farther, the node number should be less. However, the energy consumption of every node may be larger. In Figure 3, we plot the energy consumption when letting , that is, when the number of nodes is . In this case, the maximum energy consumed by node 100 is 12.02 . The minimum energy consumption is 0.14 . If letting , the number of nodes is 50, and the maximum energy consumed by node 50 is 10.51 , the minimum energy consumption is 0.22 .
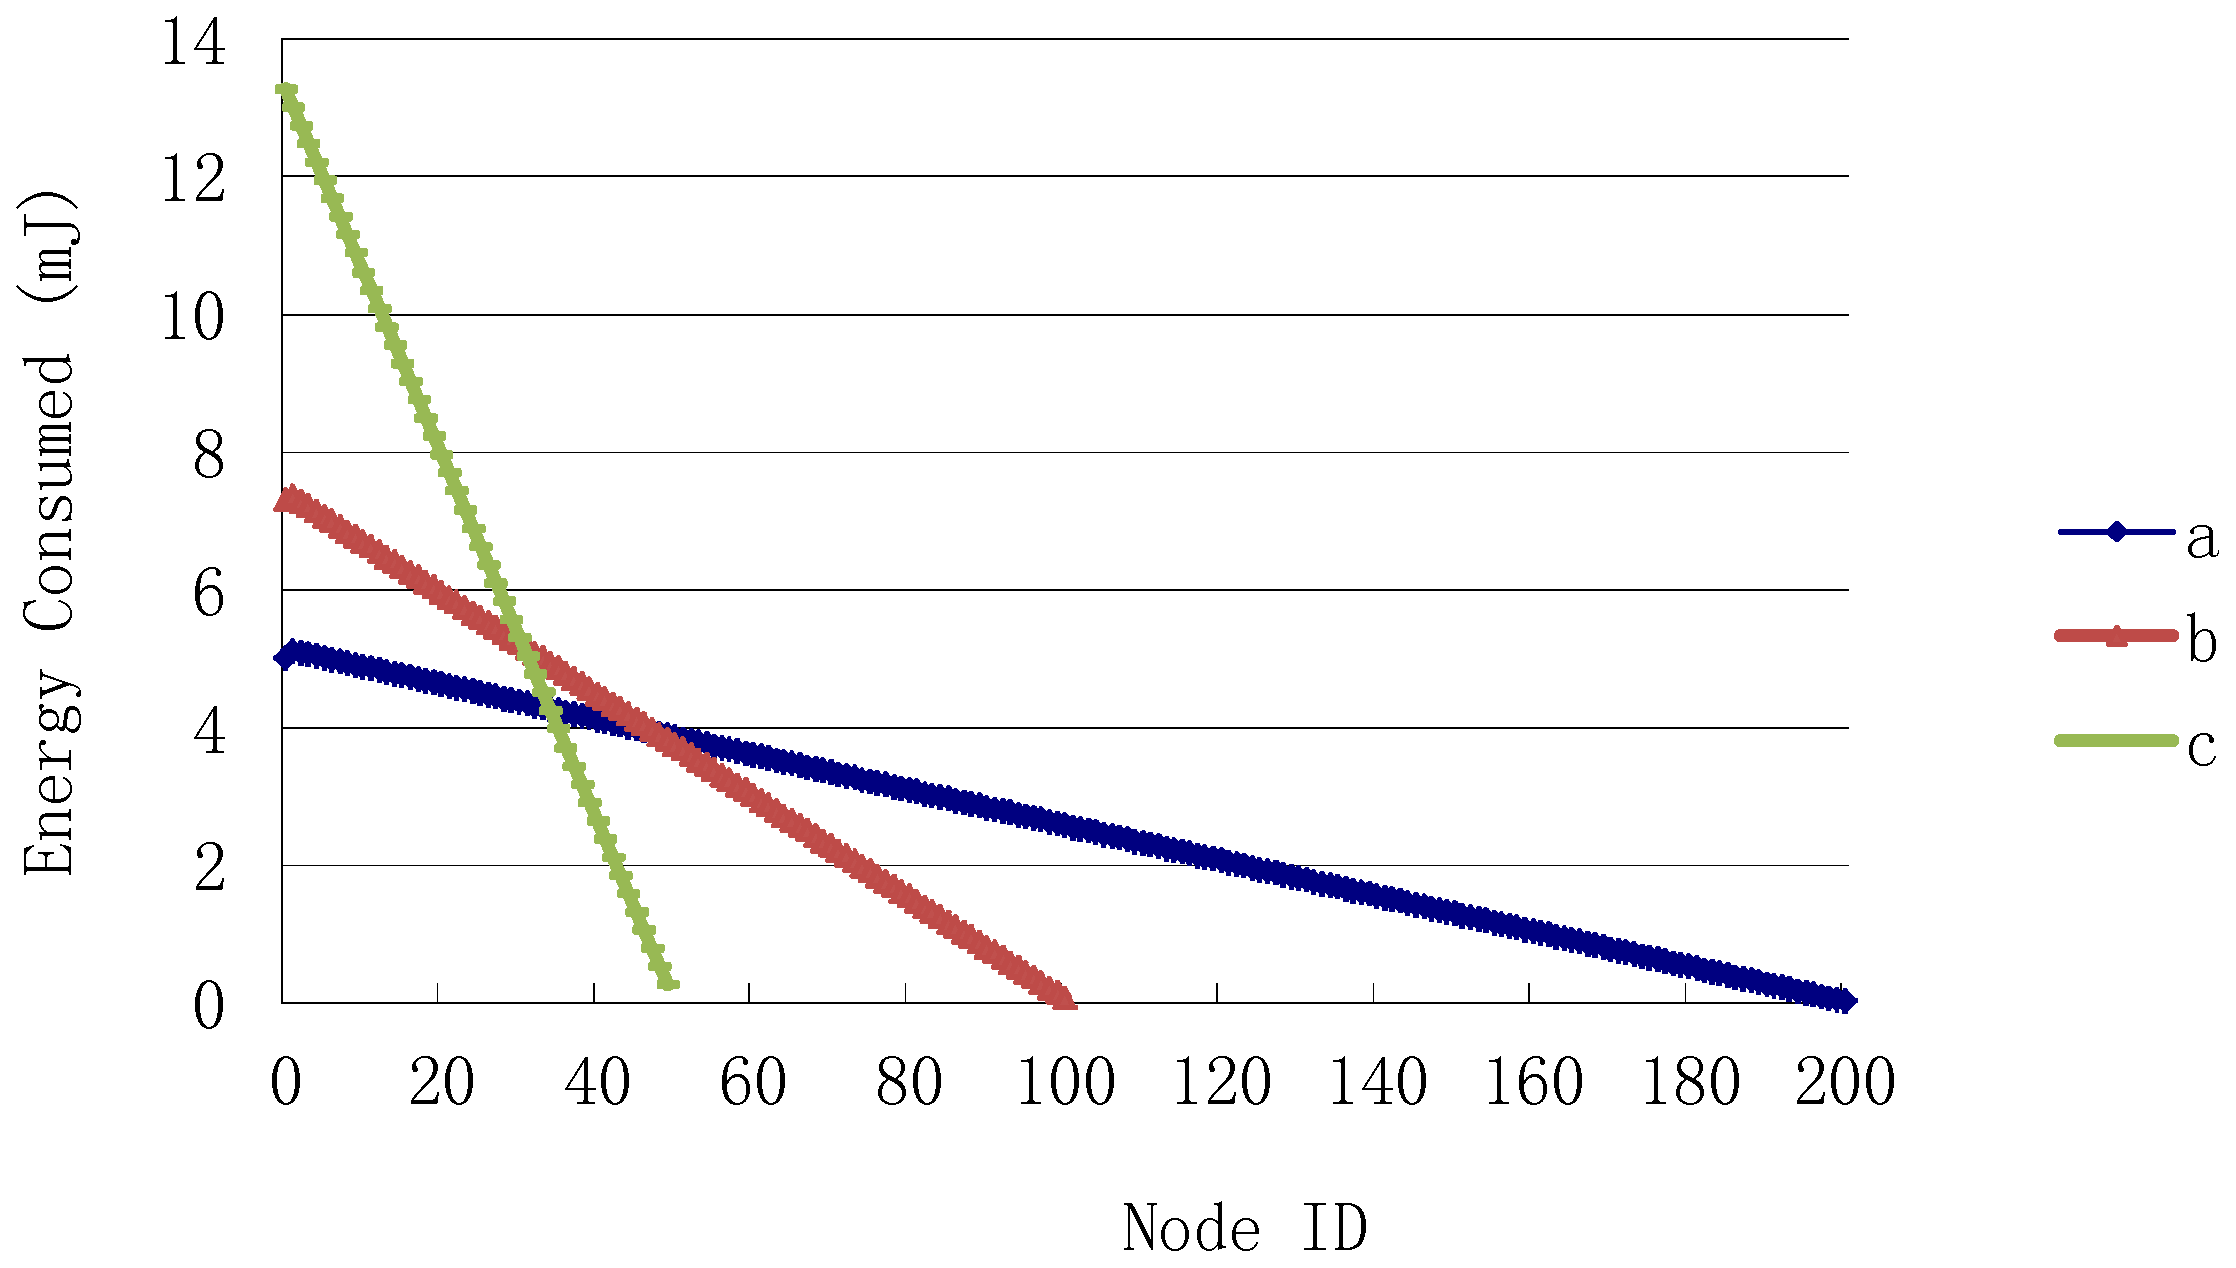
In data acquiring and transmission stage, the energy one node consumed can be obtained by substituting from Equation (10) into Equation (7). The energy consumption of every node is related to data bits. The node with larger ID consumes less energy than that with small ID. The maximum energy consumption is in node 1, for this node forwards all data from other nodes.
The increase of energy consumption in all nodes is linear with a negative rate . Let , , and , we have the energy consumption of each node in one fragment, as shown in Figure 4 by curve a. The node that consumes the maximum energy among all nodes is node 1, with the energy consumption 5.12 . The node that consumes the minimum energy among all nodes is node 200, with the energy consumption 0.0256 .
If the distance between two nodes is further, it requires the less number of nodes. However, the energy consumption of every node may be dramatically different. In Figure 4, we also plot the energy consumption in the case that letting the communication distance . In this case, the maximum energy consumed by node 1 is 7.36 . The minimum energy consumption in node 100 is 0.0736 . If letting , the maximum energy consumed in node 1 is 13.28 , the minimum energy consumption in node 50 is 0.2656 .
In Table 4, we list the typical energy consumed by communications in the network building stage and the data acquiring and transmission stage. From these results, it can be found that the maximum energy consumption in networks with 200 nodes is the largest in the network building stage, and that the maximum energy consumption in networks with 200 nodes is the smallest in the data acquiring and transmission stage. If the capacity of a node battery is larger enough, the energy consumption in the network building stage can be neglected. Thus, the lifetime is determined by the energy consumption in the data acquiring and transmission stage.
5. Discussion
The moving velocity of nodes in the network building stage is regarded to be identical to the velocity of the water flow. The water flow may sometimes be slow and sometimes fast. To ensure expected distance between two nodes in this situation, the maximum velocity of the moving node should be estimated. When the velocity of the node is small, the redundant time for a node to make a decision when it will stop moving should be provided in the network building stage. The value of the redundant time is determined by the minimum velocity of the flow. The redundant time will be longer if the velocity is smaller. We can estimate the minimum velocity and calculate the redundant time. Another candidate solution to ensure the suitable distance is to take the advantage of the received signal strength (RSS). If so, a little more energy is required.
Position locating in the subterranean river is also significant enough for scientists to undertake further research. We can strengthen the sensor node function in the sensor networks, and sense the position in the subterranean river. The technologies such as multiple antenna and electronic compass for locating may be helpful.
Although the water in subterranean rivers is fresh water, the characteristics of water in different rivers (conductivity, etc.) are different. These difference will influence the parameter setting in the wireless channel model. Moreover, the topography of each river is different. Therefore, the channel model in a subterranean river may be different from that in water. We should consider the revision of the wireless channel model.
6. Conclusions
In this work, we considered the issue of monitoring water quality in subterranean rivers by building sensor networks in them. The sensor nodes should have at least two states, the moving state and the stationary state. We designed a scheme on how to build the sensor network topology in subterranean rivers, and analyzed the node behavior in the network building stage, the data acquiring and transmission stage, and the network breaking stage. We calculated the node energy consumption in each fragment in detail and modeled the energy consumption of all nodes. We find that the energy consumed by a node is related to node number N and differs to other nodes. The analysis and the numerical results of energy consumption with detail settings showed that the node having the maximum energy consumption in the network building stage is the node with the largest node ID number, and this maximum energy consumption is less when node number is fewer. The results also showed that the maximum energy consumption in the data acquiring and transmission stage takes place in the node with the largest ID number and this maximum energy consumption is less when node number is larger.
Acknowledgments
The work described in this paper was supported by a grant from the National Natural Science Foundation of China (No. 61070197) and a grant from the self-determined research funds of CCNU (CCNU15A02019 ).
Conflicts of Interest
The authors declare no conflict of interest.
Abbreviations
The following abbreviations are used in this manuscript:
| GPS | global position system |
| CPU | central processing unit |
| DO | dissolved oxygen |
| ORP | oxidation reduction potential |
| kbps | kilobits per second |
| RSS | received signal strength |
| ID | identifier |
| ROV | remotely operated vehicle |
| AUV | autonomous underwater vehicle |
| ADC | analog-to-digital converter |
| IIC | inter-integrated circuit |
References
- Gibert, J.; Deharveng, L. Subterranean Ecosystems: A Truncated Functional Biodiversity. BioScience 2002, 52, 473–481. [Google Scholar] [CrossRef]
- Graening, G.O.; Brown, A.V. Ecosystem Dynamics and Pollution Effects in an Ozark Cave Stream. J. Am. Water Resour. Assoc. 2003, 39, 1497–1507. [Google Scholar] [CrossRef]
- Kollarits, S.; Kuschnig, G.; Veselic, M.; Pavicic, A.; Soccorso, C.; Aurighi, M. Decision-support systems for groundwater protection: Innovative tools for resource management. Environ. Earth Sci. 2006, 49, 840–848. [Google Scholar] [CrossRef]
- Graening, G.O.; Brown, A.V. Ecosystem dynamics and pollution effects in an ozark cave stream. J. Am. Water Resour. Assoc. 2003, 39, 1497–1507. [Google Scholar] [CrossRef]
- Underground River System in Karst Velly in Guangxi. Available online: http://www.karst.ac.cn/article.aspx?aid=75blue (accessed on 4 March 2016). (In Chinese)
- Gou, P.; Jiang, Y.; Lin, T.; Hu, Z.; Yang, P. Study on dynamic varation of hydological regime at inlet and outlet of typical underground river of Kast vally during a large storm. Water Resour. Prot. 2011, 27, 6–11. (In Chinese) [Google Scholar]
- Pottie, G.J.; Kaiser, W.J. Wireless Integrated Network Sensors. Commun. ACM 2000, 43, 51–58. [Google Scholar] [CrossRef]
- Yick, J.; Mukherjee, B.; Ghosal, D. Wireless sensor network survey. Comput. Netw. 2008, 52, 2292–2330. [Google Scholar] [CrossRef]
- Akyildiz, I.; Hancke, G. Dynamic Connectivity in Wireless Underground Sensor Networks. IEEE Trans. Wirel. Commun. 2011, 10, 4334–4344. [Google Scholar]
- Heidemann, J.; Stojanovic, M.; Zorzi, M. Underwater sensor networks: Applications, advances and challenges. Philos. Trans. R. Soc. A 2012, 370, 158–175. [Google Scholar] [CrossRef] [PubMed]
- Akyildiz, I.F.; Pompili, D.; Melodia, T. Underwater acoustic sensor networks: Research challenges. Ad Hoc Netw. 2005, 3, 257–279. [Google Scholar] [CrossRef]
- Akyildiz, I.F.; Wang, P.; Lin, S.C. SoftWater: Software-defined networking for next-generation underwater communication systems. Ad Hoc Netw. 2016, 46, 1–11. [Google Scholar] [CrossRef]
- Hunt, K.P.; Niemeier, J.J.; Kruger, A. RF communications in underwater wireless sensor networks. In Proceedings of the 2010 IEEE International Conference on Electro/Information Technology (EIT), Normal, IL, USA, 20–22 May 2010; pp. 1–6.
- Kelley, B.; Manoj, K.; Jamshidi, M. Broadband RF communications in underwater environments using multi-carrier modulation. In Proceedings of the 2009 IEEE International Conference on Systems, Man and Cybernetics, San Antonio, Chile, 11–14 October 2009; pp. 2303–2308.
- Palmeiro, A.; MartÃn, M.; Crowther, I.; Rhodes, M. Underwater radio frequency communications. In Proceedings of the OCEANS 2011 IEEE - Spain, Santander, Spain, 6–9 June 2011; pp. 1–8.
- EidFjuk, P.O. Underwater Radio Communication. Available online: http://users.tpg.com.au/users/ldbutler/UnderwaterCommunication.pdfblue (accessed on 30 May 2016).
- Hobbs, W.H. Earth Features and Their Meaning: An Introduction to Geology for the Student and the General Reader; Macmillan Company: New York, NY, USA, 1912; pp. 182–189. [Google Scholar]
- Puerto-Princesa Subterranean River National Park. Available online: http://whc.unesco.org/en/list/652blue (accessed on 30 May 2016).
- Tan, L.; Ge, F.; Li, J.; Kato, J. HCEP: A hybrid cluster-based energy-efficient protocol for wireless sensor networks. Int. J. Sens. Netw. 2009, 5, 67–78. [Google Scholar] [CrossRef]
Figure 1.
The hardware structure of a sensor node in subterranean rivers.

Figure 2.
The hardware structure of the wireless communication unit.
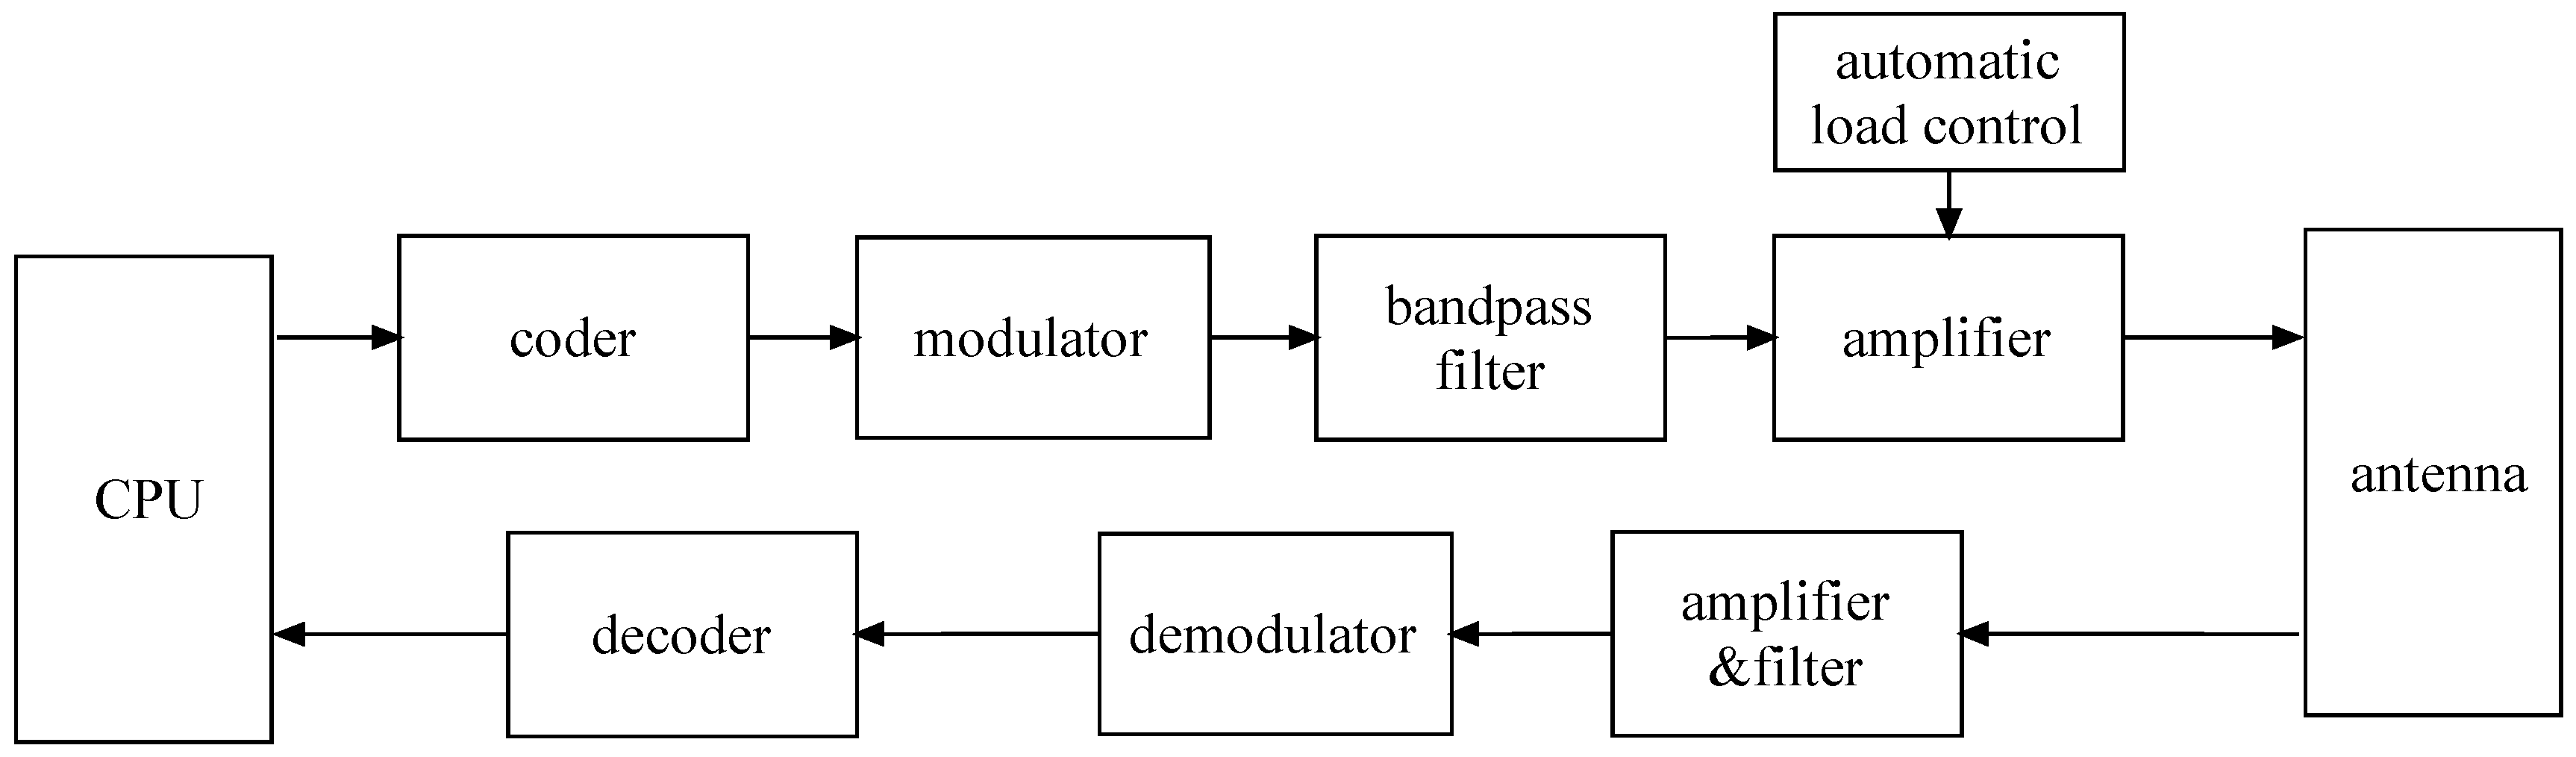
Figure 3.
The energy consumption of all nodes in the network building stage with the settings , , , and (a) ; (b) ; (c) , respectively.
Figure 3.
The energy consumption of all nodes in the network building stage with the settings , , , and (a) ; (b) ; (c) , respectively.

Figure 4.
The energy consumption of all nodes in the data acquiring and transmission stage with the settings , and (a) ; (b) ; (c) , respectively.
Figure 4.
The energy consumption of all nodes in the data acquiring and transmission stage with the settings , and (a) ; (b) ; (c) , respectively.


| Communication Paradigm | Propagation Speed | Data Rates | Communication Ranges | Channel Dependency |
|---|---|---|---|---|
| Acoustic | 1500 m/s | Kbps | km | Multi-path, doppler, salinity, sound noise, temperature, pressure, environmental |
| Optical | 3.33 m/s | Mbps | 10–100 m | Line of sight communication, Light scattering, ambient light noise |
| Radio (in ocean) | 3.33 m/s | Mbps | 10–100 m | Conductivity |
| Radio (in fresh water) | >3.33 m/s | Mbps | >100 m | Conductivity |
| Characteristics | Descriptions |
|---|---|
| Unknown water circulation | The water circulation in the subterranean river is unknown, although the entry or the exit of some subterranean rivers may be clear. This characteristic makes the moving direction of a sensor node unknown. Also we cannot know where the positions of anchor nodes or sinks are. |
| Difficult position locating | The water is wholly or partly beneath the ground surface. If a sensor node is placed under the surface, the position cannot be obtained because the signal of regular locating techniques such as Global Position System (GPS) are too weak. |
| Scalable | The sensor nodes float with the water current when they are placed into the subterranean river. Because the velocity of water stream is variable in different river section, the distribution of sensor nodes may be not uniform. The network should be scalable. |
| Notation | Meaning |
|---|---|
| L | the total length of a subterranean river |
| B | the number of the bends in a subterranean river |
| C | the number of the caves that a subterranean river passes through |
| the extra energy at the i-th cave | |
| the probability that node i stops in the park j | |
| the extra time at the i-th bend | |
| N | the number of the nodes |
| a time fragment to synchronize the behavior of all nodes | |
| the duration of a slot | |
| the time for acquiring data once | |
| x | the data transmission rate |
| S | the number of the slots in a fragment |
| D | the data to be transmitted |
| the data to be transmitted in the network building stage | |
| the data to be transmitted in the data acquiring and transmission stage | |
| the energy required to send a bit | |
| b | the communication distance of a node |
| the energy needed for a node to change its state from the moving state to the stationary state | |
| the energy needed for a node to change its state from the stationary state to the moving state | |
| the probability that node i passes cave j | |
| ε | the radio wave attenuation coefficient in the water |
| the energy for a node to acquire data once |
| the Network Building Stage | the Data Acquiring and Transmission Stage | |||||
|---|---|---|---|---|---|---|
| Max | Avg | Min | Max | Avg | Min | |
| 18.04 | 10.40 | 0.13 | 5.12 | 2.573 | 0.0256 | |
| 12.02 | 6.40 | 0.14 | 7.36 | 3.717 | 0.0736 | |
| 10.51 | 5.44 | 0.22 | 13.28 | 6.77 | 0.2656 | |
© 2016 by the authors; licensee MDPI, Basel, Switzerland. This article is an open access article distributed under the terms and conditions of the Creative Commons Attribution (CC-BY) license (http://creativecommons.org/licenses/by/4.0/).
Share and Cite
MDPI and ACS Style
Ge, F.; Wang, Y. Energy Efficient Networks for Monitoring Water Quality in Subterranean Rivers. Sustainability 2016, 8, 526. https://doi.org/10.3390/su8060526
AMA Style
Ge F, Wang Y. Energy Efficient Networks for Monitoring Water Quality in Subterranean Rivers. Sustainability. 2016; 8(6):526. https://doi.org/10.3390/su8060526
Chicago/Turabian StyleGe, Fei, and Yuanni Wang. 2016. "Energy Efficient Networks for Monitoring Water Quality in Subterranean Rivers" Sustainability 8, no. 6: 526. https://doi.org/10.3390/su8060526
Note that from the first issue of 2016, this journal uses article numbers instead of page numbers. See further details here.