Article

School Facilities and Sustainability-Related Concepts: A Study of Hellenic Secondary School Principals’, Teachers’, Pupils’ and Parents’ Responses

School of Chemical Engineering, National Technical University of Athens, 9 Heroon Polytechniou st. Zographou Campus, Zographou 15780, Greece
*
Author to whom correspondence should be addressed.
Deceased.
Sustainability 2016, 8(4), 311; https://doi.org/10.3390/su8040311
Submission received: 9 February 2016 / Revised: 15 March 2016 / Accepted: 22 March 2016 / Published: 29 March 2016

Abstract

:
Effective building environment sustainability frameworks and practices need to take users’ opinions into account. For this purpose, a survey questionnaire was developed and the “Panhellenic survey of school spaces, materials and environmental-comfort conditions in secondary schools and perceptions, stances and attitudes of pupils, teachers, principals and parents towards sustainable construction and the selection and use of materials in schools that are friendly to the environment and human health” was conducted nationwide with a random stratified sample of 170 Hellenic public secondary schools. Selected findings are presented and discussed here. These show that existing school facilities are primarily rated as good and that selection and use of materials friendly to the environment and human health are extremely important. User groups believe that they should participate in planning/selecting sustainable solutions for schools. An Index of 10 School Environment Desired Outcomes associated with environmentally friendly and health-friendly materials selection and use was devised. Relevant factors were extracted and interpreted. The research establishes users’ subjective opinions that may be considered and integrated into procedures for improving school buildings, assessing and selecting environmentally friendly materials and implementing strategies for sustainable school design, building and operation.

1. Introduction

In 1987, the landmark publication Our Common Future of the United Nations World Commission on Environment and Development defined sustainable development as “… meeting the needs of the present without compromising the ability of future generations to meet their needs.” This is the underlying principle of subsequent and ongoing research and efforts made to balance and regulate human activities and interaction with the environment in various sectors so as to face a number of issues such as finite material and energy sources, deterioration of environmental quality and climate change. One of these sectors in which sustainable development, otherwise known as sustainability, is increasingly becoming important is the building and construction sector [1] (pp. 1, 15, 30). It has been estimated that buildings use 40% (three billion tons) of the total global amount of raw materials extracted annually, 16% (15 trillion gallons) of all potable water per year and 41% of energy use [2].
At the first International Conference on Sustainable Construction of the Conseil International du Bâtiment (CIB) in 1994, the goal of “sustainable construction” was defined as “…creating and operating a healthy built environment based on resource efficiency and ecological design” [1] (p. 6). In recent years there has been a distinct growth of research work and applications in this area stemming from the need to balance environmental, social and economic factors in order to achieve healthy and productivity-enhancing built environments with low energy use and reduced environmental impacts. A review of literature shows that the terms green, sustainable, environmental, ecological and others are being used interchangeably to characterize sustainable construction/building. Also, a multitude of approaches is evident in the various principles, standards, methodologies, tools, and classification systems that have been developed by academics and professionals aiming at best practices in regards to sustainable building [3].
Sustainability on a global level depends on ideas generated in local contexts as these contexts, which may differ greatly, seem to profoundly shape costs and benefits associated with sustainability initiatives. Specific approaches relate to the culture, the climate, the building industry and other attributes and priorities of the country or context involved [4,5,6]. Gradually the state-of the-art phase of sustainable construction has entered the stage of standardization, and from around 2000 onwards the International Standards Organization (ISO), the European Committee for Standardization (CEN), and national and other bodies have started to develop standards to incorporate “harmonized” sustainable principles into construction and to provide frameworks and methodologies for the environmental, social and economic performance of buildings, building components and construction products. Also evident through these developments is the increasing importance and the implementation of Life-Cycle Assessment (LCA) in the building and construction sector [1] (p. 274), [6].
One can discern initiatives based on particular circumstances, such as the SusCon Building Design and Assessment Tool, developed for Greece and Cyprus, which is based on LCA methodology and estimates the eco-friendly percentage of a construction work [7]. On the other hand, one can see attempts to “internationalize” assessment and certification systems, e.g., the Building Research Establishment Environmental Assessment Method (BREEAM) which originated in the UK in 1990 and Leadership in Energy and Environmental Design (LEED)® which was released in 2000 in the USA, so that they may be deployed in countries beyond that of their origin [5]. Furthermore, an orientation towards specialized types of built environments has evolved (e.g., residential buildings, office buildings, hospitals). Schools and education facilities constitute such a specialized type of built environment and have become an area of research interest.
School, in the developed world, is a place where the average person spends a considerable part of his life and particularly his younger, formative years. Studies have shown that environmental factors, such as lighting, thermal comfort, acoustics, aesthetics and indoor air quality in classrooms and the school built environment in general may affect the health, performance and behavioral attitudes of pupils and teachers, learning outcomes and the whole educational process [8,9,10,11,12,13].
Given the importance of environmental factors and human interaction related to the built environment as well as the issue of sustainability, initiatives and practices have flourished world-wide that are associated with environmental assessment and sustainable construction-retrofitting-functioning of schools and whole-school sustainability education through the school setting [14]. Relevant strategies and application of principles and technologies have resulted in paradigms such as: “Sustainable Schools” [15,16], “Green Schools” [17,18], “Healthy Schools” [19], “High Performance Schools” [20] and “EnergySmart Schools” [21].
Contextuality is fundamental to these and other paradigms, hence the differentiated approaches and content frameworks. In regards to school building and management, techniques are implemented aiming more or less at objectives such as: energy and water efficiency, bioclimatic design, enhanced air quality, use of non-toxic and low-emitting materials and products, litter and waste minimization, recycling, greening of school grounds, improved lighting and acoustics. Often, the utilization of the school as a teaching tool is also an aim [14,15,16,17,18,19,20,21]. It must also be noted that the United Nations established the Decade of Education for Sustainable Development (2005–2014) to encourage the understanding of sustainability and participation in related practices [22].
Although schools with sustainable or “green” features figure as a relatively recent development, there is a considerable body of research that links specific building features, which are treated accordingly in the “green” design of schools, with benefits for learning, human health and productivity as well as long-term economic benefits [23,24].
It has been claimed by researchers that citizen and stakeholder participation and involvement is constructive in policy formation and decision-making in situations where technological applications and infrastructure work entail impacts and consequences on human society and the environment, thus confirming a technologically sound solution as a socially consensual decision [25,26]. In the realm of the built environment, participatory processes involving building and facility occupants and users may contribute in a variety of ways to substantiate relevant contextual elements. Occupant reporting of the condition of the building and its components and expression of opinion on needs, shortcomings and desired attributes may help in determining priorities and in developing optimization strategies [27]. Conduct of a “green building charrette” that promotes public consultation can be crucial to modeling and designing new facilities, to judging public demand and foreseeing attitudes towards innovative features and to encouraging the interest and the modes of user behavior required for facility operations [1] (p. 13). Subjective evaluation of environmental aspects of the built environment, as perceived by occupants, can be utilized along with objective measurements to quantitatively assess acceptance and levels of comfort and to establish criteria for the aspects under study [28,29]. In these processes, surveys and questionnaires are well-accepted methodological tools, used either exclusively or in a combined-tools approach, to collect relevant information in regards to workplaces such as offices, schools, etc., and occupant interaction [30,31,32,33].
It is held by researchers that sustainability increases on a wider scale as an aggregated result of applications and innovations taken at the community level. The concept of “community” in the broadest sense pertains not only to place but also to communities of practice, professional affiliation, shared interests and networks, as well as virtual communities [34]. In a school setting, principals, teachers, pupils and parents are the most directly associated groups in terms of users/occupants of the facilities. Statutorily, they comprise the school community in regards to their respective organized space, i.e., school, but are also a subset of a general population comprised of all school communities that can be defined at a regional, national, or international level. Therefore, school communities and their thoughts and actions can be vital in furthering the cause of sustainability in schools.
Research literature shows that studies have been conducted in schools investigating environmental quality using objective physical methods of measurement and subjective responses of school occupants. In regards to the context of Hellenic schools, studies on air quality have shown, in some cases, high or excessive levels of chemical pollutants in relation to permitted limits [35,36,37,38] while other studies have confirmed high levels of noise in some schools [35,39]. The quality of school facilities has been rated by occupants or the public more or less as “average” [40,41,42,43]. Thermal comfort was found under the considered limits which results in heat stress [36]. In general, Greece is among the European countries with an extremely low level of recovery of materials from construction and demolition waste for reuse or recycling [44]. It must be noted that Buildings Infrastructure S.A., into which the former School Building Agency and other bodies merged, is the Hellenic national agency responsible for all building infrastructures of the public sector including public primary and secondary schools and tertiary education institutions. In recent years, it has taken initiatives such as asbestos removal from 740 primary and secondary schools and new school construction incorporating bioclimatic principles and the monitoring of CO2 emissions. In 2008, it released Guidelines for Bioclimatic Design of School Buildings in which general guidance is given. In these, construction products and materials are viewed as elements of passive bioclimatic design [45]. However, there is a lack of studies in regards to how Hellenic schools are evaluated by their occupants and on occupants’ views of sustainability in schools.
The purpose of this study is to investigate the existing physical state and environmental quality of Hellenic public secondary school facilities and the importance of sustainable construction and the use of materials that are friendly to the environment and human health in schools. To this means, a suitable instrument in the form of a survey questionnaire was developed. The investigation is based on subjective evaluation and information provided by school principals, teachers, pupils and parents/guardians. This paper focuses on the selected questions posed, and aims to identify factors and criteria that are important according to subjects’ perceptions, attitudes and opinions, when considering existing school facilities and their functioning and the perspective of sustainable construction and environmentally friendly materials in schools. The objective of the survey is not only to attain new information but to establish the questionnaire as a reliable and effective tool through which community participation can be implemented for initiatives and decision-making in regards to school buildings and sustainability. Additionally, in the paper, it is discussed how the survey and its findings may be beneficial to assessing, planning and optimizing school environments in relation to sustainability and the selection of materials in schools.

2. Materials and Methods

2.1. Research Considerations

For the purposes of this research, school facilities are viewed as a distinct type of built environment and are defined broadly as the material and technical infrastructure and its physical environment, constituting a specialized spatial and functional context for formal education, and are comprised of the school grounds, buildings, furniture, areas for specialized teaching and auxiliary use, as well as all portable equipment [46,47].
An exploratory review of research literature on environmental assessment and sustainable building practices was made, in order to determine and specify the study framework and research questions and to relate them to school facilities. In particular, the context of Hellenic schools was examined so as to ascertain existing issues and under-investigated questions [35,39,40,42]. From research conducted, no comprehensive survey questionnaire was found which could be utilized in Hellenic schools and that addresses both the existing school environment and sustainable construction and materials in schools. Thus, a written questionnaire was developed, specifically focused on these two broad domains.

2.2. Survey Development and Administration

A survey was conducted with an administered questionnaire being the exclusive tool of research so as to effectively obtain data at a certain point in time from a large population with high overall reliability [48]. The survey was entitled “Panhellenic survey of school spaces, materials and environmental-comfort conditions in secondary schools and perceptions, stances and attitudes of pupils, teachers, principals and parents towards sustainable construction and the selection and use of materials in schools that are friendly to the environment and human health”.
There was separate customization for each user group, i.e., principals, teachers, pupils and parents/guardians. The questionnaires were developed taking into account pre-existing related research, tools and general data pertaining to the research topic [49,50,51,52,53] and finalized with amendments resulting from the pilot study of the questionnaires in order to secure their validity and comprehensibility. There were 43 questions for the principals, 32 for the teachers, 32 for the pupils and 23 for the parents/guardians. Most questions elicited a rating level using mainly a five-point Likert-type response scale and some were filter questions. Therefore, mainly structured response formats were used but, in a few questions, unstructured text-based response formats were employed.
The survey was nationwide and conducted in a representative random sample of 170 public day-functioning secondary schools consisting of the three general types of schools at this level, i.e., Lower Secondary Schools (Gymnasia), General Upper Secondary Schools (Genika Lykeia—formerly Eniea Lykeia) and Vocational Upper Secondary Schools (Eppagelmatika Lykeia—formerly Technical Vocational Schools). The representativeness of the sample of schools was attained through stratified random sampling from all of the precincts of the country and in proportion to the total number of day-functioning secondary schools and the school type. Thus, from each of the 13 administrative precincts one representative prefecture was selected, i.e., the prefecture with the largest number of day-functioning secondary schools. The sample size corresponds to 10.14% of the school statistical population which numbers 1676 schools. The survey was conducted between March 2006 and June 2007 upon receiving the required approval of the Ministry of Education, Research and Religious Affairs and questionnaires were sent to schools after contacting them and securing their consent to participate in the survey. The same user-group questionnaire was used in all three types of secondary schools.

2.3. Statistical Analysis

Statistical analysis was carried out with SPSS for Windows, versions 13 and 17. Most of the questions in the questionnaires for all four user groups entailed ordinal, interval and nominal variables. For these, response frequencies were obtained and non-parametric One-sample Chi-square tests were performed for the testing of hypotheses. Also, independence of variables was investigated through the Pearson Chi-square test and Likelihood ratio. Phi statistic and Cramer’s V were used to measure the strength of association between variables in the Chi-square analysis with 0 indicating completely independent variables and values close to 1 indicating strongly associated variables. In this paper the results presented for various variables include their relation to: (a) derived school-building age (DSBA), categorized in relation to the year 1979, when the national Thermal Insulation Regulation (TIR) was put into effect and was withstanding when the survey was carried out and (b) thermal insulation-requirements zone (TIRZ) of the prefecture in which the school is located, classified according to the TIR. The TIR is outlined in Appendix B. The criterion of low-count cells, i.e., expected frequency <5 not exceeding 25%, was used. Thus, selection of cases was used in some crosstabulations so as to obtain a more valid overall Chi-square value [54]. The fact that the sample corresponds to over 10% of the population, a level which is generally regarded as a sample size threshold for inferential statistics in descriptive and behavior-related research [55,56], permits generalization of findings.
Questions with a five-point Likert-type response scale were regarded as interval variables. In particular, questions linked with knowledge on environmental issues had scale points labeled with both a numerical score and a worded judgment beginning from 1 which represents the lowest level, e.g., Unimportant, and ending at 5, which represents the highest level, e.g., Extremely Important. This type of labeling serves to make more meaningful to the respondent the rating he or she is giving [57], [58] (p. 149). Variables can be treated as an interval variable when each scale point corresponds to an interval, equally spaced on all five points of the scale [59]. Furthermore, for Likert-type items, the scores on items constituting the scale can be summed to give an overall score [57].
In order to compare the four user groups for questions in common, the user group is a categorical variable. In the case where the question variable is dichotomic or categorical, the Pearson Chi-square test was carried out to compare groups [54]. In cases where the question variable is an interval variable, One-Way Analysis of Variance (ANOVA) is suitable [60]. ANOVA requires normal distribution of the sample means. This is the case in sample sizes of 30 and over, due to the central limit theorem, even if the population is non-normally distributed [59]. In this survey, the overall sample size of schools and user-group sample sizes were considerably larger than 30 and therefore ANOVA was carried out so as to compare user group sample means and find evidence to infer that the means of the corresponding population distributions also differ, if this was the case. Means comparisons were made for a significance level of 0.05, and for calculation of the F ratio (between-groups mean square divided by within-groups mean square), Robust Tests of Equality of Means were implemented giving Welch’s F and the Brown-Forsythe F. In order to identify which groups differ significantly from each other, Post Hoc Multiple Comparisons were made using the Scheffé test and Tukey honest significant difference (HSD). Also, Levene’s test for homogeneity of variance was employed to indicate whether variances for each of the groups differ significantly. The three assumptions underlying ANOVA were checked and found to apply. In regards to the assumption of homogeneity of variances, considering the largely unequal sample sizes of the four groups, this was not violated because although Νmax/Nmin > 4:1, Vmax/Vmin ≤ 3:1 which means heterogeneity of variances does not create a problem for ANOVA [61].
Two interval variables presented in this paper for which ANOVA was conducted were also examined from a different perspective, i.e., as ordinal variables. Therefore, for comparison of the four user groups, the Kruskal-Wallis test is suitable. This is a non-parametric test that determines if there are statistically significant differences between user groups in regards to the question variable under examination. However, this test does not discern between which groups these differences occur. In general, as a non-parametric test, the Kruskal-Wallis test is not as powerful as ANOVA [62].
Factor Analysis and specifically Principal Components Analysis (PCA) was conducted in multi-item questions to identify the principal components underlying the structure of the data, which, as new uncorrelated variables, could replace the original interrelated variables while reducing the dimensionality of the original variables’ set [63]. One of these multi-item questions, common to all four user groups, is presented in this article. In the statistical analysis, the relatively few “I Don’t Know” responses to this question could be treated as “No response” (NR), thus leaving the responses of the five-point Likert-type scale for Principal Components Analysis which was used to identify the components underlying the desired outcomes for the school when the selection and use of environmentally friendly and health friendly materials is the issue of concern. The following criteria were utilized in deciding the number of retained components: (a) the first k components which explain a “large” proportion of total variance, i.e., 70%–80%; (b) components in the correlation matrix with eigenvalues greater than 0.7, which, as Joliffe (1972) puts forth, is better than the rule of thumb cut-off at 1; (c) examination of the scree plot (eigenvalues versus the component number) for the “elbow”, i.e., the point after which the eigenvalues decrease more slowly and explain little more of the variance; and (d) consideration of how sensible and useful the component’s interpretation is [63]. The key elements of the resulting total statistic analysis are presented in this article, such as initial investigation of the factorability of the 10 items, the Kaiser-Meyer-Olkin measure of sampling adequacy, Bartlett’s Test of Sphericity, diagonals of the anti-image correlation matrix, Total Variance Explained, Extraction of Components, Rotated Component Matrix and reliability analysis (Cronbach’s Alpha).

3. Results

The results that follow pertain to selected questions of the survey and so represent a part of the survey and the statistical analysis that was carried out.

3.1. Sample Characteristics

The sample had the following characteristics:
  • School response rate: 167 out of 170 schools (98.23%). System-missing values (SM) = 3.
  • School type: 86 Lower Secondary Schools (51.5%), 60 General Upper Secondary Schools (35.9%) and 21 Vocational Upper Secondary Schools (12.6%).
  • Type of school area: 139 schools (83.2%) in urban areas and 28 (16.8%) in rural areas in accordance to the Hellenic Statistical Authority (EL.STAT) definitions which are in Appendix A.
  • User groups’ sample sizes and participation are given in Table 1.
  • Thermal insulation-requirements zone (TIRZ) of the school’s prefecture: 25 schools (15%) in TIRZ A, 87 (52.1%) in TIRZ B and 55 (32.9%) in TIRZ C according to the national Thermal Insulation Regulation (TIR) of 1979 [64] which was in effect at the time of the survey administration.
  • School building age was obtained through the principals’ questionnaire which enquired about the year of completion of the school’s construction. The answers were allotted into their corresponding decades and the resulting distribution is presented in Table 2. The ongoing decade in which the survey was conducted (2000–2010) is modified by the year 2006 as the upper boundary, since this year marked the commencement of questionnaire administration. As it is evident in Table 2, apart from SM = 3, there are also missing values because of No Response (NR) to the specific question on the part of the 167 participating principals, and thus NR = 26.
  • Derived School Building Age (DSBA): 54 “Old” schools (38.3%) and 87 “New” schools (61.7%) for n = 141 (SM = 3, NR = 26), discerned in two categories in relation to the mandatory enforcement of the NTIR in 1979 [64].
  • Principals were asked about the presence of heating and cooling apparati in the school. Some form of heating exists in 100% of the schools whose principals responded to the particular question (n = 165) in contrast to the non-existence of mechanical cooling devices in the 46.9% of schools whose principals responded to the relative question (n = 160).

3.2. Selected Survey Results on the Environmental Quality of Existing School Facilities

Through users’ perceptions, attitudes and opinions on their specific school facilities, the first section of the survey questionnaire primarily investigates school building quality, its construction materials and equipment materials along with other school environment aspects that are rated, such as thermal comfort, air quality, acoustics, lighting, building functionality and aesthetic quality. Information is collected on building problems, repairs and refurbishments, indications of the sick building syndrome, disturbances from the surrounding environment and the type of improvements suggested for the school facility by survey participants.
The following results correspond to one of the questions where subjects were asked to rate the quality of their school building, its construction materials and its equipment materials. It was posed to all four user groups and subjects rated it on a given five-point Likert-type scale. Because parents are the least direct user group of the four, a further response option of “I don’t know” was included for more accurate and truthful ratings.
  • The percentages of resulting frequencies and Non-parametric Chi-square tests on frequencies are shown in Table 3.
  • One-Way ANOVA: The parents/guardians’ “I don’t know” response was excluded and, with desired sig. = 0.05, statistically significant differences in variances were found between user groups (Levene statistic (3, 2169) = 5.043, p = 0.02) in regards to the rating of school building quality, its construction materials and equipment materials. However, no statistically significant differences in means were found between user groups for this variable, even when conducting Robust Tests of Equality of Means (Welch’s F (3, 640.310) = 1.805, p = 0.145 and Brown-Forsythe F (3, 1432.636) = 2.030, p = 0.108).
  • Pearson’s Chi-square test of independence: This was performed for the above variable in each user group in relation to TIRZ and DSBA with desired sig. = 0.05. The variable was found independent of TIRZ with p > 0.05 in all four user groups. Table 4 shows the relationships of dependence found with DSBA. Where df < 5, the test was performed with a selection of cases. Detailed crosstabulations, Chi-square tests and symmetric measures for the variable’s dependency in relation to DSBA are in Tables S1–S4 of the Supplementary Materials file.
  • Kruskall-Wallis test: This would be appropriate if the variable had been considered ordinal. In that case, χ² (3, 2173) = 5.280, p = 0.152 shows no statistically significant differences in means between user groups.

3.3. Selected Survey Results Relating to Sustainable Construction and Environmentally Friendly Materials in Schools

Through users’ perceptions, attitudes and opinions on sustainable construction and environmentally friendly and health-friendly materials and products used in schools, the second section of the survey questionnaire primarily investigates how familiar users are with these terms and if they are interested in learning more on these concepts and how important the selection of these materials/products is for schools and how important school-community participation is in planning/selecting “ecological” solutions. Subjects also rate the importance of given environmental, social and economic impacts associated with sustainable school construction and selection of environmentally friendly and health-friendly materials/products and how much school design and quality influences teaching and learning. They also state if they think “green schools” can function as teaching tools.
The following selected results are for three questions belonging to the second section of the questionnaire. Once again, a five-point Likert-type scale was used in questions involving subjects’ ratings and, where necessary, an “I don’t know” option was given.

3.3.1. Importance Rating of the Selection and Use in Schools of Environmentally Friendly and Health-Friendly Materials

  • The percentages of resulting frequencies and Non-parametric Chi-square tests with frequencies on the importance of this issue for all user groups are shown in Table 5.
  • One-Way ANOVA: The “I don’t know” response was excluded and, with desired sig. = 0.05, statistically significant differences in variances (Levene statistic (3, 2169) = 50.977, p = 0.000) were found between user groups in regards to the rating of the importance of selection and use in schools of environmentally friendly and health-friendly materials. Additionally, statistically significant differences in means between user groups for this variable were found with Robust Tests of Equality of Means giving: Welch’s F (3, 665.920) = 26.909, p = 0.000 and Brown-Forsythe F (3, 1587.218) = 20.935, p = 0.000. Furthermore, post-hoc multiple comparisons based on the Scheffé test and the Tukey HSD test with desired sig. = 0.05 determined three statistically significant means’ differences, respectively: 0.291 between teachers (Mean = 4.79) and pupils (Mean = 4.50), 0.230 between teachers (Mean = 4.79) and parents (Mean = 4.56) and 0.161 between principals (Mean = 4.66) and pupils (Mean = 4.50).
  • Pearson’s Chi-square test of independence: This showed that the above variable was independent of TIRZ with p > 0.05 in all four user groups and independent of DSBA with p > 0.05 in three user groups: principals, teachers and parents/guardians. However, importance of selection and use in schools of environmentally friendly and health-friendly materials is not independent of DSBA in the pupils’ group with (χ² (5, 768) = 12.015, p = 0.035). Details of this dependency are in Table S5 in the Supplementary Materials.
  • Kruskall-Wallis test: This would be appropriate if the variable had been considered ordinal. In that case, χ² (3, 2173) = 42.549, p = 0.000 shows statistically significant differences in means between user groups.

3.3.2. Opinions on School Community Participation in Planning and Selecting “Ecological” Solutions for School Facilities and Materials Used in Them

Principals, teachers and parents/guardians were asked this question and four response options were given. Frequency percentages and the Non-parametric Chi-square tests are in Table 6.
Along similar lines, pupils were asked a customized question on whether they believe that pupils should participate in improving the school environment so that it may become more attractive and ecological. Frequency percentages and the Non-parametric Chi-square test are shown in Table 7.

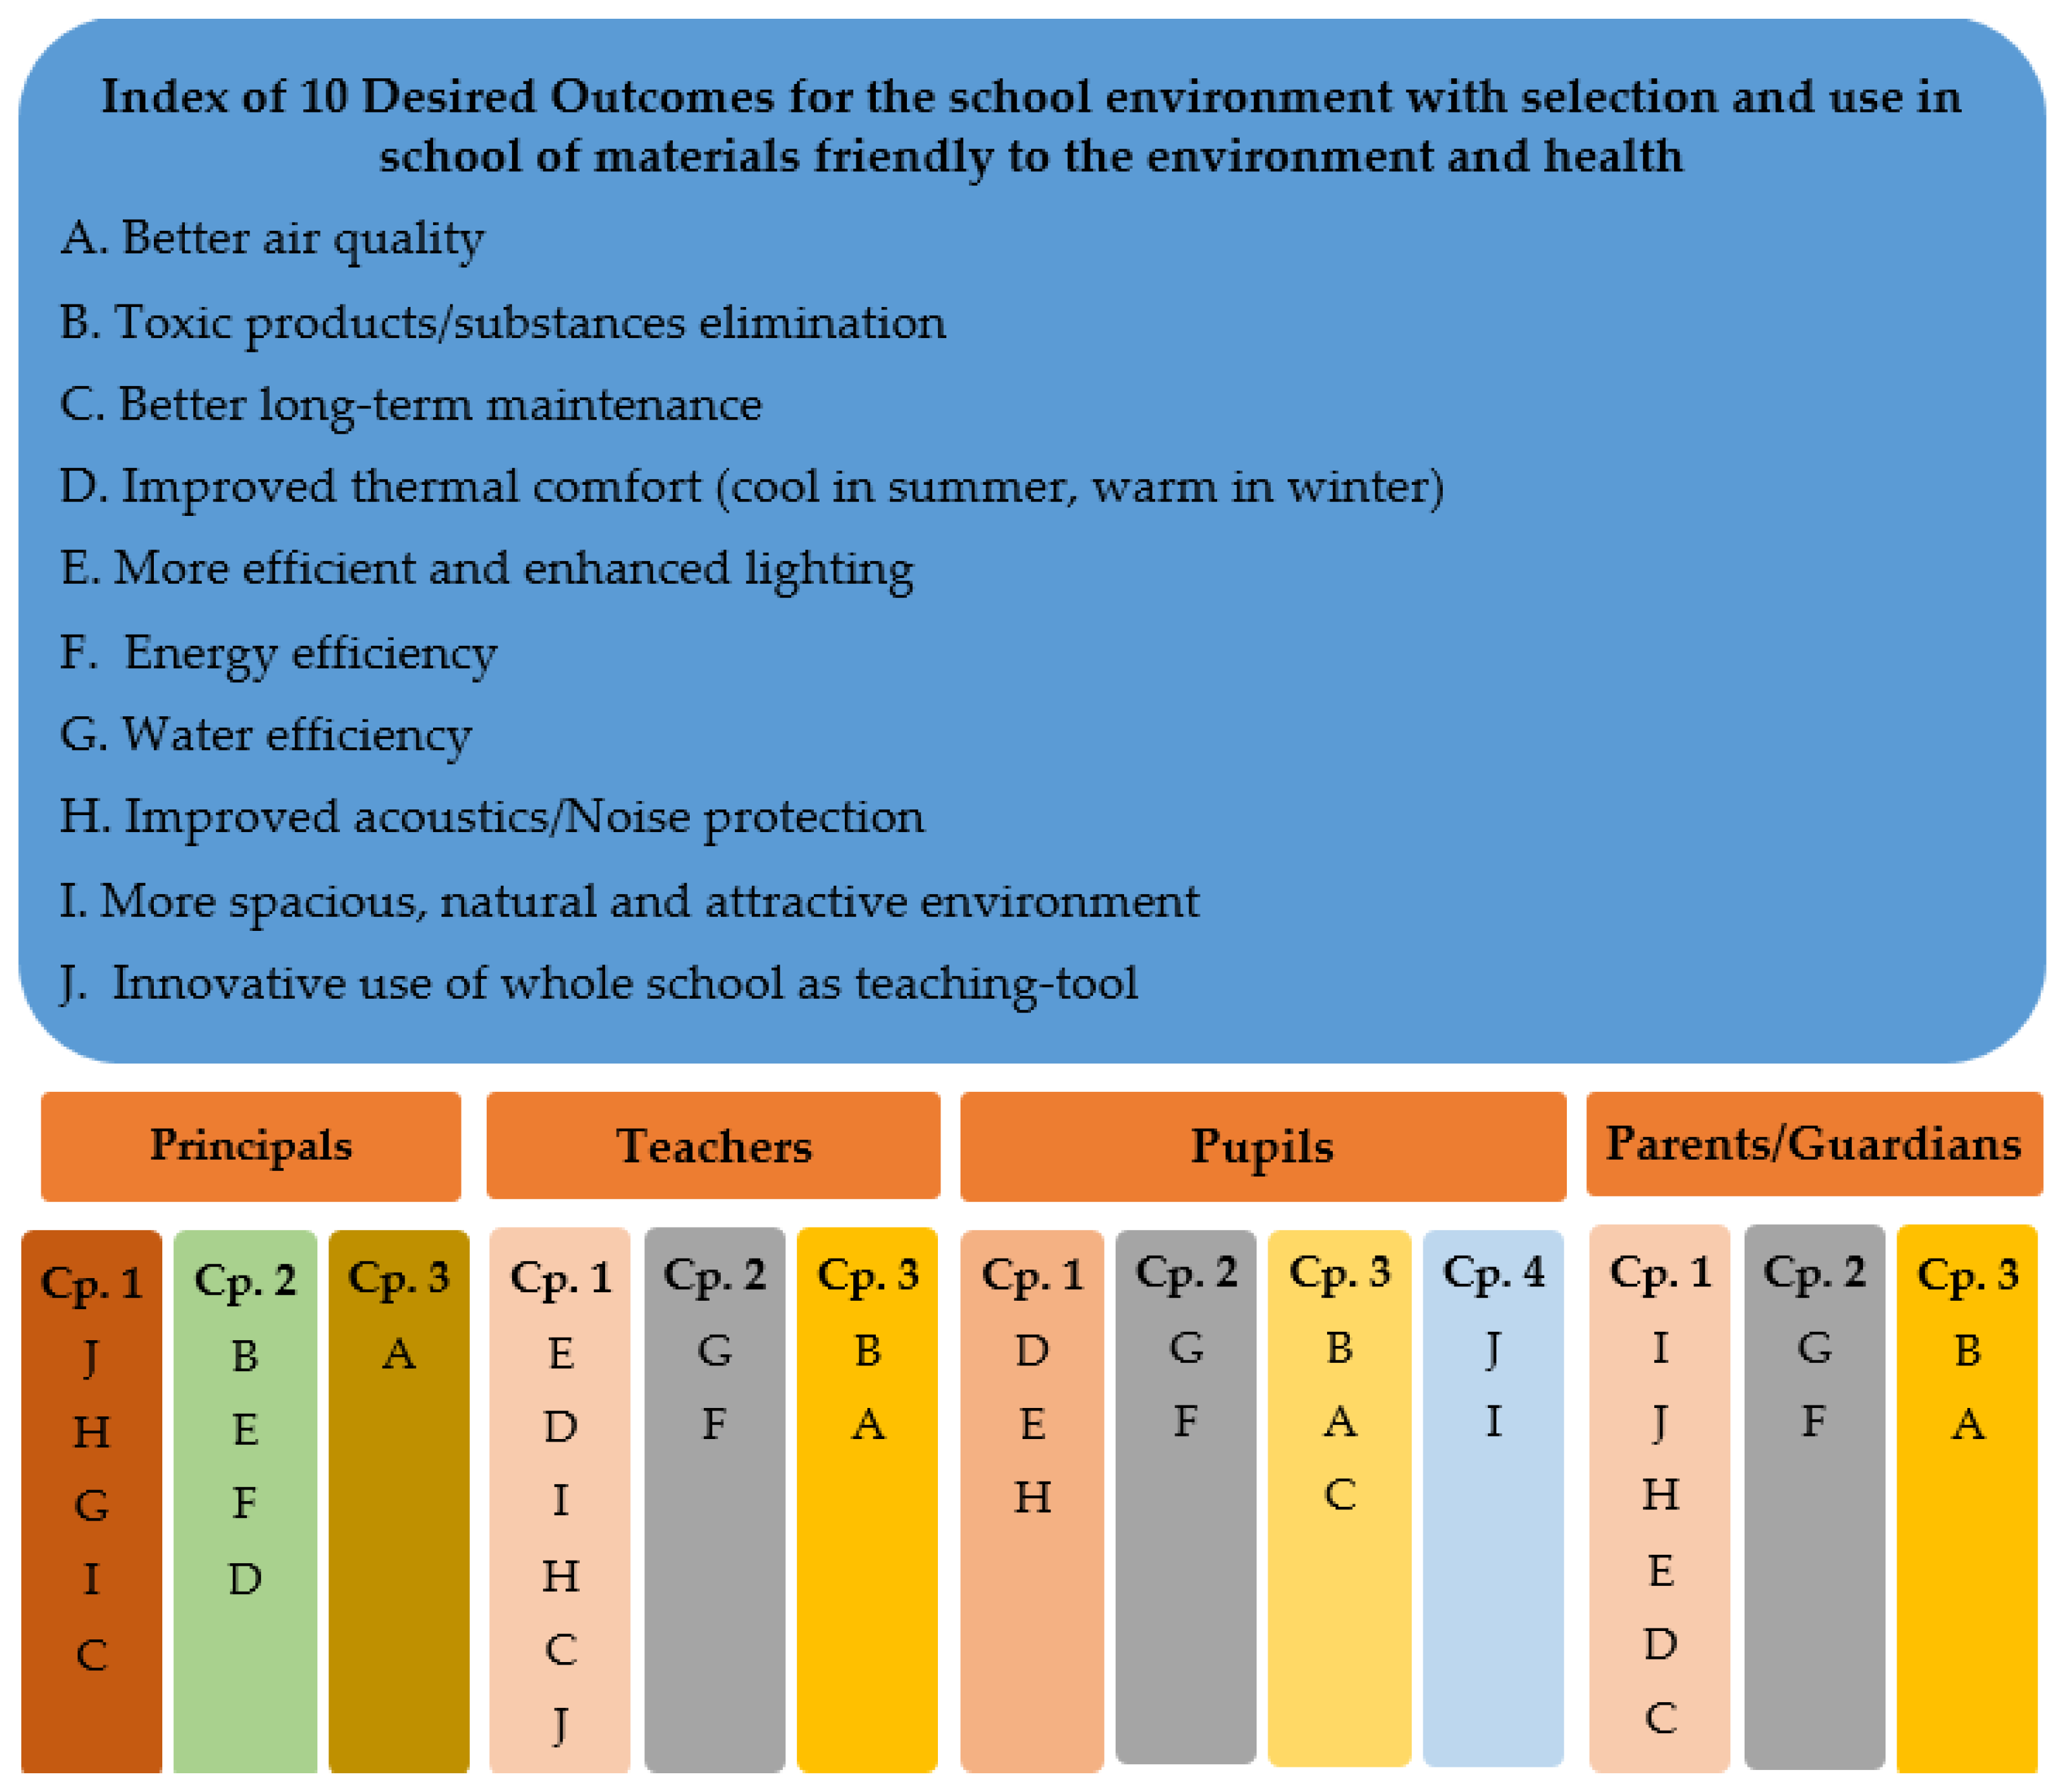
3.3.3. Importance Ratings of 10 Desired Outcomes for the School Environment with the Selection and Use in Schools of Environmentally Friendly and Health-Friendly Materials

All four user groups were asked this multi-item question with the same given 10 desired outcomes. Numerical and worded labeling were combined for the scale points and an “I don’t know” option was also given.
  • Resulting frequencies and Non-parametric Chi-square tests for all groups are, respectively, in Table 8, Table 9, Table 10 and Table 11 which follow. Where df < 5, the test has been conducted with a selection of cases.
  • Pearson’s Chi-square test of independence: This showed that each of the above 10 variables is independent of TIRZ and DSBA for principals and teachers with p > 0.05. Similarly, independence was shown between each variable and DSBA for parents/guardians with p > 0.05. However, three dependencies were found in the pupils’ user group and one in the parents/guardians’ user group as shown in Table 12. Details of these dependencies are in Tables S6–S9 in the Supplementary Materials.

3.3.4. PCA for School Environment Desired Outcomes

PCA for Principals

Initially, the factorability of the 10 items (school-environment desired outcomes) was examined. In the resulting correlation matrix with 45 possible correlations, all of these correlated, ranging between 0.234 and 0.738 with p = 0.05, thus suggesting excellent factorability. Additionally, the Kaiser-Meyer-Olkin measure of sampling adequacy was 0.875, i.e., above the least acceptable level of 0.5, and Bartlett’s Test of Sphericity was significant (χ² (45) = 730.893, p = 0.000), thus indicating that data are approximately multivariate normal and acceptable for factor analysis. The diagonals of the anti-image correlation matrix ranged from 0.833 to 0.912 and thus were over 0.5 for all 10 items, supporting the inclusion of each item in the factor analysis. Three components were with eigenvalues >0.7 (Comp. 1:5.644, Comp. 2:0.978 and Comp. 3:0.822) and accounted for 74.439% of the total variance explained. Thus, they were extracted and the solution was rotated (Varimax) in order to obtain more meaningful factor loadings. The three components and the 10 outcomes’ final loadings for these are given in the Rotated Component Matrix (Table S10 in the Supplementary Materials). Five outcomes (J, H, G, I and C) have their highest loadings on the first component, four outcomes (B, E, F and D) load mostly onto the second component and one outcome (A) loads highest on the third component. PCA was based on n = 123. For these cases and for all 10 items, reliability analysis was conducted, resulting in Cronbach’s Alpha = 0.912, which signifies great internal consistency.

PCA for Teachers

By following the same procedure described in Subsection PCA for Principals the following results were obtained in PCA for the teachers’ user group.
  • Correlation matrix: All 45 possible correlations correlated, ranging between 0.202 and 0.671 with p = 0.00, thus suggesting excellent factorability.
  • Kaiser-Meyer-Olkin measure of sampling adequacy was 0.882 > 0.5 and Bartlett’s Test of Sphericity was significant (χ² (45) = 1313.818, p = 0.000), thus indicating data as approximately multivariate normal and acceptable for factor analysis.
  • Diagonals of the anti-image correlation matrix ranged from 0.816 to 0.914 (>0.5 for all 10 items), supporting the inclusion of each item in the factor analysis.
  • Three components had eigenvalues over 0.7 (Comp. 1:4.982, Comp. 2:1.140 and Comp. 3:0.837) and accounted for 69.586% of the total variance explained. They were extracted and the solution was rotated (Varimax) for more meaningful factor loadings. The 10 outcomes’ final loadings for these are in the Rotated Component Matrix (Table S11 in the Supplementary Materials).
  • Six outcomes (E, D, I, H, C and J) have their highest loadings on the first component, two outcomes (G and F) on the second and two outcomes (B and A) on the third. For all cases (n = 291) and all 10 items, reliability analysis was conducted, resulting in Cronbach’s Alpha = 0.882 and thus signifying great internal consistency.

PCA for Pupils

With the procedure described in Subsection PCA for Principals, the pupils’ user group PCA results were:
  • Correlation matrix: All 45 possible correlations correlated, ranging between 0.185 and 0.740 with p = 0.00, thus suggesting excellent factorability.
  • Kaiser-Meyer-Olkin measure of sampling adequacy was 0.840 > 0.5 and Bartlett’s Test of Sphericity was significant (χ² (45) = 2382.098, p = 0.000), thus indicating that data are approximately multivariate normal and acceptable for factor analysis.
  • Diagonals of the anti-image correlation matrix ranged from 0.741 to 0.915 (>0.5 for all 10 items), supporting the inclusion of each item in the factor analysis.
  • Four components were with eigenvalues over 0.7 (Comp. 1:4.139, Comp. 2:1.158, Comp. 3:1.021 and Comp. 4:0.773) and accounted for 70.913% of the total variance explained. Thus, they were extracted and the solution was rotated (Varimax) for more meaningful factor loadings. The 10 outcomes’ final loadings for these are given in the Rotated Component Matrix (Table S12 in the Supplementary Materials).
  • Three outcomes (D, E and H) have their highest loadings on the first component, two outcomes (G and F) on the second, three outcomes (B, A and C) on the third and two outcomes (J and I) on the fourth component. For all cases (n = 731) and all 10 items, reliability analysis was conducted, resulting in Cronbach’s Alpha = 0.839 and thus signifying great internal consistency.

PCA for Parents/Guardians

With the procedure of Subsection PCA for Principals, the parents/guardians’ user group PCA results were:
  • Correlation matrix: All 45 possible correlations correlated, ranging between 0.295 and 0.776 with p = 0.00, thus suggesting excellent factorability.
  • Kaiser-Meyer-Olkin measure of sampling adequacy was 0.891 > 0.5 and Bartlett’s Test of Sphericity was significant (χ² (45) = 3499.724, p = 0.000), thus indicating that data are approximately multivariate normal and acceptable for factor analysis.
  • Diagonals of the anti-image correlation matrix ranged from 0.819 to 0.968 (>0.5 for all 10 items), supporting the inclusion of each item in the factor analysis.
  • Three components were with eigenvalues over 0.7 (Comp. 1:5.308, Comp. 2:0.898 and Comp. 3:0.844) and accounted for 70.506% of the total variance explained. They were extracted and the solution was rotated (Varimax) for more meaningful factor loadings. The outcomes’ final loadings are in the Rotated Component Matrix (Table S13 in the Supplementary Materials).
  • Six outcomes (I, J, H, E, D and C) have their highest loadings on the first component, two outcomes (G and F) load mostly onto the second component and two outcomes (B and A) load highest on the third component. For all cases (n = 679) and all 10 items, reliability analysis was conducted, resulting in Cronbach’s Alpha = 0.900 and thus signifying great internal consistency.

Interpretation of PCA for School Environment Desired Outcomes

Through PCA and reliability analysis for desired outcomes for the school when selection and use of environmentally friendly and health-friendly materials are considered, it can be claimed that a typology of 10 variables successfully resulted, with all 10 variables functioning as constituent items for a “Desired Outcome” index. This applies to all four user groups, i.e., principals, teachers, pupils and parents/guardians, as Cronbach’s Alpha ranged from 0.839 to 0.912 in the four groups. However, there are distinct differences as well as similarities between the results for each group. With around 70% of variance accounted for, three principle components (factors) were extracted in the three adult user groups whereas four were extracted in the pupils’ group. With the rotated solutions (Tables S10–S13), each variable (desired outcome) has a distinct heavy loading on one component. These major loadings range from 0.645 to 0.904 for the principals, from 0.639 to 0.865 for the teachers, from 0.511 to 0.888 for the pupils and from 0.553 to 0.874 for the parents/guardians. This indicates a strong relationship between the variables and the corresponding extracted component (factor). Scheme 1 gives a visual comparison for all user groups of the groupings (highest loadings) established for extracted components of the 10 desired outcomes for the school environment associated with the selection and use in schools of environmentally friendly and health-friendly materials, based on PCA. The order of desired outcomes for each component corresponds to the diminishing order of highest loadings. Same-color columns identify each component that is composed of identical variables across groups in comparison to differently colored columns which correspond to uniquely different component structures.
As can be seen in Scheme 1, some components are composed of identical variables with same-order component loadings, e.g., Component 2 for teachers, pupils and parents and Component 3 for teachers and parents, whereas others have different-order factor loadings, e.g., Component 1 for teachers and parents. Components are interpreted by taking into account the nature and the combination of attributes they are comprised of. Thus, in the case of teachers and parents/guardians, the three extracted components are alike as to what they measure as constructs, and can be identically labeled. In these two user groups, the first dominant component, Component 1, could be labeled as “General environmental and functional performance”. Component 2 could be named “Water and energy efficiency” and Component 3 could be labeled as “Non-toxicity and air quality”.
In examining pupils’ extracted components, Component 2 could be labeled as “Water and energy efficiency”, coinciding with that of teachers and parents. Pupils’ Component 1 could be labeled as “Thermal, visual and acoustic comfort”. Component 3 could be coined as “Non-toxicity, air quality and long-term maintenance” and pupils‘ unique Component 4 could be labeled as “Attractive and pedagogically innovative school environment”.
In the principals’ user group, Component 1 is nearly identical to that of teachers and parents/guardians and could also be labeled “General environmental and functional performance”. On the other hand, Component 2 could be named “Non-toxicity and efficient energy for a high-quality visual and thermal environment”. Component C, composed solely of one variable, could be obviously labeled as “Air quality”.

4. Discussion

4.1. Overall Observations

Survey participation was at a high level within all four user groups, ranging from 82.61% to 98.23% (Table 1) with the school principals being the most responsive of all, and with pupils, teachers and parents/guardians following in diminishing order. This initially indicates interest and willingness on the part of the subjects to state their opinions and views on school facilities and issues pertaining to sustainability. Most of the schools were Lower Secondary Schools (51.5%) because of random stratified sampling for the three types of secondary schools.
Although the sample included schools over 100 years old, 61.7% of the schools were built after 1979 (Table 2). Compulsory thermal insulation for buildings introduced from 1979 onwards changed the way schools were being built and the requirements for schools in the three TIRZs as set out in the Regulation. This prompted the need to examine how school building age in relation to incorporated thermal insulation might affect users’ responses in the survey and whether the school’s position in a colder or warmer zone has a bearing on users’ responses. Thus, the year 1979 served as a reference point for the derived variable DSBA. In the sample, most schools (52.1%) were in the medium-cold TIRZ B, 32.9% were in the coldest TIRZ C, while 15% were in the least-cold TIRZ A.
In the One-sample Chi-square tests (non-parametric procedure) for all variables presented in this article, the resulting Chi-square value and its degrees of freedom (p < 0.05) lead to rejection of the null hypothesis, i.e., that differences between observed and expected counts are due to chance on account of the particular random sample. Thus, these differences are true and significant ones.
Pearson’s Chi-square test of independence (desired sig. = 0.05) showed that some variables are not independent of DSBA and TIRZ. From the respective crosstabulations’ tables in the Supplementary Materials, one can see that the phi statistic and Cramer’s V values are 0.283 and under, which indicates a weak association between the dependent variables. However, these dependencies are discussed as they exist and can provide further insight on issues they are concerned with.
The ANOVA results for two questions presented, regarding the variables as interval variables, are consistent with the results of the Kruskal-Wallis test for the same variables if they were to be considered ordinal variables.

4.2. The “I Don’t Know” Option

The “I don’t know” option was included in all questions whose results are presented in this article, except in that of Section 3.2. where it was included only for the parents/guardians’ user group for the reasons stated there. Inclusion or omission of the “I don’t know” option in questionnaire design is an issue that has been investigated by researchers, taking into account the type of questions asked and characteristics of the respondents. There have been findings for and against this option which include that the option did not improve data quality, that it encourages “satisficing”, that it shows ambivalence or lack of clarity in meaning in questions, difficulty of questions or issues investigated or that is preferred by respondents in protection of their self-image. Some studies show that it is better to omit this option, as respondents in this situation would have to state their opinion and this would give a more meaningful response [58,65,66,67].
The questionnaires in this survey were self-administered. Subjects could take them home and the school was given ample time (one month) to send back answered questionnaires. Anonymity in regards to the researcher was preserved with the inevitable exception of the principal who is distinguishable in every school. Thus, these conditions served to eliminate, as much as possible, distorted data resulting from satisficing in order to protect self-image. Time was given so that respondents could recall, locate and retrieve information or experiences which could help them form their opinion without resorting to “I don’t know” [65] (p. 283). The labeling of the scale points was clear and consistent in gradation, indicating same-interval scaling from point to point and was even similarly worded across questions so as to make them clear in meaning.
The main reasons for including the “I don’t know” option were: (a) to make respondents feel at ease and that it is acceptable to not be able to form an opinion on a particular matter and so state this; (b) to encourage honest expression; and (c) to elicit information on potential lack of knowledge or cognitive difficulties in judging the importance of environmental issues. Another aim was to make participation in this survey a personal learning experience as subjects had the time to look up unfamiliar terms and facts and reflect on these and all other relevant data. The “I don’t know” possibility implies that an “I know state of mind” is required to express an opinion and so may induce the respondent to enter the opinion-forming process. The very small percentages of “I don’t know” answers in the results presented in this article show that respondents did not take advantage of this option for “satisficing”. If some respondents chose the “easy way out” or were indifferent, this may also have been done simply by not answering the question. Indications for this may lie in the differences in n between the items constituting the multi-item question of Section 3.3.3. which show that some respondents partially answered this question, omitting some of the items.
Furthermore, the “I don’t know” responses were excluded from the ANOVA reported for the two questions in this article because they accounted for small percentages, as is evident in Table 3 and Table 5, and because this response option is not a scale point so as to be considered together with the other five scale points for ANOVA.

4.3. Environmental Quality of Existing School Facilities

The rating of school building quality, its construction materials and its equipment materials is similar in all four user groups and is mostly situated in the upper-middle range. Table 3 shows that most subjects in all groups rated their schools as “Good” followed closely by “Fair”. This is evident with the non-statistically significant means’ differences found in the one-way ANOVA testing. The percentages of observed frequency values show few extremely favorable or unfavorable views. Statistically significant differences in variances between user groups, as evident from the Levene statistic, are apparent in the fact that parents/guardians and pupils give aggregated percentages of ratings on the two lowest points and the fifth-highest point of the scale, respectively, 27.49% and 25.50%, which are higher than that of teachers with 21.36% and principals with 15.00%. Parents/guardians that claim ignorance on the matter constitute a percentage of 5.53%, which is the smallest within the user group and the third smallest compared to ratings’ percentages between all user groups. This indicates concern and sufficient knowledge so as to express an opinion. Pupils, as direct users, perceive school environments somehow different than the adult direct users, i.e., principals and teachers. Additionally, parent/guardians, as adult, less-direct users who do not experience the school environment as the other three groups do, tend to be closer to pupils’ views.
Medium-range subjective assessment of school buildings and infrastructure has prevailed in other Hellenic studies, such as a survey by Papachristou (2002) involving secondary school teachers and pupils nationwide [40] and a greater-Athens-area public opinion poll conducted in 2002 for the former School Building Agency, now merged into the national agency Ktiriakes Ypodomes S.A. (Buildings Infrastructure S.A.), where a mean score of 5.92 out of 10 was given [41]. On the other hand, a combined 84% of public school principals in a 2005 study in the USA. reported their school’s physical conditions on the two highest levels of a four-point scale [68]. Environmental quality, assessed on a four-point scale, scored a mean of 2.8 from teachers and 3.6 from pupils participating in the 2003–2004 Sustainable Schools Project in Vermont, USA. [69]. Schneider (2003) found that Chicago public school teachers rated their school facilities as 2.5 while Washington, D.C., teachers gave 1.98 on a graded A-to-F scale representing numerical scores from 4 to 0, and over 75% of teachers in both cities regard school facilities as very important to their overall performance as teachers [70] (pp. 5–7). Vitantzakis (2006), on investigating parameters of quality in primary schools in the greater Athens area, found that principals and teachers identified the school infrastructure as the second-largest qualitative feature after school staff [71]. On an international level, in the Organisation for Economic Co-operation and Development (OECD) Programme for International Student Assessment (PISA) 2012 tests, the average index of quality of physical infrastructure of schools had an OECD average of −0.03 based on school principals’ perceptions from 65 participating countries. This index has a mean of zero and negative values indicate that infrastructure deficiencies hinder learning to a greater extent than the OECD average. Greece’s average index was lower, with a value of −0.19, ranking the country 12 places lower than the OECD average and in 40th place among all countries [72] (pp. 104,105).
In all four user groups, there is dependence between the DSBA and each user group’s ratings of the quality of the school building, its construction materials and its equipment materials. From the crosstabulations in Tables S1–S4 it can be seen that observed and expected values differ significantly and that “New” schools—belonging to the later period of compulsory thermal insulation—have increased ratings of “Good” compared to “Old” schools of the earlier period of non-compulsory thermal insulation. Likewise, Schneider (2003) showed that building age affects teacher evaluation of school facilities [70] (p. 20). It will be of interest to investigate if this pattern changes in newer schools on account of gradual incorporation of bioclimatic principles and the use of simulated passive building design strategies and active strategies for energy efficiency [73].

4.4. Sustainable Construction and Environmentally Friendly Materials in Schools

4.4.1. Importance Ratings of Variables

On the selection and use in schools of materials that are friendly to the environment and human health, all four user groups overwhelmingly regard this as “Extremely Important”, rating it with the highest degree of the scale, with percentages over 60%. It is noticeable that those who state “I don’t know” are a very small percentage, i.e., under 3%, and that those who rate importance in the three lower points of the scale, when aggregated, amount to under 10%. One-way ANOVA shows that teachers attach the most importance, followed by principals, parents/guardians and pupils. On the greater part, user group opinions on this issue are not affected by users’ actual school circumstances in regards to DSBA or TIRZ classification, with the exception of pupils whose importance rates are not independent of DSBA. Pupils in “New” schools give greater importance to the two upper levels than pupils in “Old” schools, as can be detected in Table S5. In a 2010 study with Grade 5 and 6 pupils in two schools on the island of Rhodes, Greece, only 13.73% list the use of ecological materials as a means of environmental protection during the school construction phase, rendering this as the third highest of six options [74] (p. 347).
Over 90% of principals, teachers and parents/guardians all similarly believe that the school community should participate in planning and selecting “ecological solutions” for school facilities and materials used in them. In all three groups, well over half the users opted for definite participation rather than optional participation. Pupils expressed the same opinion in regards to their participation in improving the school environment so that it may become more attractive and ecological. The importance of community stakeholder participation in planning school facilities generally has been expressed by school architects, administrators and teachers [33]; [75] (p. 21); [76].
In judging the importance of 10 given desired outcomes for the school environment, potentially associated with the selection and use in schools of environmentally friendly and health-friendly materials, all four user groups rate each and every outcome as “Extremely important”, with this option attaining the highest single-point frequency of all. This rating represents the highest point on the given five-point Likert-type scale pertaining to the question. In many cases of outcomes, as is evident from Table 8, Table 9, Table 10 and Table 11, the response frequency for “Extremely important” is larger than the aggregated frequencies for all the other points of the scale along with the “I don’t know” responses. In all four groups the two leading “Extremely important” outcomes are the same: “Toxic-products/substances elimination” followed by “Better air quality”. These reflect a concern over chemical pollutants and seem, in the minds of principals, teachers, pupils and parents/guardians, to have a greater potential impact in relation to school occupancy and its users. The third-highest frequencies are for “Energy efficiency” in the principals’ and teachers’ groups, whereas “Improved thermal comfort (cool in summer, warm in winter)” figures third highest for parents/guardians and pupils. Although there is definite streamlining in the top priority outcomes, the same does not apply accordingly for the outcomes with the three lowest frequencies.
Opinions on the degree of importance of each of the 10 desired outcomes do not seem to be influenced by the school building age in the case of principals, teachers and parents/guardians nor by the thermal insulation-requirements zone in the case of principals and teachers. These users hold their views despite whatever their school contextual conditions may be in regards to DSBA and TIRZ. In the case of parents and pupils, TIRZ is a more dynamic parameter, with dependency found in relation to one outcome in the parents’ group and to two outcomes in the pupils’ group. Additionally, DSBA and one desired outcome are dependent on each other in the pupils’ group. From Table S6, one notes that parents/guardians in the middle TIRZ B rate “More efficient and enhanced lighting” as “Extremely Important” more ardently than those in the other two TIRZs. From Table S8, it can be seen that pupils in the middle TIRZ B rate “Better air quality” as “Extremely Important” more ardently than those in the other two TIRZs. From Table S9, it is evident that pupils in the warmest TIRZ A rate “Water efficiency” as “Extremely Important” less ardently than those in the other two TIRZs. From Table S7, it is evident that pupils in “Old” schools are more supportive of “Improved acoustics/Noise protection” as “Extremely Important” than pupils in “New” schools.
Along similar lines, 87.8% of Hellenic primary schools teachers (n = 41) in a 2009 survey stated they believe the school yard can play an important role in functioning as a teaching space for environmental issues ([77], p. 391). In a 2004 USA survey of three groups of K–12 educational professionals, the rating of 19 attributes’ importance when planning high performance/sustainable/green schools on a five-point Likert scale showed, in terms of mean scores, that “Indoor environmental quality” (4.72) leads, followed by “Long-term maintenance” (4.61) and then “Elimination of toxic materials and substances” (4.59) as well as “Energy management” (4.59). “Daylighting” (4.46) is in the fourth position, “Acoustics/soundproofing” (4.22) is in the eighth position, followed directly by “Environmentally responsive site design” (4.17) and “Water conservation” (4.05) while “School building utilized as teaching tool” (3.86) is in the 13th position [48] (p. 13). Desired outcomes’ ratings can be compared to results of a 2009 survey of engineers where, as Rosen reports, designs that use less energy or reduce emissions are the most important sustainable technologies according to 64% of practicing engineers and 66% of engineering students, while manufacturing processes that use less energy and natural resources are second most important according to 27% of practicing engineers and 43% of engineering students [78]. Thus, one can see similarities but also differences between opinions of the school community and other professional groups who have more expert knowledge on school facilities and sustainability.
One more feature of the desired outcomes’ results is the “I don’t know” responses. Across all four groups (Table 8, Table 9, Table 10 and Table 11), subjects express more lack of knowledge or cognitive difficulties in judging the importance mainly of “Better long-term maintenance”, “Energy efficiency”, “Water efficiency” and “Innovative use of the whole school as a teaching-tool” in regards to the selection and use in schools of materials that are friendly to the environment and health. This indicates a need for increased sustainability literacy, especially related to these issues.

4.4.2. PCA for School Environment Desired Outcomes

PCA demonstrates that the Index of 10 Desired Outcomes, as conceived for the school environment with the selection and use in school of materials friendly to the environment and health, is a construct that can be utilized reliably for all four groups of school users. It can measure the importance subjects attached to 10 distinct issues when selecting and using materials in schools. The index may be used as part of new public consultation procedures involving one or more of these user groups. In cases where constraints do not allow for a new investigation, the measurements of this specific survey and the relationships detected may be utilized, especially in the context of the Hellenic school system, seeing that results proved characteristic of the user population represented by each user group sample and particularly in schools built prior or according to the TIR of 1979. This can be said not only of the Desired Outcomes Index but of the four user group questionnaires in general, although the scope of the survey was too large for it to be fully included in this article.
Furthermore, in procedures where it is necessary to use and process less data, a solution of fewer dimensions was produced, reducing the 10 variables of the Desired Outcomes Index to three or four components which reveal a hidden structure and serve as latent variables representing the original variables [79]. This is deemed necessary in large-scale studies and an analogous example is the previously mentioned index of the quality of the physical infrastructure of schools of the OECD’s 2012 PISA tests which is based on three variables [72] (pp. 104,105). However, the extracted and rotated components in this research pertain to particular user groups and are not common to all user groups in a unified way. Thus, participatory procedures will not be accurate if all users are treated as one population. This directs to new research matters that aim to balance out subjects’ different backgrounds when using transformed variables (components) instead of the original ones. In various areas, it has been demonstrated that the views and priorities of different stakeholders converge on various sustainability issues, and with suitable treatment and tools, relevant opinions can emerge and a consensus may be reached [80,81].

4.5. Research Utility and Further Research Directions

The aspects of the existing school environment and the perspective of sustainability in schools investigated in the survey, as generally outlined but also presented in detail in Subsections 3.2 and 3.3, provide a considerable body of evidence on how school conditions were perceived by users at the time of the survey and what types of issues have arisen during the building’s service life of which school users are aware. The evidence also shows how users relate to the issue of sustainability in schools. These findings can be used to compare data and trends over time, to relate the physical infrastructure of schools to learning outcomes and other parameters that contribute to the quality of education. The questionnaire is a tool which can be re-administrated to inform school authorities at the local level as well as at the central administration level and can aid the identification of priorities and the shaping of policies on school building construction and refurbishment.
The survey is compatible with the fact that the 2015 Hellenic-endorsed European Standard EN 16309 +A1: Sustainability of construction works—Assessment of social performance of buildings—Calculation methodology notes that, with the assessment methods in the standard, it is possible to use a tenant questionnaire to assess qualitative comfort aspects based on users’ experiences for existing buildings [82] (p. 28). Additionally, the survey questions relate to the eight social performance categories set out in the 2012 Hellenic-endorsed European Standard EN 15643–3: Sustainability of construction works—Assessment of buildings—Part 3: Framework for the assessment of social performance [83] (pp. 7, 22–27) and especially to Adaptability, Health and Comfort, Maintenance, Safety/security and Stakeholder involvement.
In regards to the Hellenic context, it must be noted that this survey’s findings still stand because no newer similar research has been conducted in Hellenic schools on such a large scale which can be representative of the general population. There are no more recent findings of a similar scope that are comparable to those of this research. Users’ opinions can be incorporated into various types of procedures, methodologies and tools so as to inform and shape decision-making, in which, up until now, expert views and technical and financial parameters seem to have remained the nearly-exclusive determining forces. As the Hellenic Ministry of Education, Research and Religious Affairs, Buildings Infrastructure S.A. and municipalities are increasingly utilizing Management Information Systems, the four user group questionnaires could be incorporated into these by authorities for periodical monitoring of school infrastructures in the context of a school property data survey program. Users’ opinions could be used to highlight issues and determine priorities and to develop school sustainability indicators and could be configured so as to contribute to weightings for relevant attributes in multi-criteria decision-making where materials, construction products and green design for schools are concerned. For instance, the means of ratings of the 10 School Environment Desired Outcomes could be utilized to derive weightings according to the Analytic Hierarchy Process to incorporate all four user groups’ opinions in decisions where the desired outcomes correspond to criteria that are relevant to the problem being solved and the alternatives being considered [84] (pp. 33–35). Such cases are a comparison of construction products or building modeling scenarios and choice of a school sustainability policy. Further research can be conducted in the application of survey result data to specific situations. Vital to effective participatory procedures is, of course, sustainability education which must involve both individual learning and human systems learning processes [85] and can range from “basic” sustainability literacy to specialized academic, technical or vocational studies for those seeking a career or employment in the rapidly expanding areas of “green jobs” [86]. The concern and the great importance expressed by respondents in the survey show an interested public in regards to sustainability and environmentally friendly and health-friendly products and materials. This alludes to a non-saturated state with a capacity for further learning, development of sustainable practices and increased “green consumerism”. The survey helps highlight issues that need to be addressed so as to increase school users’ awareness and mobilization in regards to desired outcomes for the school environment. For instance, “Energy efficiency” scores high on the “I don’t know” responses and relatively low on the “Extremely Important” ratings in comparison to other desired outcomes, and particularly in the pupils’ and parents’/guardians’ user groups. Here, sustainability literacy is crucial for environmentally positive behavior considering the binding measures of the EU 2012 Energy Efficiency Directive for a 20% primary energy-saving target by 2020 compared with forecasts of the business-as-usual scenario. The Hellenic Energy Efficiency Action Plan, in accordance to Article 5(7) of the Directive, includes “Interventions for improving energy efficiency in school buildings” as a measure, which, however, reaches out to a limited number of schools [87]. This, in conjunction with public spending constraints due to the country’s financial crisis, may not allow for adequately extensive refurbishing of existing schools and may place a considerable burden on increased responsible behavior of school users for lower final energy consumption in school buildings in attainment of the above target.
It must be emphasized that the results of this research refer to Hellenic school building stock which, if insulated, was done so in accordance to the national TIR of 1979. A further direction of study could be the re-implementation of the survey so that newer school buildings could be included in the sample, namely those built after the enforcement of the Regulation on the Energy Performance of Buildings (KENAK) in 2010 [88] which serves as the new relevant reference point for new school construction. The new regulation redefines thermal zones, discerning four instead of three, and establishes new thermal requirements for each zone. Therefore, dependence between survey variables and redefined DSBA and TIRZs could be investigated and users’ perceptions, attitudes and opinions could be recorded from the perspective of evolving regulatory building practices and how the sustainability agenda has permeated society over time in recent years.

5. Conclusions

It has been advocated that independent and unbiased benchmarks for users’ perceptions of existing buildings must be established and incorporated into relevant building sustainability rating tools so as to progress towards sustainable buildings [25]. This research establishes a new survey questionnaire tool and presents new data and therefore knowledge, previously not existent on a nationwide level, of the perceptions, attitudes and opinions of Hellenic secondary school principals, teachers, pupils and parents/guardians in regards to their school facilities and sustainable construction and the selection and use of materials in schools that are friendly to the environment and human health. This new knowledge may be used to further sustainability in Hellenic schools but may also assist government and educational authorities, and engineering and other interested-party organizations in other settings to promote sustainability in schools.
The very high survey participation, i.e., over 82.61% for schools and all four user groups, signifies interest and willingness of school communities to communicate their views on their school environments and on more abstract concepts and principles related to school sustainability issues. Principals, teachers, pupils and parents/guardians from Hellenic secondary schools built prior or according to the national TIR of 1979 mostly regard their school building quality, its construction materials and its equipment as good. Additionally, over 60% of subjects in each user group regard the selection and use of materials friendly to the environment and human health in schools as extremely important. Over 90% of principals, teachers and parents/guardians believe that school communities should participate, either optionally or definitely, in planning/selecting “ecological” solutions for school facilities and materials used in them. Over 96% of pupils believe they should participate in improving the school environment so that it may become more attractive and ecological. Similarities as well as differences were found between these results and other research results.
Ten School Environment Desired Outcomes associated with the selection and use in schools of environmentally friendly and health-friendly materials were all rated mostly as extremely important by all four user groups. The outcomes with the highest frequencies on this rating level in all four groups were “Toxic-products/substances elimination” followed by “Better air quality”. Following Principal Components Analysis and reliability analysis in all four user groups, it can be claimed that a typology of these 10 variables successfully resulted, with all of them constituting a “Desired Outcome” Index that can reliably measure the importance of the 10 outcomes, especially in a Hellenic context. PCA for each user group also extracted interpretable and meaningful components showing that the 10-item “Desired Outcome” Index can be reduced to three principal components for principals, teachers and parents/guardians, and to four components for pupils. All four user groups cannot be considered as one unified population in a potential participatory process and there must be further treatment of differences and similarities in component structures in order to obtain accurate measurements through reduced variables.
For user groups in Hellenic school buildings built prior or in accordance to the national TIR of 1979, some of the variables presented are not independent of DSBA and TIRZ, although a weak association is indicated. On the whole, subjects seem to uphold their views on sustainability in schools regardless of their own school’s physical environment and conditions. DSBA impacts the way users judge the quality of their school’s infrastructure more rather than the TIRZ. TIRZ-dependent variables were identified in a few of the desired school environment outcomes in the parents/guardians’ and pupils’ user groups. Pupils, compared to the other three user groups, show evidence of more dependences of variables on DSBA and TIRZ. This indicates that pupils’ responses seem to be affected by how old and well insulated their school is and the thermal insulation zone it is situated in.

Supplementary Materials

The following are available online at www.mdpi.com/2071-1050/8/4/311/s1, Table S1: DSBA* quality of school building and materials crosstabulation, Chi-square tests and symmetric measures: principals, Table S2: DSBA* quality of school building and materials crosstabulation, Chi-square tests and symmetric measures: teachers, Table S3: DSBA* quality of school building and materials crosstabulation, Chi-square tests and symmetric measures: pupils, Table S4: DSBA* quality of school building and materials crosstabulation, Chi-square tests and symmetric measures: parents/guardians, Table S5: DSBA* importance of selection and use in schools of materials friendly to the environment and health crosstabulation, Chi-square tests and symmetric measures: pupils, Table S6: TIRZ* more efficient and enhanced lighting crosstabulation, Chi-square tests and symmetric measures: parents/guardians, Table S7: DSBA* improved acoustics/noise protection crosstabulation, Chi-square tests and symmetric measures: pupils, Table S8: TIRZ* better air quality crosstabulation, Chi-square tests and symmetric measures: pupils, Table S9: TIRZ* water efficiency crosstabulation, Chi-square tests and symmetric measures: pupils, Table S10: PCA of principals’ school environment desired outcomes: rotated component matrix, Table S11: PCA of teachers’ school environment desired outcomes: rotated component matrix, Table S12: PCA of pupils’ school environment desired outcomes: rotated component matrix and Table S13: PCA of parents’/guardians’ school environment desired outcomes: rotated component matrix.

Acknowledgments

This research is part of a PhD study undertaken by the corresponding author and did not receive any funding. Acknowledgements are extended to the Ministry of Education, Research and Religious Affairs which approved the survey administration and granted PhD study-leave to the corresponding author. The authors also thank all who participated in the survey and made it possible for the research findings to be established. Additionally, the authors thank the reviewers for their constructive and helpful comments.

Author Contributions

Vasiliki Zepatou and Nicolas Spyrellis conceived of the study. Nicolas Spyrellis, Archontoula Chaloulakou and Maria Loizidou advised and contributed to research design, implementation and analysis. Vasiliki Zepatou wrote the paper with contributions from Maria Loizidou and Archontoula Chaloulakou.

Conflicts of Interest

The authors declare no conflict of interest.

Abbreviations

The following abbreviations are used in this manuscript:
ANOVA
Analysis of Variance
Asymp. Sig. or As. Sig.
Asymptotic Significance
BREEAM
Building Research Establishment Environmental Assessment Method
CEN
European Committee for Standardization
Comp. or Cp.
Component
Cumul.
Cumulative
df
degrees of freedom
DSBA
derived school-building age
ELOT
Hellenic Organization for Standardization
EU
European Union
EL.STAT
Hellenic Statistical Authority
F
F ratio
HSD
honestly significant difference
ISO
International Standards Organization
LCA
Life-cycle assessment
LEED®
Leadership in Energy and Environmental Design
N
full sample size
n
number of observations in the sample for a particular variable
NR
No Response
OECD
Organization for Economic Co-operation and Development
p
probability value
PCA
Principal Components Analysis
PISA
Program for International Student Assessment
sig.
significance level
SM
System-missing
SPSS
Statistical Package for Social Sciences
TIR
Thermal Insulation Regulation
TIRZ
Thermal insulation requirements zone

Appendix A

The Hellenic Statistical Authority discerns two types of areas on a national scale: urban and rural, based on definitions and fundamental concepts concerning population distribution put forth whereby “urban” refers to every municipal or community jurisdictional area in which the largest settlement has a population of 2000 people and more, while “rural” refers to such areas in which the largest settlement has a population of under 2000 people.

Appendix B

The National Thermal Insulation Regulation of 1979 discerns three zones (TIRZ) for the whole of Greece in regards to thermal insulation requirements through two criteria: (a) external temperature during winter and (b) duration of the heating period. The TIR gives, among other characteristic values, the mean minimum external temperatures (MMET) in the winter for the various cities.
According to the TIR, for the capital cities of the three prefectures of the survey sample in TIRZ A, the MMET are between +1 °C and +3 °C; for the capital cities of the five prefectures of the survey sample in TIRZ B, the MMET are between −1 °C and +2 °C; and for the capital cities of the five prefectures of the survey sample in TIRZ C, the MMET are between −10 °C and −5 °C.

References

  1. Kibert, C.J. Sustainable Construction: Green Building Design and Delivery, 2nd ed.; John Wiley & Sons Inc.: Hoboken, NJ, USA, 2008; pp. 1, 6, 13, 15, 30. [Google Scholar]
  2. U.S. Green Building Council. Green Building Facts. Available online: http://www.usgbc.org/articles/green-building-facts (accessed on 3 March 2016).
  3. Woolley, T.; Kimmins, S.; Harrison, P.; Harisson, R. Green Building Handbook, 1st ed.; Spon Press: London, UK, 2001; Volume 1, pp. 5–10. [Google Scholar]
  4. Wilbanks, J.T.; Wilbanks, T.J. Science, Open Communication and Sustainable Development. Sustainability 2010, 2, 993–1015. [Google Scholar] [CrossRef]
  5. Cole, R.J.; Valdebenito, M.J. The importation of building environmental certification systems: International usages of BREEAM and LEED. Build. Res. Inf. 2013, 41, 662–676. [Google Scholar] [CrossRef]
  6. Bragança, L.; Mateus, R.; Koukkari, H. Building Sustainability Assessment. Sustainability 2010, 2, 2010–2023. [Google Scholar] [CrossRef]
  7. Sustainable Construction in Public and Private Works through IPP Approach (SUSCON). LIFE 05 ENV/GR/000235. Available online: http://uest.ntua.gr/archive/suscon (accessed on 4 January 2016).
  8. Jago, E.; Tanner, K. Affects of the School Facility on Student Achievement-Lighting. University of Georgia, 1999. Available online: http://sdpl.coe.uga.edu/researchabstracts/visual.html (accessed on 20 January 2016).
  9. Jago, E.; Tanner, K. Affects of the School Facility on Student Achievement-Thermal Environment. University of Georgia, 1999. Available online: http://sdpl.coe.uga.edu/researchabstracts/thermal.html (accessed on 20 January 2016).
  10. Jago, E.; Tanner, K. Environmental Influence on Student Behaviour and Achievement-Acoustical. University of Georgia, 1999. Available online: http://sdpl.coe.uga.edu/researchabstracts/acoustical.html (accessed on 20 January 2016).
  11. Jago, E.; Tanner, K. Environmental Influence on Student Behaviour and Achievement-Aesthetic Factors. University of Georgia, 1999. Available online: http://sdpl.coe.uga.edu/researchabstracts/aesthetic.html (accessed on 20 January 2016).
  12. Environmental Protection Agency. Indoor Air Quality and Student Performance. EPA Report 402-F-00-009; Washington, USA, 2000. Available online: http://files.eric.ed.gov/fulltext/ED453639.pdf (accessed on 20 January 2016). [Google Scholar]
  13. Higgins, S; Hall, E.; Wall, K.; Woolner, P.; McCaughey, C. The Impact of School Environments: A Literature Review. Design Council, Centre for Learning and Teaching, Universtity of Newcastle, UK, 2005. Available online: http://www.ncl.ac.uk/cflat/news/DCReport.pdf (accessed on 19 January 2016).
  14. Henderson, K.; Tilbury, D. Whole-School Approaches to Sustainability: An International Review of Sustainable School Programs. Report by the Australian Research Institute in Education for Sustainability (ARIES) for the Department of the Environment and Heritage. Australian Government, 2004; pp. 11,12. Available online: http://aries.mq.edu.au/publications/aries (accessed on 21 January 2016).
  15. Department for Children, Schools and Families. Sustainable Schools, A Brief Introduction. UK, 2008. Available online: http://www.se-ed.co.uk/sites/default/files/resources/FrameworkResource.pdf (accessed on 21 January 2016).
  16. Australian Government, Department of Sustainability, Water, Population and Communities. Australian Sustainable Schools Initiative (AuSSI). Available online: http://secure.environment.gov.au/education/aussi/index.html (accessed on 21 January 2016).
  17. Green Schools Initiative. Available online: http://www.greenschools.net (accessed on 21 January 2016).
  18. Green Schools Alliance. Available online: http://www.greenschoolsalliance.org (accessed on 21 January 2016).
  19. United States Environmental Protection Agency. Healthy Schools, Healthy Kids. Available online: http://www.epa.gov/schools (accessed on 21 January 2016).
  20. Collaborative for High Performance Schools. Available online: http://www.chps.net/dev/Drupal/node (accessed on 21 January 2016).
  21. Energy Smart Schools: Department of Energy. Operating and Maintaining EnergySmart Schools. Available online: http://doe.cepfi.org (accessed on 21 January 2016).
  22. UNESCO Education for Sustainable Development. Available online: http://www.unesco.org/new/en/education/themes/leading-the-international-agenda/education-for-sustainable-development (accessed on 21 January 2016).
  23. Olson, S.L.; Kellum, S. The Impact of Sustainable Buildings on Educational Achievements in K-12 Schools; Leonardo Academy Inc.: Madison, WI, USA, 2003; pp. 1–14. Available online: http://www.cleanerandgreener.org/resources/reports.html (accessed on 20 January 2016).
  24. Committee to Review and Assess the Health and Productivity Benefits of Green Schools; National Research Council. Green Schools: Attributes for Health and Learning; National Academies Press: Washington, DC, USA, 2006; pp. 1–14. Available online: http://nap.edu/catalog/11756.html (accessed on 21 January 2016).
  25. Baird, G. Incorporating User Performance Criteria into Building Sustainability Rating Tools (BSRTs) for Buildings in Operation. Sustainability 2009, 1, 1069–1086. [Google Scholar] [CrossRef]
  26. Bal, M.; Bryde, D.; Fearon, D.; Ochieng, E. Stakeholder Engagement: Achieving Sustainability in the Construction Sector. Sustainability 2013, 6, 695–710. [Google Scholar] [CrossRef]
  27. Elfors, S. Research as tool for change? Int. J. Sustain. Dev. 2006, 9, 1–15. [Google Scholar] [CrossRef]
  28. Wong, L.T.; Mui, K.W.; Hui, P.S. A multivariate logistic model for acceptance of indoor environmental quality (IEQ) in offices. Build. Environ. 2008, 43, 1–6. [Google Scholar] [CrossRef]
  29. Corgnati, S.P.; Filippi, M.; Viazzo, S. Perception of the thermal environment in high school and university classrooms: Subjective preferences and thermal comfort. Build. Environ. 2007, 42, 951–959. [Google Scholar] [CrossRef]
  30. Palmer, J. Post-Occupancy Evaluation of Buildings. In A Handbook of Sustainable Building Design & Engineering; Mumovic, D., Santamouris, M., Eds.; Earthscan: London, UK, 2009; pp. 349–357. [Google Scholar]
  31. Sims, W.; Becker, F.; Quinn, K. Organizational Workplace Analysis for Selecting and Designing Alternative Workplace Strategies. In Building Evaluation Techniques; Baird, G., Gray, J., Isaacs, N., Kernohan, D., McIndoe, G., Eds.; McGraw-Hill: New York, NY, USA, 1996; pp. 31–36. [Google Scholar]
  32. Leaman, A. User Satisfaction. In Building Evaluation Techniques; Baird, G., Gray, J., Isaacs, N., Kernohan, D., McIndoe, G., Eds.; McGraw-Hill: New York, NY, USA, 1996; pp. 36–43. [Google Scholar]
  33. Sanoff, H. A Collaborative Process for Designing a Responsive Elementary School. In Building Evaluation Techniques; Baird, G., Gray, J., Isaacs, N., Kernohan, D., McIndoe, G., Eds.; McGraw-Hill: New York, NY, USA, 1996; pp. 98–110. [Google Scholar]
  34. Dale, A.; Ling, C.; Newman, L. Community Vitality: The Role of Community-Level Resilience Adaptation and Innovation in Sustainable Development. Sustainability 2010, 2, 215–231. [Google Scholar] [CrossRef]
  35. Siskos, P.A.; Bouba, K.E.; Stroubou, A.E. Determination of Selected Pollutants and Measurement of Physical Parameters for the Evaluation of Indoor Air Quality in School Buildings in Athens, Greece. Indoor Built Environ. 2001, 10, 185–192. [Google Scholar] [CrossRef]
  36. Santamouris, M.; Mihalakakou, G.; Patargias, P.; Gaitani, N.; Sfakianaki, K.; Papaglastra, M.; Pavlou, C.; Doukas, P.; Primikiri, E.; Geros, V.; et al. Using Intelligent clustering techniques to classify the energy performance of school buildings. Energy Build. 2007, 39, 45–61. [Google Scholar] [CrossRef]
  37. Diapouli, E.; Chaloulakou, A.; Spyrellis, N. Indoor and Outdoor Particulate Matter Concentrations at Schools in the Athens Area. Indoor Built Environ. 2007, 16, 55–61. [Google Scholar] [CrossRef]
  38. Diapouli, E.; Chaloulakou, A.; Mihalopoulos, N.; Spyrellis, N. Indoor and Outdoor PM mass and number concentrations at Schools in the Athens Area. Environ. Monit. Assess. 2008, 136, 12–20. [Google Scholar] [CrossRef] [PubMed]
  39. Skarlatos, D.; Manatakis, M. Effects of Classroom Noise on Students and Teachers in Greece. Percept. Mot. Skills 2003, 96, 539–544. [Google Scholar] [CrossRef] [PubMed]
  40. Papachristou, M. Organosi kae Dioikis tou Physikou kae Paedagogikou Perivallontos kae is Ypodomis ton Ktirion sti Defterovathmia Ekpaedfsi. (Organization and Administration of the Physical and Pedagogical Environment and Building Infrastructure in Secondary Education). Ph.D. Thesis, Panteion University, Athens, Greece, 2002; pp. 268–270. [Google Scholar]
  41. Argyropoulos, G. Architektoniki kae Koini Gnomi: Einae o kos. Bernardakis architektonas? (Architecture and Public Opinion: Is Mr. Bernardakis an architect?). In VPRC Public Opinion in Greece 2004; Bernardakis, C., Ed.; Savvalas Publishing: Athens, Greece, 2005; pp. 452–463. [Google Scholar]
  42. Education Research Centre. Apotyposi tou Ekpaedeftikou Systimatos se Epipedo Scholikon Monadon. (Chartering of the Educational System at the School Unit Level); Koulaidis, V., Ed.; Education Research Centre: Athens, Greece, 2005. (In Greek) [Google Scholar]
  43. Stamatis, P.I. Ktiriologikos Schediasmos Ekpaedeftikon Monadon. (Building Infrastructional Desighn of Educational Units). In Themata Ekpaedeftikou Schediasmou; Kalavasis, F., Kontakos, A., Eds.; University of the Aegean—Atrapos: Athens, Greece, 2007; pp. 84–99. (In Greek) [Google Scholar]
  44. Kourmpanis, B.; Papadopoulos, A.; Moustakas, K.; Stylianou, M.; Haralambous, K.J.; Loizidou, M. Preliminary study for the management of construction and demolition waste. Waste Manag. Res. 2008, 26, 267–275. [Google Scholar] [CrossRef] [PubMed]
  45. Organismos Scholikon Ktirion. Odigies Bioklimatikou Schediasmou Scholikon Ktirion (Guidelines for Bioclimatic Design of School Buildings). Available online: http://www.ktyp.gr/files/prodiagrafes/ypodomes_paideias/Bioklimatika.pdf (accessed on 24 January 2016). (In Greek)
  46. Beynon, J. Physical Facilities for Education: What Planners Need to Know; UNESCO, International Institute for Educational Planning: Paris, France, 1997. [Google Scholar]
  47. Germanos, D. Oi Toichoi Tis Gnosis (The Walls of Knowledge); Gutenberg: Athens, Greece, 2002. (In Greek) [Google Scholar]
  48. Cohen, L.; Manion, L. Research Methods in Education, 3rd ed.; Routledge: London, UK, 1994. [Google Scholar]
  49. Building Design & Construction, Reed Research Group. Green Building White Paper Research—Schools. 2004. Available online: http://www.ncef.org/content/green-building-white-paper-research-schools (accessed on 18 January 2016).
  50. Green Flag Schools. The School Environment Survey. Available online: http://www.chej.org/wp-content/uploads/greenflag/EnvSurvey.pdf (accessed on 24 January 2016).
  51. DfEE Building Bulletin 84. Schools’ Environmental Assessment Method (SEAM); The Stationary Office: Norwich, UK, 1996. [Google Scholar]
  52. Montgomery County Public Schools; Fink, S. Summary of the 2005–2006 Surveys of School Environment. 2007. Available online: http://sharedaccountability.mcpsmd.org/reports/list.php?selection=743 (accessed on 24 January 2016).
  53. Rajakorpi, A; Rajakorpi, H. Sustainable Development in Schools and Educational Institutions: Evaluation 7/2001. National Board of Education, Finland. Available online: http://www.oph.fi/download/47720_kekenglish.pdf (accessed on 24 January 2016).
  54. George, D.; Mallery, P. SPSS for Windows Step by Step, A Simple Guide and Reference 11.0 Update, 4th ed.; Allyn and Bacon: Boston, MA, USA, 2003. [Google Scholar]
  55. Alreck, P.L.; Settle, R.B. The Survey Research Handbook, 2nd ed.; Irwin: Chicago, IL, USA, 1995. [Google Scholar]
  56. Gay, L.R.; Diehl, P.L. Research Methods for Business and Management; Macmillan: New York, NY, USA, 1992. [Google Scholar]
  57. Netemeyer, R.G.; Bearden, W.O.; Sharma, S. Scaling Procedures; Sage Publications Inc.: Thousand Oaks, CA, USA, 2003; p. 100. [Google Scholar]
  58. Krosnick, J.A.; Fabrigar, L.R. Designing Rating Scales for Effective Measurement in Surveys. In Survey Measurement and Process Quality; Lyberg, L., Biemer, P., Collins, M., de Leeuw, E., Dippo, C., Schwarz, N., Trewin, D., Eds.; John Wiley & Sons. Inc.: New York, NY, USA, 1997; pp. 141–164. [Google Scholar]
  59. UCLA: Statistical Consulting Group. What is the Difference between Categorical, Ordinal and Interval Variables? Available online: http://www.ats.ucla.edu/stat/mult_pkg/whatstat/nominal_ordinal_interval.htm (accessed on 3 March 2016).
  60. UCLA: Statistical Consulting Group. What Statistical Analysis should I Use? Available online: http://www.ats.ucla.edu/stat/mult_pkg/whatstat (accessed on 3 March 2016).
  61. Garson, D.G. Testing Statistical Assumptions, 2012th ed.; Statistical Associates Publishing: Asheboro, NC, USA, 2012; p. 38. Available online: http://www.statisticalassociates.com/assumptions.pdf (accessed on 24 January 2016).
  62. Hole, G. Research Skills Kruskal-Wallis Handout, Version 1. 2015. Available online: http://users.sussex.ac.uk/-grahamh/RM1web/Kruskal-WallisHandoout2011.pdf (accessed on 3 March 2016).
  63. Bartholomew, D.J.; Steele, F.; Moustaki, I.; Galbraith, J.I. The Analysis and Interpretation of Multivariate Data for Social Scientists; Chapman & Hall/CRC: Boca Raton, FL, USA, 2002. [Google Scholar]
  64. Hellenic Ministry of Public Works. Thermal Insulation Regulation for Buildings; Decree-Law 4/7/1979; Hellenic Government Gazette No. 362D 1979; National Printing House: Athens, Greece, 1979; Available online: http://www.elinyae.gr/el/lib_file_upload/362d_79.1317112513734.pdf (accessed on 21 March 2016).
  65. Krosnick, J.A.; Presser, S. Question and Questionnaire Design. In Handbook of Survey Research, 2nd ed.; Marsden, P.V., Wright, J.D., Eds.; Emerald Group Publishing Ltd.: Bingley, UK, 2010; pp. 263–313. [Google Scholar]
  66. Krosnick, J.A.; Holbrook, A.L.; Berent, M.K.; Carson, R.T.; Michael Hanemann, W.; Kopp, R.J.; Cameron Mitchell, R.; Presser, S.; Ruud, P.A.; Kerry Smith, V.; et al. The Impact of “No Opinion” Response Options on Data Quality: Non-Attitude Reduction or an Invitation to Satisfice? Public Opin. Q. 2002, 66, 371–403. [Google Scholar] [CrossRef]
  67. Krosnick, J.A. Response strategies for coping with the cognitive demands of attitudes measures in surveys. Appl. Cogn. Psychol. 1991, 5, 213–236. [Google Scholar] [CrossRef]
  68. Chaney, B.; Lewis, L. Public School Principals Report on Their School Facilities: Fall 2005 (NCES 2007-007); U.S. Department of Education, National Center for Education Statistics: Washington, DC, USA, 2007; p. 42. [Google Scholar]
  69. Powers, A.L.; Duffin, M.; Program Evaluation & Educational Research (PEER) Associates. An Evaluation of the Sustainable Schools Project 2003–2004. Available online: http://www.peecworks.org/PEEC/PEEC_Reports/S01795C80-01795F0F (accessed on 18 January 2016).
  70. Schneider, M. Public School Facilities and Teaching: Washington, DC and Chicago. Report. 21st Century School Fund. Available online: http://www.21csf.org/csf-home/Documents/Teacher_Survey/SCHOOL_FACS_AND_TEACHING.pdf (accessed on 18 January 2016).
  71. Vitantzakis, N.B. Quality in Primary Education; Interbooks: Athens, Greece, 2006; p. 34. [Google Scholar]
  72. Organisation for Economic Co-operation and Development. Resources Invested in Education (Chapter 3). Available online: http://www.oecd.org/pisa/keyfindings/Vol4Ch3.pdf (accessed on 7 March 2016).
  73. Kang, J.E.; Ahn, K.U.; Park, C.S.; Schuetze, T. Assessment of Passive vs. Active Strategies for a School Building Design. Sustainability 2015, 7, 15136–15151. [Google Scholar] [CrossRef]
  74. Xanthakou, Y.; Christodoulakis, P.T. Perivallon kae scholika ktiria: Erevna me mathites tou dimotikou yia tis ypodomes kae to physiko kae koinoniko perivallon tou scholeiou (Environment and school buildings: Research with primary-school pupils on infrastructures and the physical and social school environment. In Diergasies Skepsis Sto Scholeio Kae Tin Koinonia (Thought Processes in School and Society); Fokial, P., Andreadakis, N., Xanthakou, Y., Eds.; Pedio: Athens, Greece, 2011; Volume 1, pp. 324–363. [Google Scholar]
  75. Education Institute of Scotland. EIS Survey of New and Refurbished Schools. Available online: http://www.assembly.wales/NAfWDocuments/fin_3_-ppp-003_-_071105_-_eis.pdf - 28012008/fin_3_-ppp-003_-_071105_-_eis-English.pdf (accessed on 19 January 2016).
  76. Burch, A.L., Jr. Middle School Facilities for the Twenty-First Century: An Identification of Critical Design Elements by Selected Architects, Administrators and Teachers. Ph.D. Thesis, Texas A & M University, Tyler, TX, USA, 1994. [Google Scholar]
  77. Tsakiris, I.; Polemikos, N. I scholiki avli os choros mathisis kae I symvoli tou sti dimiourgia perivallontika ipefthinon politon: Antilipsis ton ekpedeftikon tis protovathmias ekpedefsis tis polis tis Rhodou (The school-yard as a place of learning and its contribution in creating environmentally-responsible citizens: Views of primary-school teachers in the city of Rhodes). In Diergasies Skepsis Sto Scholeio Kae Tin Koinonia (Thought Processes in School and Society); Fokiali, P., Andreadakis, N., Xanthakou, Y., Eds.; Pedio: Athens, Greece, 2011; Volume 1, pp. 364–396. [Google Scholar]
  78. Rosen, M.A. Engineering and Sustainability: Attitudes and Actions. Sustainability 2013, 5, 372–386. [Google Scholar] [CrossRef]
  79. Tacq, J. Multivariate Analysis Techniques in Social Science Research; Sage Publications: London, UK, 1997; pp. 266–271. [Google Scholar]
  80. Grafakos, S.; Flamos, A.; Enseñado, E.M. Preferences Matter: A Constructive Approach to Incorporating Local Stakeholders’ Preferences in the Sustainability Evaluation of Energy Technologies. Sustainability 2015, 7, 10922–10960. [Google Scholar] [CrossRef]
  81. Cohen, M; Wiek, A.; Kay, B.; Harlow, J. Aligning Public Participation to Stakeholders’ Sustainability Literacy—A Case Study on Sustainable Urban Development in Phoenix, Arizona. Sustainability 2015, 7, 8709–8728. [Google Scholar] [CrossRef]
  82. ELOT. ELOT EN Standard 16309 +A1: Sustainability of Construction Works—Assessment of Social Performance of Buildings—Calculation Methodology; ELOT: Athens, Greece, 2015. [Google Scholar]
  83. ELOT. ELOT EN Standard 15643–3: Sustainability of Construction Works—Assessment of Buildings–Part. 3: Framework of the Assessment of Social Performance; ELOT: Athens, Greece, 2012. [Google Scholar]
  84. Saaty, T.L. The Analytic Hierarchy Process; RWS Publications: Pittsburgh, PA, USA, 1996. [Google Scholar]
  85. Hansmann, R. “Sustainability Learning”: An Introduction to the Concept and Its Motivational Aspects. Sustainability 2010, 2, 2873–2897. [Google Scholar] [CrossRef]
  86. Thomas, I.; Sandri, O.; Hegarty, K. Green Jobs in Australia: A Status Report. Sustainability 2010, 2, 3792–3811. [Google Scholar] [CrossRef]
  87. Hellenic Ministry of the Environment, Energy and Climate Change; Centre for Renewable Energy Sources and Savings. National Energy Efficiency Action Plan. Greece, 2014; pp. 7, 97–98, 109–111. Available online: https://ec.europa.eu/energy/sites/ener/files/documents/EL_NEEAP_en version.pdf (accessed on 9 March 2016).
  88. Hellenic Ministry of the Environment and Energy. Regulation on the Energy Performance of Buildings (KENAK). Ministerial Decision Δ6/Β/οικ. 5825/30-3-2010; Hellenic Government Gazette: No. 407B; National Printing House: Athens, Greece, 2010; Available online: http://www.ypeka.gr/LinkClick.aspx?fileticket=u2VM2IzaXIc%3d&tabid=508 (accessed on 21 March 2016).
Scheme 1. Desired outcomes’ highest loadings on principal components for the four user groups.
Sustainability 08 00311 g001
Table 1. User group samples and survey participation.
User GroupSample NNumber of ParticipantsParticipation Percentage (%)
Principals17016798.23
Teachers38234289.53
Pupils99590590.96
Parents and Guardians99582282.61
Total2542223687.96
Table 2. Distribution of participating school buildings’ year of completion.
Time Intervals for Allocation of Sample’s School Building Year of CompletionNumber of Schools (n = 141)Percentage of Schools (%)
1880–188921.41
1890–189910.71
1900–190910.71
1910–191900.00
1920–192932.13
1930–193932.13
1940–194900.00
1950–195953.55
1960–1969117.80
1970–19792819.86
1980–19892920.57
1990–19993826.95
2000–20062014.18
Total141100
Table 3. Rating of quality of the school building, its construction materials and its equipment materials.
RatingGroups
PrincipalsTeachersPupilsParents/Guardians
Unacceptably bad2.40%5.93%7.30%6.02%
Bad7.20%6.53%8.80%8.23%
Fair39.80%34.72%36.20%31.45%
Good45.20%43.92%38.30%35.63%
Very good5.40%8.90%9.40%13.14%
I don’t know---5.53%
Total n (100%)166337901814
Chi-Square value141.892217.555448.184439.071
df4445
Asymp. Sig.0.0000.0000.0000.000
Table 4. Dependence between rating of the school building quality variable and derived school-building age (DSBA).
School Characteristic VariableGroups’ Ratings of School Building Quality Variable
PrincipalsTeachersPupilsParents/Guardians
DSBAχ² (2, 129) = 7.816, p = 0.020χ² (4, 287) = 23.041, p = 0.000χ² (4, 766) = 39.956, p = 0.000χ² (5, 695) = 46.475, p = 0.000
Table 5. Rating of the importance of selection and use in schools of environmentally friendly and health-friendly materials.
RatingGroups
PrincipalsTeachersPupilsParents/Guardians
Unimportant0%0%0.6%0.491%
Slightly important0%0%1.3%1.227%
Fairly important1.8%1.2%7.4%5.276%
Very important29.9%18.0%27.4%26.749%
Extremely important67.7%79.3%60.5%64.417%
I don’t know0.6%1.5%2.9%1.840%
Total n (100%)164338903815
Chi-Square value195.317556.5091518.6541580.134
df3355
Asymp. Sig.0.0000.0000.0000.000
Table 6. Opinions on school community participation in planning/selecting “ecological solutions”.
ResponseGroups
PrincipalsTeachersParents
No3.704%2.67%2.22%
Yes, optionally26.543%31.46%36.70%
Yes, definitely65.432%63.20%56.03%
I don’t know4.321%2.67%5.05%
Total n (100%)162337812
Chi-Square value163.185336.792655.163
df333
Asymp. Sig.0.0000.0000.000
Table 7. Pupils’ opinions on their participation for a more attractive and ecological school environment.
ResponsePupil %
No1.56%
Yes, optionally39.40%
Yes, definitely57.25%
I don’t know1.79%
Total (n = 896):100%
Chi-Square value:837.170
df = 3Asymp. Sig. = 0.000
Table 8. Principals’ responses/ratings of desired outcomes’ importance with selection and use in school of materials friendly to the environment and health.
Desired OutcomePrincipals‘ Responses/Ratings ¹Chi-squaredfAsymp. Sig.
1U2 SI3 FI4 VI5 EIIDKTotal (n)
A. Better air quality017321132155291.67740.00
B. Toxic-products/substances elimination003251253156261.12830.00
C. Better long-term maintenance022442721415496.77940.00
D. Improved thermal comfort (cool in summer, warm in winter)011440947156186.37240.00
E. More efficient and enhanced lighting101242937155187.16140.00
F. Energy efficiency0113281077156243.10340.00
G. Water efficiency061934818148128.28440.00
H. Improved acoustics/Noise protection021543817148145.51440.00
I. More spacious, natural and attractive environment011437933148197.40540.00
J. Innovative use of whole school as teaching-tool111334926147254.10250.00
1 Response abbreviations: U: Unimportant, SI: Slightly Important, FI: Fairly Important, VI: Very Important, EI: Extremely Important, IDK: I Don’t Know.
Table 9. Teachers’ responses/ratings of desired outcomes’ importance with selection and use in school of materials friendly to the environment and health.
Desired OutcomeTeachers’ Responses/Ratings ¹Chi-squaredfAsymp. Sig.
1U2 SI3 FI4 VI5 EIIDKTotal (n)
A. Better air quality1012572601331741.43240.00
B. Toxic-products/substances elimination003292991332755.37330.00
C. Better long-term maintenance23479517311331417.58650.00
D. Improved thermal comfort (cool in summer, warm in winter)0321892192334509.35340.00
E. More efficient and enhanced lighting0124802262333538.72740.00
F. Energy efficiency0222762285339541.97040.00
G. Water efficiency216308218210322443.98850.00
H. Improved acoustics/Noise protection0134871946322398.46640.00
I. More spacious, natural and attractive environment0331871993323422.34240.00
J. Innovative use of whole school as teaching-tool1630841899319504.73050.00
1 Response abbreviations: See Table 8 footer.
Table 10. Pupils’ responses/ratings of desired outcomes’ importance with selection and use in school of materials friendly to the environment and health.
Desired OutcomePupils‘ Responses/Ratings ¹Chi-squaredfAsymp. Sig.
1U2 SI3 FI4 VI5 EIIDKTotal (n)
A. Better air quality978726352048901451.24050.00
B. Toxic-products/substances elimination7881220550248901524.49450.00
C. Better long-term maintenance63321331228240886637.44550.00
D. Improved thermal comfort (cool in summer, warm in winter)101410329646128861220.40650.00
E. More efficient and enhanced lighting5501772863619888774.51450.00
F. Energy efficiency258624422126443883394.07650.00
G. Water efficiency379121522228535885386.92550.00
H. Improved acoustics/Noise protection164619828033311884683.77850.00
I. More spacious, natural and attractive environment104113423244588701003.44850.00
J. Innovative use of whole school as teaching-tool146317821436938876625.71250.00
1 Response abbreviations: See Table 8 footer.
Table 11. Parents’/guardians’ responses/ratings of desired outcomes’ importance with selection and use in school of materials friendly to the environment and health.
Desired OutcomeParents‘/Guardians‘ Responses/Ratings ¹Chi-squaredfAsymp. Sig.
1U2 SI3 FI4 VI5 EIIDKTotal (n)
A. Better air quality975216156778031814.38250.00
B. Toxic-products/substances elimination21135110627178022241.90050.00
C. Better long-term maintenance42813523936631803774.05950.00
D. Improved thermal comfort (cool in summer, warm in winter)102692188464157951168.05750.00
E. More efficient and enhanced lighting63311221041217790417.23150.00
F. Energy efficiency144115620933533788606.98550.00
G. Water efficiency135715219833038788552.63550.00
H. Improved acoustics/Noise protection74112221438621791815.93050.00
I. More spacious, natural and attractive environment32899227416167891001.38050.00
J. Innovative use of whole school as teaching-tool124410719139736787805.74550.00
1 Response abbreviations: See Table 8 footer.
Table 12. Dependence between importance ratings of desired outcomes variables and TIRZ and DSBA.
School Characteristic VariableGroups’ Dependent Desired-Outcomes Variables
VariablePupilsVariableParents/Guardians
TIRZBetter air qualityχ² (6, 877) = 21.059, p = 0.002More efficient and enhanced lightingχ² (8, 784) = 35.814, p = 0.000
Water efficiencyχ² (10, 885) = 18.769, p = 0.043
DSBAImproved acoustics/Noise protectionχ² (5, 751) = 14.639, p = 0.012

