Article

The Decoupling of Resource Consumption and Environmental Impact from Economic Growth in China: Spatial Pattern and Temporal Trend

1
Key Laboratory of Western China’s Environmental Systems (Ministry of Education), College of Earth and Environmental Sciences, Lanzhou University, Lanzhou 730000, China
2
Institute for Circular Economy in Western China, Lanzhou University, Lanzhou 730000, China
3
Key Lab of Pollution Ecology and Environmental Engineering, Institute of Applied Ecology, Chinese Academy of Sciences, Shenyang 110016, China
4
Institute for Advanced Sustainability Studies (IASS), Potsdam 14467, Germany
*
Author to whom correspondence should be addressed.
Sustainability 2016, 8(3), 222; https://doi.org/10.3390/su8030222
Submission received: 26 November 2015 / Revised: 19 February 2016 / Accepted: 24 February 2016 / Published: 29 February 2016
(This article belongs to the Section Environmental Sustainability and Applications)

Abstract

:
Unprecedented economic achievement in China has occurred along with rising resource consumption and waste productions levels. The goal of sustainability requires the decoupling of economic growth from resource consumption (resource decoupling) and environmental degradation (impact decoupling). For this paper, the performances of resource decoupling (energy and water) and impact decoupling (wastewater, SO2 and CO2) in China were evaluated, and the spatial pattern and temporal trend of decoupling performance were investigated by using the rescaled range analysis (R/S). The results indicate the following. (1) The performance of resource decoupling during the investigated period is worse than that of traditional impact (SO2 and wastewater) decoupling, but better than that of the CO2 emission. Additionally, the decoupling performances of energy consumption and related pollutant emission (except CO2) are better than that of water usage and wastewater discharge; (2) The decoupling performance of energy consumption, SO2 and CO2, has substantially improved from the 10th Five-Year Planning Period (FYP) (2001–2005) to the 11th FYP (2006–2010), which indicates that the decoupling performance is highly related the environmental policy; (3) The spatial disparities of the performance of resource and impact decoupling are declining, which indicates the existence of cross-province convergence in decoupling performance; (4) The decoupling performance of SO2 and water usage in most of regions shows an improving trend. Inversely, the decoupling performance of energy consumption, CO2 emission, and wastewater discharge in most regions show a decreasing trend; (5) China needs more stringent water-saving targets and wastewater discharge standards; better policy efforts to improve the water recycling level both in agricultural, industrial and municipal level are required to prevent the decreasing trend of the decoupling performance.

1. Introduction

The increasing environmental pressures, damage, and resource depletion calls for urgent policy initiatives to decouple economic growth rates from the rates of resources consumption (resource decoupling) and environmental degradation (impact decoupling) and to achieve the goal of sustainable development [1]. As the second largest economy, China’s spectacular economic growth has occurred along with the rising resource use and pollution emission level historically. For example, GDP in China has increased more than twenty-fold since 1978; meanwhile, the final energy consumption has increased more than six times, the volume of wastewater discharge increased more than two times, and SO2 emission increased almost two times, compared with the level of 1985. China has now become the largest energy consumer [2], the biggest energy-related CO2 emitter [3], the largest solid waste generator [4], and the largest single contributor to global SO2 emission [5] in the world. The unprecedented change that happened in China provides a unique opportunity to uncover the relationship between economic growth and resource consumption and environmental pollution, and its spatial pattern and temporal trend, which is very important for achieving environmental sustainability both for China and the rest of the world [6,7,8].
Being one of the most widely cited measurements of the relationship between economic growth and environmental pressure, decoupling refers to the breaking of the links between environmental bad and economic goods [9]. Nowadays, decoupling economic growth from environment impacts has become one of the most important topics related to sustainable development and has been proposed as the core objective of environmental governance and resource strategy. Decoupling analysis aims to identify the link between economic growth and resource consumption and pollution emissions [10]. The environmental Kuznets curve (EKC) hypothesis and the Factor 4 and Factor 5 are the earliest studies of decoupling [11]. The EKC was proposed to elaborate the relationship between pollution and economic growth, which was based on general reasoning around relative or absolute delinking in income–environment dynamics relationships [12,13]. The Factor 4 and Factor 5 set the absolute decoupling goals for resource consumption at the end of the 20th century [14].
Nowadays, a large amount of research focuses on the decoupling of energy consumption [10,15,16], water usage [17,18], CO2 emission [19,20,21,22,23,24], and other pollutants production (such as SO2, solid waste, wastewater, etc.) [4,6,10,25,26,27]. Two main kinds of decoupling are taken into account, which are defined as relative and absolute decoupling in present studies. Relative decoupling refers to a decrease of emissions intensity per unit of economic output. Absolute decoupling refers to an overall decrease of emissions as GDP increases [22]. Additionally, four main decoupling indicators have been developed. The first one is resource consumption intensity (e.g., energy/GDP ratio or energy/GDP per capital), which is the one of the most widely used macroeconomic indicators for estimating decoupling effects [16]; the second one is the decoupling factor introduced by the OECD [9]; the third one is elasticity measured by the ratio of change in the environment indicator to the percentage change in the economic indicator [28]; the last one is the aggregate resource or environmental efficiency [13,29,30].
Many studies have utilized different decoupling indicators to estimate the decoupling effect at the level of a single country and of the group of countries, while a few have recently attempted a global decoupling estimate. However, as noted by OECD [9], the isolated application of the decoupling indicator has the limitation because the decoupling concept does not capture the effects of environment externalities, and the decoupling indicators itself does not say anything about the real effort that certain countries need to make to achieve a particular target [23,31]. Therefore, many scholars attempt to combine the decoupling index with other evaluation methods, including decomposition [23,31,32] and econometrics [27,33,34,35], to make the decoupling index more effective. However, few studies have focused on exploring the temporal trend of the decoupling degree that would contribute to a better understanding of the dynamics of decoupling performance. This might be due to the non-linear characteristic of decoupling degree dynamics in a long time series [11,36], which makes it impossible to simulate the trend of decoupling degree by using linear regression analysis. Moreover, most of the studies about China barely focus on the spatial pattern of decoupling performance in China, which is important for making differentiated and specific environmental policies that achieve the goal of environmental sustainability at the local level.
In this paper, the decoupling of resource consumption, wastes productions, and CO2 emission from economic growth are first analyzed by using the decoupling indicator developed by Tapio (2005) [28]. The spatial pattern and temporal trend of the decoupling performance are then explored based on the rescaled range analysis (R/S) method. Section 2 in this paper presents the methodology applied in this research, and Section 3 presents the results and a discussion, followed by Section 4, the conclusion and policy implications.

2. Methodology and Data

2.1. Decoupling Analysis

Decoupling analysis aims to identify whether the link between environmental pressure and economic growth has broken. In this paper, GDP elasticity of environmental pressure [28] is applied to evaluate the decoupling performance (Equation (1)).
GDP elasticity of E = %ΔE/%ΔGDP
where E represents the variables of resource consumption and environmental pollution (includes final energy consumption, the volume of water usage, SO2 and CO2 emissions and wastewater discharge), %ΔE is the percentage changes in certain variables, and %ΔGDP is the percentage change in GDP. According to UNEP (2011), the decoupling includes resource decoupling (decoupling of economic growth rates from the rates of resource consumption) and impact decoupling (decoupling of growth rates from the rates of environmental degradation induced by pollutants productions and greenhouse emissions) [1].
According to Tapio (2005), eight decoupling zones could be distinguished: (1) an expansive negative decoupling zone: ΔGDP > 0, ΔE > 0 and %ΔE/%ΔGDP > 1.2; (2) an expansive coupling zone: ΔGDP > 0, ΔE > 0 and 0.8 ≤ %ΔE/%ΔGDP < 1.2; (3) a weak decoupling zone: ΔGDP > 0, ΔE > 0 and 0 ≤ %ΔE/%ΔGDP < 0.8; (4) a strong decoupling zone: ΔGDP > 0, ΔE < 0 and %ΔE/%ΔGDP < 0; (5) a recessive decoupling zone, ΔGDP < 0, ΔE < 0 and %ΔE/%ΔGDP < 1.2; (6) a recessive decoupling zone: ΔGDP < 0, ΔE < 0 and 0.8 ≤ %ΔE/%ΔGDP < 1.2; (7) a weak negative decoupling zone: ΔGDP < 0, ΔE < 0 and 0 ≤ %ΔE/%ΔGDP < 1.2; and (8) a strong negative decoupling zone: ΔGDP < 0, ΔE > 0 and %ΔE/%ΔGDP < 0. Actually, the results of decoupling analysis belong to the first four zones.

2.2. Hurst Exponent

The temporal trend of any indicator not only refers to the changing trajectory of the indicator in the past, but also indicates a possible change in direction in the future, which is more important for the design of future policy [37]. However, due to the non-linear characteristic of the time series of the decoupling indicator, which makes it is unable to simulate future changes in decoupling performance with simply linear regression analysis [11,36], few studies have focused on the temporal trend of decoupling performance. The Hurst exponent (H), which was originally proposed by Hurst to analysis the time series flow data of the Nile river, with theoretical improvements made by Mandelbrot and Wallis [37], is widely used to analyze the fractal behavior (or persistence) of a non-linear time series [38,39,40]. Thus, for this paper, the Hurst exponent is applied to investigate the possible future trends of decoupling performance.
The value of H could be obtained by using the rescaled range statistic (R/S) analysis, which is a fractal theory for time series research and has been widely applied in geography, geology, climate change, economics, and other fields [37,41,42,43]. The first step for calculating the Hurst exponents is to calculate the GDP elasticity of each indicator year-by-year (Supplementary Materials Tables S1–S5). Secondly, we applied the R/S method to get the values of the Hurst exponent. Then, we combined the H value and linear regression equation (time t was set as the independent variable, and the environmental indicators were set as the dependent variable) to investigate the dynamic tread of corresponding indicators. The details of the Hurst exponent estimation can be found in the reference of another publication [44].
The value of H ranges between 0 and 1. When the 0.5 < H < 1, it means that the time series shows persistent or trend-reinforcing behavior (a positive correlation), which means that the future trend of the time series will be consistent with the past, and the degree of persistent or trend-reinforcing depends on the extent of H’s closeness to 1 [45]. In our case, if the past decoupling degree has reduced (or increased), the degree in the future will also be reduced (or increased). If the value of H equals 0.5, this indicates that the time series is completely independent (there is no correlation between any element and a future element), and we cannot conclude whether the decoupling degree will reduce or increase. When the value of H ranges between 0 and 0.5, it indicates that the time series shows anti-persistent behavior (a negative correlation), which means the future trend of the time series will be the opposite of the past. Additionally, the degree of anti-persistence depends on the extent of H’s closeness to 0 [43,46,47,48]. In our case, if the past decoupling degree has a reductive (or increase) trend, the disparity of the future will assume the increase (or reductive) trend.

2.3. Data Sources

The research area is Mainland China, excluding the Hong Kong Special Administrative Region, the Macao Special Administrative Region, Taiwan Province, and the Tibet Autonomous Region. In this paper, we used the dataset of 30 provincial-level regions, including four centrally administered cities (Beijing, Tianjin, Shanghai and Chongqing), four autonomous regions (Inner Mongolia, Guangxi, Ningxia and Xinjiang), and 22 provinces. For this paper, final energy consumption and water usage were taken as the indicators of resource use, and SO2, CO2 and waste water discharge were taken as the indicators of environmental pollution. Considering the accessibility of data, the research period for each indicator is different: final energy consumption (1997–2012), water consumption (2002–2012), SO2 emission (1999–2012), CO2 (1997–2010) and waste water discharge (1999–2012). The data of final energy consumption comes from the China Energy Statistical Yearbook (1998–2013), the data of water consumption and Gross Domestic Production (GDP) comes from China Statistical Yearbook (2003–2013), the data of SO2 emission and waste water discharge comes from the China Environmental Statistical Yearbook, and the data of CO2 emission was abstracted from the reference of another publication [49]. The GDP data was measured as real GDP value in purchase power parity (at constant price in 1978) to eliminate the impact of price factors on the data.

3. Results and Discussion

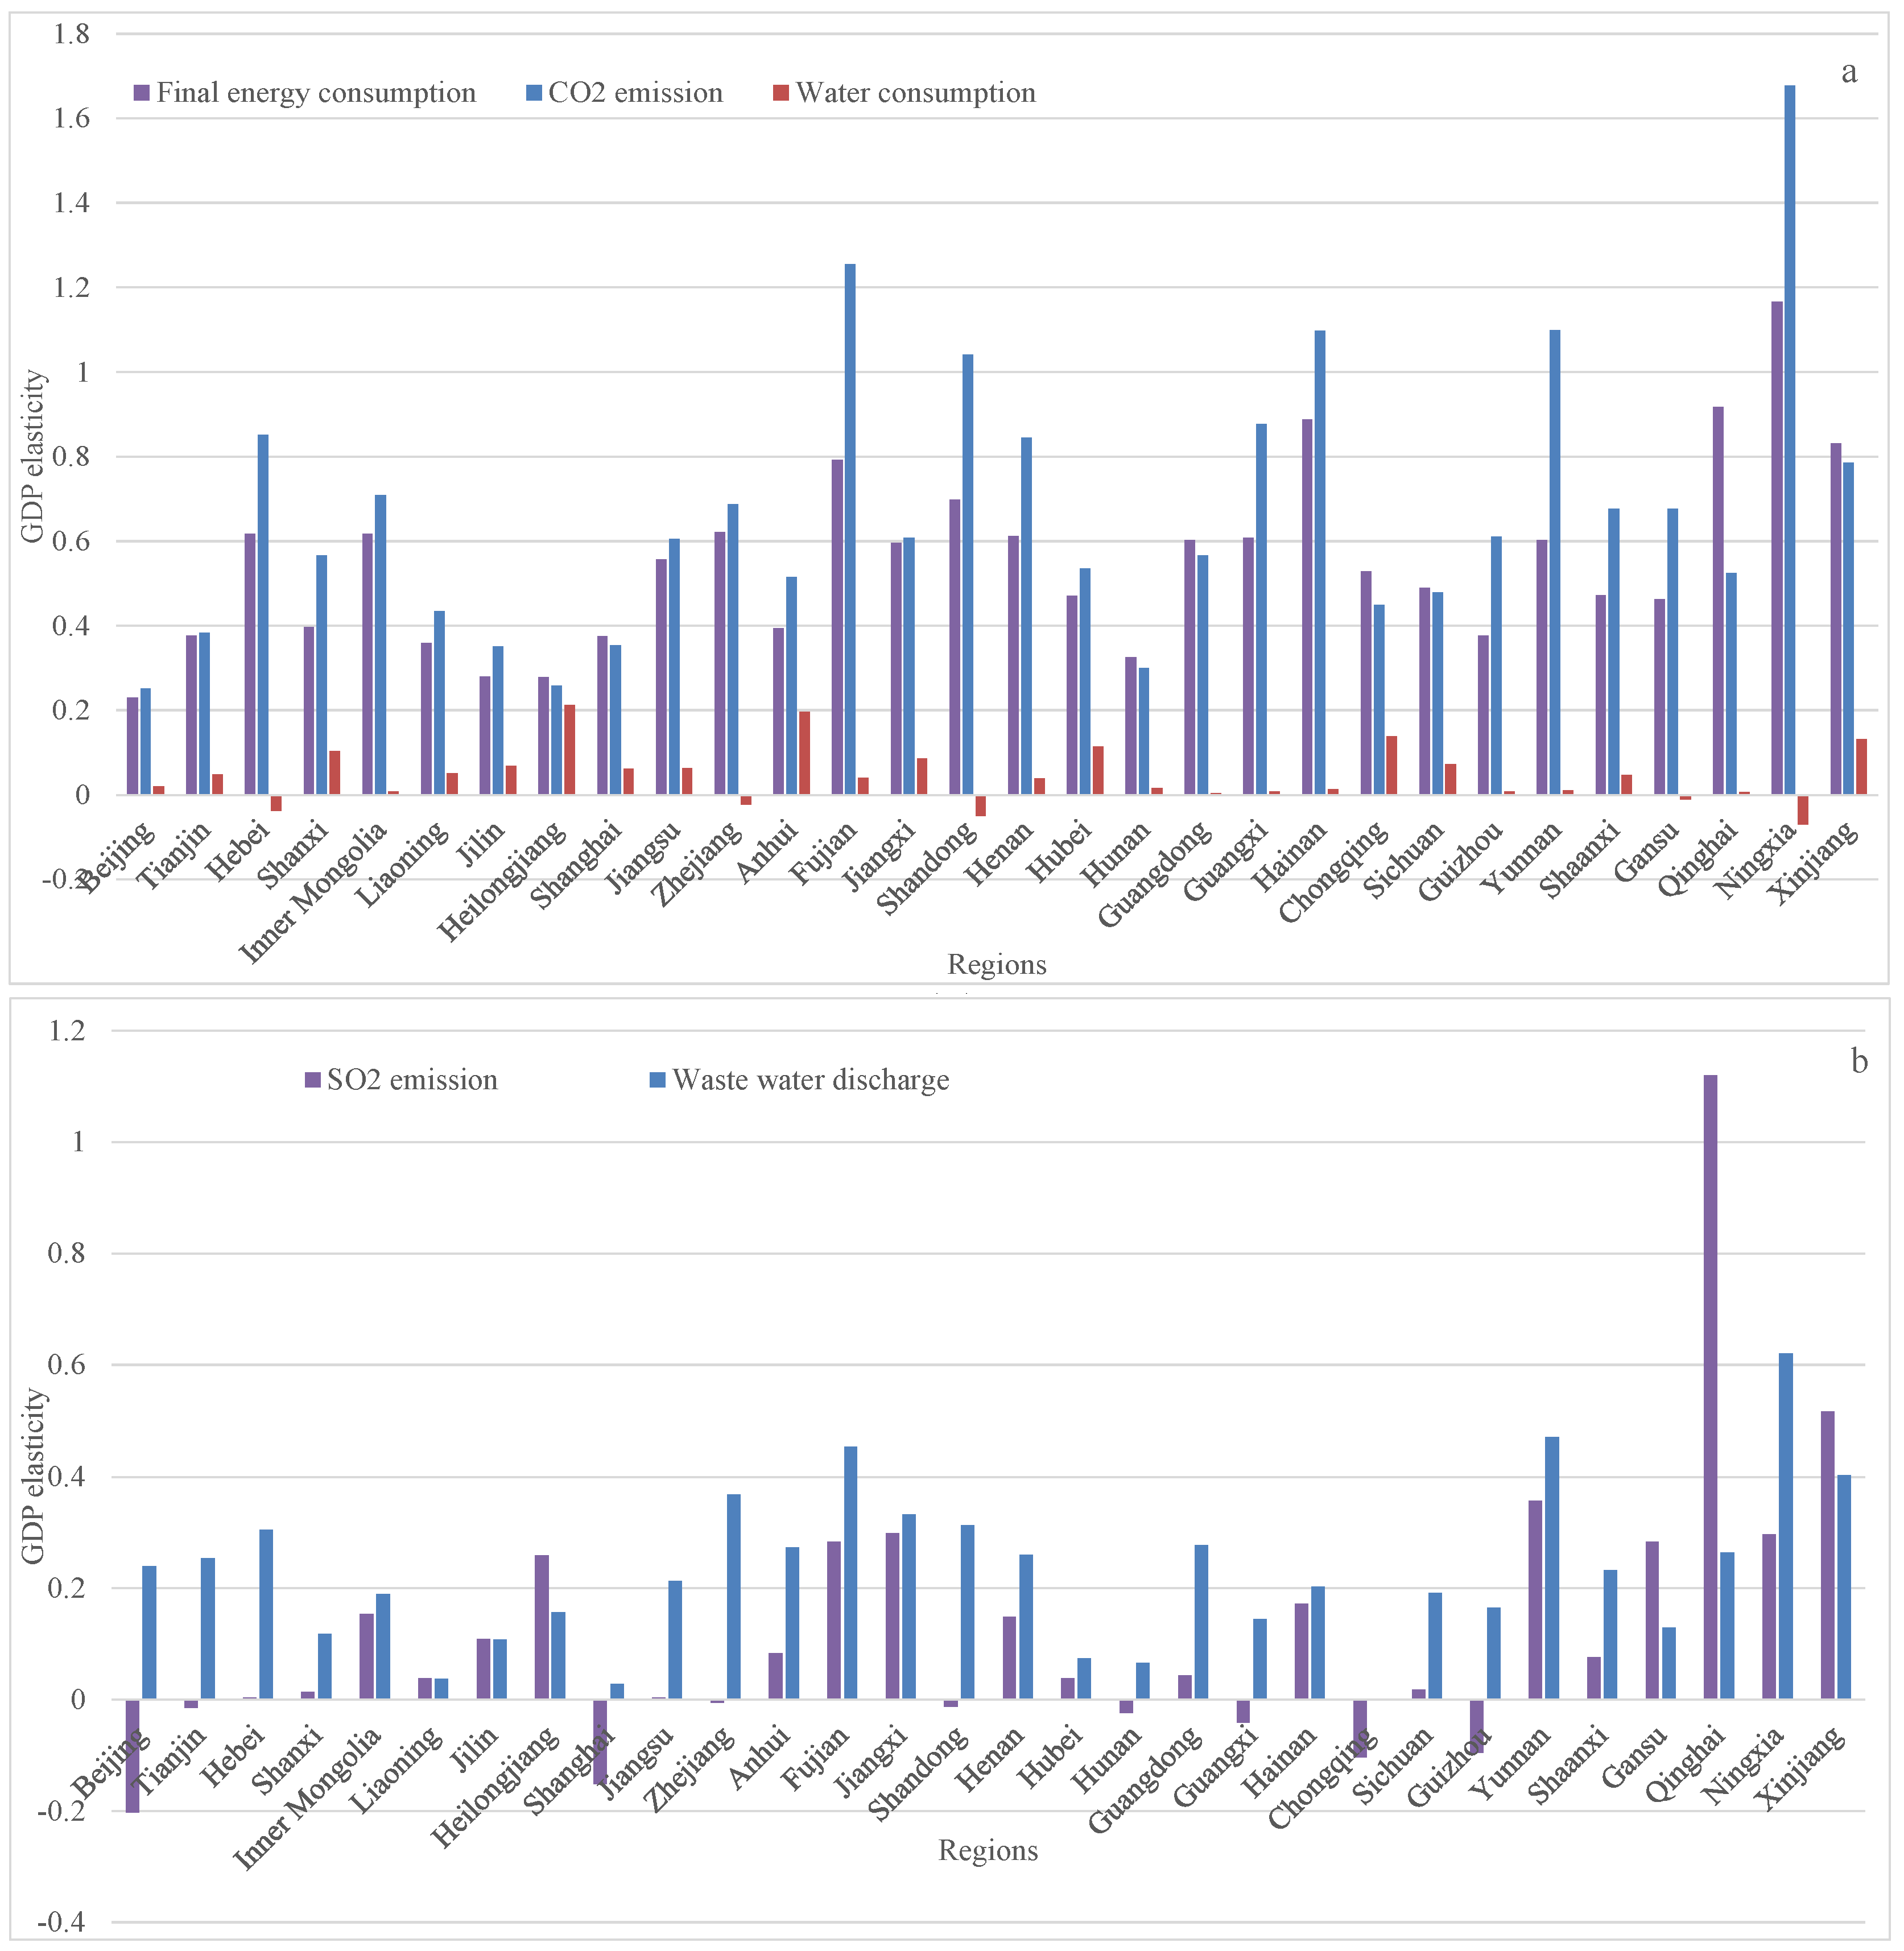
3.1. Decoupling Performance

To investigate the “resource decoupling” and “impact decoupling” and their time variation, the GDP elasticity of resources (energy and water) consumption and pollutions (waste water, SO2 and CO2) production during the whole period (Figure 1), as well as the 10th and 11th five-year planning (FYP) periods, 2001–2005 and 2006–2010, respectively (Figure 2), were calculated.
In general, the decoupling performances of water and energy consumption are worse than that of waste productions, but better than that of greenhouse gas emissions (Figure 1). In reference to the energy consumption, the decoupling performances of more than 85% of provinces in mainland China (26 provinces) presented weak decoupling during 1997–2012 (the GDP elasticity was between 0 and 0.8), and the four provinces of Qinghai, Ningxia and Xinjiang even presented expansive decoupling (the GDP elasticity was between 0.8 and 1.2) (Figure 1a). The decoupling performance of water usage is better than that of energy consumption. Specifically, the performances of the five provinces Hebei, Zhejiang, Shandong, Gansu and Ningxia presented strong decoupling (the GDP elasticity was below 0), and 25 provinces presented weak decoupling during 2002–2012, (Figure 1a). In the past 20 years, especially during the 11th FYP, the amount of energy consumption and water usage increased dramatically, with energy consumption increasing considerably faster than water use [50]. The higher rate of increase is the main reason for the worse decoupling performance of energy consumption compared to water usage. Another reason is the water-saving effects associated with the enforcement of energy-saving policies [50], especially in the industrial sectors.
For the impact decoupling effects, the decoupling performance of SO2 was better than that of the waste water in most provinces, except Heilongjiang, Liaoning, Jilin, Qinghai, Gansu and Xinjiang, which are located in the northeast and northwest of China (Figure 1b). The economic growth of these six provinces has been fueled by traditional heavy industries that mostly depend on a coal-based energy system. Specifically, the SO2 emission in 21 provinces (70%) presented weak decoupling, and another nine provinces (30%) presented strong decoupling. Since 1998, China has implemented the Two Control Zone (TCZ) policy, the scope of which includes the regions Beijing, Tianjin, Hebei, Shanxi, Inner Mongolia, Liaoning, Jilin, Shandong, Henan, Shaanxi, Gansu, Ningxia and Xinjiang, all of which are affected by high SO2 concentration and/or acid rain, to reduce the SO2 emission and mitigate acid deposition problems. In the two control zones, only three provinces, namely, Beijing, Tianjin, and Shandong, presented strong decoupling, and another 10 provinces presented weak decoupling. As for the wastewater discharge, only one province presented strong decoupling, while the rest of the 29 provinces presented weak decoupling. For the CO2 emission in China, 22 provinces presented weak decoupling, six provinces presented expansive decoupling, and two provinces presented expansive decoupling (Figure 1a).
Considering that most master plans of economic, social and environmental fields in China are five-year plans, new series of policies and programs are launched at the beginning of each FYP period and ending at the last year of each FYP period. Thus, the decoupling analysis for each FYP period, to some extent, can be used to evaluate the effects of resource and environmental policies and programs implemented in the corresponding FYP period.
As shown in Figure 2, the decoupling performance of energy consumption and SO2 emission has improved substantially due to the implementation of the Energy Saving and Emission Reduction (ESER) policy, which aims to reduce the energy intensity and SO2 emission by 20% and 10% in the 10th and 11th FYP periods, respectively. Specifically, for the final energy consumption, the decoupling performance of 28 provinces in the 11th FYP period was better than in the 10th FYP period. However, the performance of Chongqing and Anhui show the opposite. As for the SO2, the decoupling performance of all provinces in China in the 11th FYP period was better than the 10th period. In reference to the water consumption, the decoupling performance in each FYP period was better than that of the energy consumption. However, the performances of 15 provinces (50%) were worse in the 11th FYP period than in the 10th FYP period, and the other 50% of the provinces were better (14 provinces) or stable (Ningxia). In reference to the CO2, the decoupling performance has improved dramatically, which was indicated by the fact that the performances of 27 provinces were better in the 11th FYP period than in the 10th; only three provinces (Anhui, Chongqing and Ningxia) deviated from this. In order to reduce the CO2 emission, the Chinese government introduced the CO2 reduction target as the obligatory target of China’s 11th FYP, which was to reduce the CO2 per capital (intensity) by 20% in five years for the first time. Additionally, China has implemented a series of policies and programs to fulfill the national goal of CO2 reduction and also improved the decoupling performance of CO2 emission compared to the performance in the 10th FYP. As for the wastewater discharge, the decoupling performances of 21 provinces (70%) have improved. However, the extent of improvement was less than that of the SO2 and CO2 emissions. The performances of 9 other provinces became worse. Overall, the decoupling performance of energy consumption and related pollutants (including CO2) has improved from the 10th FYP to the 11th FYP due to the implementation of the ESER policy. However, the changes in decoupling performances of waste usage and related pollutant emission in most provinces (20) were in the same direction (six provinces became worse and other 14 provinces became better), which indicates that the pattern of water usage has a great impact on the wastewater discharge in China; thus, China needs comprehensive policy instruments to manage water resources and ensure the water quality at the same time.
From Figure 2, we can see regional disparities in the decoupling performance of each indicator. The disparities in the 10th FYP is greater than those of the 11th FYP, which is depicted by declining values of the standard deviation (Table 1). These results also indicate the gradual convergence of Chinese provinces in terms of their decoupling performance.
Above all, we found that the decoupling performance of waste production is greater than that of resource usage. The probable reasons for this are that: (1) The waste production could be effectively reduced by end-of-pipe treatment and other recycling means [11]; (2) the government and the public are more inclined toward waste production control due mainly to the direct relation between pollution and human health; (3) more stringent regulations and standards for emission reduction than those for resource saving in China. Moreover, it should be noted that the decoupling water usage is worse than that of energy, and the decoupling performance of wastewater discharge is worse than that of SO2 emission. In other words, the decoupling performance of water usage and related pollutant emission is worse than that of energy consumption and related pollutant emission. China is facing serious water shortage and water pollution problems, which calls for more stringent water saving targets and wastewater discharge standards; better policy efforts to improve the water recycling level both in agricultural, industrial and municipal level are required [51,52].

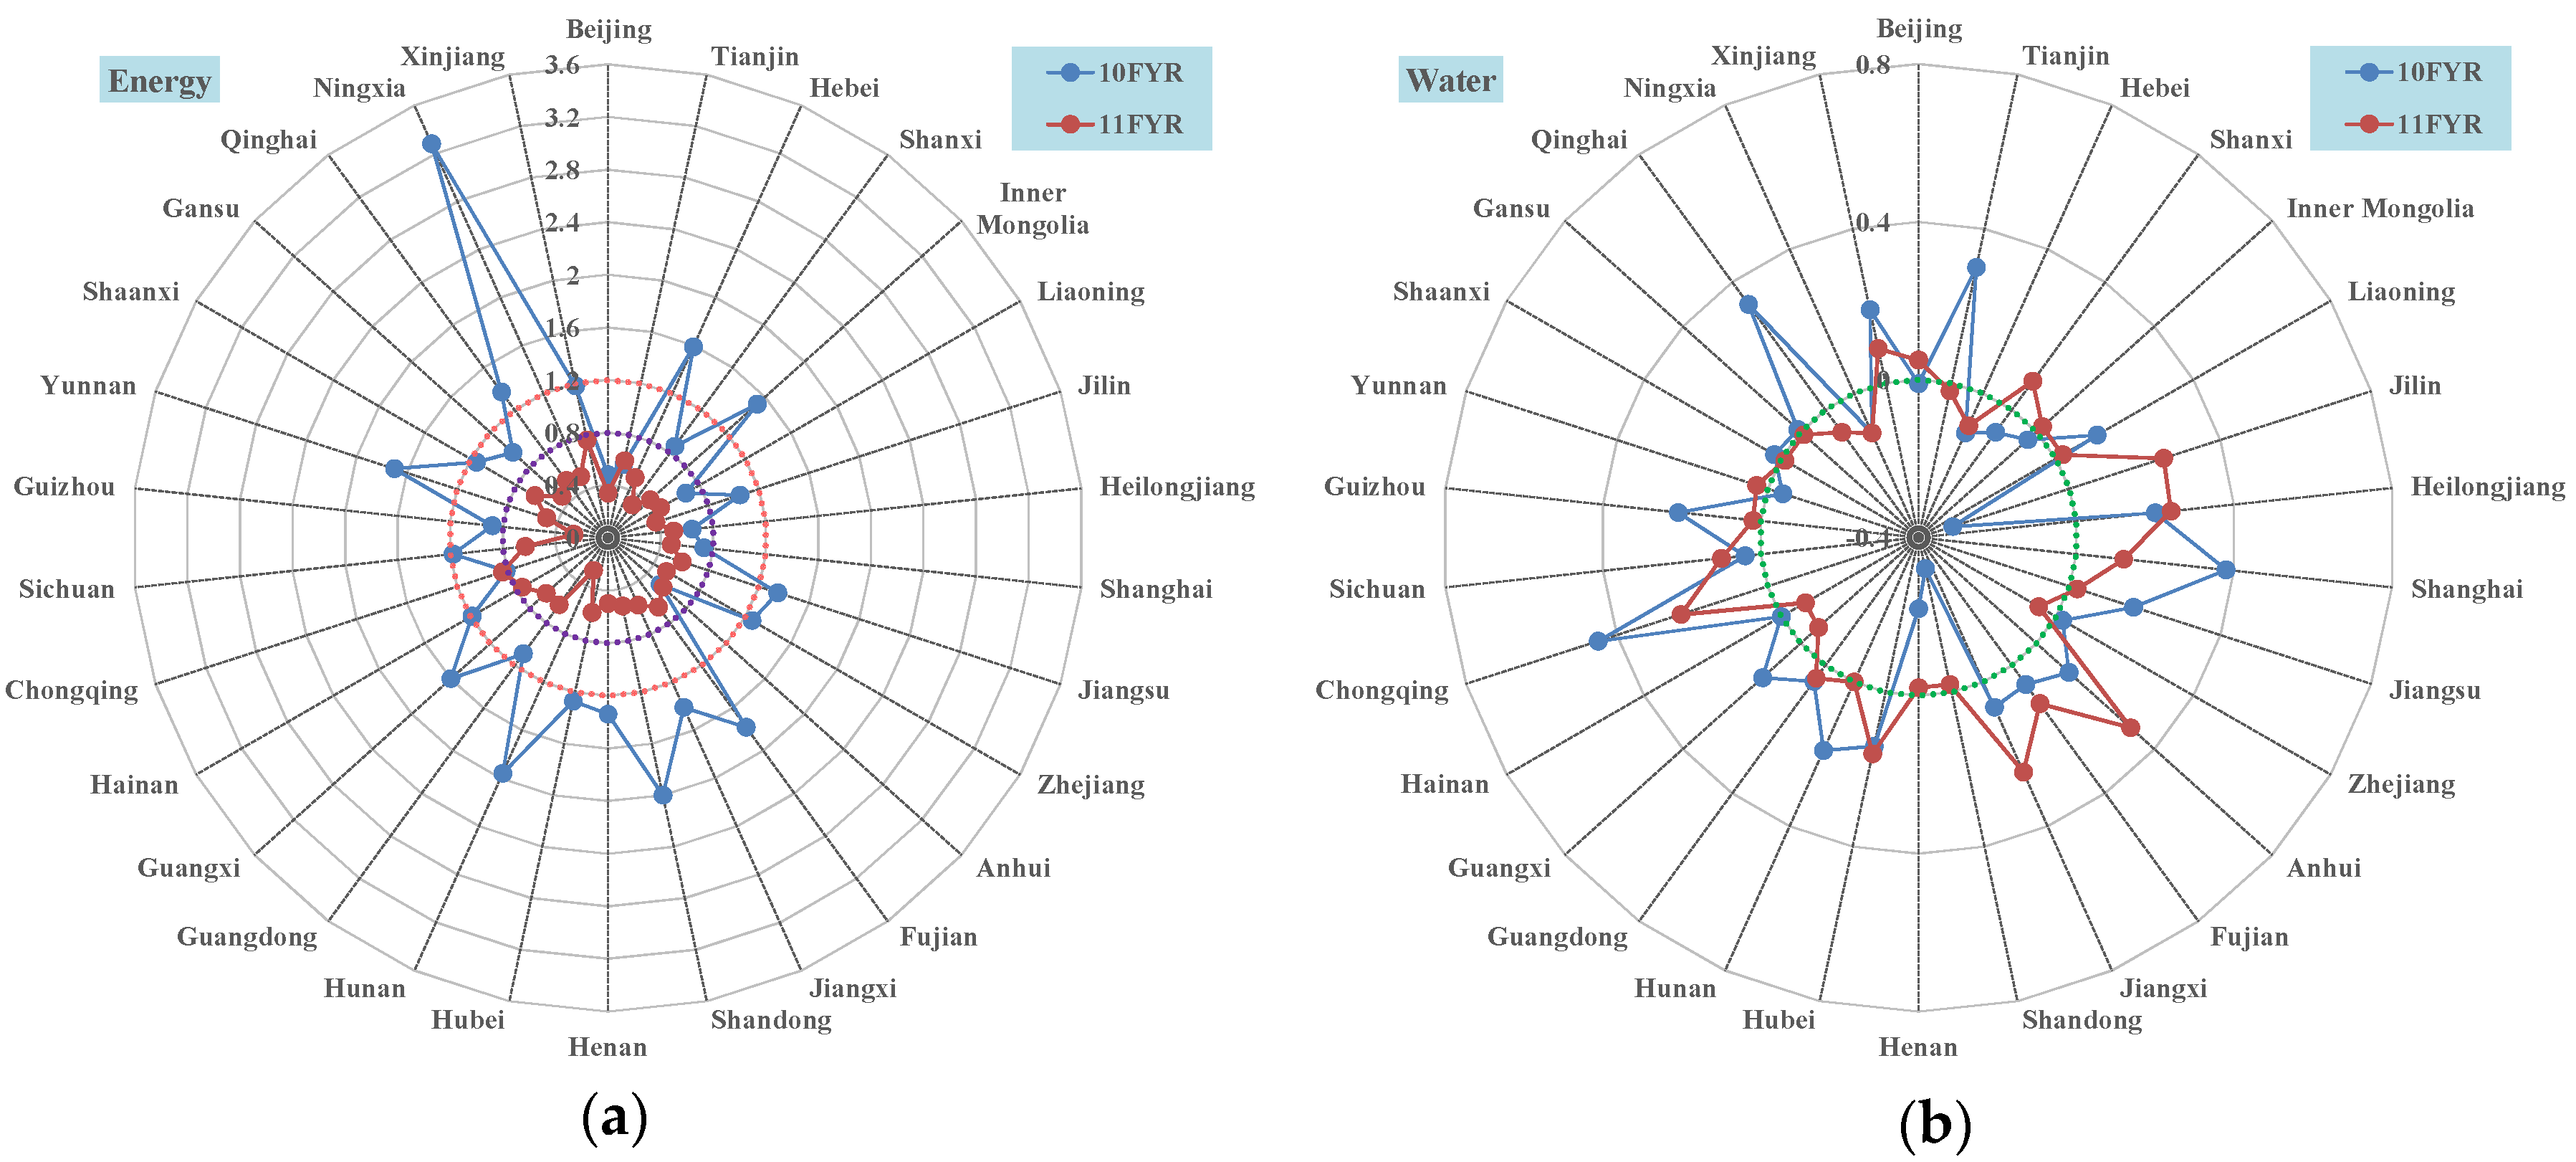
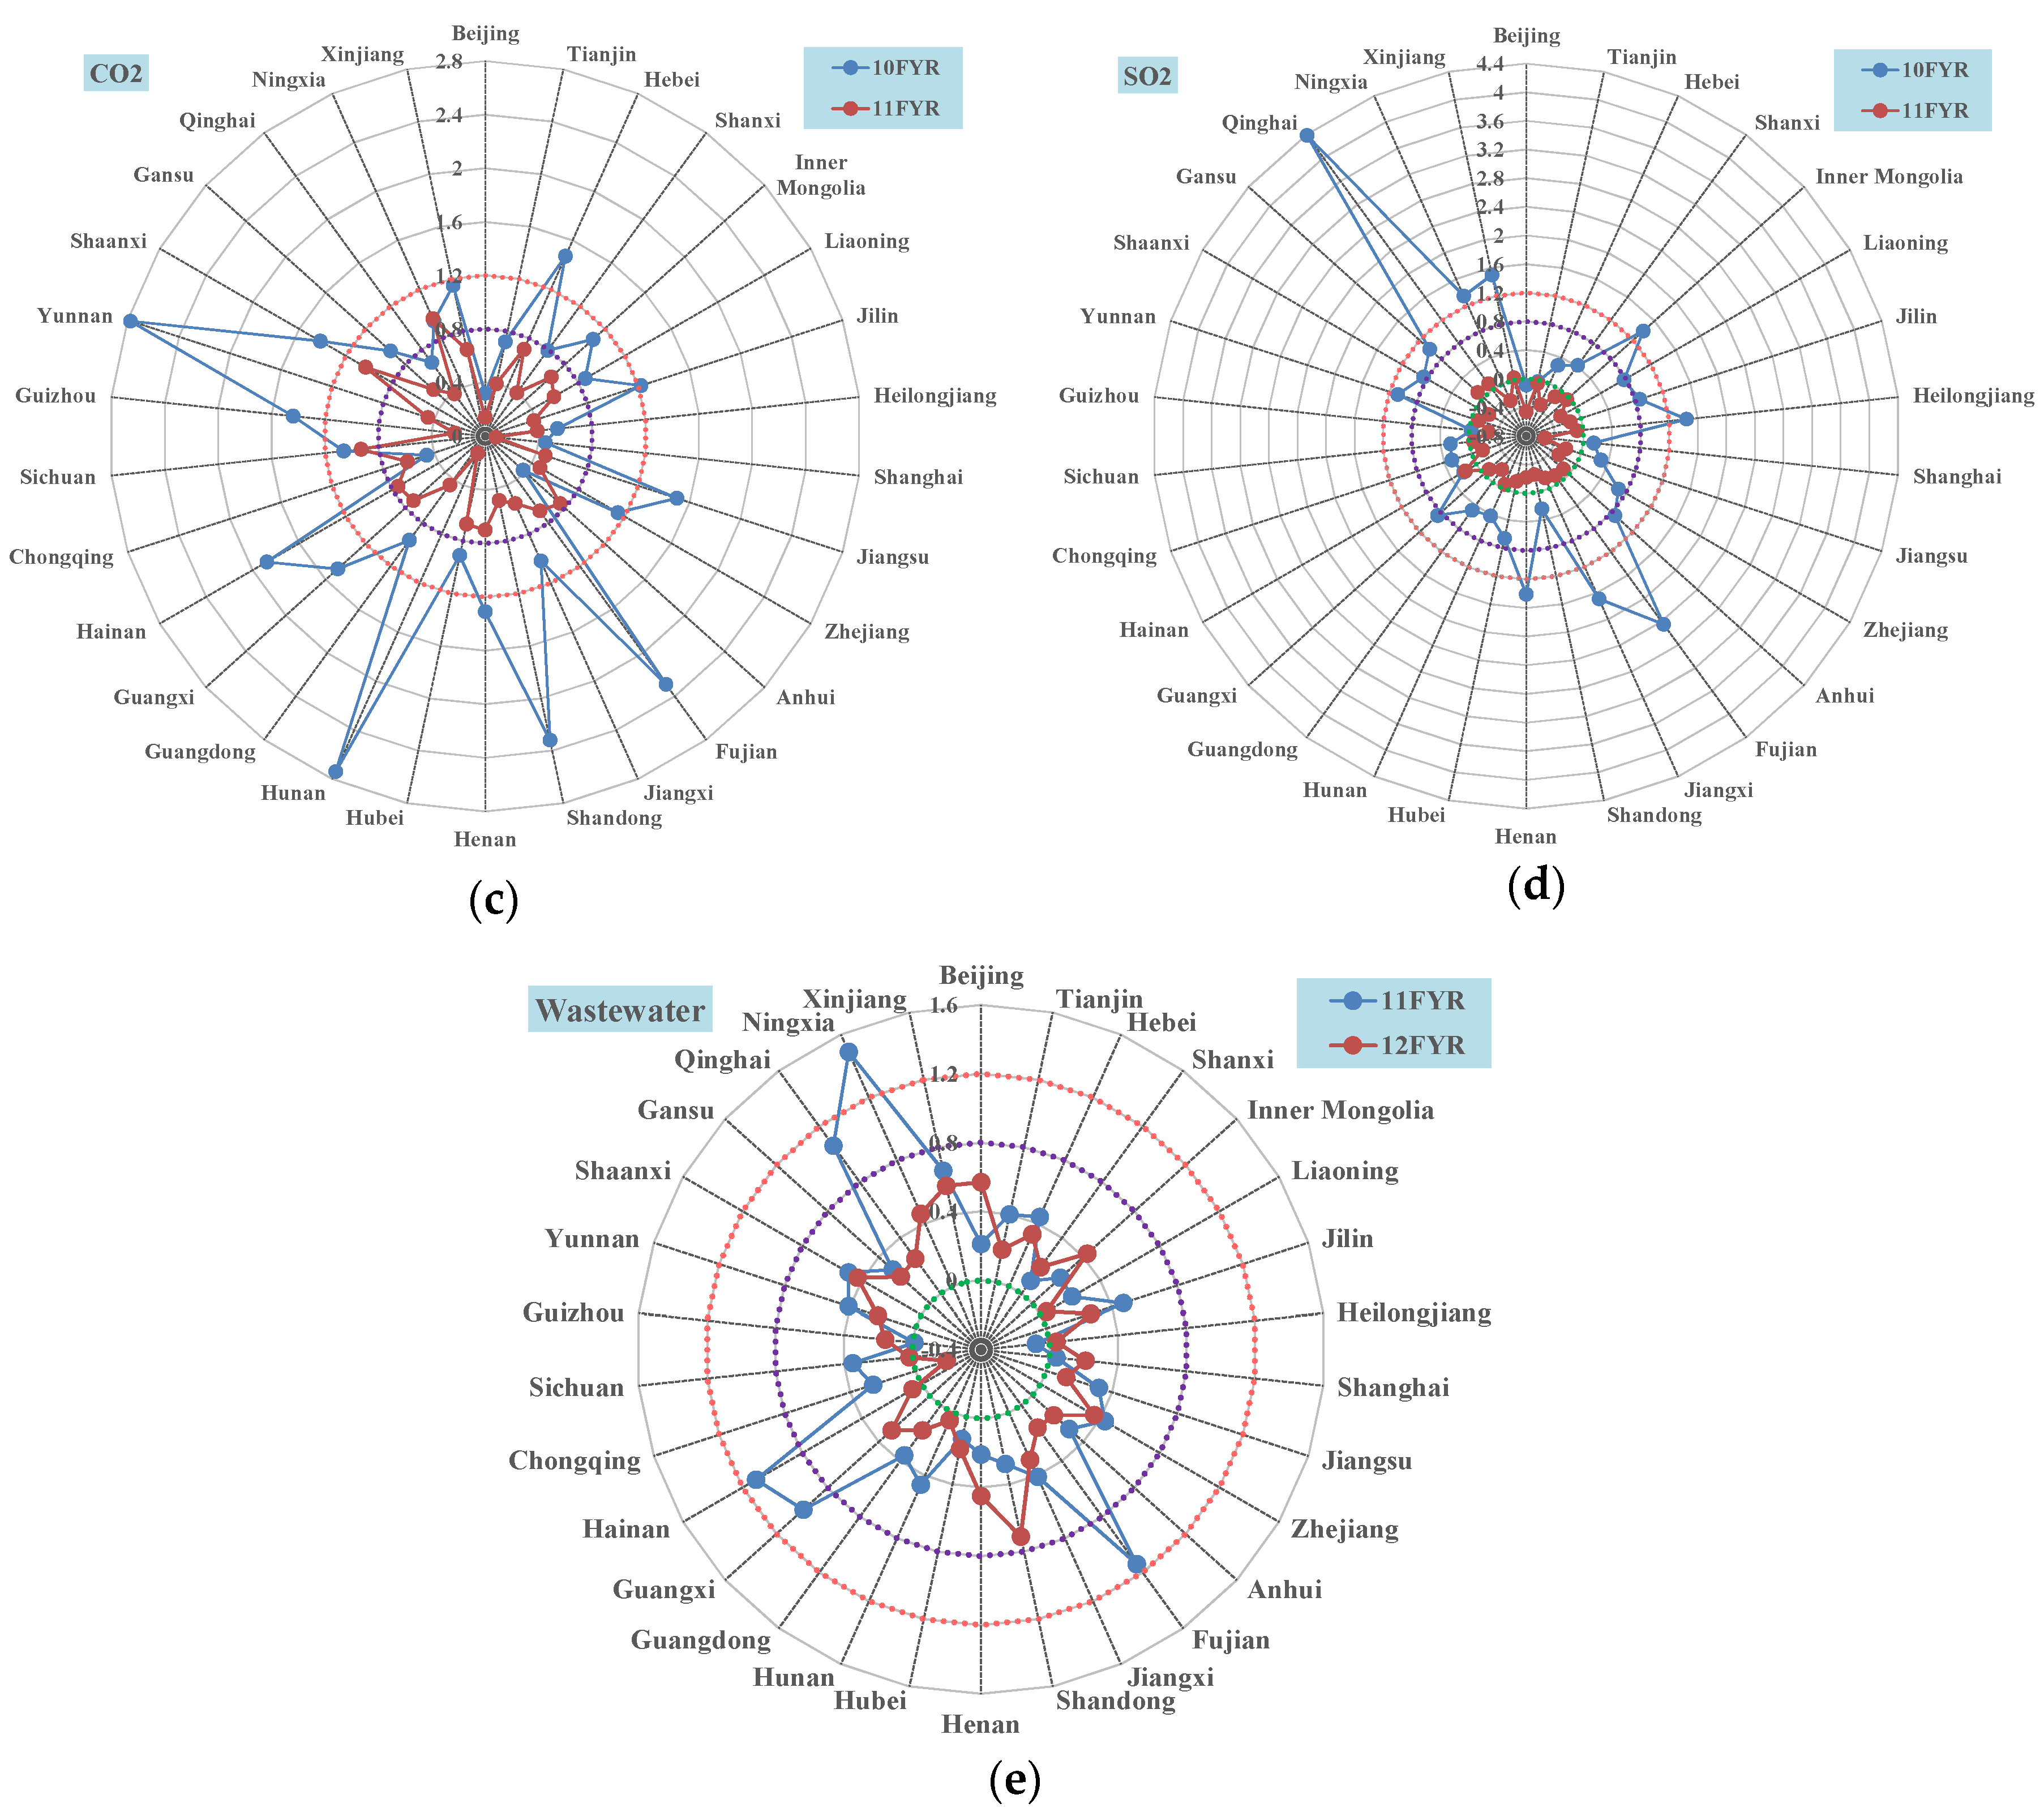
3.2. Trend Analysis of Decoupling Performance

The R/S requires that the time series data should be stationary at first order [53]. For this paper, the ADF unit root tests were conducted for the variables of all 30 provinces with regard to their stationary properties. The detailed results are shown in Supplementary Materials Table S6. The results indicate that the variables of all 30 provinces are static at the first order. Thus, the Hurst exponents of the variables of all 30 provinces can be obtained by conducting R/S (Table 2).
In terms of energy consumption, the GDP elasticity of 11 provinces behaved in a linearly decreasing trend (the coefficient a of regression equation is below zero), which indicates that the decoupling performance of these provinces show an improving trend during 1997–2012. Inversely, the decoupling performance of the other 19 provinces show a decreasing trend in the past 25 years. Will these trends continue in the future? The results of H exponent evaluations will give us the answer. Among the 11 provinces, that the H of Qinghai is less than 0.5 indicates that the GDP elasticity time series of Qinghai shows an anti-persistent behavior (a negative correlation) and the decoupling performance will be worse in the future. The H of Inner Mongolia, Hainan, Chongqing and Gansu is greater than 0.5 but less than 0.75 (close to 0.5), which indicates that GDP elasticity time series in the 4 provinces shows a weak trend-reinforcing behavior (a positive correlation) and that the decoupling performance will improve in the future, but the speed (the value of coefficients are around 0.02) and extent of improvement will be small. The H of Hebei, Shanghai, Zhejiang, Fujian, Henan and Guangdong is greater than 0.5 and close to 1, which indicates that the GDP elasticity time series shows a strong trend-reinforcing behavior and that the decoupling performance will improve in the future at a very low speed. Among the 19 provinces, the H of Liaoning is less than 0.5, which indicates that the decoupling performance will improve in the future (anti-persistent time series); the H of Guizhou, Jiangxi, Tianjin, Jilin, Ningxia is greater than 0.5 but less than 0.75, which indicates that the decoupling performance will show a weak decreasing trend but that the speed is very slow; the H of the other 13 provinces is greater than 0.5 and close to 1, which indicates that the decoupling performance will show a strong decreasing trend but that the speed is very slow. In brief, as for the final energy consumption, the decoupling performance of energy consumption in 63% of the provinces in China show a decreasing trend and 37% of the provinces show an improving trend. The reason for this phenomenon is that China is still in the transforming phase from primary industrialization to modern industrialization; thus, the situation of fast economic growth triggered by vast volume energy consumption still exists at present and will last for years because of the effects of path dependence [36].
For water consumption, in the past 11 years, the decoupling performances of 15 provinces show an improving trend, 14 provinces show a decreasing trend and one province (Ningxia) kept stable. Among the 15 provinces that show an improving trend, the H of Liaoning, Hunan, Chongqing, and Guizhou is greater than 0.5 and close to 1, which indicates that the decoupling performance shows a strong improving trend at a very low speed in the future; the H of the other 11 provinces is greater than but close to 0.5, which indicates that the decoupling performance of these provinces shows a weak improving trend. The GDP elasticity of Ningxia kept a stable status (the coefficient equals zero), and the H value is greater than 0.5, which indicates that the decoupling performance for Ningxia will keep stable in the future. Among the 14 provinces that show a decreasing trend, the H of Jilin, Shanxi and Sichuan is greater than 0.5 and close to 1, which indicates that the decoupling performance will show a strong decreasing trend; the H of Heilongjiang, Henan and Hubei is less than 0.5, which indicates that the decoupling performance will show an improving trend; the H of the other eight provinces is greater than but close to 0.5, which indicates that the decoupling performance for these provinces will show a weak decreasing trend. In a word, the decoupling performances in 11 provinces show a decreasing trend, 18 provinces show an improving trend, and one province keeps stable.
Similar to the above analysis, for the CO2 emission, only three provinces’ (Shanxi, Guangdong and Ningxia) decoupling performance show a strong improving trend but at a very low speed, and six provinces show a weak improving trend. Most of the provinces (21 provinces) show a decreasing trend (the trend of 13 other provinces is strong and that of the other 8 is weak). For the SO2 emission, most provinces’ (80%) decoupling performances show an improving trend in which 13 provinces have strong trend-reinforcing behavior and 11 provinces have weak behavior. The decoupling performance of Liaoning will be stable. However, there are still five provinces (Jilin, Shandong, Hainan, Chongqing and Xinjiang) which show a decreasing trend but at a very low speed. In reference to the wastewater discharge, the decoupling performances in 12 provinces show an improving trend and 14 provinces show a decreasing trend (50%). For Jiangsu (H = 0.5), Xinjiang (H ≈ 0.5), Shanxi (H ≈ 0.5) and Gansu (H ≈ 0.5), the time series of GDP elasticity is completely independent, and we cannot conclude whether the decoupling performance for these four provinces will improve or decrease.

4. Conclusions

During the past few decades, China paid heavy environmental prices and spent an excessive amount of resources, such as heavy air and water pollution, and unsustainable nature resources exposition, to become the world's second-largest economy. The goal of environmental sustainability requires that resource consumption and waste discharge should be decoupled from economic growth. For this paper, the decoupling performances of resource consumption (energy and water resource) and related waste discharge (wastewater, SO2 and CO2) in China were quantified, and the spatial pattern and temporal trend of decoupling performance were illustrated via the R/S method.
In general, the GDP-elasticity-based decoupling performance of energy consumption and water is worse than that of SO2 and wastewater, but better than that of greenhouse gas, and the performances illustrate a strong spatial variation, resulting from various reasons: (1) The waste production could be effectively reduced by end-of-pipe treatment and other recycling means; (2) the government and the public are more inclined toward waste production control mainly due to the direct relation between pollution and human health; and (3) more stringent regulations and standards for emission reduction than those for resource saving in China. The Energy Saving and Emission Reduction (ESER) policy shows great efforts on the decoupling performance of energy consumption and SO2 emission, which has improved substantially; however, a valuable finding is that water usage pattern shows a great extent impact on wastewater discharge; therefore, China needs integrated policy tools to make overall improvements in water resource management.
The disparity of the temporal trend in decoupling performance among 30 regions and five indicators are both distinct. With regard to SO2 and water usage, in most regions, the decoupling performance shows an improving trend; however, the decoupling performance for energy consumption, CO2 emission, and wastewater discharge in major regions suggest a decreasing trend, which may lead to great environmental pressure and thus call for more stringent regulations and specific policies to prevent such a decreasing trend of decoupling performance.
Although overall future reforms were announced by China's new leaders, a radical reform on China’s environmental governance system is strongly suggested. Laws and regulations related to environment need to be revised and strengthened with the clarified terms, an effective environmental protection authority should be created by integrating decentralized powers to allow a holistic approach to environmental issues, a systemic approach should be realized by combining top-down legally based obligatory policies with bottom-up grass-roots-based civil activities as the core approach against pollution; and market-oriented instruments such as eco-compensation should be applied to environmental issues to balance the regional disparity in sustainable economic development. Moreover, full information disclosure to the public along with a reliable, moderate, authoritative and orderly third-party supervision system are essential components to building effective environmental protection.

Supplementary Materials

The following are available online at www.mdpi.com/2071-1050/8/3/222/s1, Table S1: The GDP elasticity of final energy consumption in China during 1997–2012, Table S2: The GDP elasticity of water consumption in China during 2003–2012, Table S3: The GDP elasticity of CO2 emission in China during 1997–2010, Table S4: The GDP elasticity of SO2 emission in China during 1999–2012, Table S5: The GDP elasticity of waste water discharge in China during 1998–2012, Table S6: Results of unit root test for all variables of 30 provinces.

Acknowledgments

The authors would like to thank Zhu Liu for his helpful comments on this paper and acknowledge the financial support from the Natural Science Foundation of China (41301652, 41471116, 41471462, 41561110), the Specialized Research Fund for the Doctoral Program of Higher Education (20120211120026), the Fundamental Research Funds for the Central Universities (lzujbky-2015-147), the Doctoral Scientific Research Foundation of Liaoning Province (PN: 201501037), Sci & Tech Department of Jiangsu Prov. (BR2015013), and the International Exchange Fellowship Program of China Postdoctoral Council (20140050). Special thanks go to the Youth Innovation Promotion Association CAS (Xue Bing).

Author Contributions

Zilong Zhang and Xingpeng Chen conceived and designed the experiments; Jiaxing Pang analyzed the data; Zilong Zhang and Bing Xue wrote the paper.

Conflicts of Interest

The authors declare no conflict of interest.

References

  1. United Nations Environment Programme (UNEP). Decoupling Natural Resource Use and Environmental Impacts from Economic Growth; A Report of the Working Group on Decoupling to the International Resource Panel; Fischer-Kowalski, M., Swilling, M., von Weizsäcker, E.U., Ren, Y., Moriguchi, Y., Crane, W., Krausmann, F., Eisenmenger, N., Giljum, S., Hennicke, P., et al., Eds.; UNEP: Nairobi, Kenya, 2011. [Google Scholar]
  2. Zhang, N.; Lior, N.; Jin, H.G. The energy situation and its sustainable development strategy in China. Energy 2011, 36, 3639–3649. [Google Scholar] [CrossRef]
  3. International Energy Agency (IEA). World Energy Outlook 2009; IEA: Paris, France, 2006. [Google Scholar]
  4. Chen, X.P.; Pang, J.X.; Zhang, Z.L.; Li, H.J. Sustainability assessment of solid waste management in China: A decoupling and decomposition analysis. Sustainability 2014, 6, 9268–9281. [Google Scholar] [CrossRef]
  5. Li, D.H.W.; Yang, L.; Lam, J.C. Zero energy buildings and sustainable development implications—A review. Energy 2013, 54, 1–10. [Google Scholar] [CrossRef]
  6. Liang, S.; Liu, Z.; Crawford-Brown, D.; Wang, Y.; Xu, M. Decoupling Analysis and Socioeconomic Drivers of Environmental Pressure in China. Environ. Sci. Technol. 2013, 48, 1103–1113. [Google Scholar] [CrossRef] [PubMed]
  7. Liu, J.; Diamond, J. Science and government—Revolutionizing China’s environmental protection. Science 2008, 319, 37–38. [Google Scholar] [CrossRef] [PubMed]
  8. Liu, J.G.; Diamond, J. China’s environment in a globalizing world. Nature 2005, 435, 1179–1186. [Google Scholar] [CrossRef] [PubMed]
  9. Organisation for Economic Co-operation and Development (OECD). Indicators to Measure Decoupling of Environmental Pressure from Economic Growth; OECD: Pairs, France, 2002. [Google Scholar]
  10. Wang, H.M.; Hashimoto, S.; Yue, Q.; Moriguchi, Y.; Lu, Z.W. Decoupling Analysis of Four Selected Countries: China, Russia, Japan, and the United States during 2000–2007. J. Ind. Ecol. 2013, 17, 618–629. [Google Scholar] [CrossRef]
  11. Zhang, Z.; Chen, X.; Heck, P.; Xue, B.; Liu, Y. Empirical study on the environmental pressure versus economic growth in China during 1991–2012. Resour. Conserv. Recycl. 2015, 101, 182–193. [Google Scholar] [CrossRef]
  12. Grossman, G.M.; Krueger, A.B. Economic-growth and the environment quarterly. J. Econ. 1995, 110, 353–377. [Google Scholar]
  13. Marin, G.; Mazzanti, M. The evolution of environmental and labor productivity dynamics. J. Evol. Econ. 2013, 23, 357–399. [Google Scholar] [CrossRef]
  14. Aoki-Suzuki, C. Exploring potential policy motivation and approaches to improve resource efficiency in emerging Asia. J. Mater. Cycles Waste Manag. 2016, 18, 57–71. [Google Scholar] [CrossRef]
  15. Recalde, M.Y.; Guzowski, C.; Zilio, M.I. Are modern economies following a sustainable energy consumption path? Energy Sustain. Dev. 2014, 19, 151–161. [Google Scholar] [CrossRef]
  16. Bithas, K.; Kalimeris, P. Re-estimating the decoupling effect: Is there an actual transition towards a less energy-intensive economy? Energy 2013, 51, 78–84. [Google Scholar] [CrossRef]
  17. Zhang, Y.; Yang, Q.S. Decoupling agricultural water consumption and environmental impact from crop production based on the water footprint method: A case study for the Heilongjiang land reclamation area, China. Ecol. Indic. 2014, 43, 29–35. [Google Scholar]
  18. Gilmont, M. Decoupling dependence on natural water: Reflexivity in the regulation and allocation of water in Israel. Water Policy 2014, 16, 79–101. [Google Scholar] [CrossRef]
  19. Zhang, M.; Wang, W.W. Decouple indicators on the CO2 emission-economic growth linkage: The Jiangsu Province case. Ecol. Indic. 2013, 32, 239–244. [Google Scholar] [CrossRef]
  20. Wang, W.W.; Liu, R.; Zhang, M.; Li, H.A. Decomposing the decoupling of energy-related CO2 emissions and economic growth in Jiangsu Province. Energy Sustain. Dev. 2013, 17, 62–71. [Google Scholar] [CrossRef]
  21. Lenzen, M.; Schaeffer, R.; Karstensen, J.; Peters, G.P. Drivers of change in Brazil’s carbon dioxide emissions. Clim. Chang. 2013, 121, 815–824. [Google Scholar] [CrossRef]
  22. Andreoni, V.; Galmarini, S. Decoupling economic growth from carbon dioxide emissions: A decomposition analysis of Italian energy consumption. Energy 2012, 44, 682–691. [Google Scholar] [CrossRef]
  23. De Freitas, L.C.; Kaneko, S. Decomposing the decoupling of CO2 emissions and economic growth in Brazil. Ecol. Econ. 2011, 70, 1459–1469. [Google Scholar] [CrossRef]
  24. Zhang, Z.X. Decoupling China’s carbon emissions increase from economic growth: An economic analysis and policy implications. World Dev. 2000, 28, 739–752. [Google Scholar] [CrossRef]
  25. Ichinose, D.; Yamamoto, M.; Yoshida, Y. The decoupling of affluence and waste discharge under spatial correlation: Do richer communities discharge more waste? Environ. Dev. Econ. 2015, 20, 161–184. [Google Scholar] [CrossRef]
  26. Amann, M.; Klimont, Z.; Wagner, F. Regional and global emissions of air pollutants: Recent trends and future scenarios. Ann. Rev. Environ. Resour. 2013, 38, 31–55. [Google Scholar] [CrossRef]
  27. Jorgenson, A.K.; Clark, B. Are the Economy and the Environment Decoupling? A Comparative International Study, 1960–2005. Am. J. Sociol. 2012, 118, 1–44. [Google Scholar] [CrossRef]
  28. Tapio, P. Towards a theory of decoupling: Degrees of decoupling in the EU and the case of road traffic in Finland between 1970 and 2001. Transp. Policy 2005, 12, 137–151. [Google Scholar] [CrossRef]
  29. Van Caneghem, J.; Block, C.; van Hooste, H.; Vandecasteele, C. Eco-efficiency trends of the Flemish industry: Decoupling of environmental impact from economic growth. J. Clean. Prod. 2010, 18, 1349–1357. [Google Scholar] [CrossRef]
  30. Yu, Y.D.; Chen, D.J.; Zhu, B.; Hu, S.Y. Eco-efficiency trends in China, 1978–2010: Decoupling environmental pressure from economic growth. Ecol. Indic. 2013, 24, 177–184. [Google Scholar] [CrossRef]
  31. Diakoulaki, D.; Mandaraka, M. Decomposition analysis for assessing the progress in decoupling industrial growth from CO2 emissions in the EU manufacturing sector. Energy Econ. 2007, 29, 636–664. [Google Scholar] [CrossRef]
  32. Brizga, J.; Feng, K.S.; Hubacek, K. Drivers of CO2 emissions in the former Soviet Union: A country level IPAT analysis from 1990 to 2010. Energy 2013, 59, 743–753. [Google Scholar] [CrossRef]
  33. Wang, K.M. The relationship between carbon dioxide emissions and economic growth: Quantile panel-type analysis. Qual. Quant. 2013, 47, 1337–1366. [Google Scholar] [CrossRef]
  34. Steinberger, J.K.; Krausmann, F.; Getzner, M.; Schandl, H.; West, J. Development and dematerialization: An international study. PLoS ONE 2013, 8, 11. [Google Scholar] [CrossRef] [PubMed]
  35. Andersson, F.N.G.; Karpestam, P. CO2 emissions and economic activity: Short- and long-run economic determinants of scale, energy intensity and carbon intensity. Energy Policy 2013, 61, 1285–1294. [Google Scholar] [CrossRef]
  36. Zhang, L.M.; Xue, B.; Geng, Y.; Ren, W.X.; Lu, C.P. Emergy-based city’s sustainability and decoupling assessment: Indicators, features and findings. Sustainability 2014, 6, 952–966. [Google Scholar] [CrossRef]
  37. Peng, J.; Liu, Z.H.; Liu, Y.H.; Wu, J.S.; Han, Y.A. Trend analysis of vegetation dynamics in Qinghai-Tibet Plateau using Hurst Exponent. Ecol. Indic. 2012, 14, 28–39. [Google Scholar] [CrossRef]
  38. Katsev, S.; L’Heureux, I. Are Hurst exponents estimated from short or irregular time series meaningful? Comput. Geosci. 2003, 29, 1085–1089. [Google Scholar] [CrossRef]
  39. Deng, W.B.; Li, W.; Cai, X.; Wang, Q.P.A. Self-similarity and network perspective of the Chinese fund market. Phys. A 2011, 390, 3826–3834. [Google Scholar] [CrossRef]
  40. Mishra, A.K.; Ozger, M.; Singh, V.P. An entropy-based investigation into the variability of precipitation. J. Hydrol. 2009, 370, 139–154. [Google Scholar] [CrossRef]
  41. Li, Q.H.; Chen, Y.N.; Shen, Y.J.; Li, X.G.; Xu, J.H. Spatial and temporal trends of climate change in Xinjiang, China. J. Geogr. Sci. 2011, 21, 1007–1018. [Google Scholar] [CrossRef]
  42. Granero, M.A.S.; Segovia, J.E.T.; Perez, J.G. Some comments on Hurst exponent and the long memory processes on capital markets. Phys. A 2008, 387, 5543–5551. [Google Scholar] [CrossRef]
  43. Xu, J.H.; Lu, Y.; Su, F.L.; Al, N.S. R/S and wavelet analysis on evolutionary process of regional economic disparity in china during past 50 years. Chin. Geogr. Sci. 2004, 14, 193–201. [Google Scholar] [CrossRef]
  44. Sakalauskienė, G. The Hurst phenomenon in hydrology. Environ. Res. Eng. Manag. 2003, 3, 16–20. [Google Scholar]
  45. Wang, Y.Z.; Li, B.; Wang, R.Q.; Su, J.; Rong, X.X. Application of the Hurst exponent in ecology. Comput. Math. Appl. 2011, 61, 2129–2131. [Google Scholar] [CrossRef]
  46. Parmar, K.S.; Bhardwaj, R. Water quality index and fractal dimension analysis of water parameters. Int. J. Environ. Sci. Technol. 2013, 10, 151–164. [Google Scholar] [CrossRef]
  47. Zhang, Z.; Liu, Z.; Chen, X.; Lu, C.; Xue, B. The evolutionary trend of CO2 emissions and its spatial differentiation in China: Based on R/S Method. Econ. Geogr. 2013, 33, 20–25. (In Chinese) [Google Scholar]
  48. Weng, Y.C.; Chang, N.B.; Lee, T.Y. Nonlinear time series analysis of ground-level ozone dynamics in Southern Taiwan. J. Environ. Manag. 2008, 87, 405–414. [Google Scholar] [CrossRef] [PubMed]
  49. Guan, D.B.; Liu, Z.; Geng, Y.; Lindner, S.; Hubacek, K. The gigatonne gap in China’s carbon dioxide inventories. Nat. Clim. Chang. 2012, 2, 672–675. [Google Scholar] [CrossRef]
  50. Gu, A.; Teng, F.; Wang, Y. China energy-water nexus: Assessing the water-saving synergy effects of energy-saving policies during the eleventh Five-year Plan. Energy Convers. Manag. 2014, 85, 630–637. [Google Scholar] [CrossRef]
  51. Geng, Y.; Wang, M.; Sarkis, J.; Xue, B.; Zhang, L.; Fujita, Y.; Yu, X.; Ren, W.; Zhang, L.; Dong, H. Spatial-temporal patterns and driving factors for industrial wastewater emission in China. J. Clean. Prod. 2014, 76, 116–124. [Google Scholar] [CrossRef]
  52. Wang, Z.W. China’s wastewater treatment goals. Science 2012, 338, 604. [Google Scholar] [CrossRef] [PubMed]
  53. Couillard, M.; Davison, M. A comment on measuring the Hurst exponent of financial time series. Phys. A 2005, 348, 404–418. [Google Scholar] [CrossRef]
Figure 1. The GDP elasticity of final energy consumption (1997–2012), water consumption (2002–2012), CO2 emission (1997–2010), SO2 emission (1999–2012) and waste water discharge (1999–2012). (a) final energy consumption, water consumption and CO2 emission, (b) SO2 emission and wastewater discharge.
Sustainability 08 00222 g001
Figure 2. The decoupling performance of all 30 provinces in the 11th and 12th FYP periods. (a) final energy consumption; (b): water consumption; (c): CO2 emission; (d): SO2 emission; (e): wastewater discharge.
Sustainability 08 00222 g002aSustainability 08 00222 g002b
Table 1. Standard deviation of descriptive parameters of decoupling for China.
RegionsEnergyWaterCO2SO2Wastewater
11FYR12FYR11FYR12FYR11FYR12FYR11FYR12FYR11FYR12FYR
Standard deviation0.5640.1370.1820.1130.6500.2340.8920.1530.3700.191
Table 2. Hurst exponent of time series of GDP elasticity of environmental pressures in China.
RegionsEnergyWaterCO2SO2Wastewater
aHaHaHaHaH
Beijing0.0020.8030.0090.603−0.0290.512−0.0580.6400.0070.582
Tianjin0.0280.691−0.0350.6910.0050.480−0.0690.506−0.0130.558
Hebei−0.0140.7970.0230.5290.0280.780−0.0150.6900.0320.608
Shanxi0.0080.7990.0740.752−0.0110.765−0.0220.7400.0700.504
Inner Mongolia−0.0210.6370.0170.5800.0350.646−0.0870.6950.0480.662
Liaoning0.0220.432−0.0290.7610.0770.5470.0000.6180.0510.608
Jilin0.0570.7250.1020.9400.1070.6980.0190.6240.0340.422
Heilongjiang0.0620.8850.0290.4750.0850.841−0.0520.8600.0810.830
Shanghai−0.0180.775−0.0940.636−0.0540.598−0.2340.812−0.0010.622
Jiangsu0.0190.871−0.0300.6000.0500.782−0.1090.728−0.0500.500
Zhejiang−0.0270.804−0.0220.5750.0160.847−0.0750.970−0.0450.590
Anhui0.0190.9130.0020.6040.0310.578−0.0420.9310.0630.556
Fujian−0.0200.826−0.0140.569−0.0330.703−0.1670.837−0.1310.605
Jiangxi0.0120.716−0.0100.5430.0410.879−0.1260.8160.0380.599
Shandong0.0030.8400.0540.5710.0030.9510.0170.6370.0490.787
Henan−0.0250.7660.0660.4240.0510.811−0.1090.9020.0260.879
Hubei0.0340.8270.0140.3950.0740.782−0.0530.8660.0280.674
Hunan0.0330.908−0.0250.8470.1230.815−0.0770.8000.0200.734
Guangdong−0.0110.941−0.0310.714−0.0070.804−0.2250.8610.0010.473
Guangxi0.0310.881−0.0010.7420.0640.800−0.2870.549−0.0970.764
Hainan−0.0060.740−0.0150.321−0.2600.5020.0870.583−0.0450.754
Chongqing−0.0250.721−0.0740.9000.0040.8290.0150.866−0.0020.607
Sichuan0.0300.7660.0340.7850.1230.727−0.2440.620−0.1330.594
Guizhou0.0060.547−0.0670.758−0.0400.687−0.0080.8900.1390.753
Yunnan0.0320.9480.0150.5510.0940.558−0.0370.5100.1360.571
Shaanxi0.0420.8510.0110.6130.1200.831−0.0370.8030.0310.769
Gansu−0.0040.749−0.0050.5150.0620.612−0.1070.7300.0920.501
Qinghai−0.0290.448−0.1180.564−0.0210.459−0.1660.904−0.0330.759
Ningxia0.0980.5410.0000.589−0.0870.855−0.0150.731−0.1990.607
Xinjiang0.0370.8460.0220.6820.0900.8370.0640.5750.0190.504
Notes: a is the estimated coefficient of linear regression equation of time-series data of GDP elasticity; H is the Hurst exponent.

