
Foodsheds and City Region Food Systems in Two West African Cities

 ,
, 
Abstract
:1. Introduction
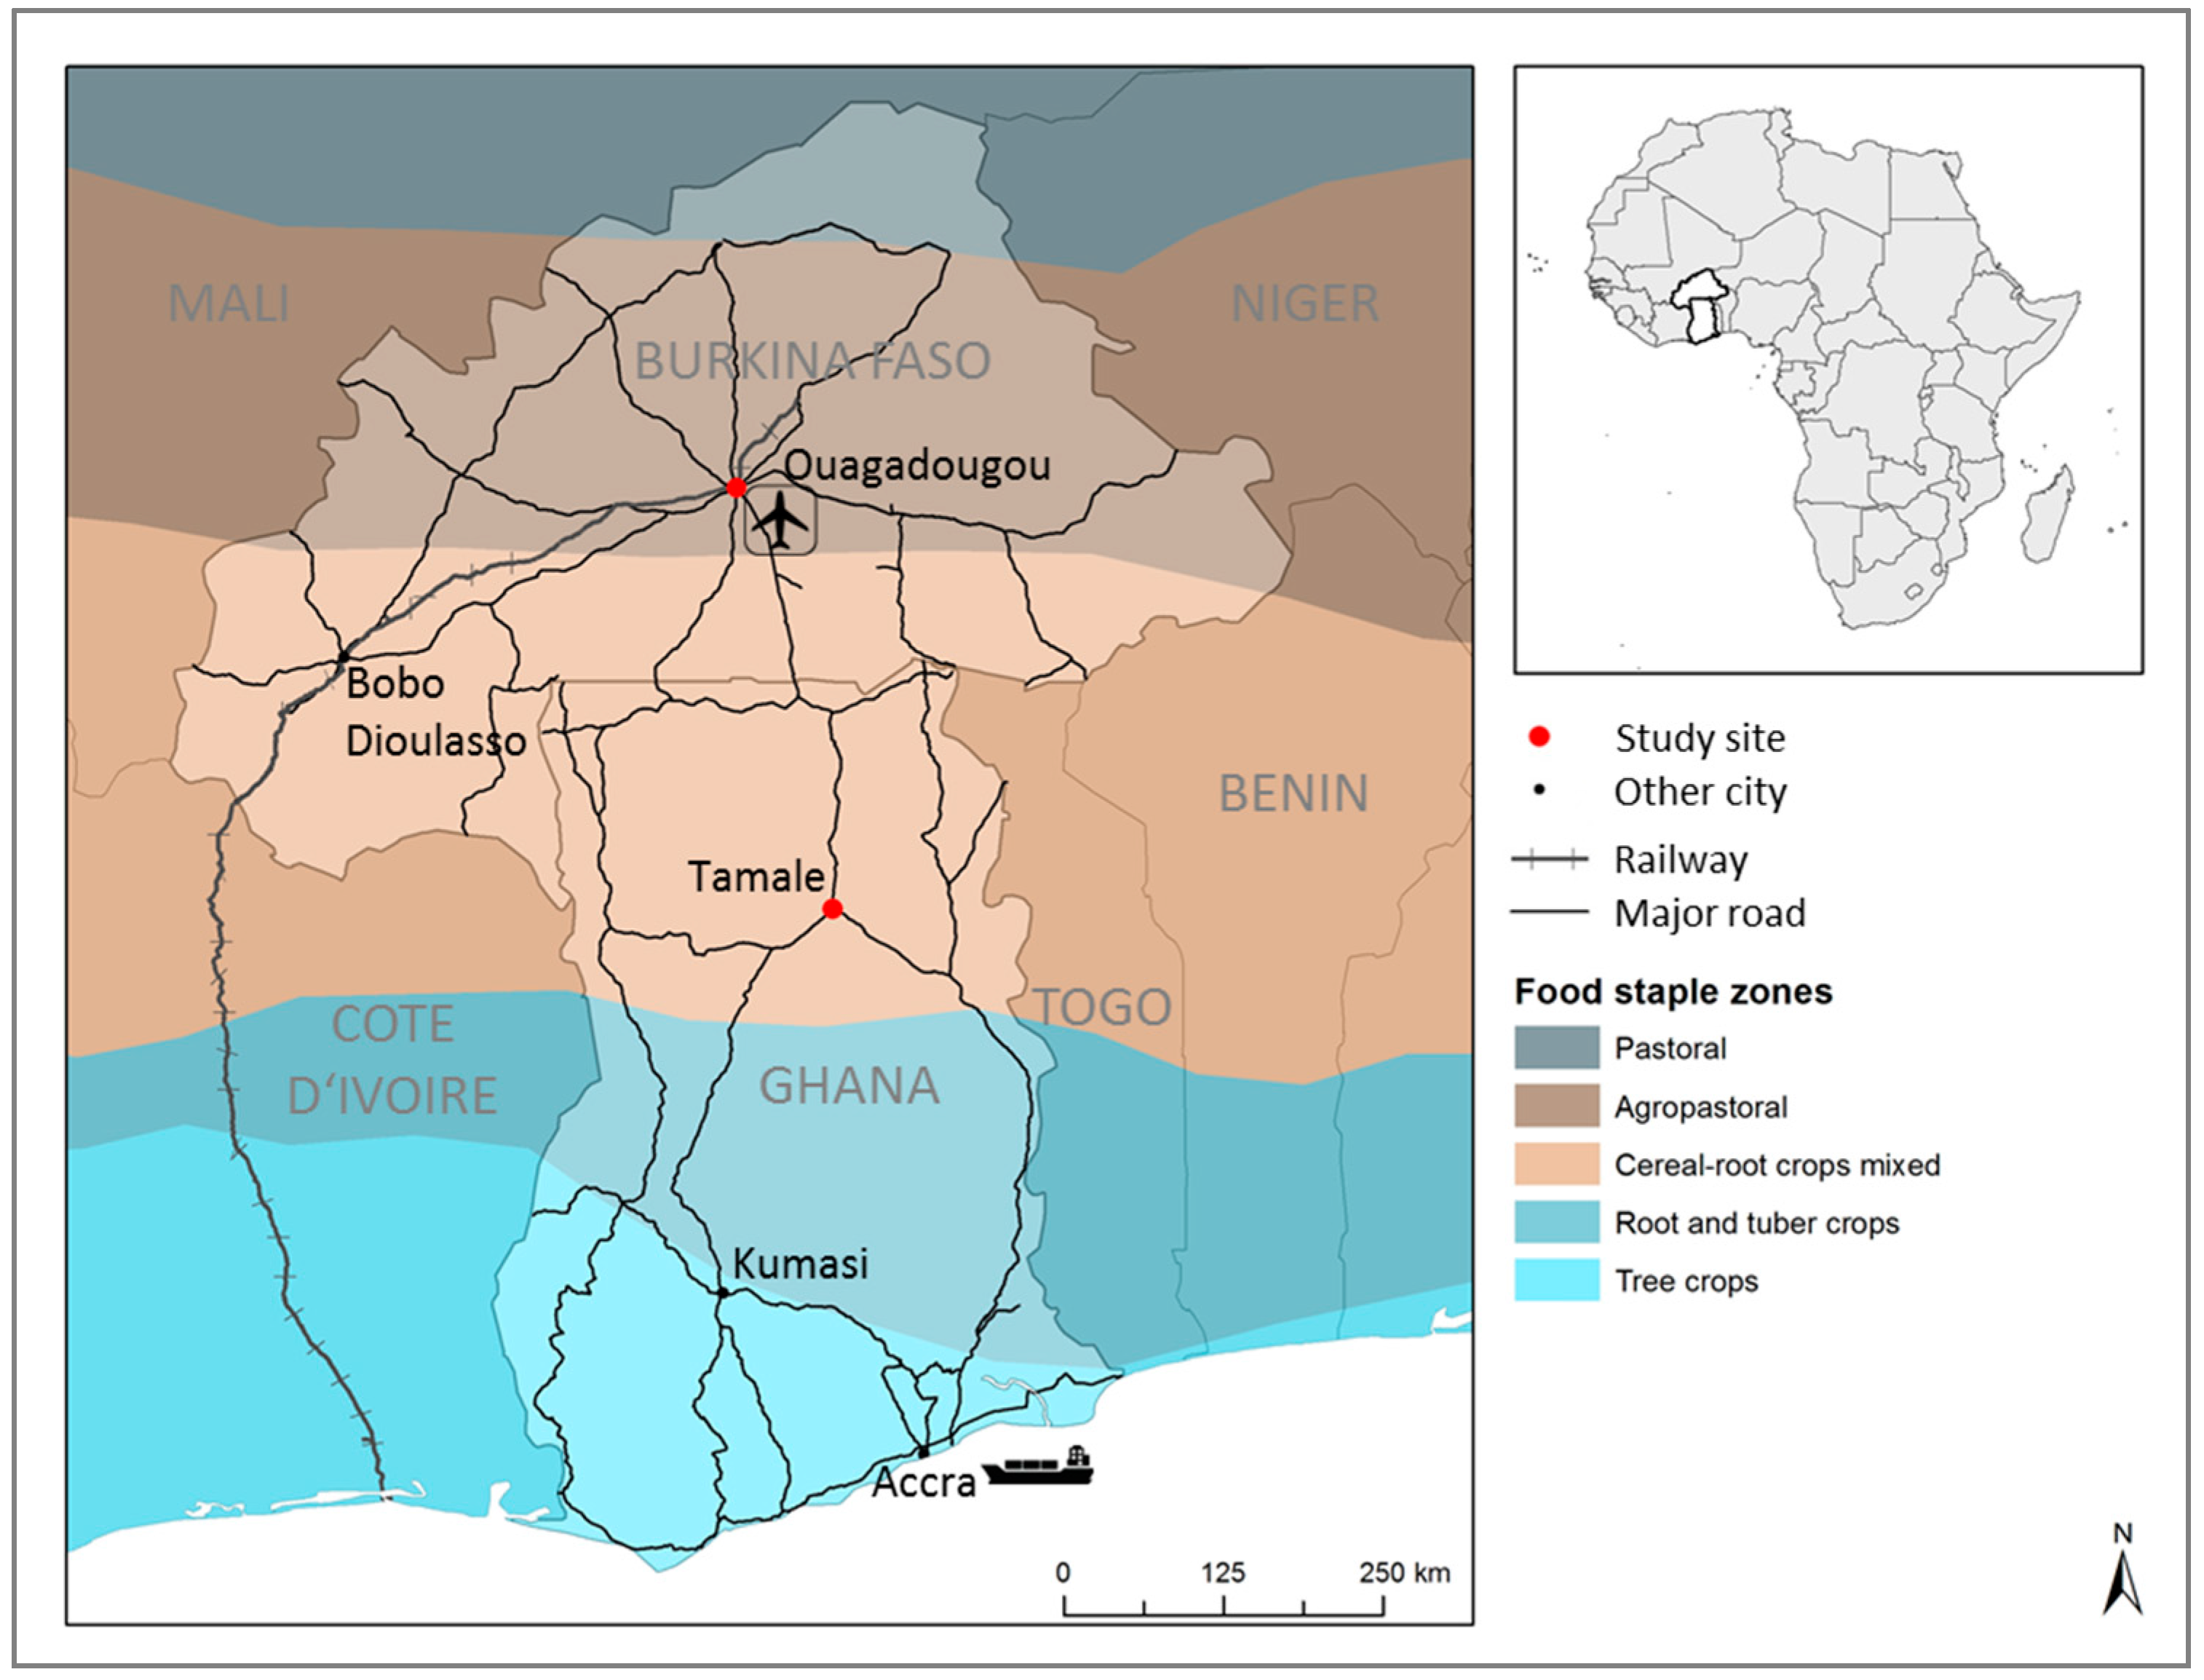
2. Description of the Study Sites
3. Materials and Methods
4. Data Collection
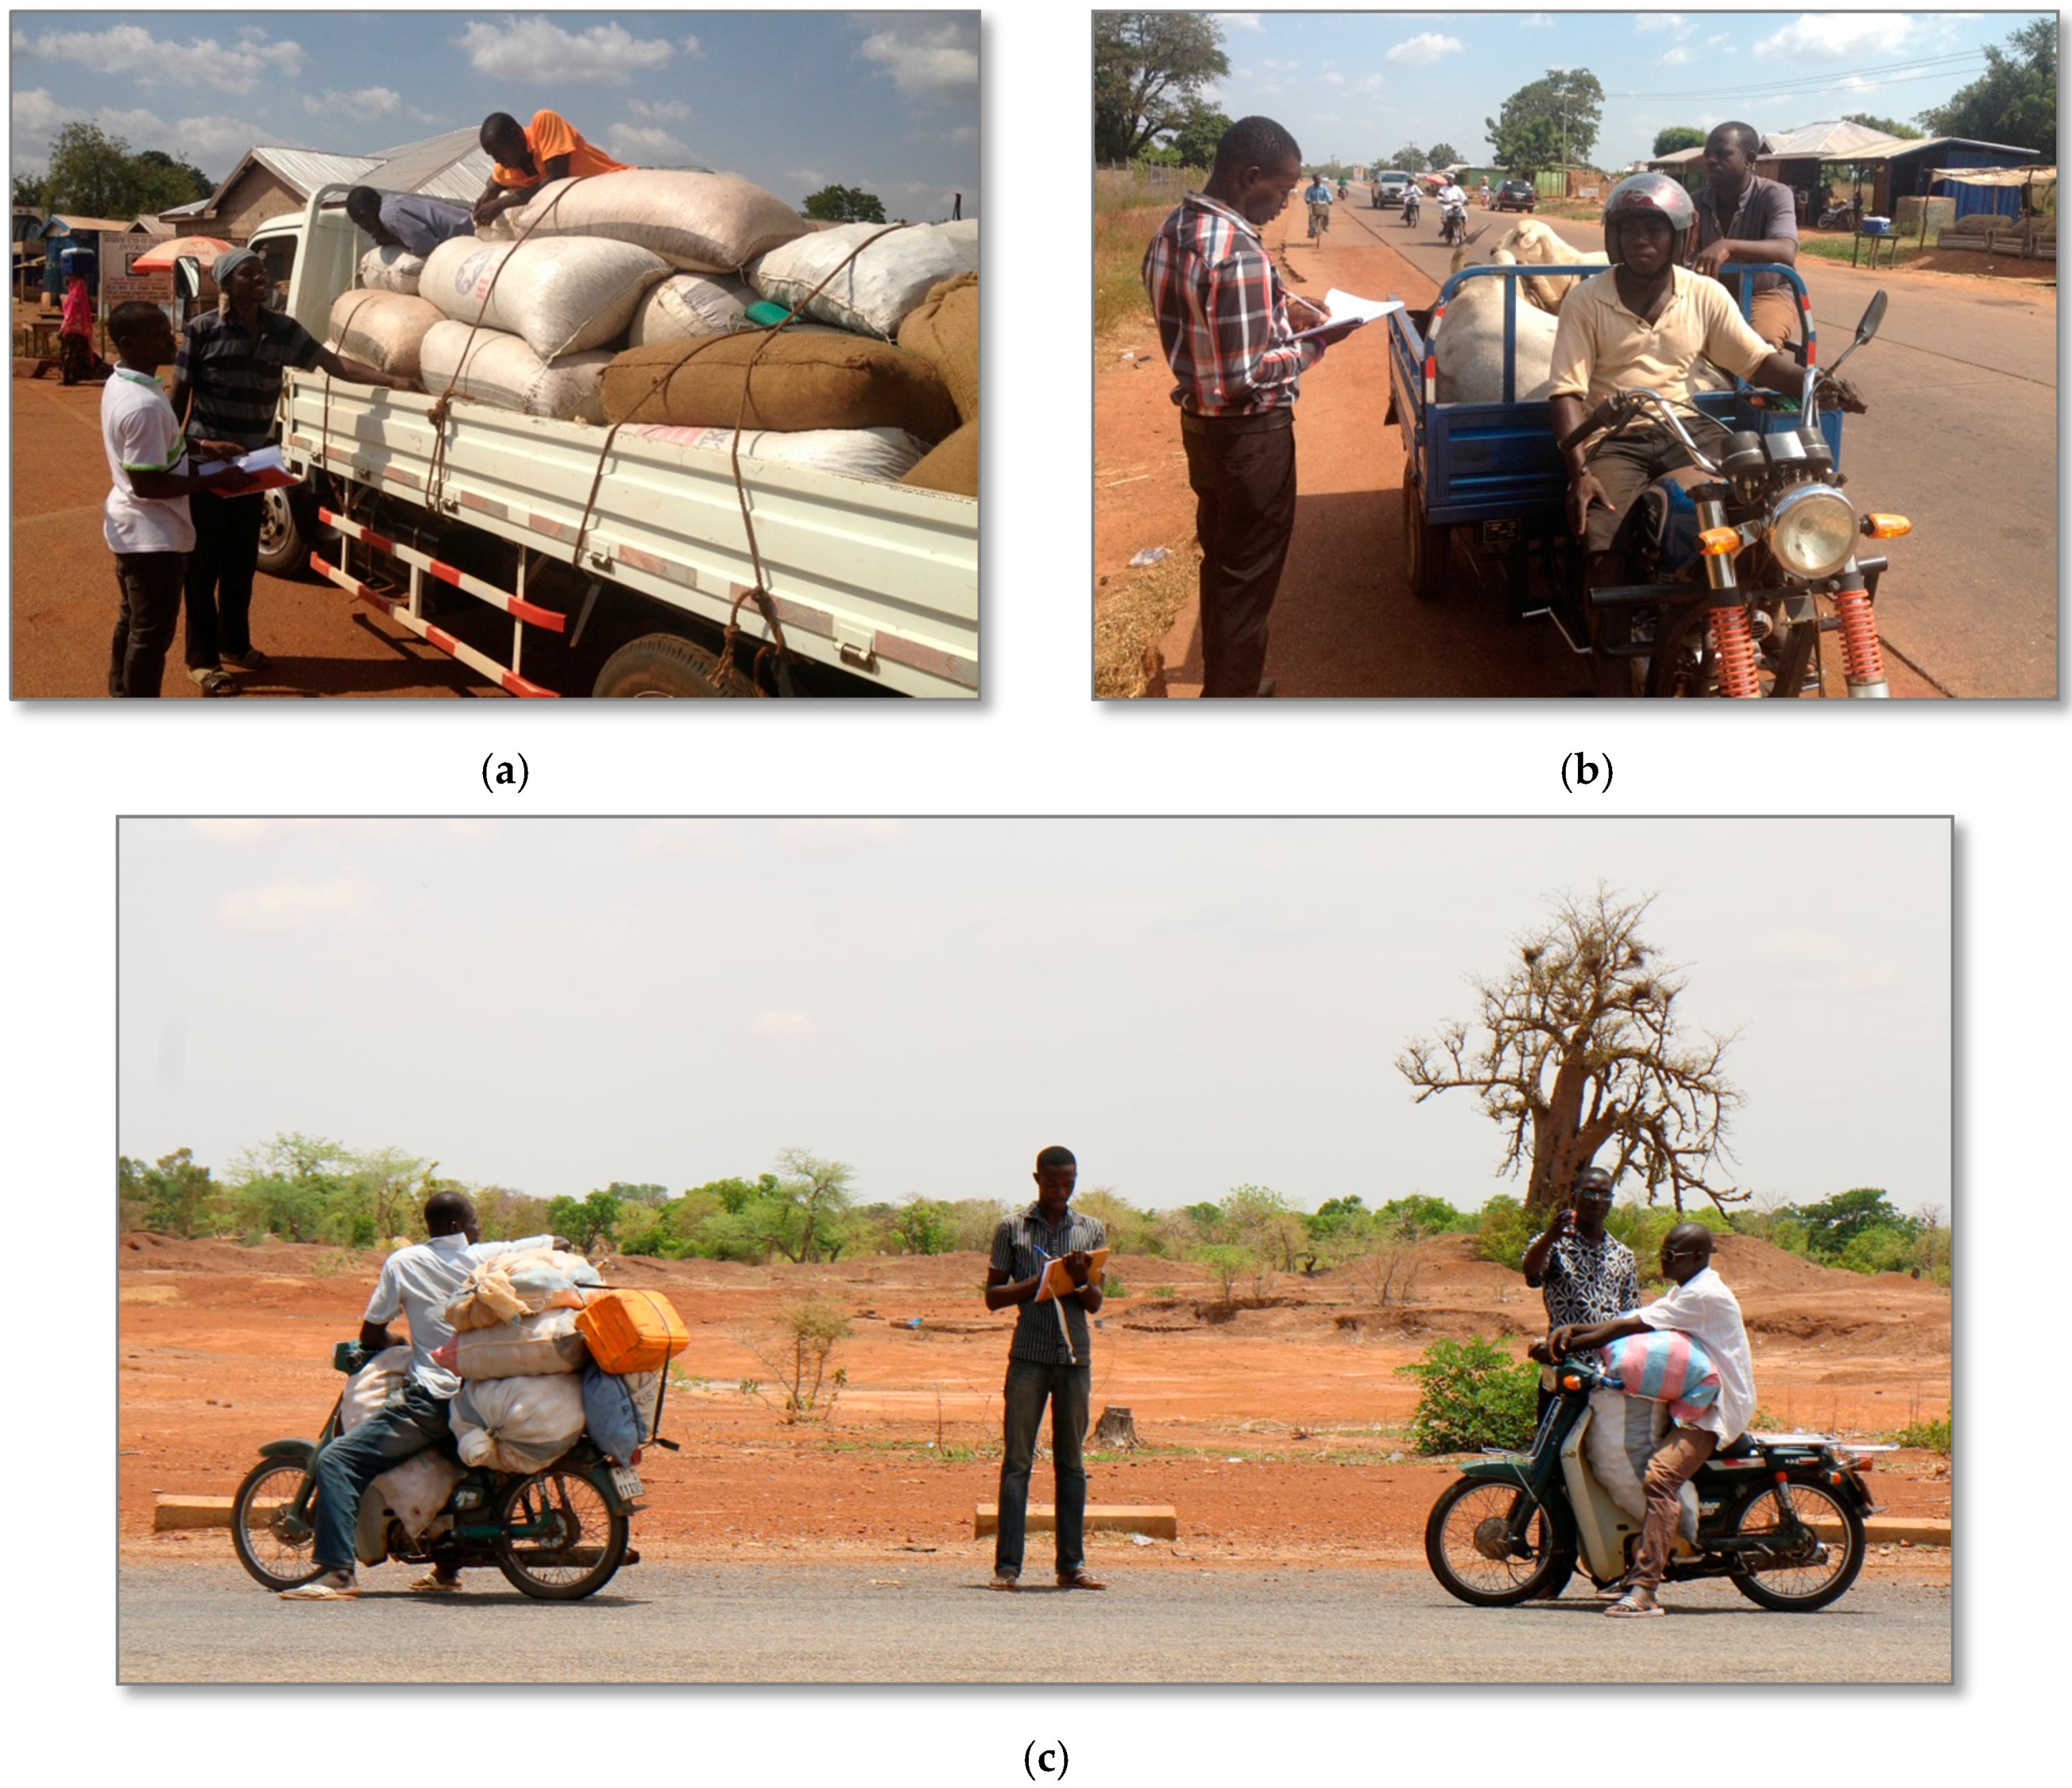
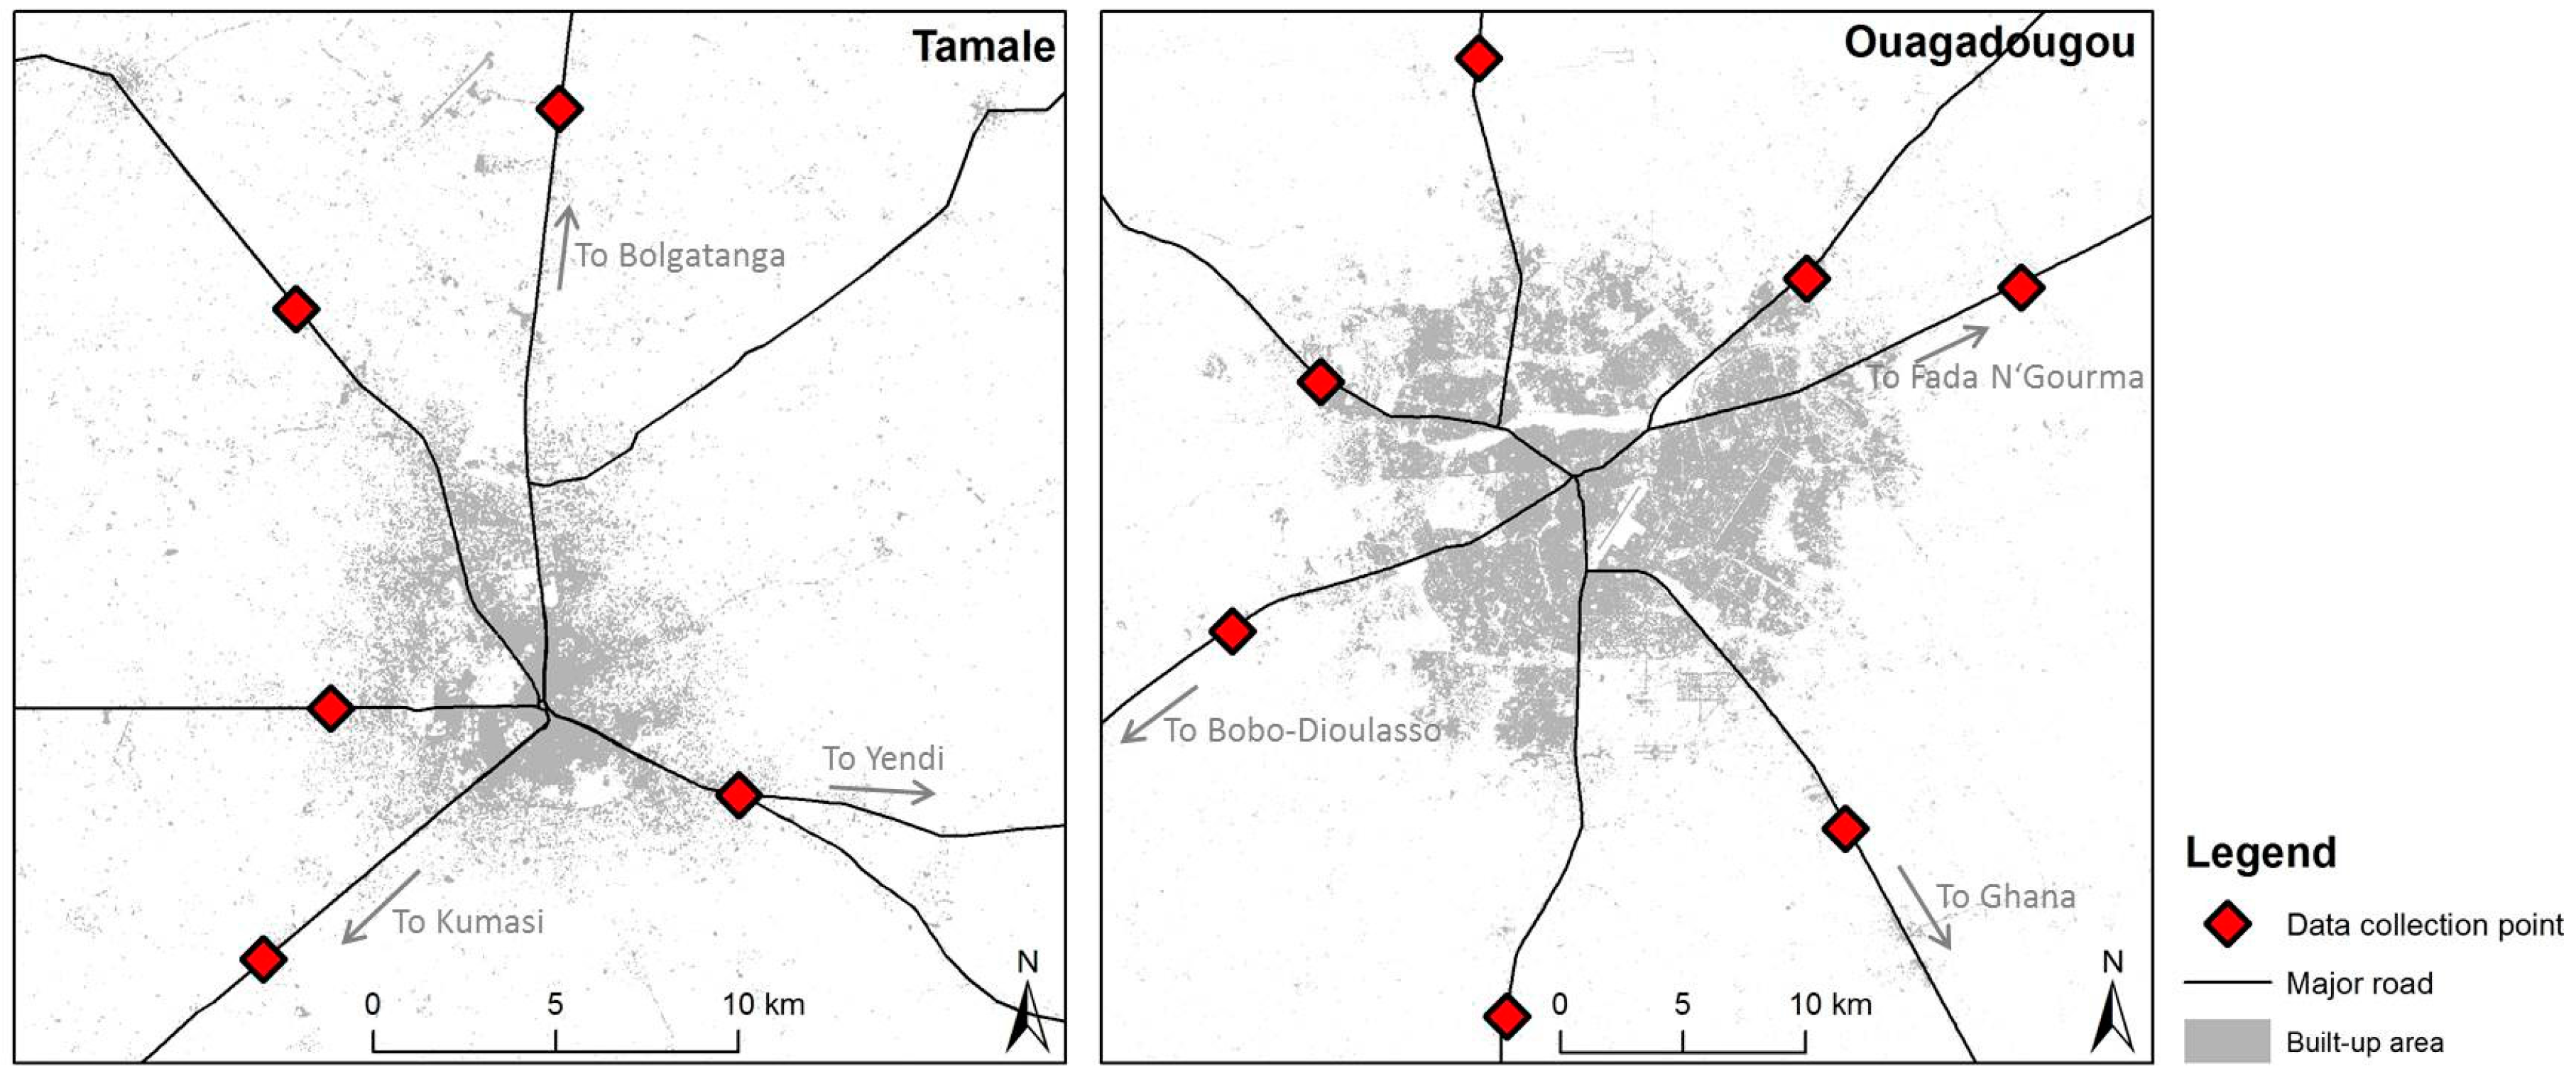
4.1. Road Transport
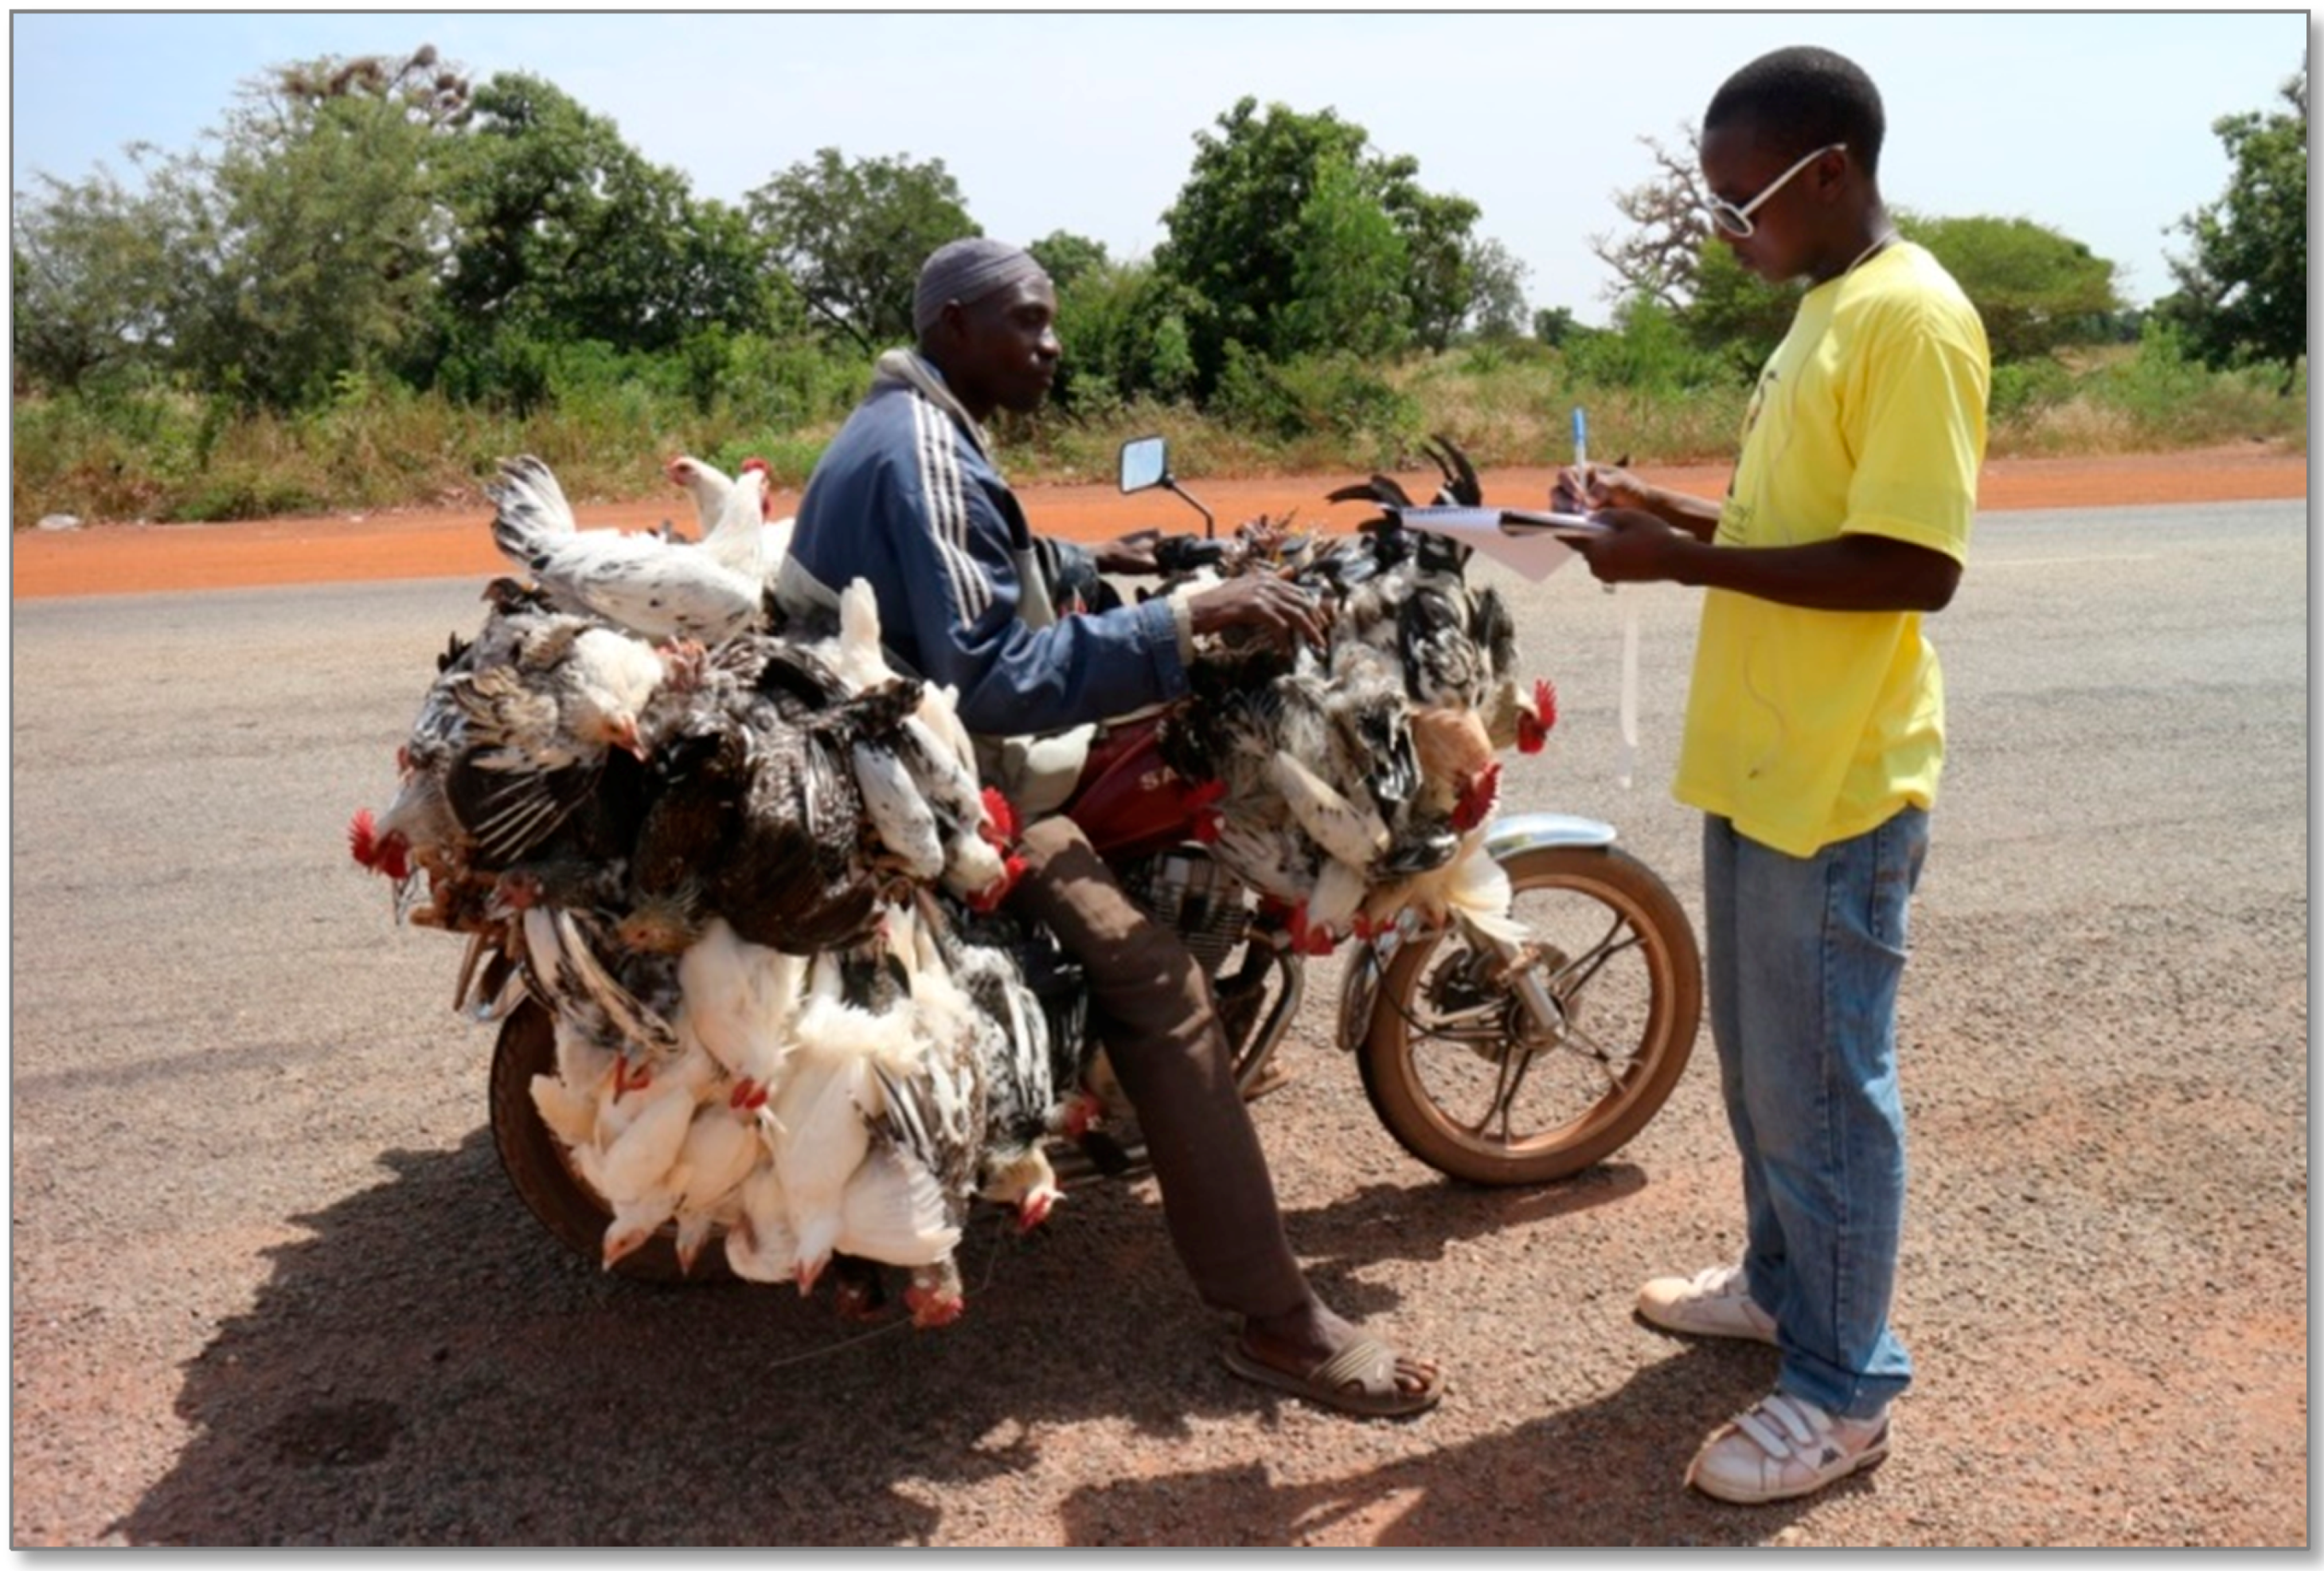
4.2. Market Survey in Tamale
4.3. Secondary Import and Export Data
5. Data Processing
6. Data Analysis
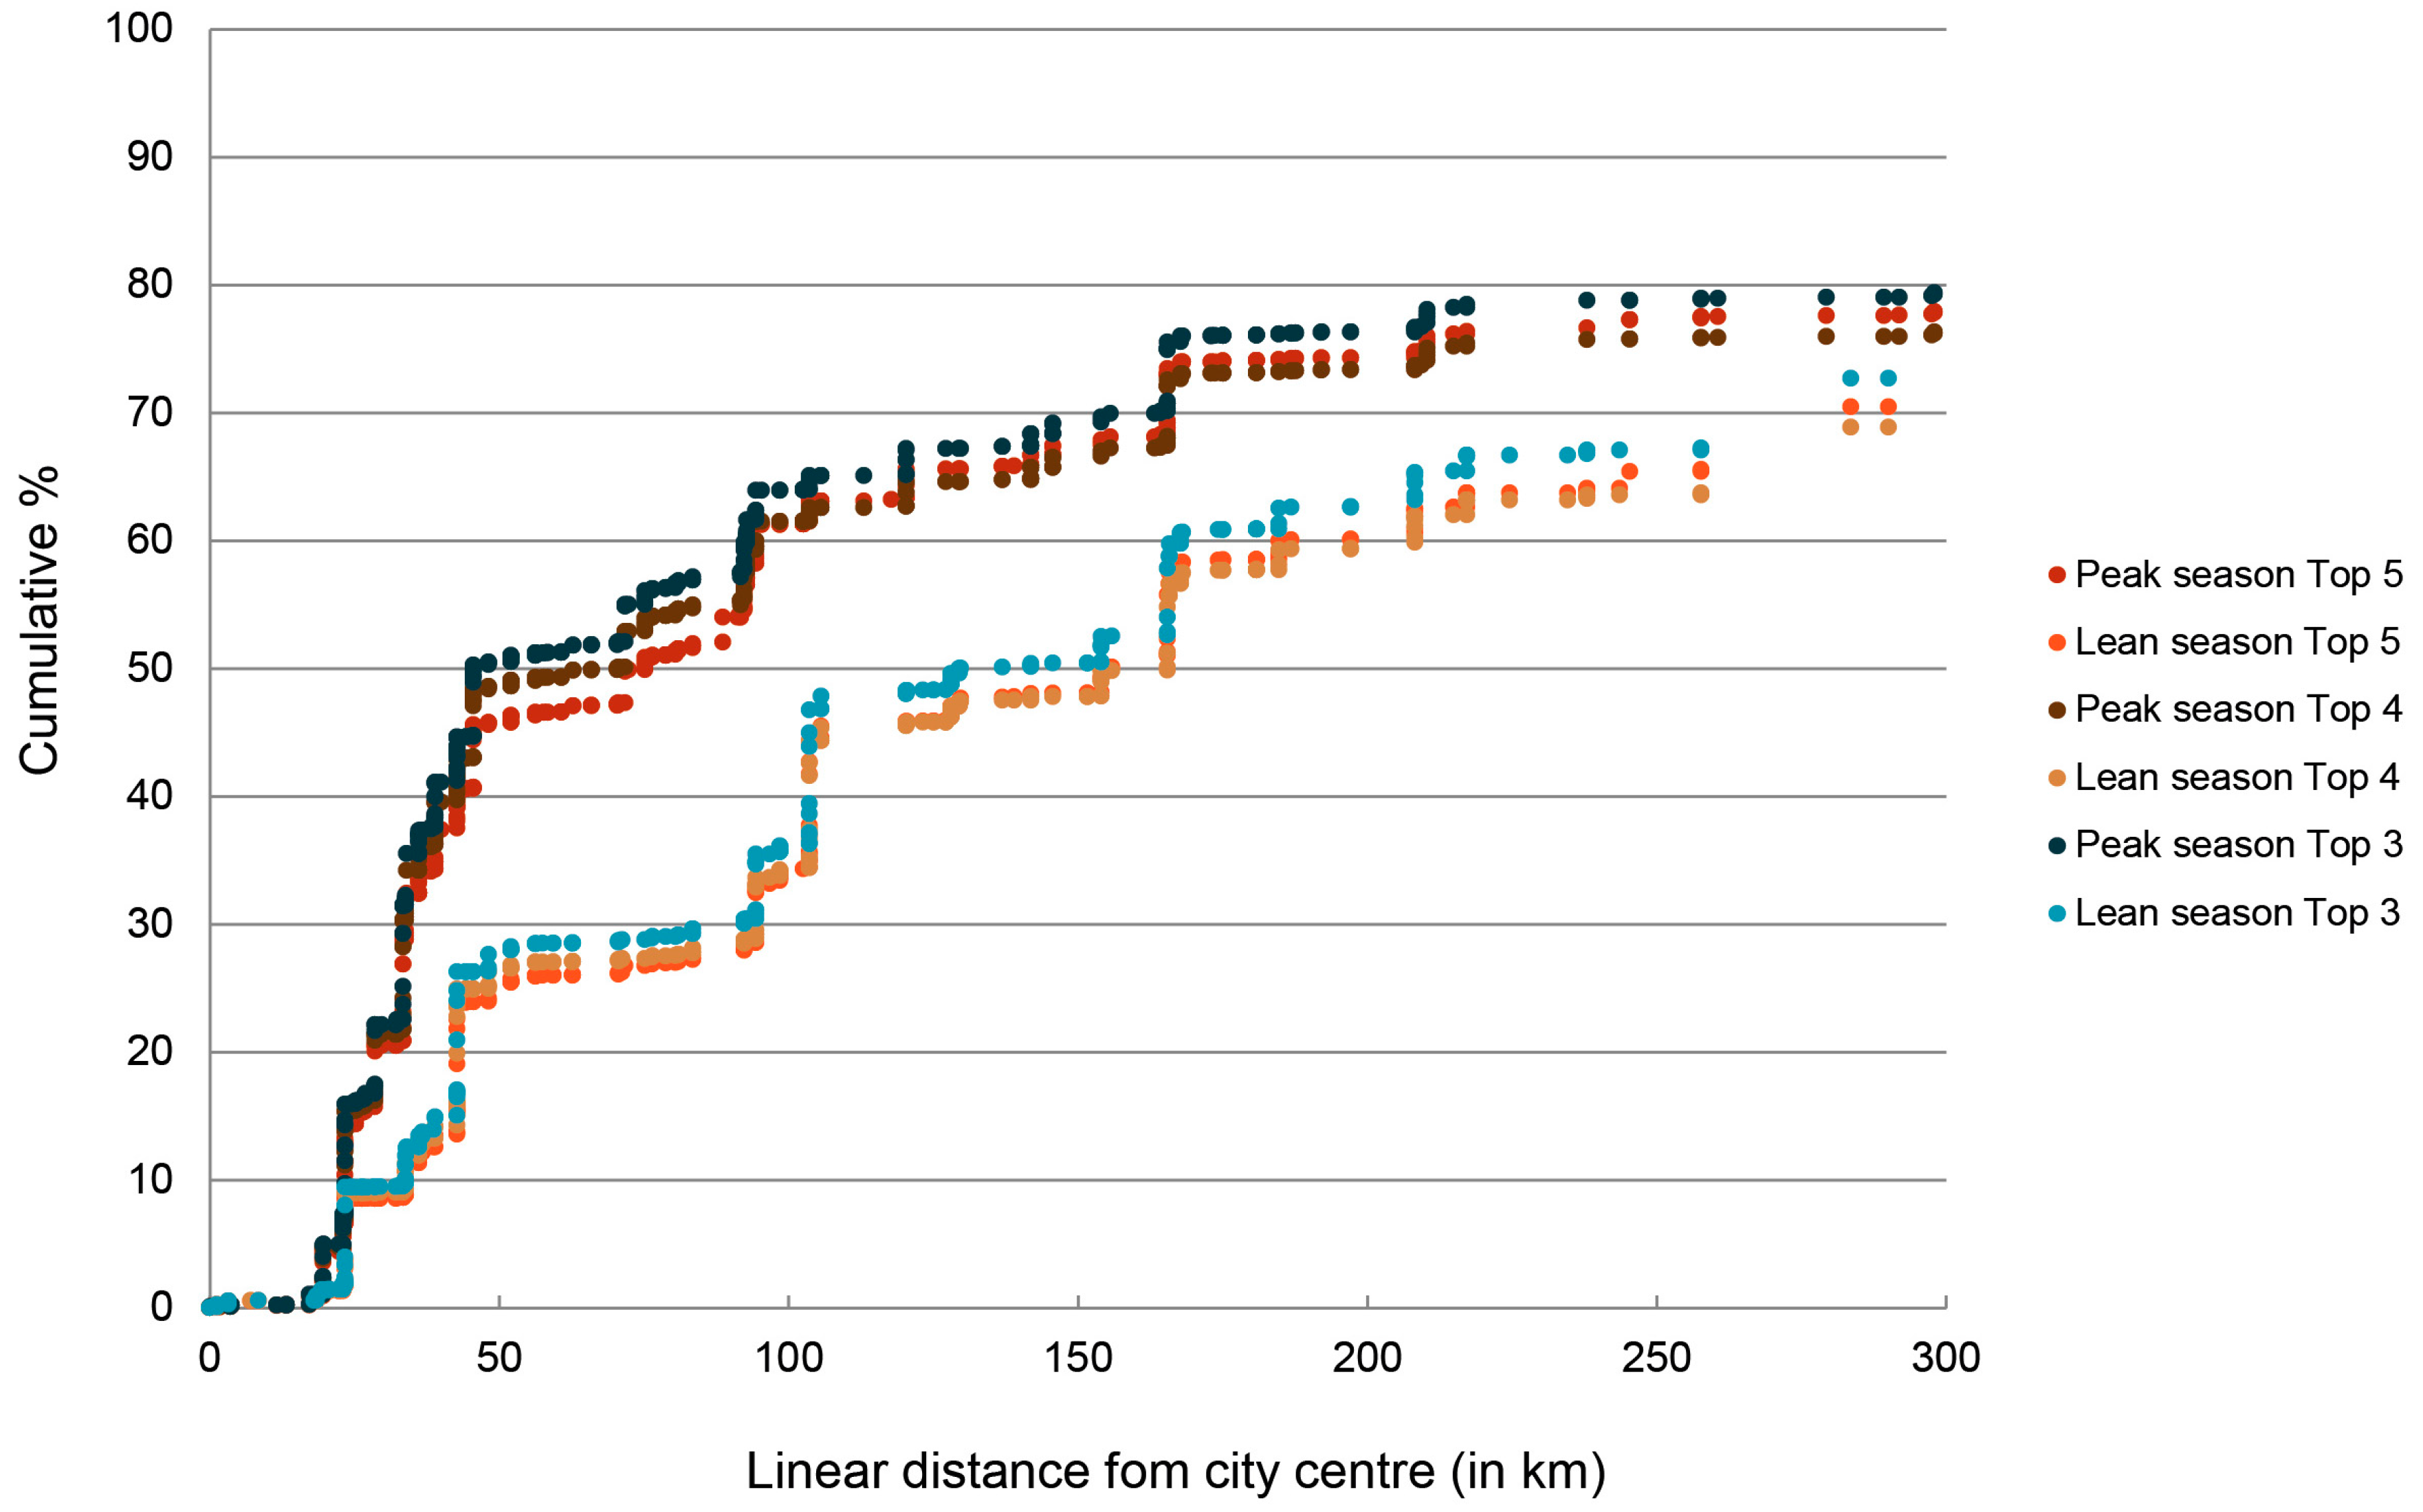
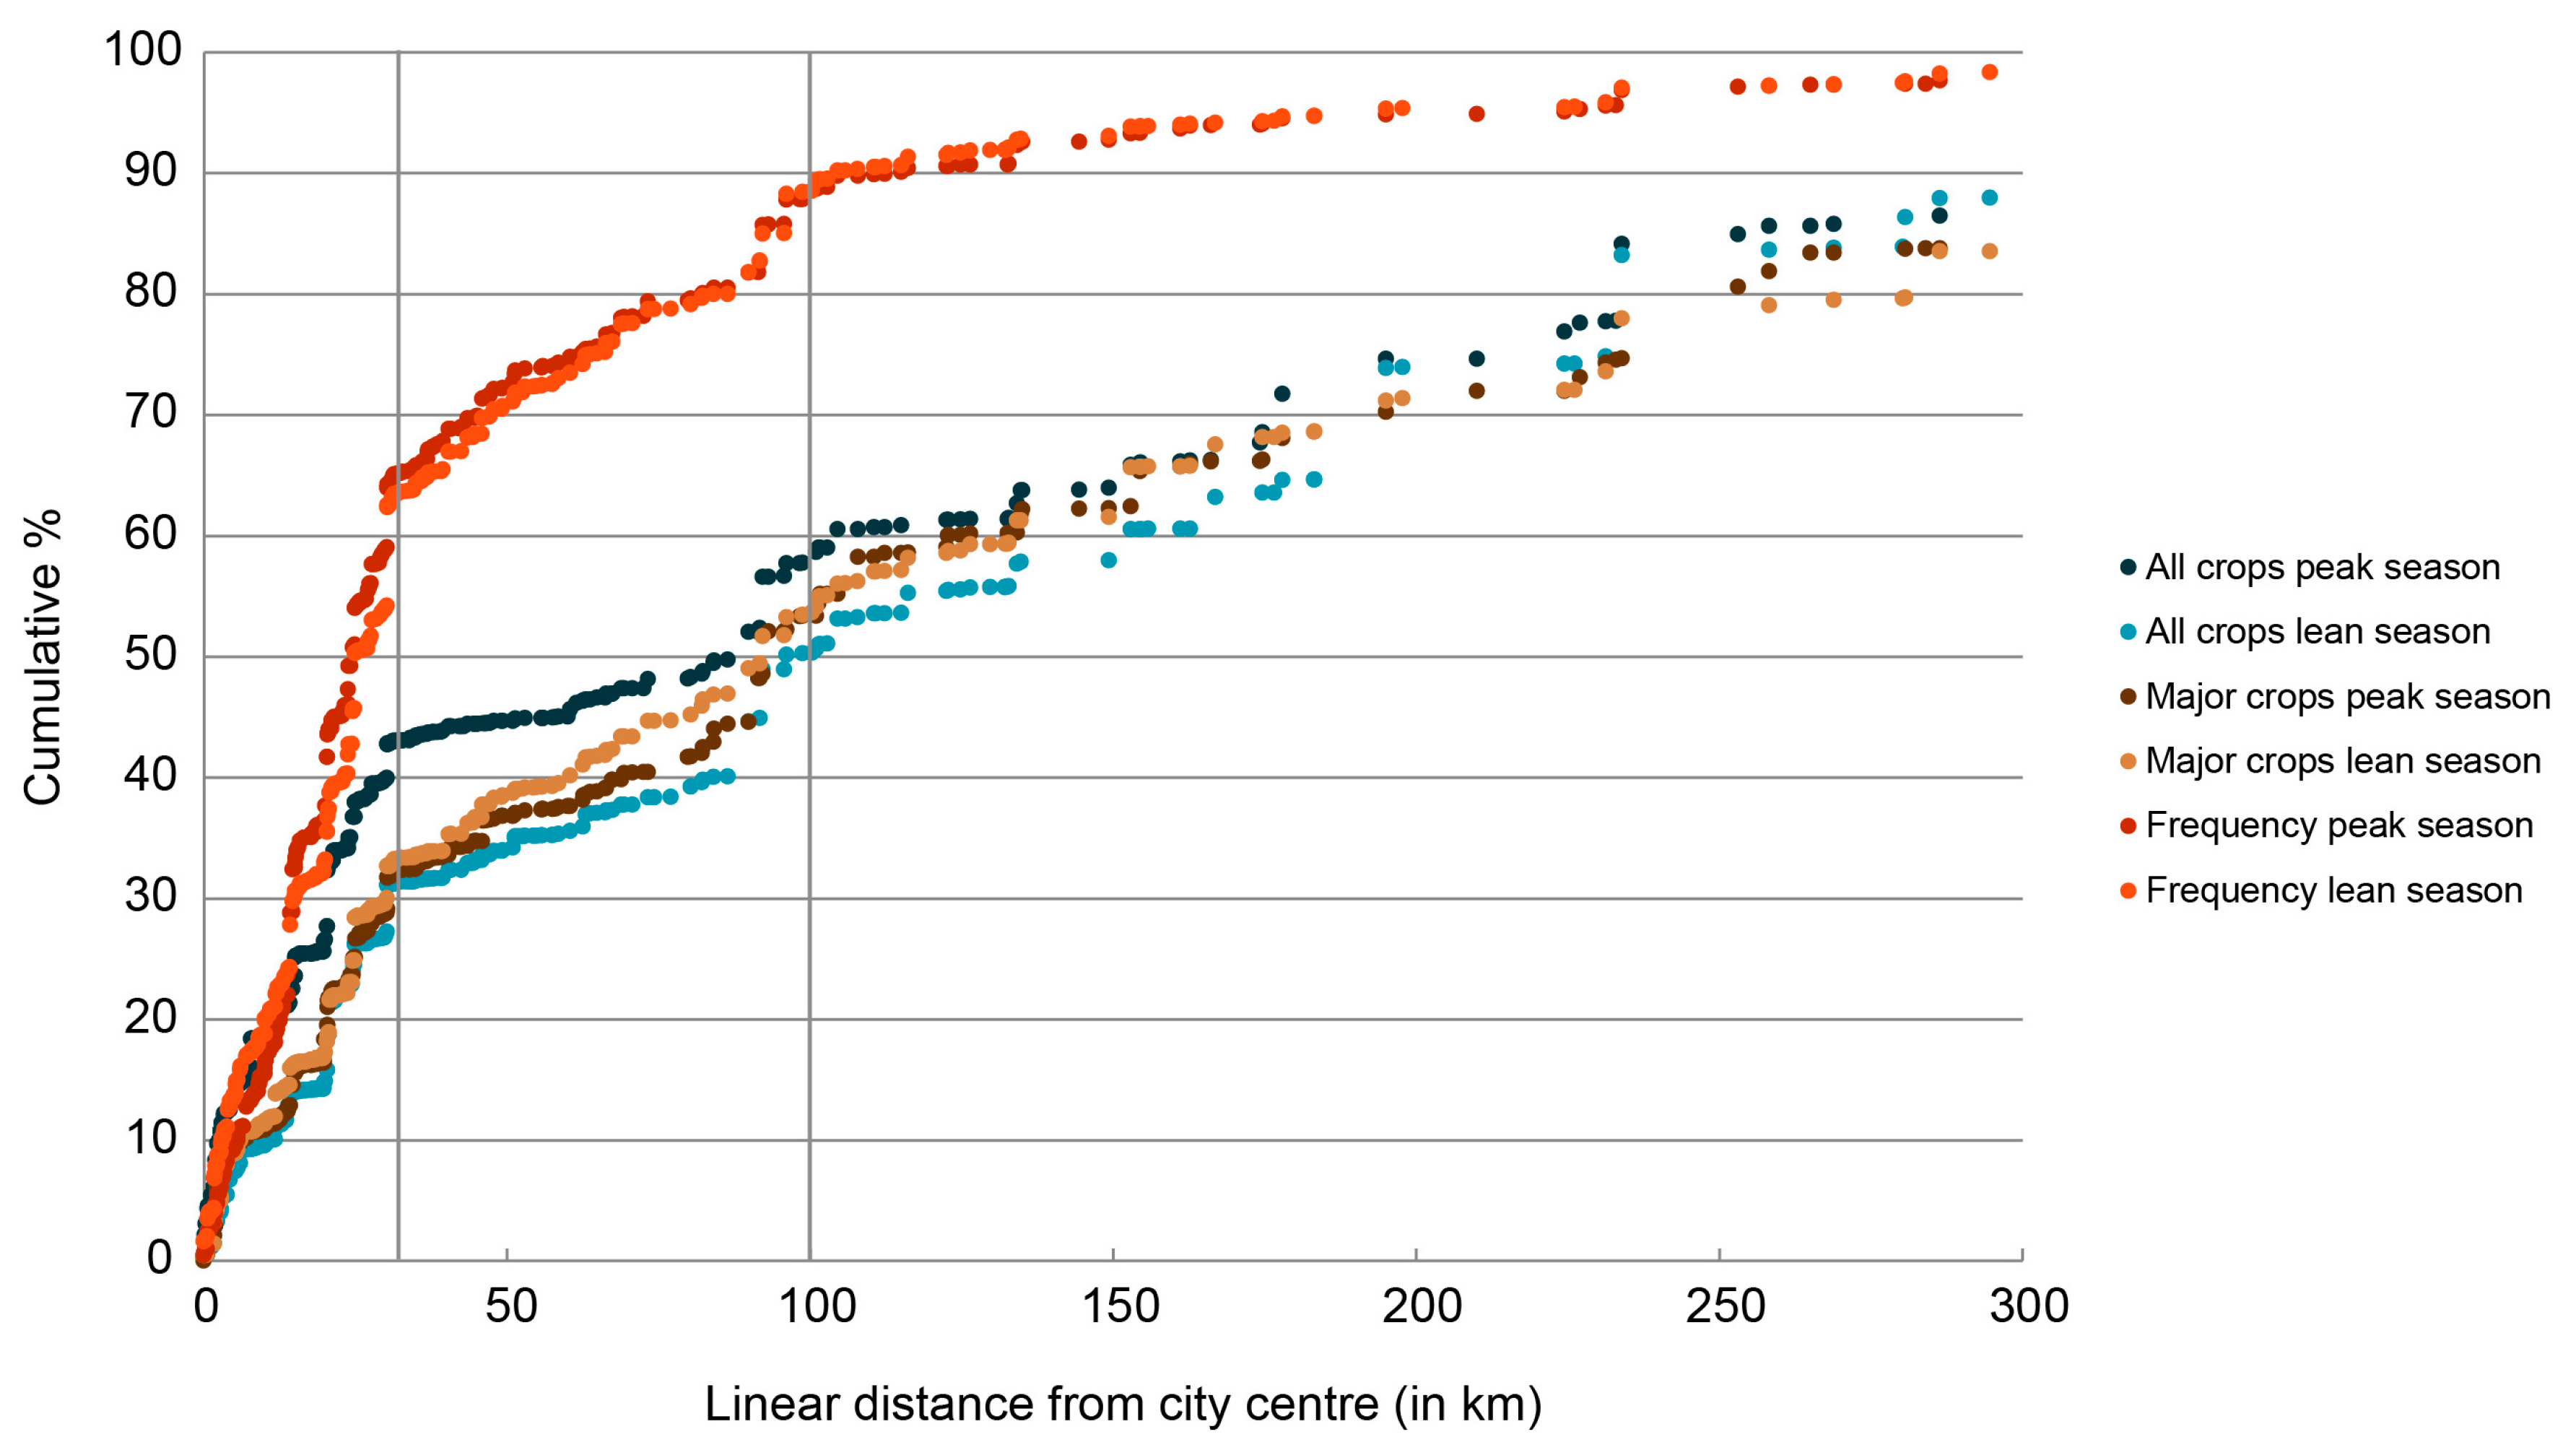
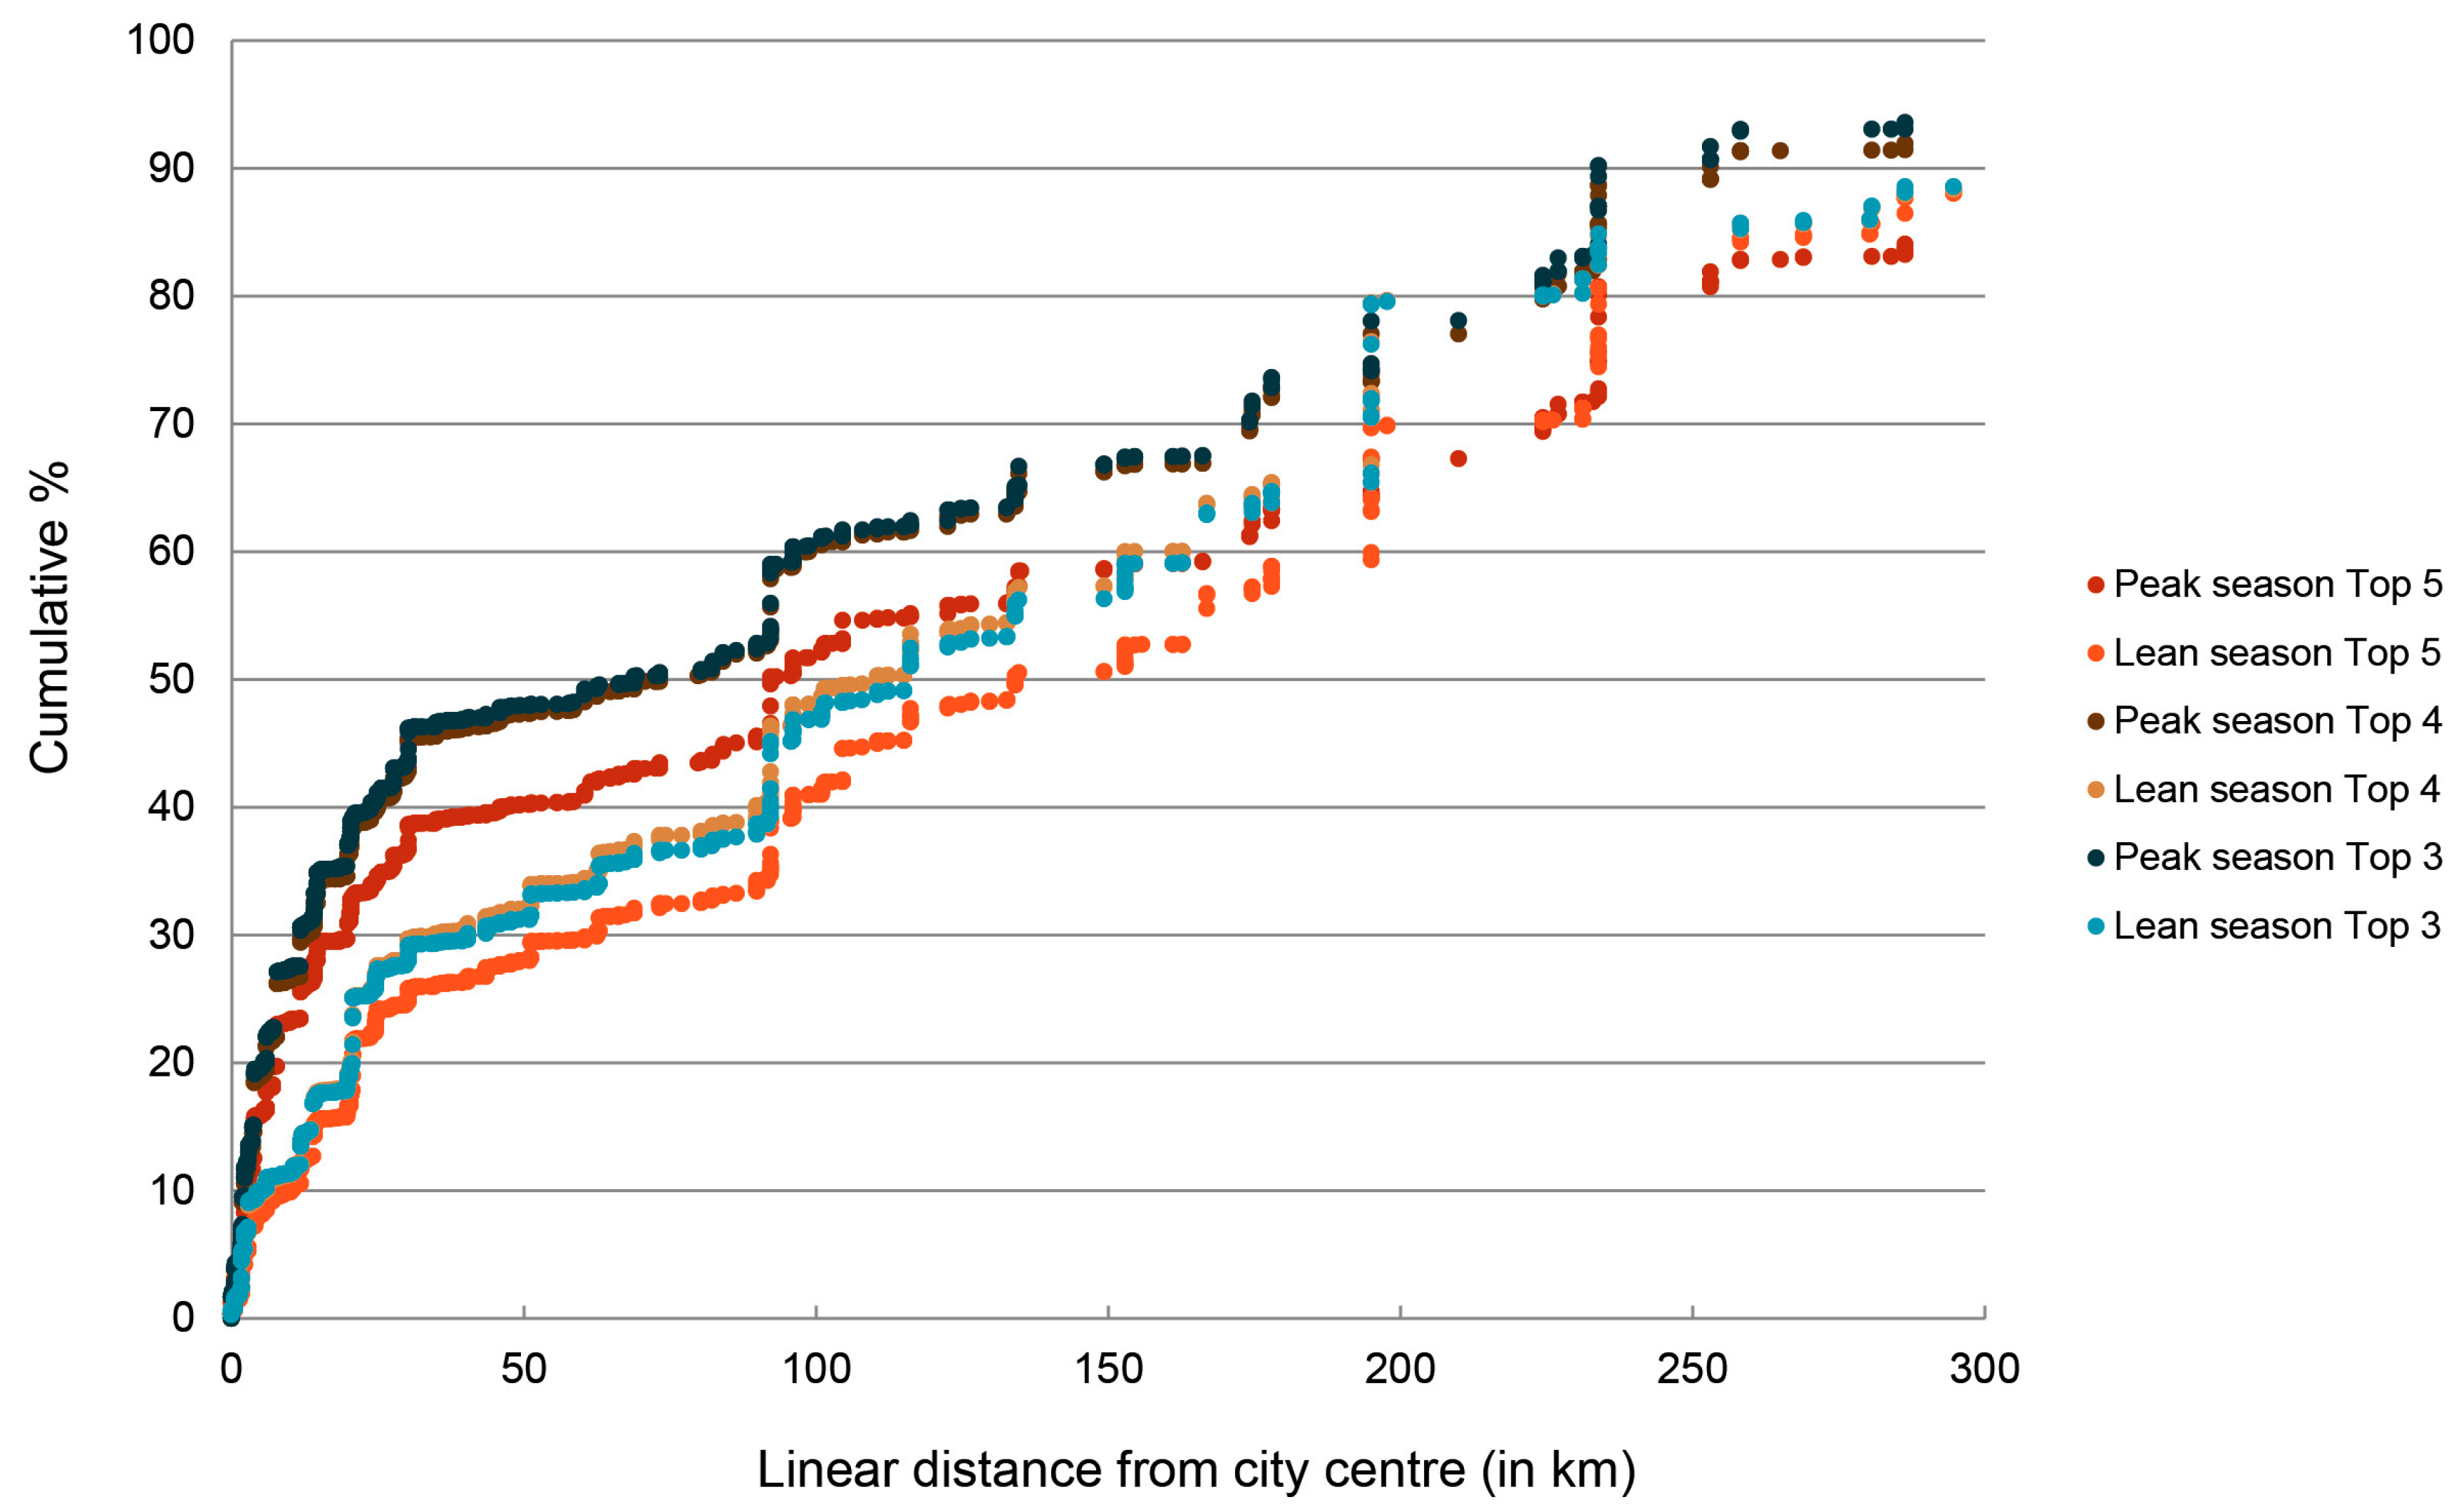
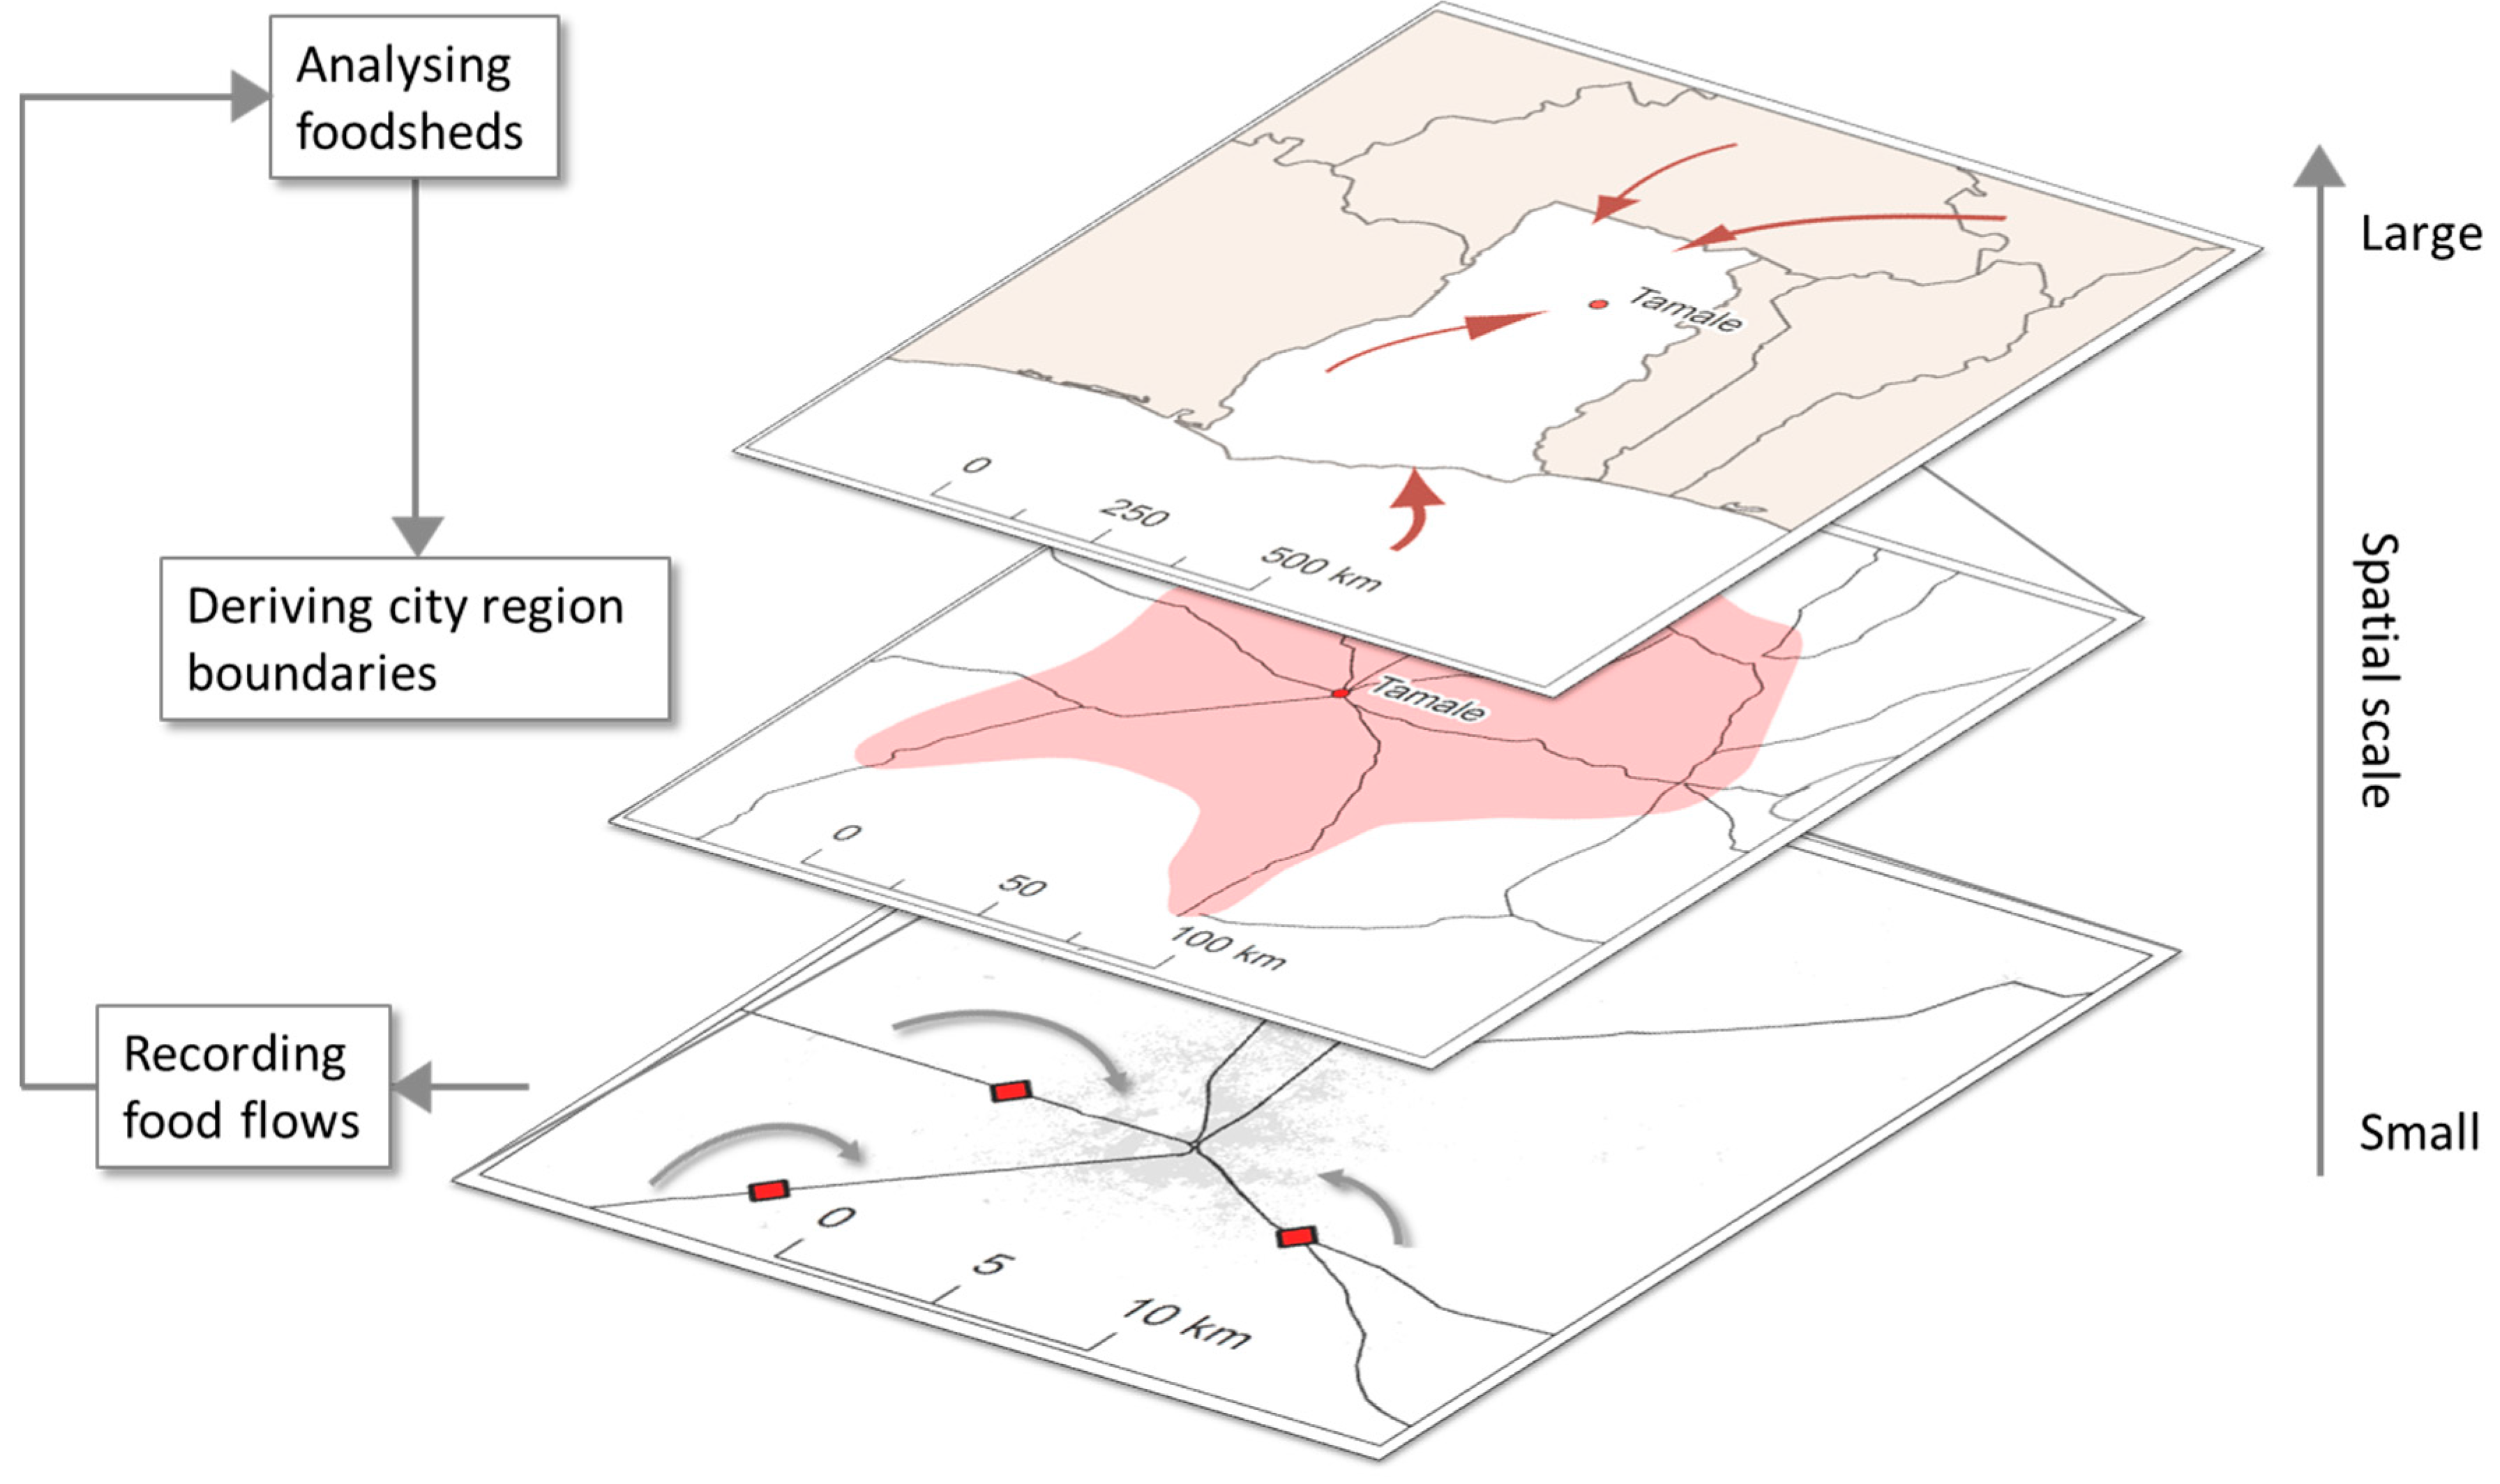
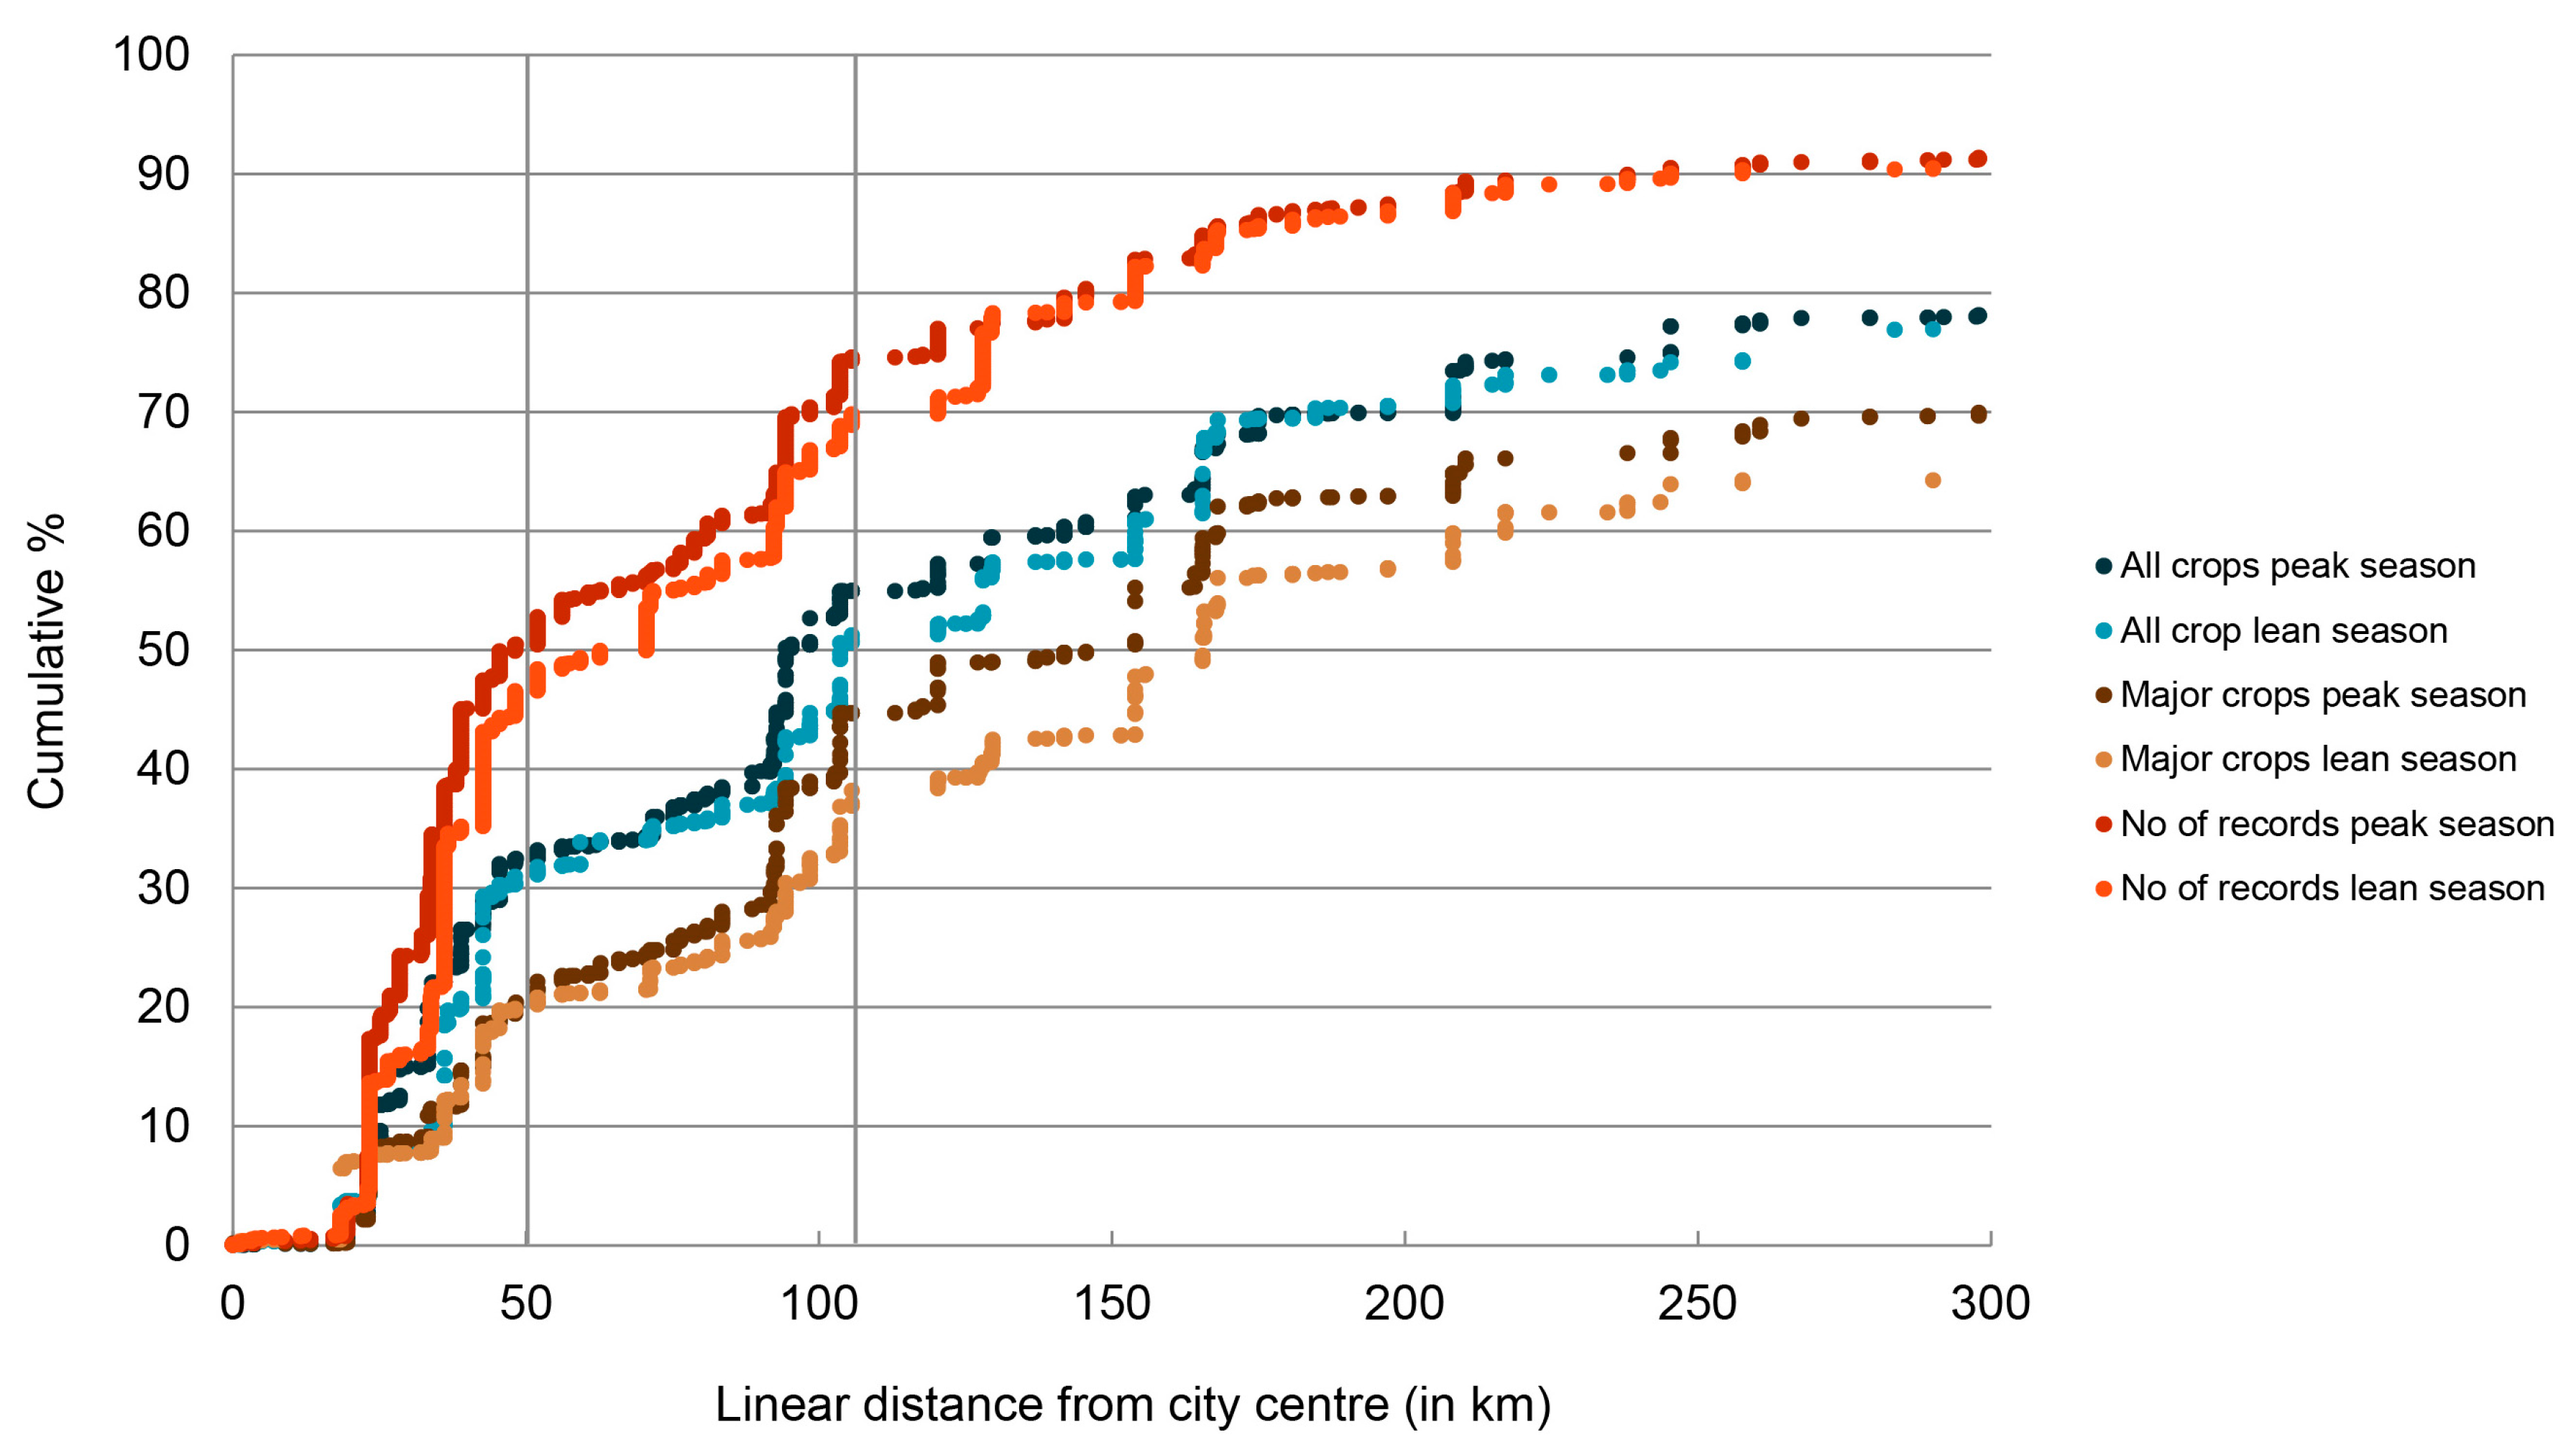
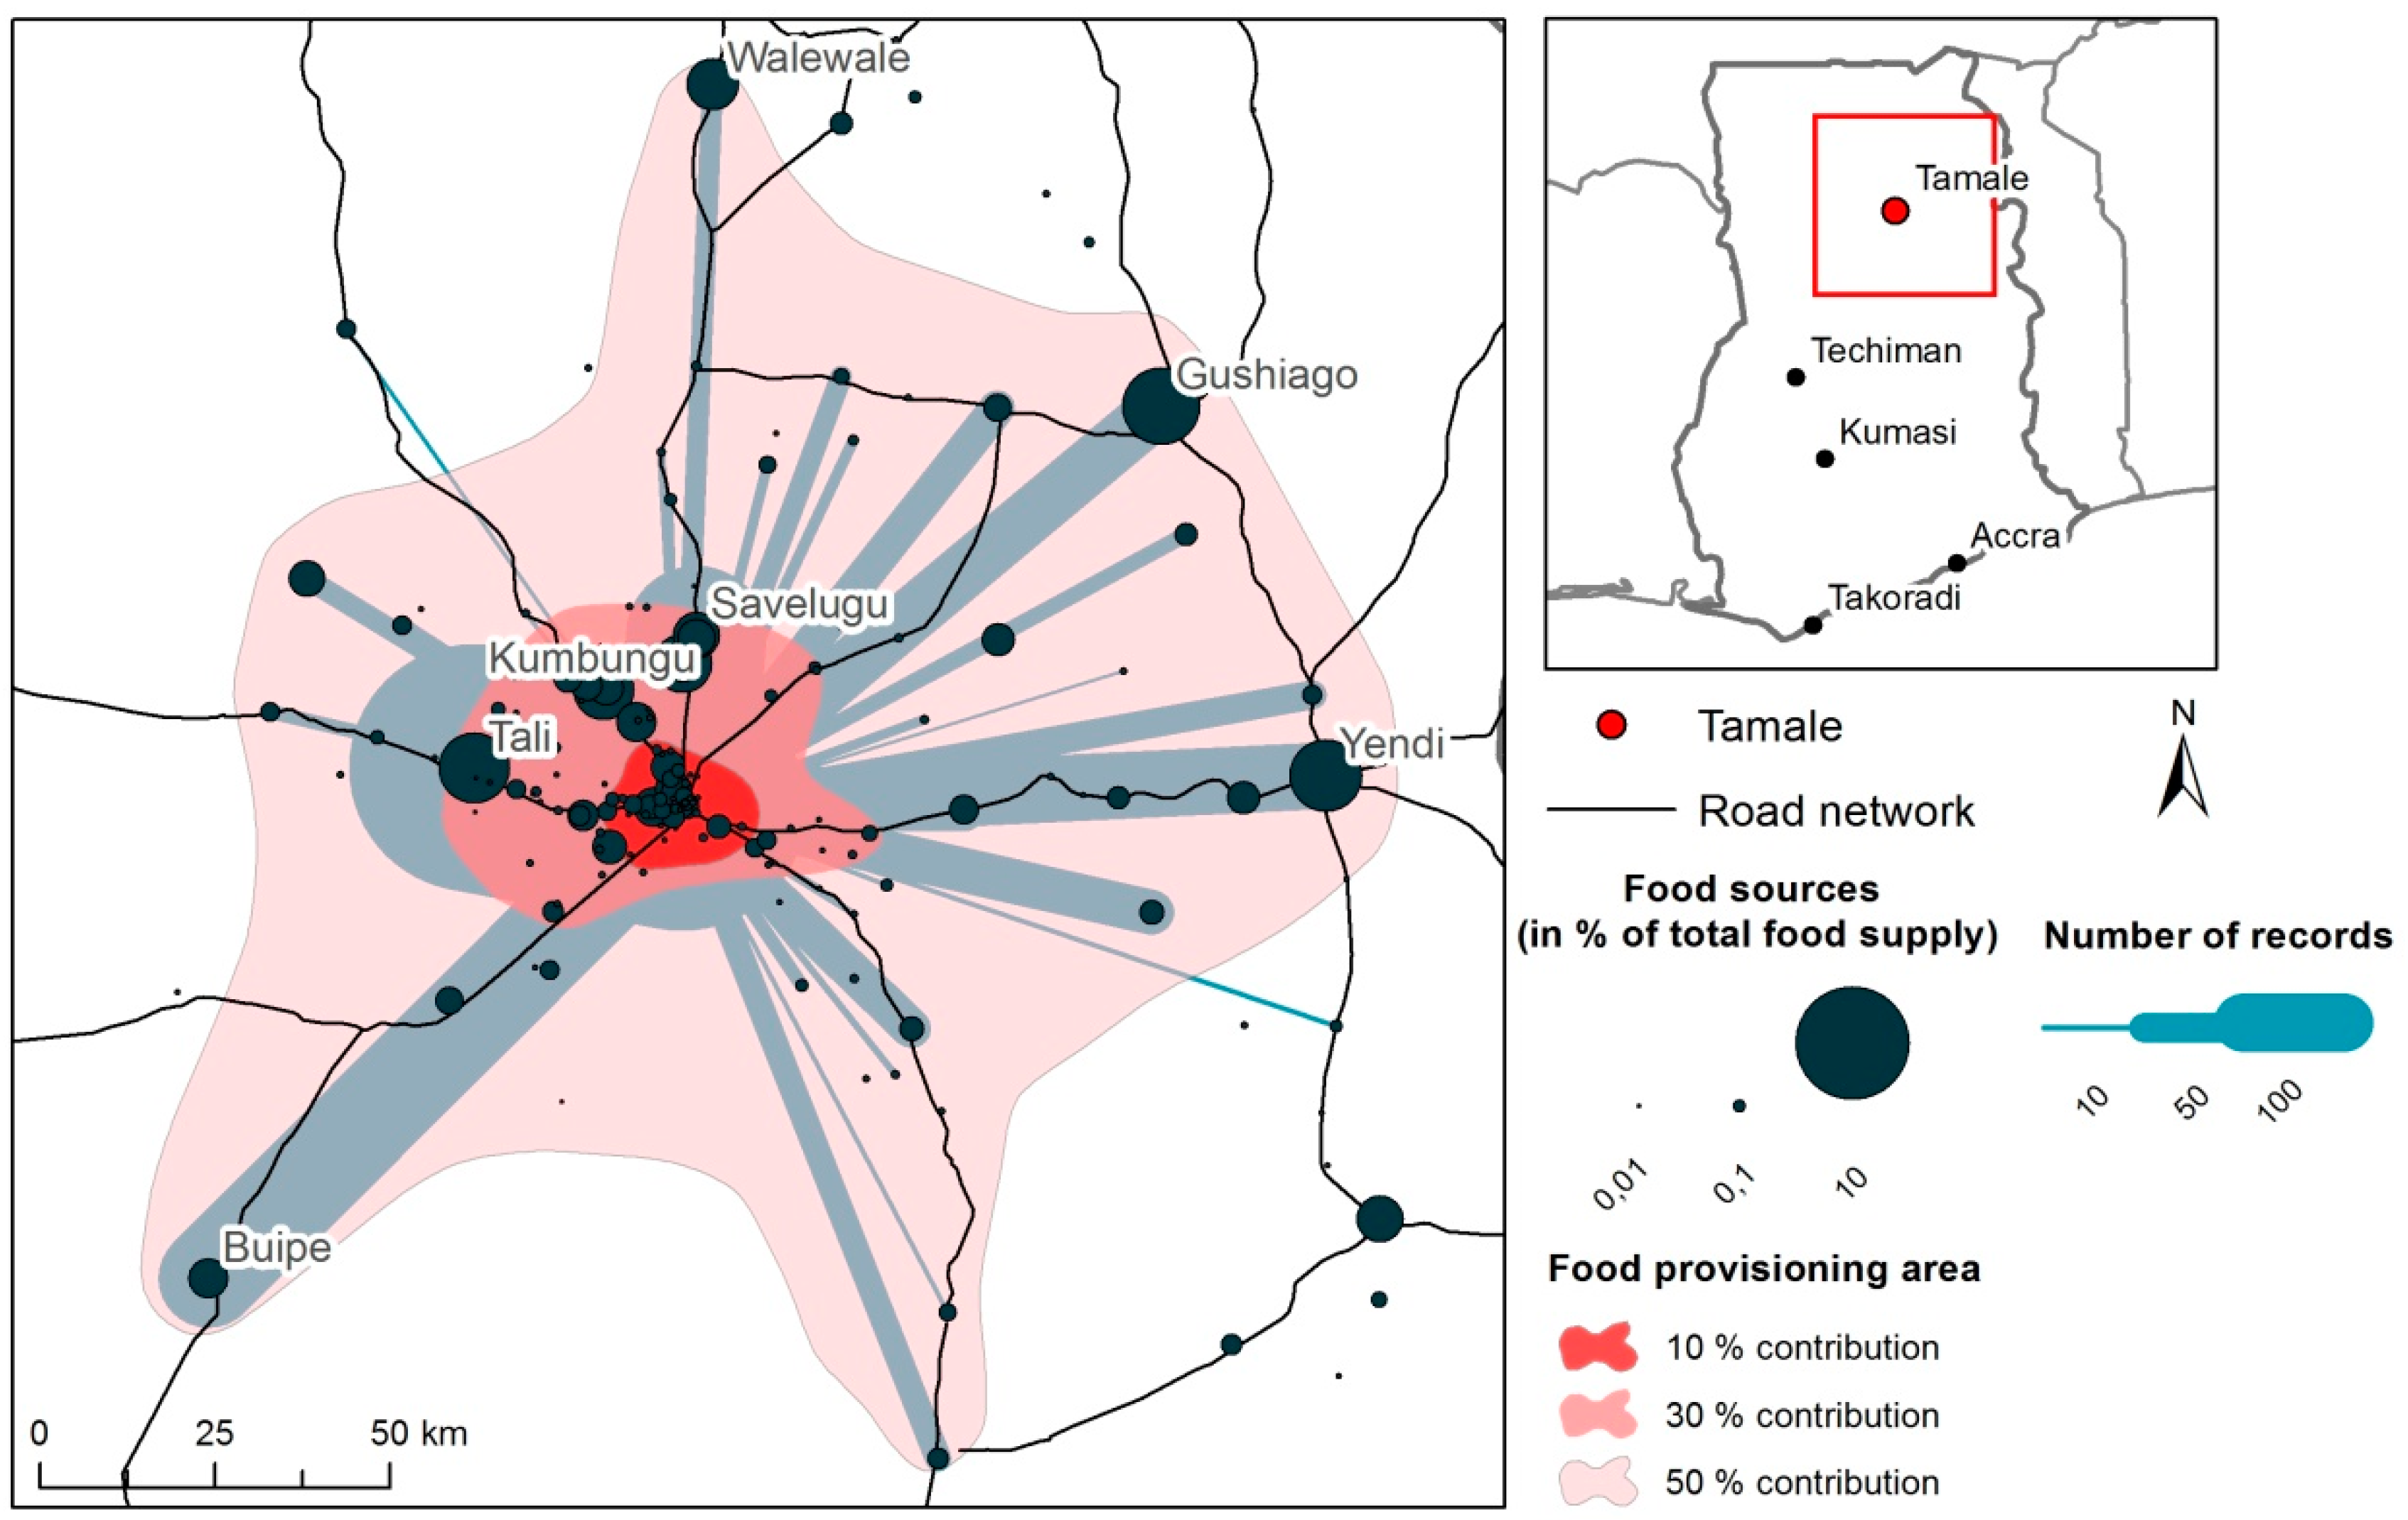
6.1. Mapping Urban “Foodsheds”
6.2. Delineating City Regions
- (1)
- (2)
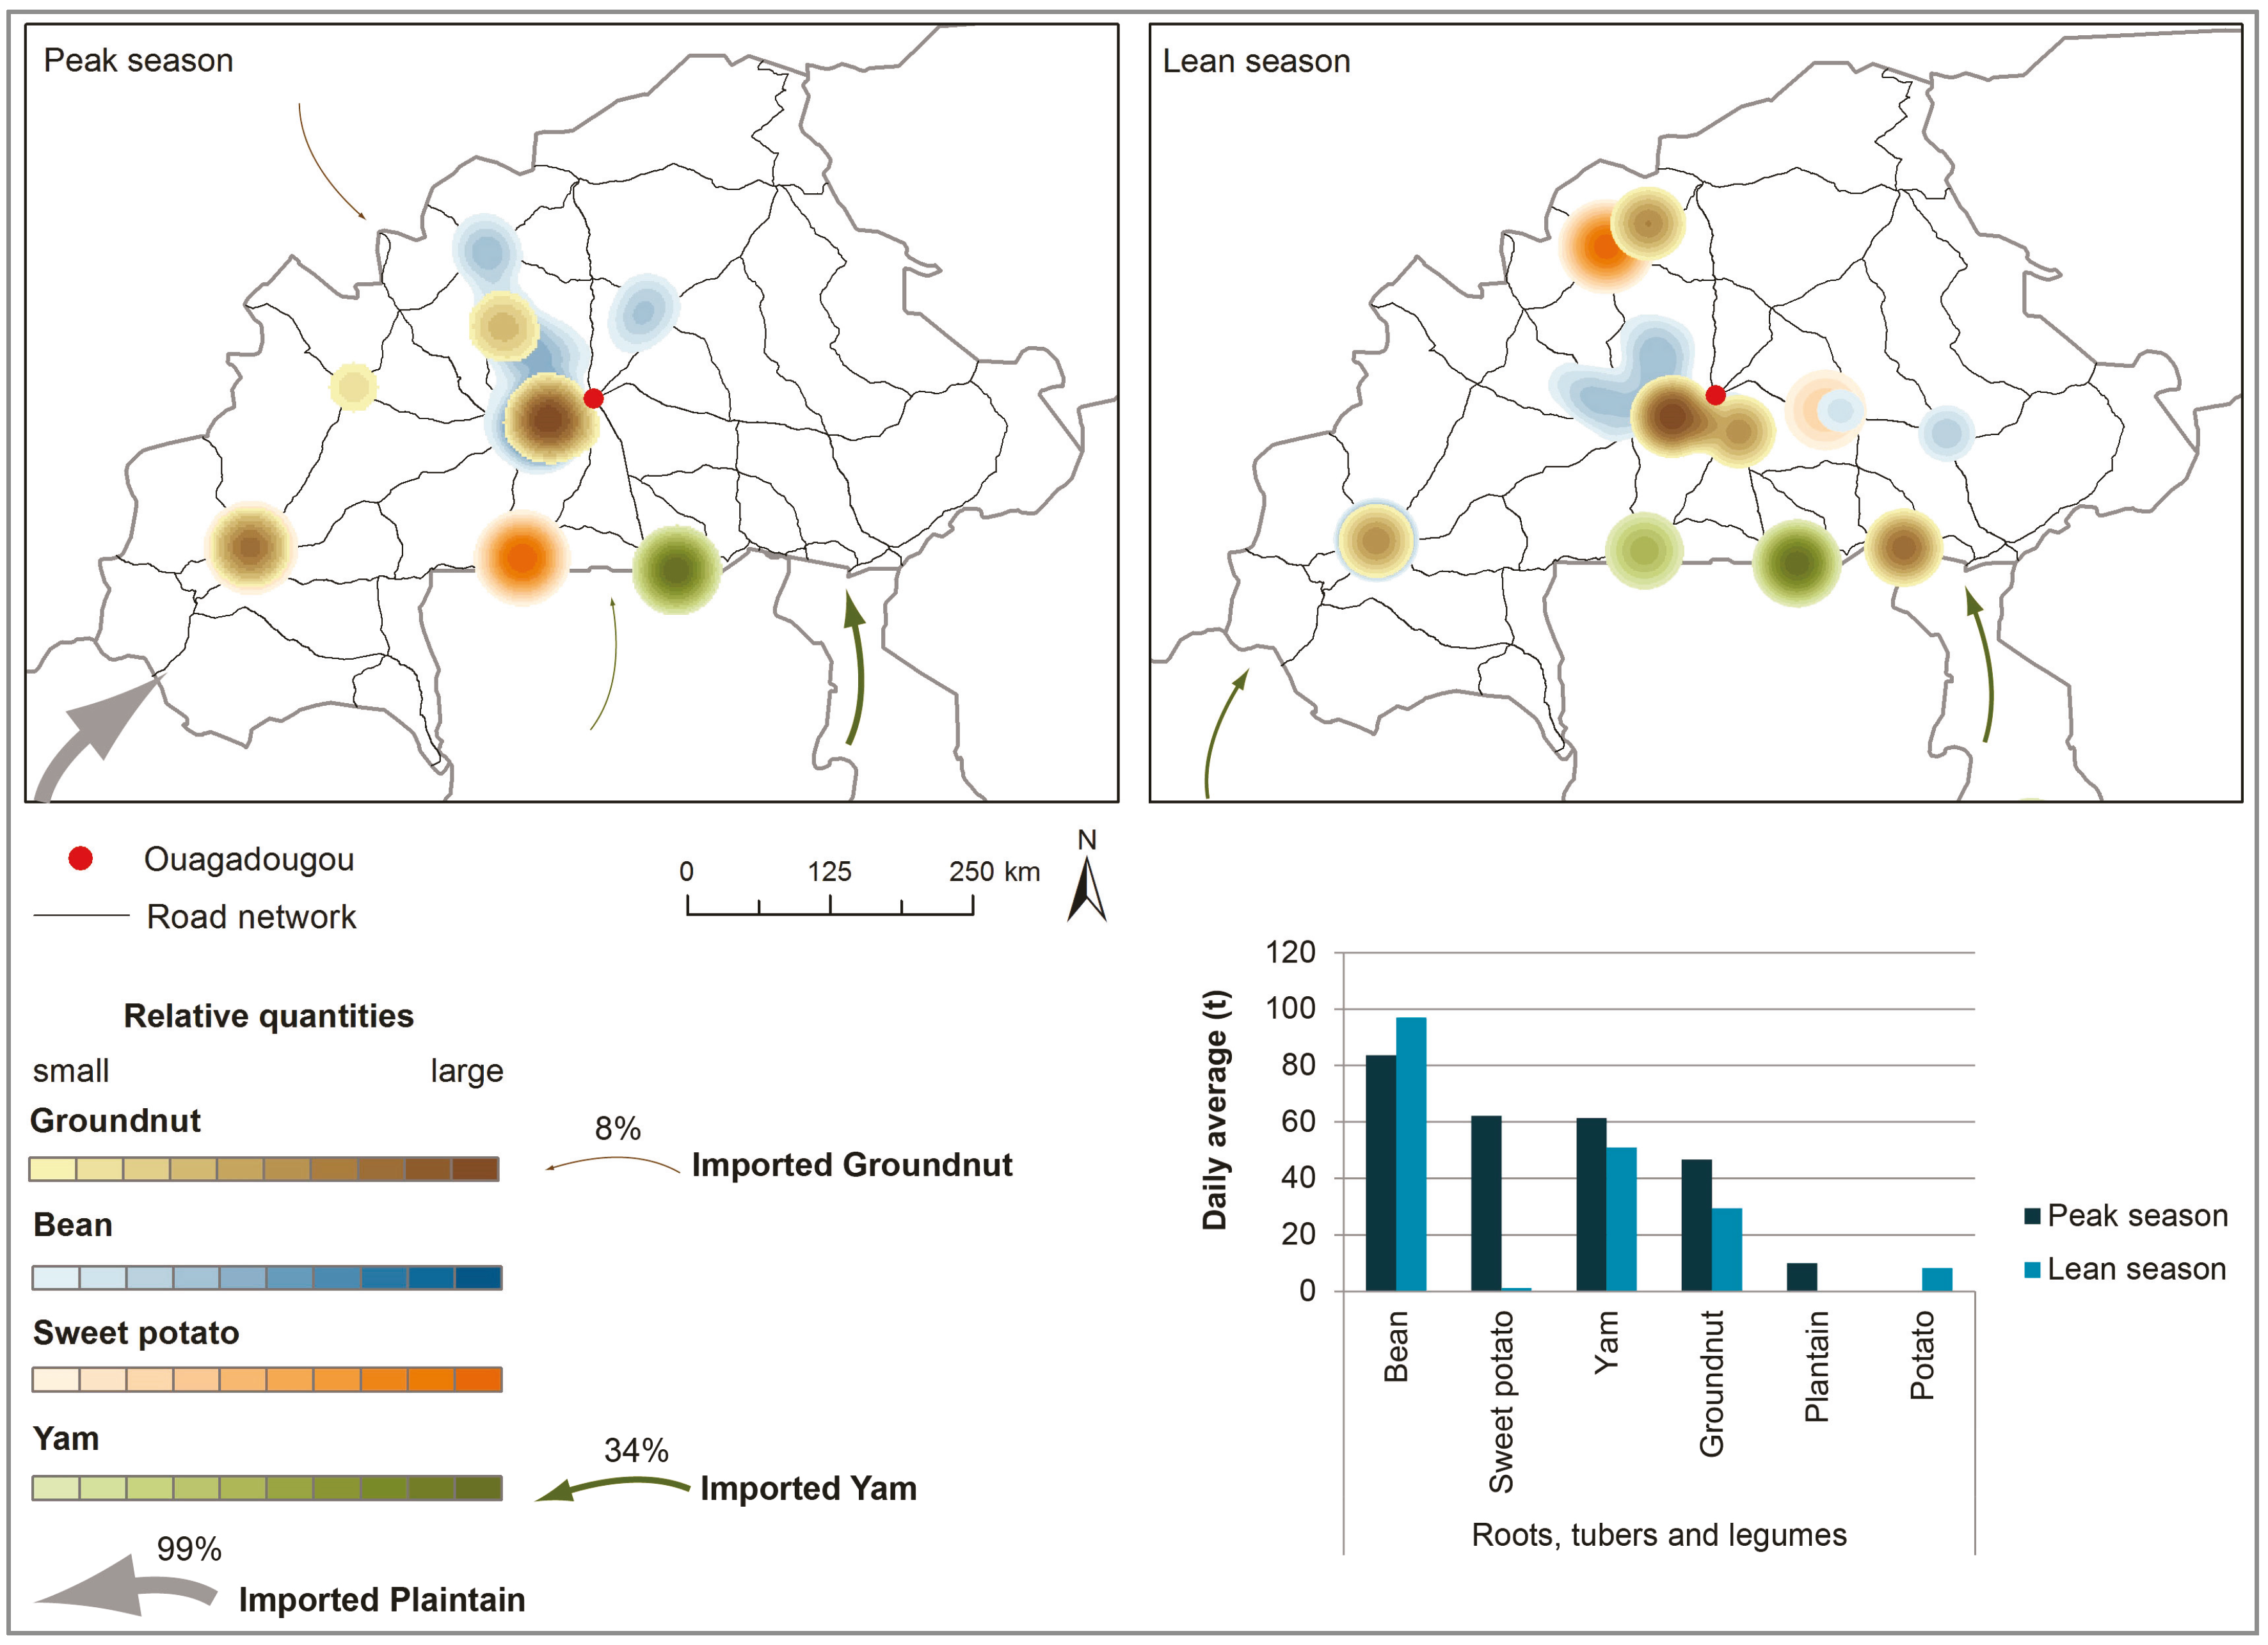
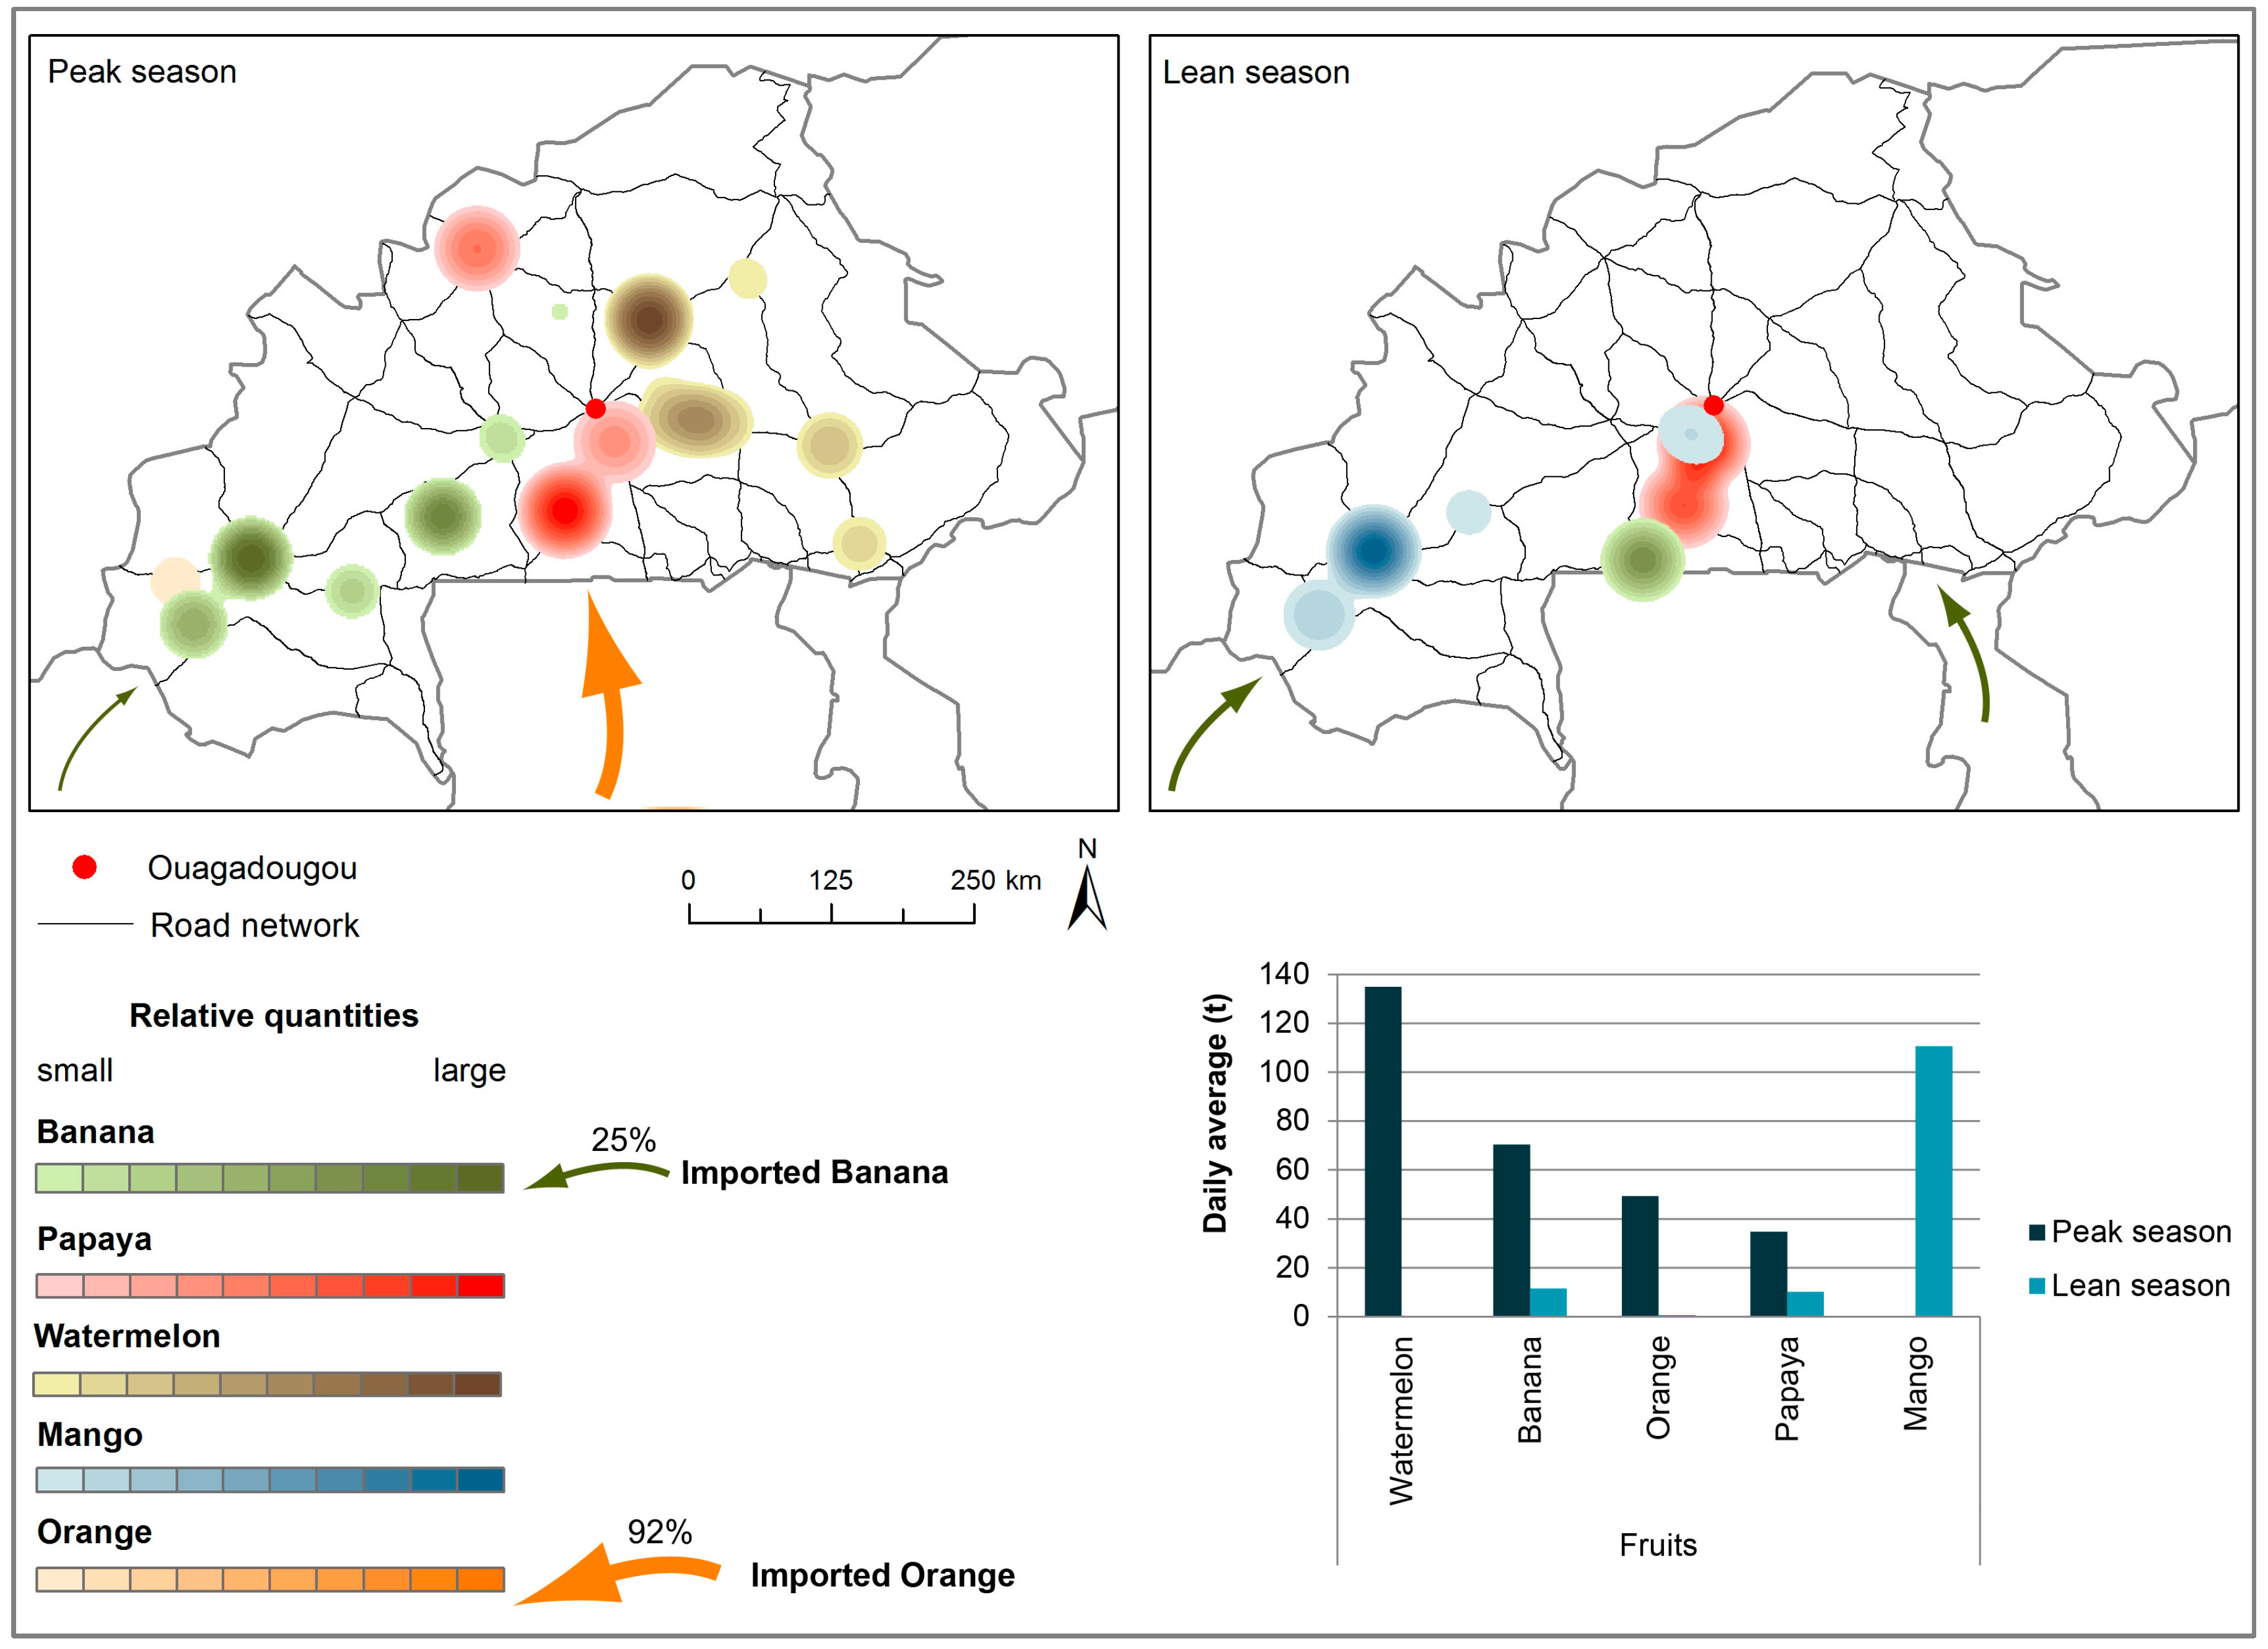
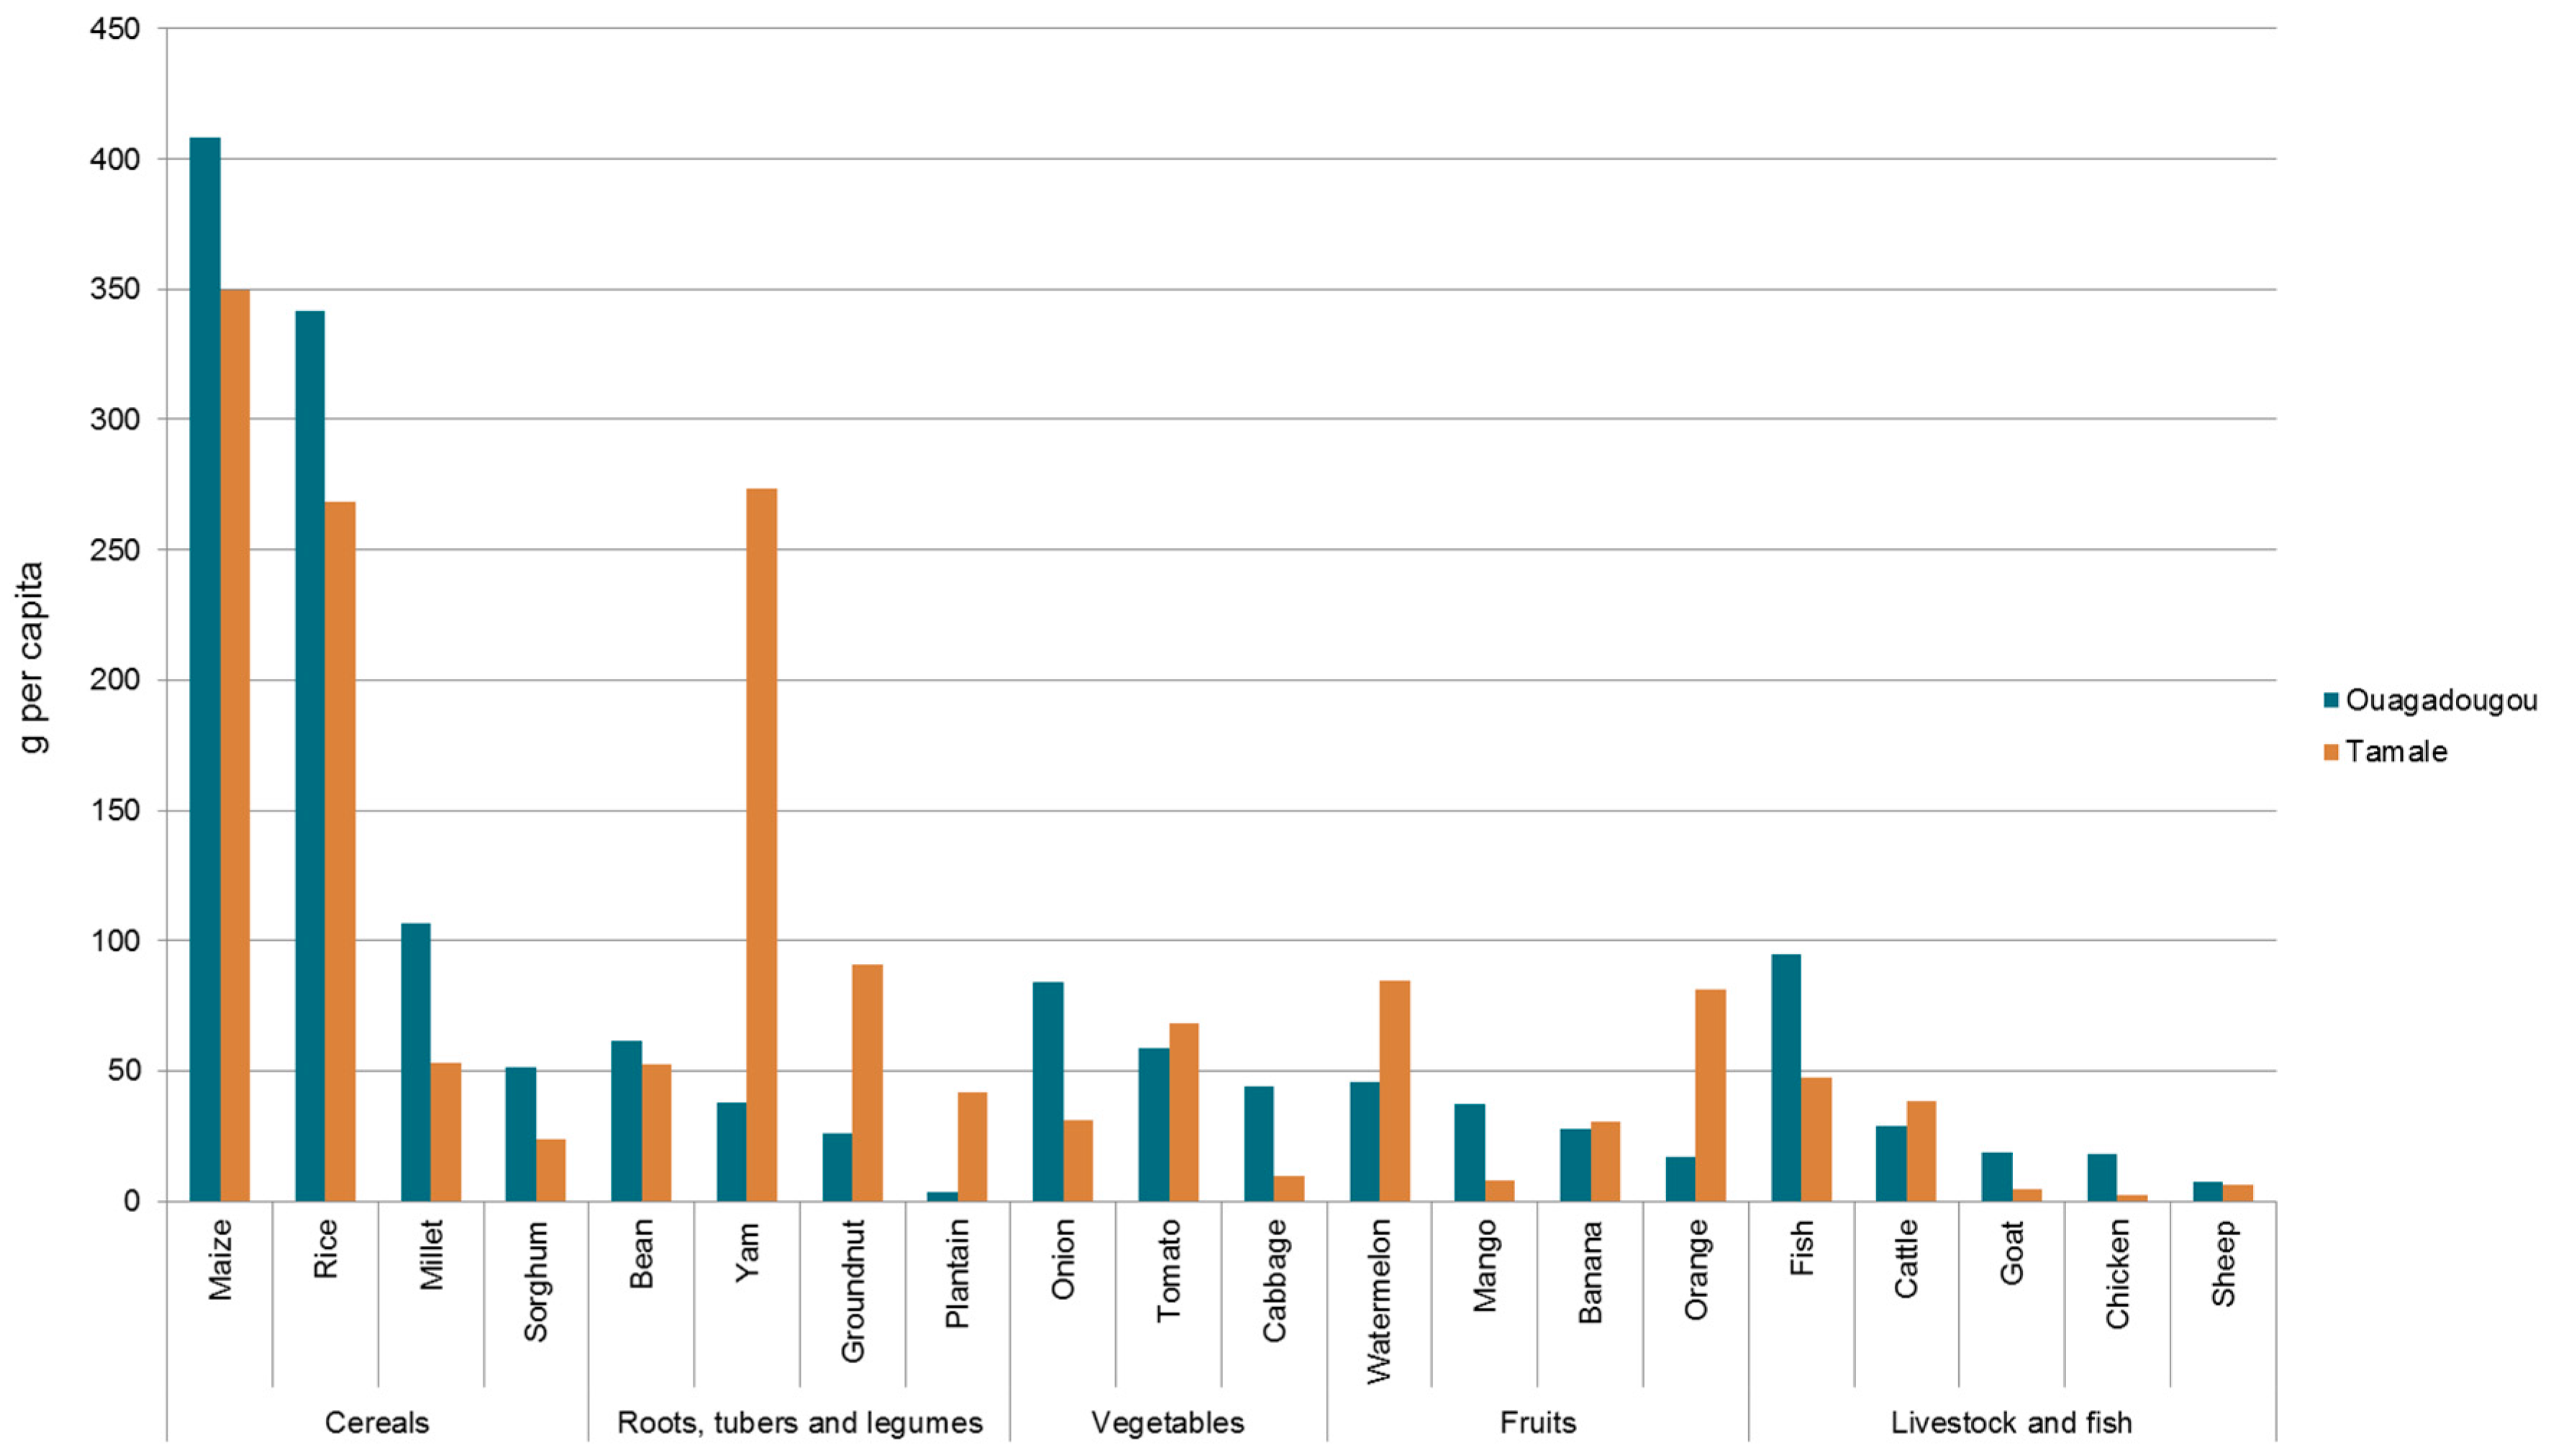
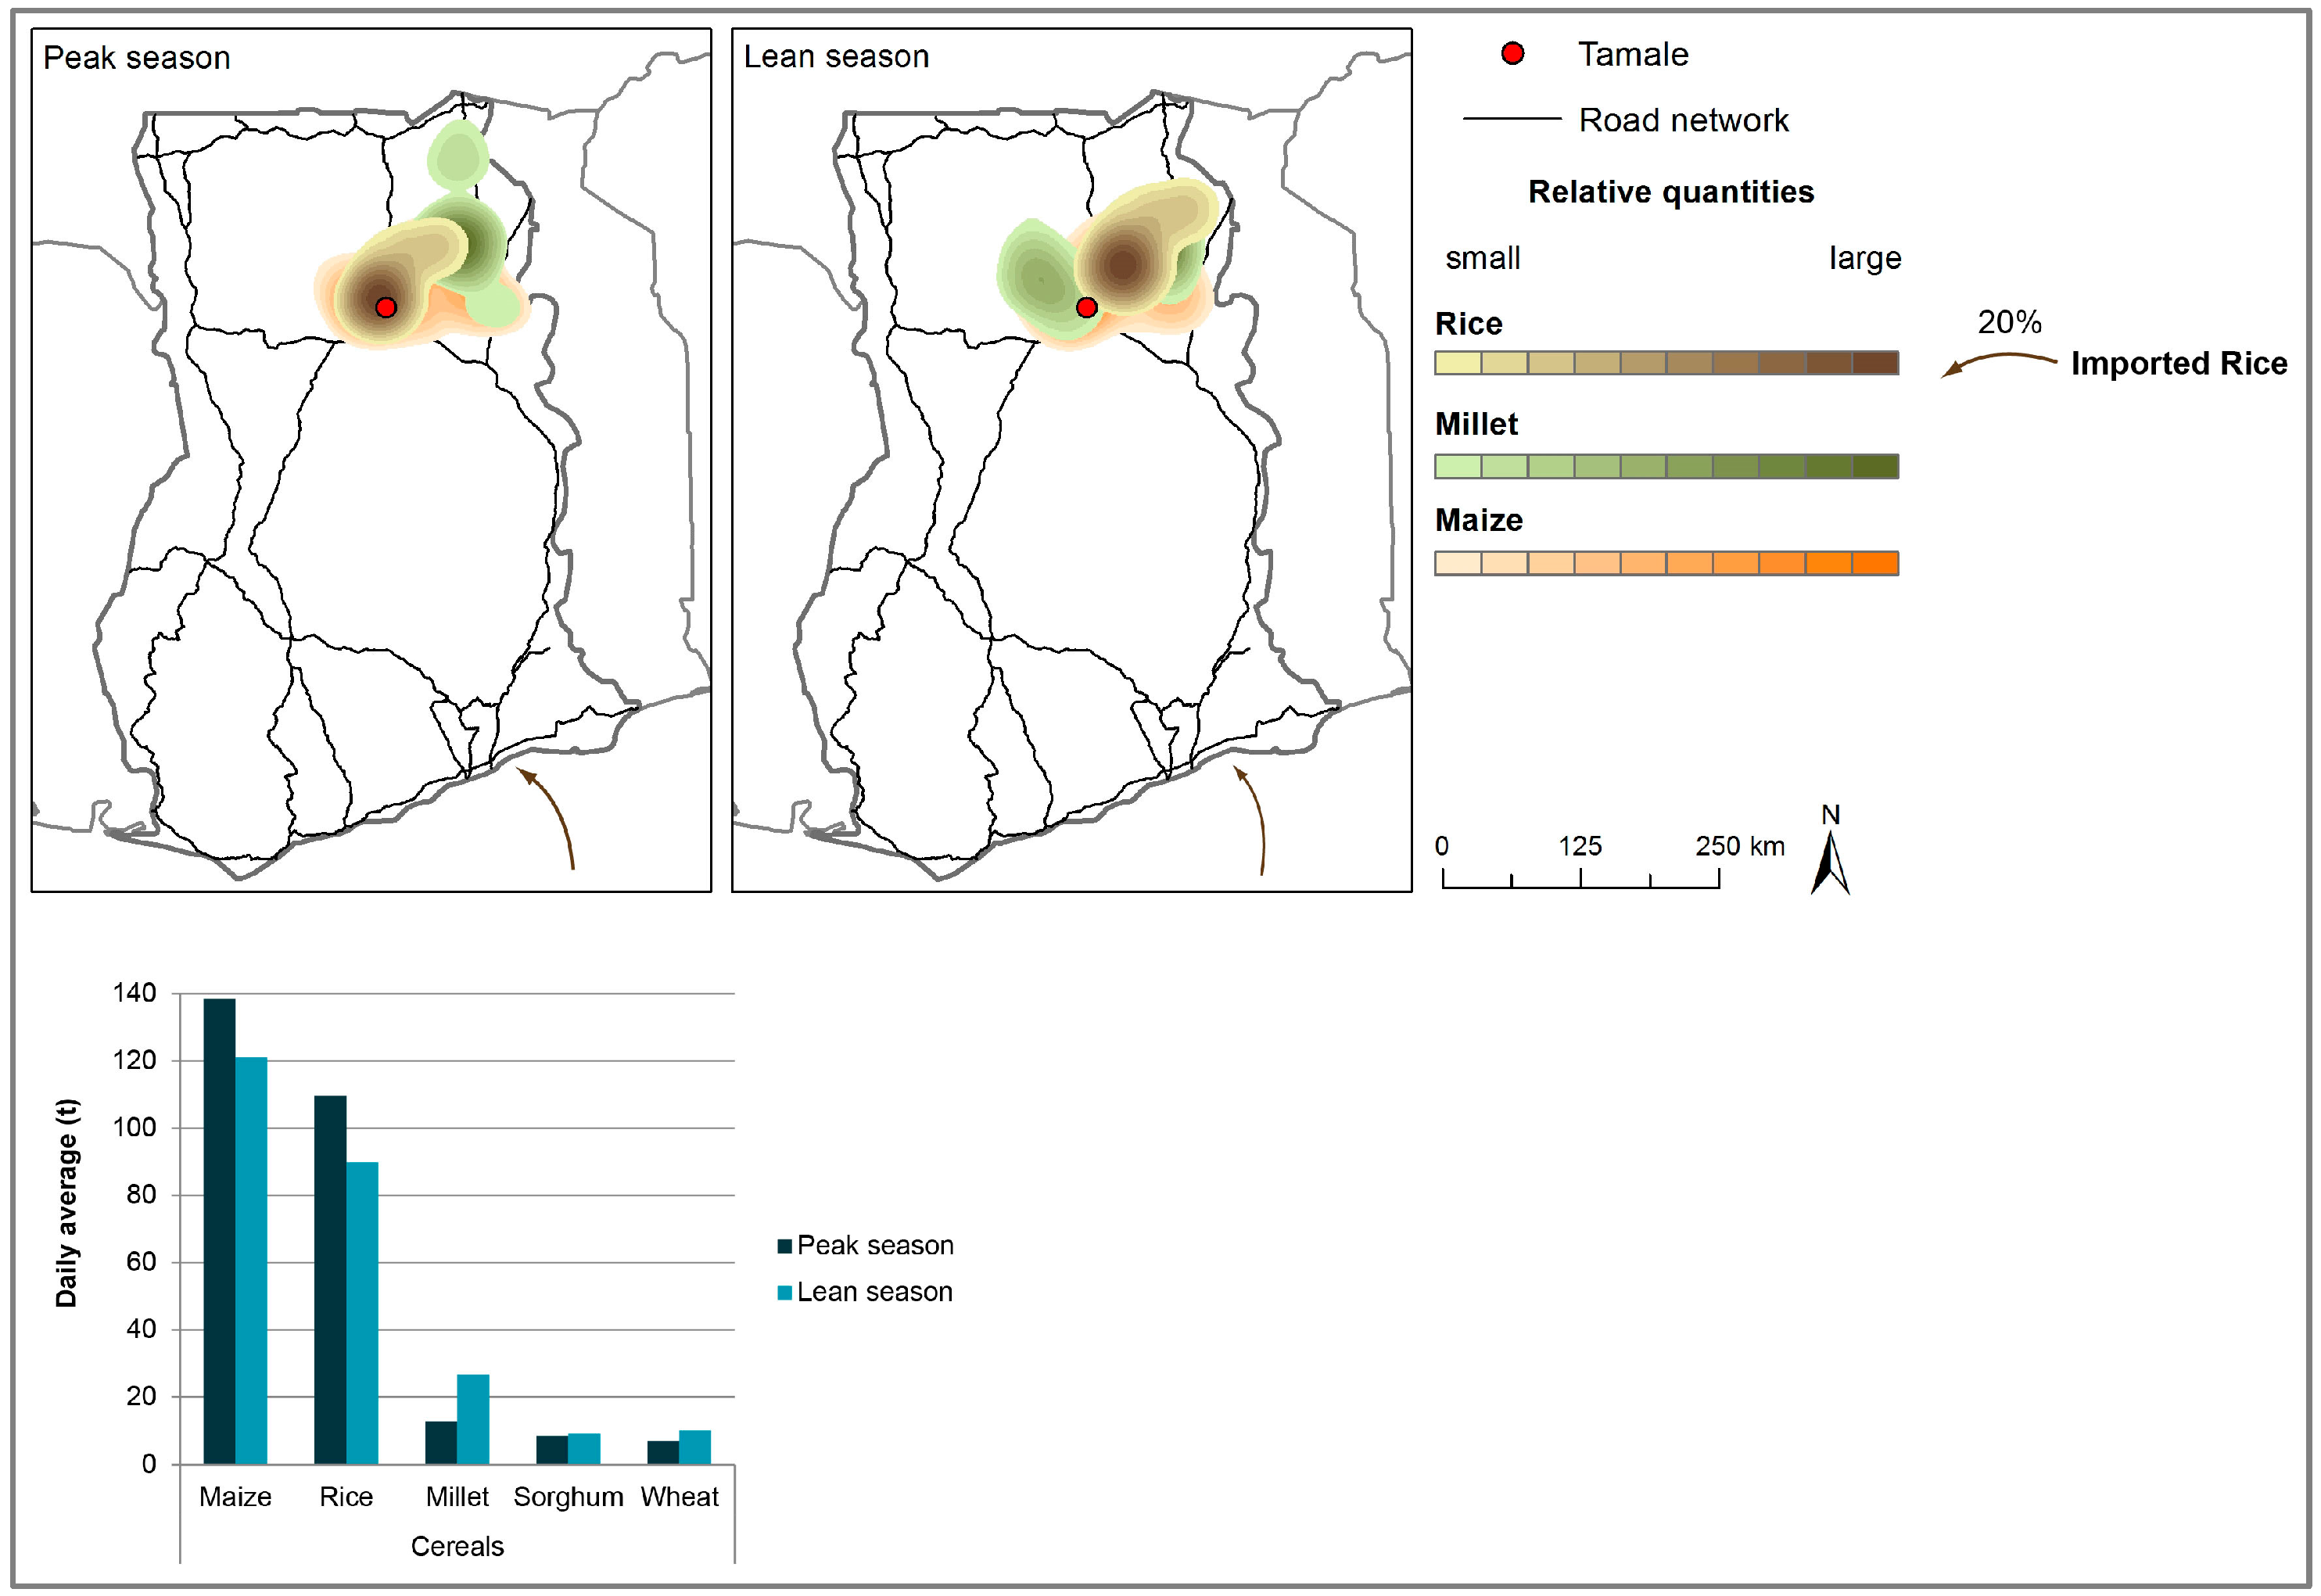
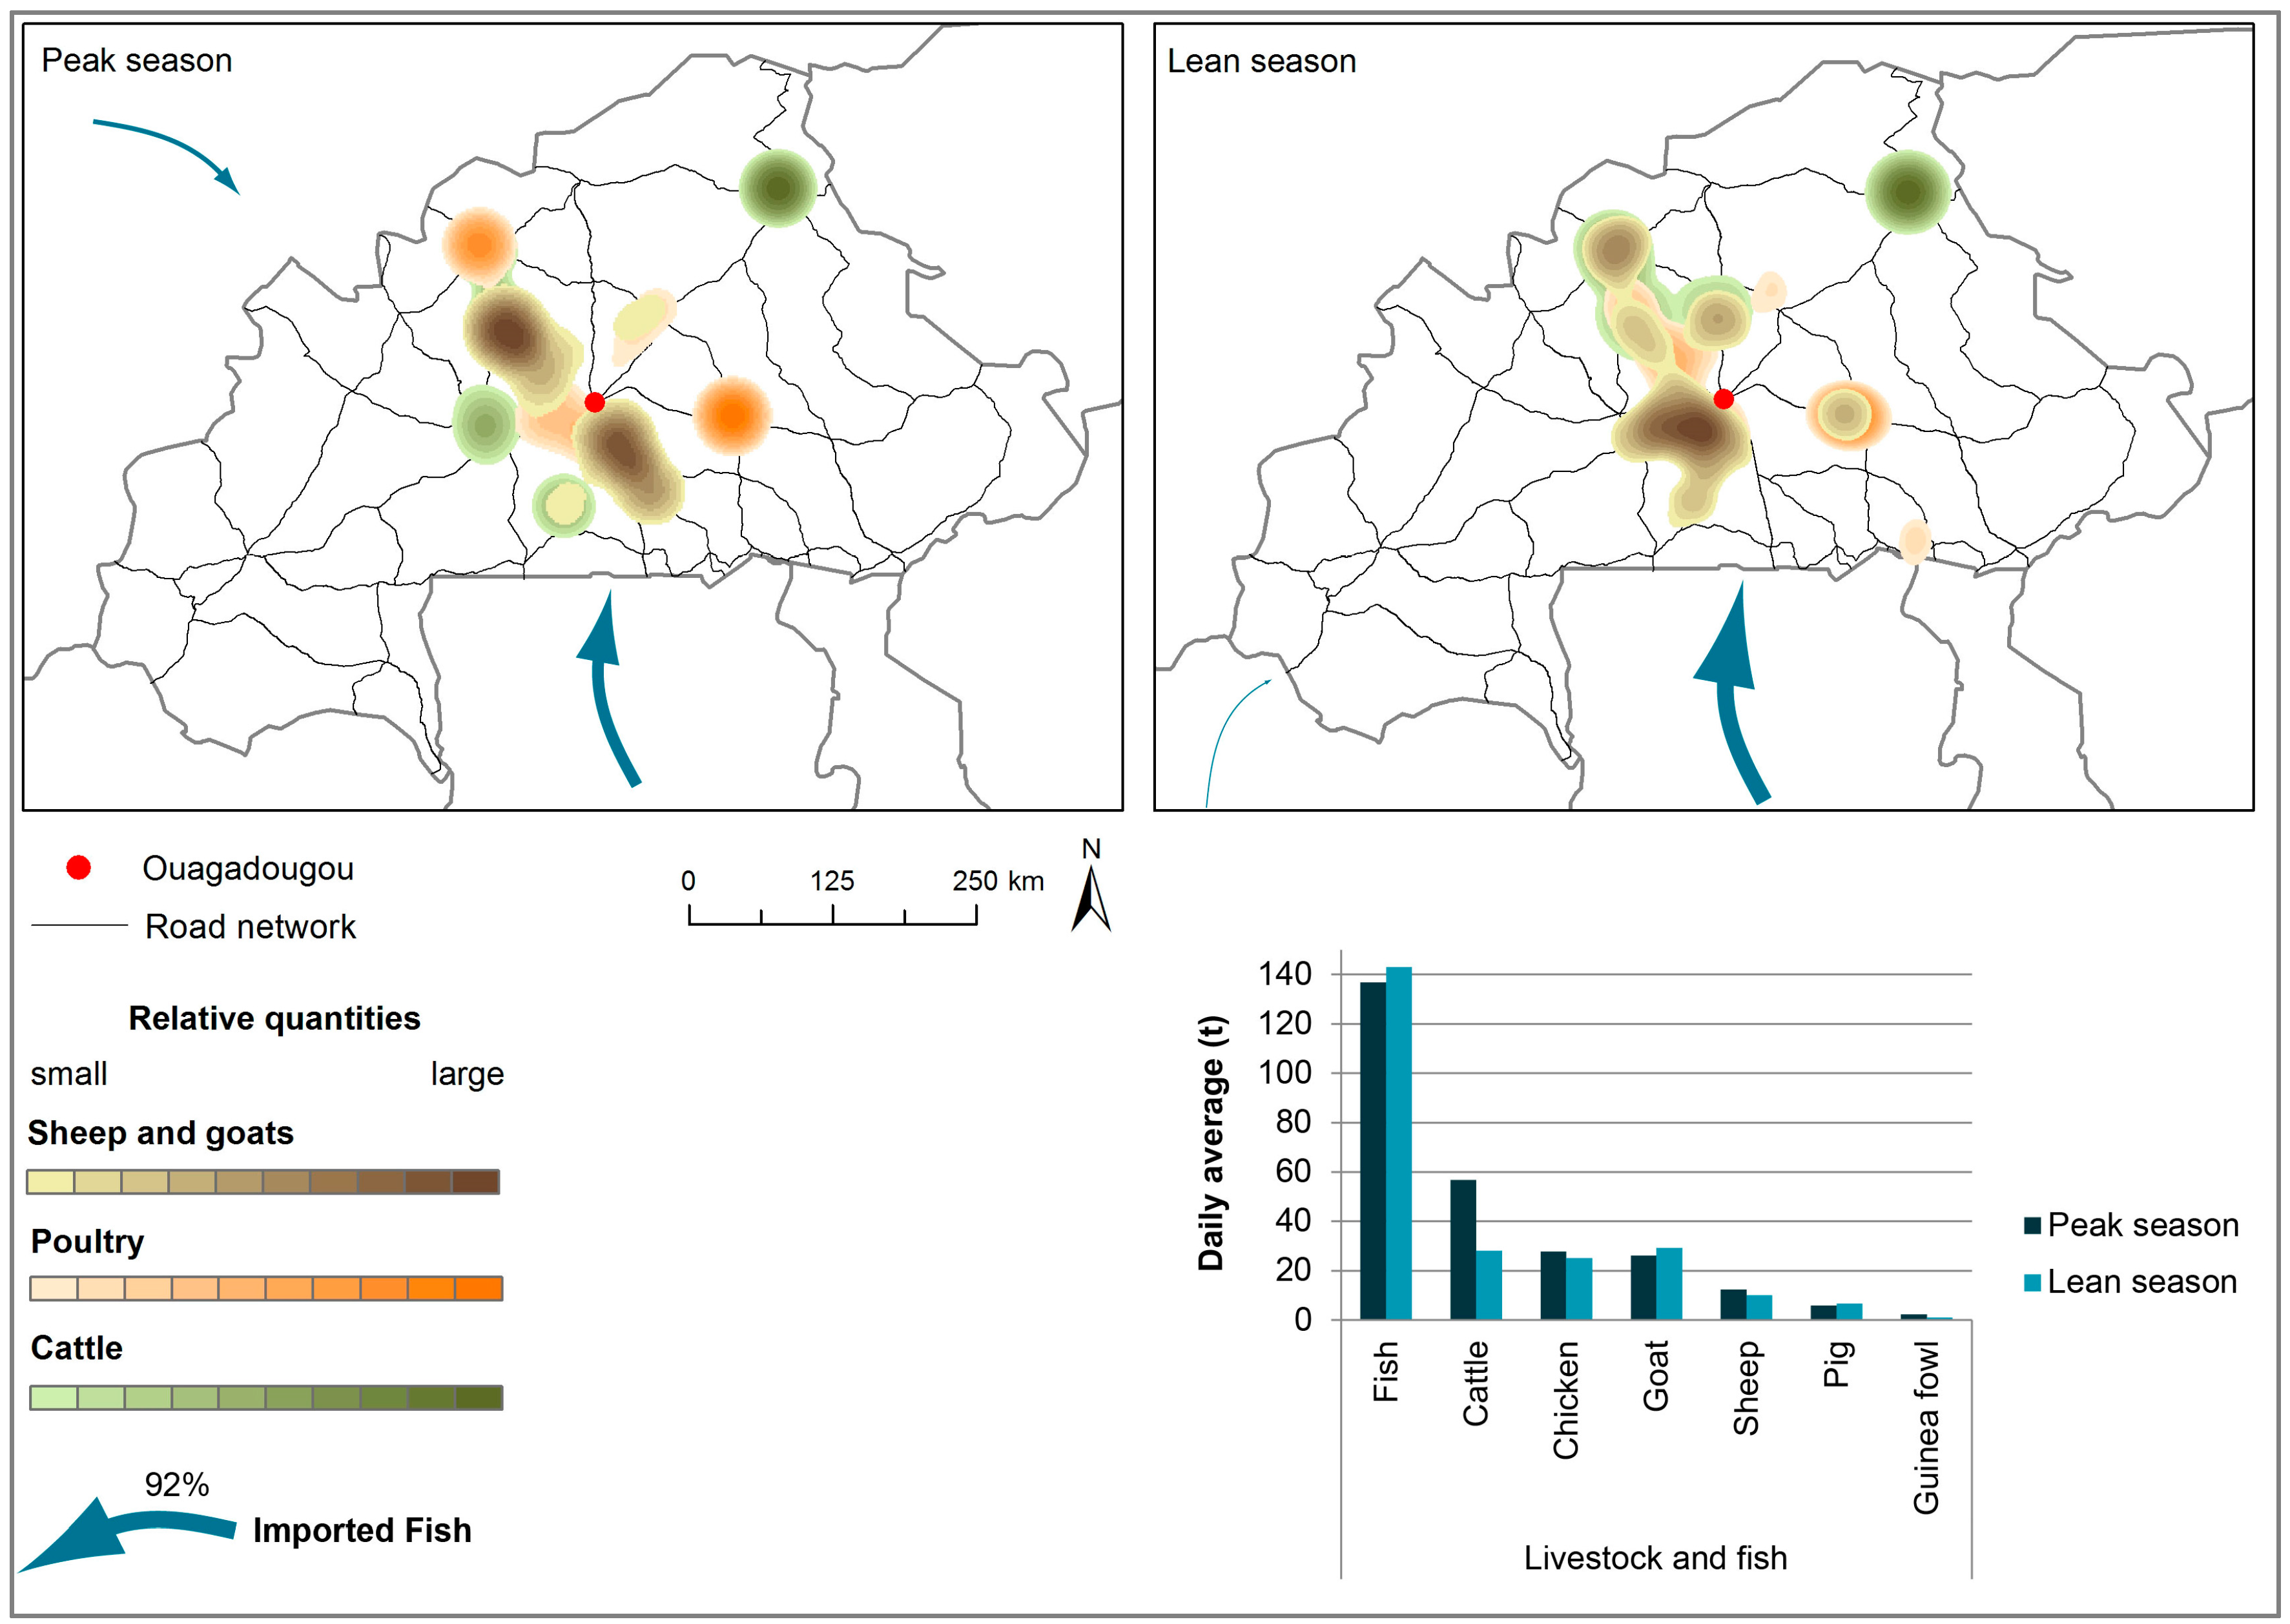
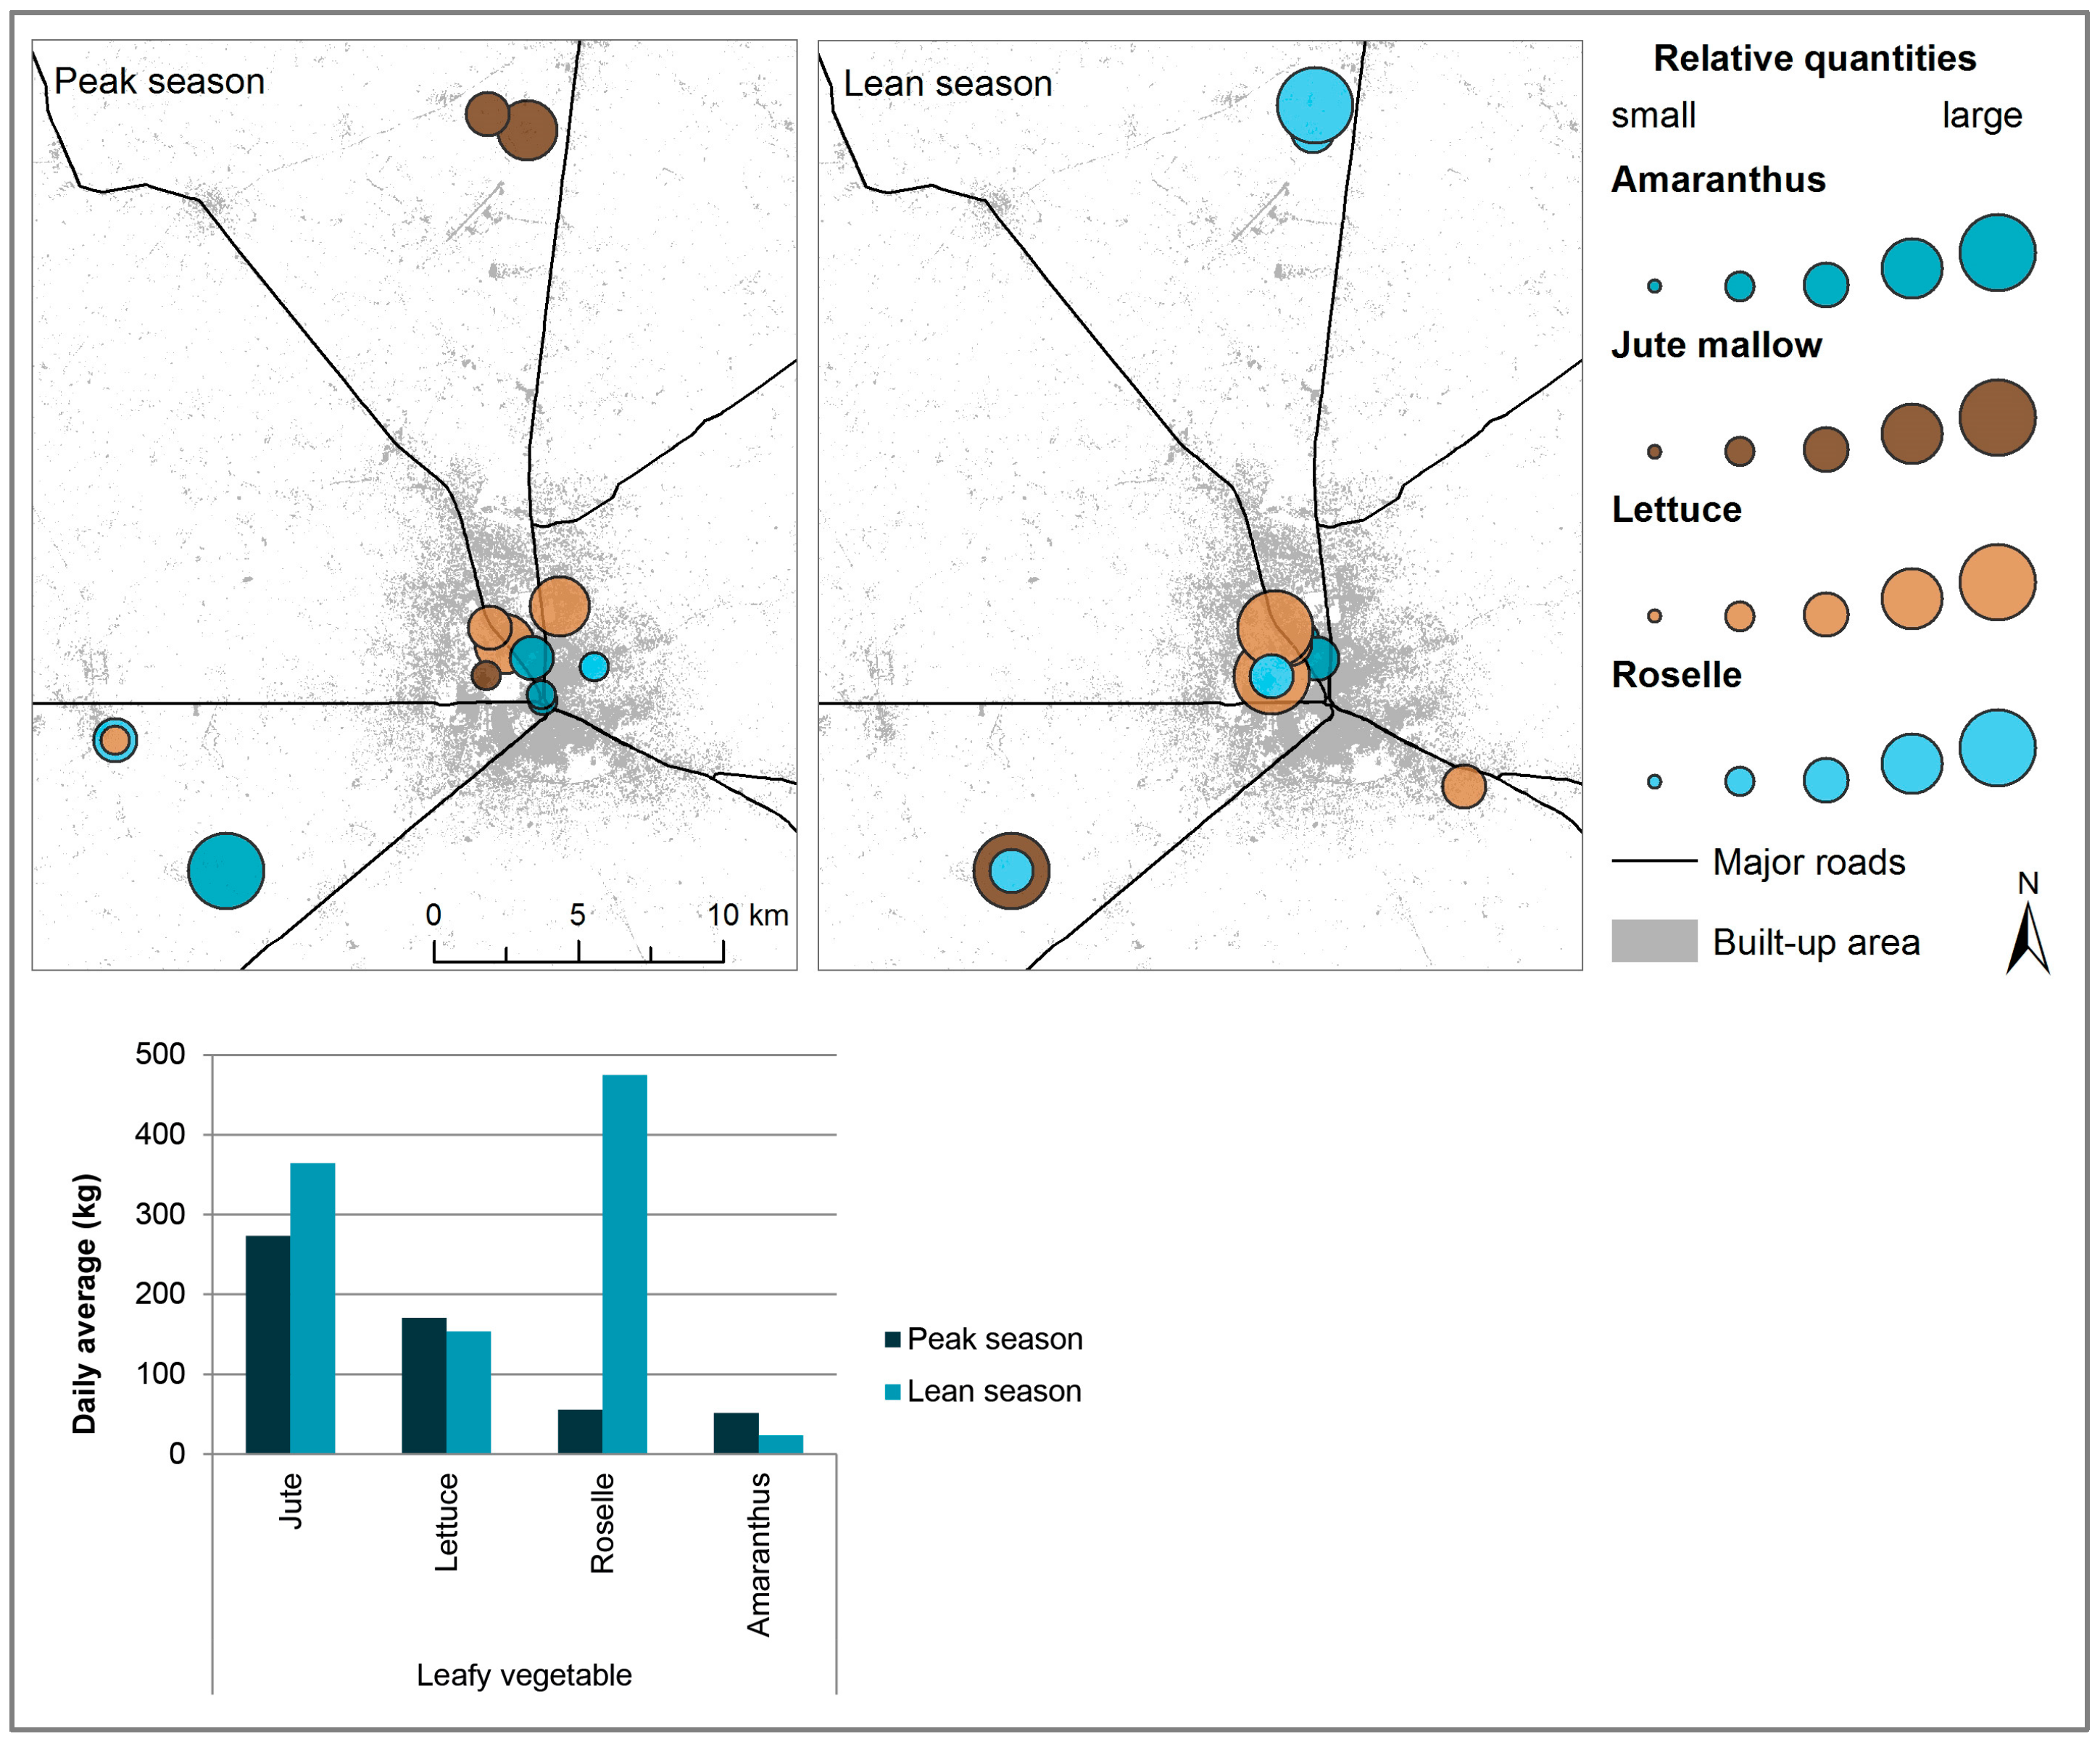
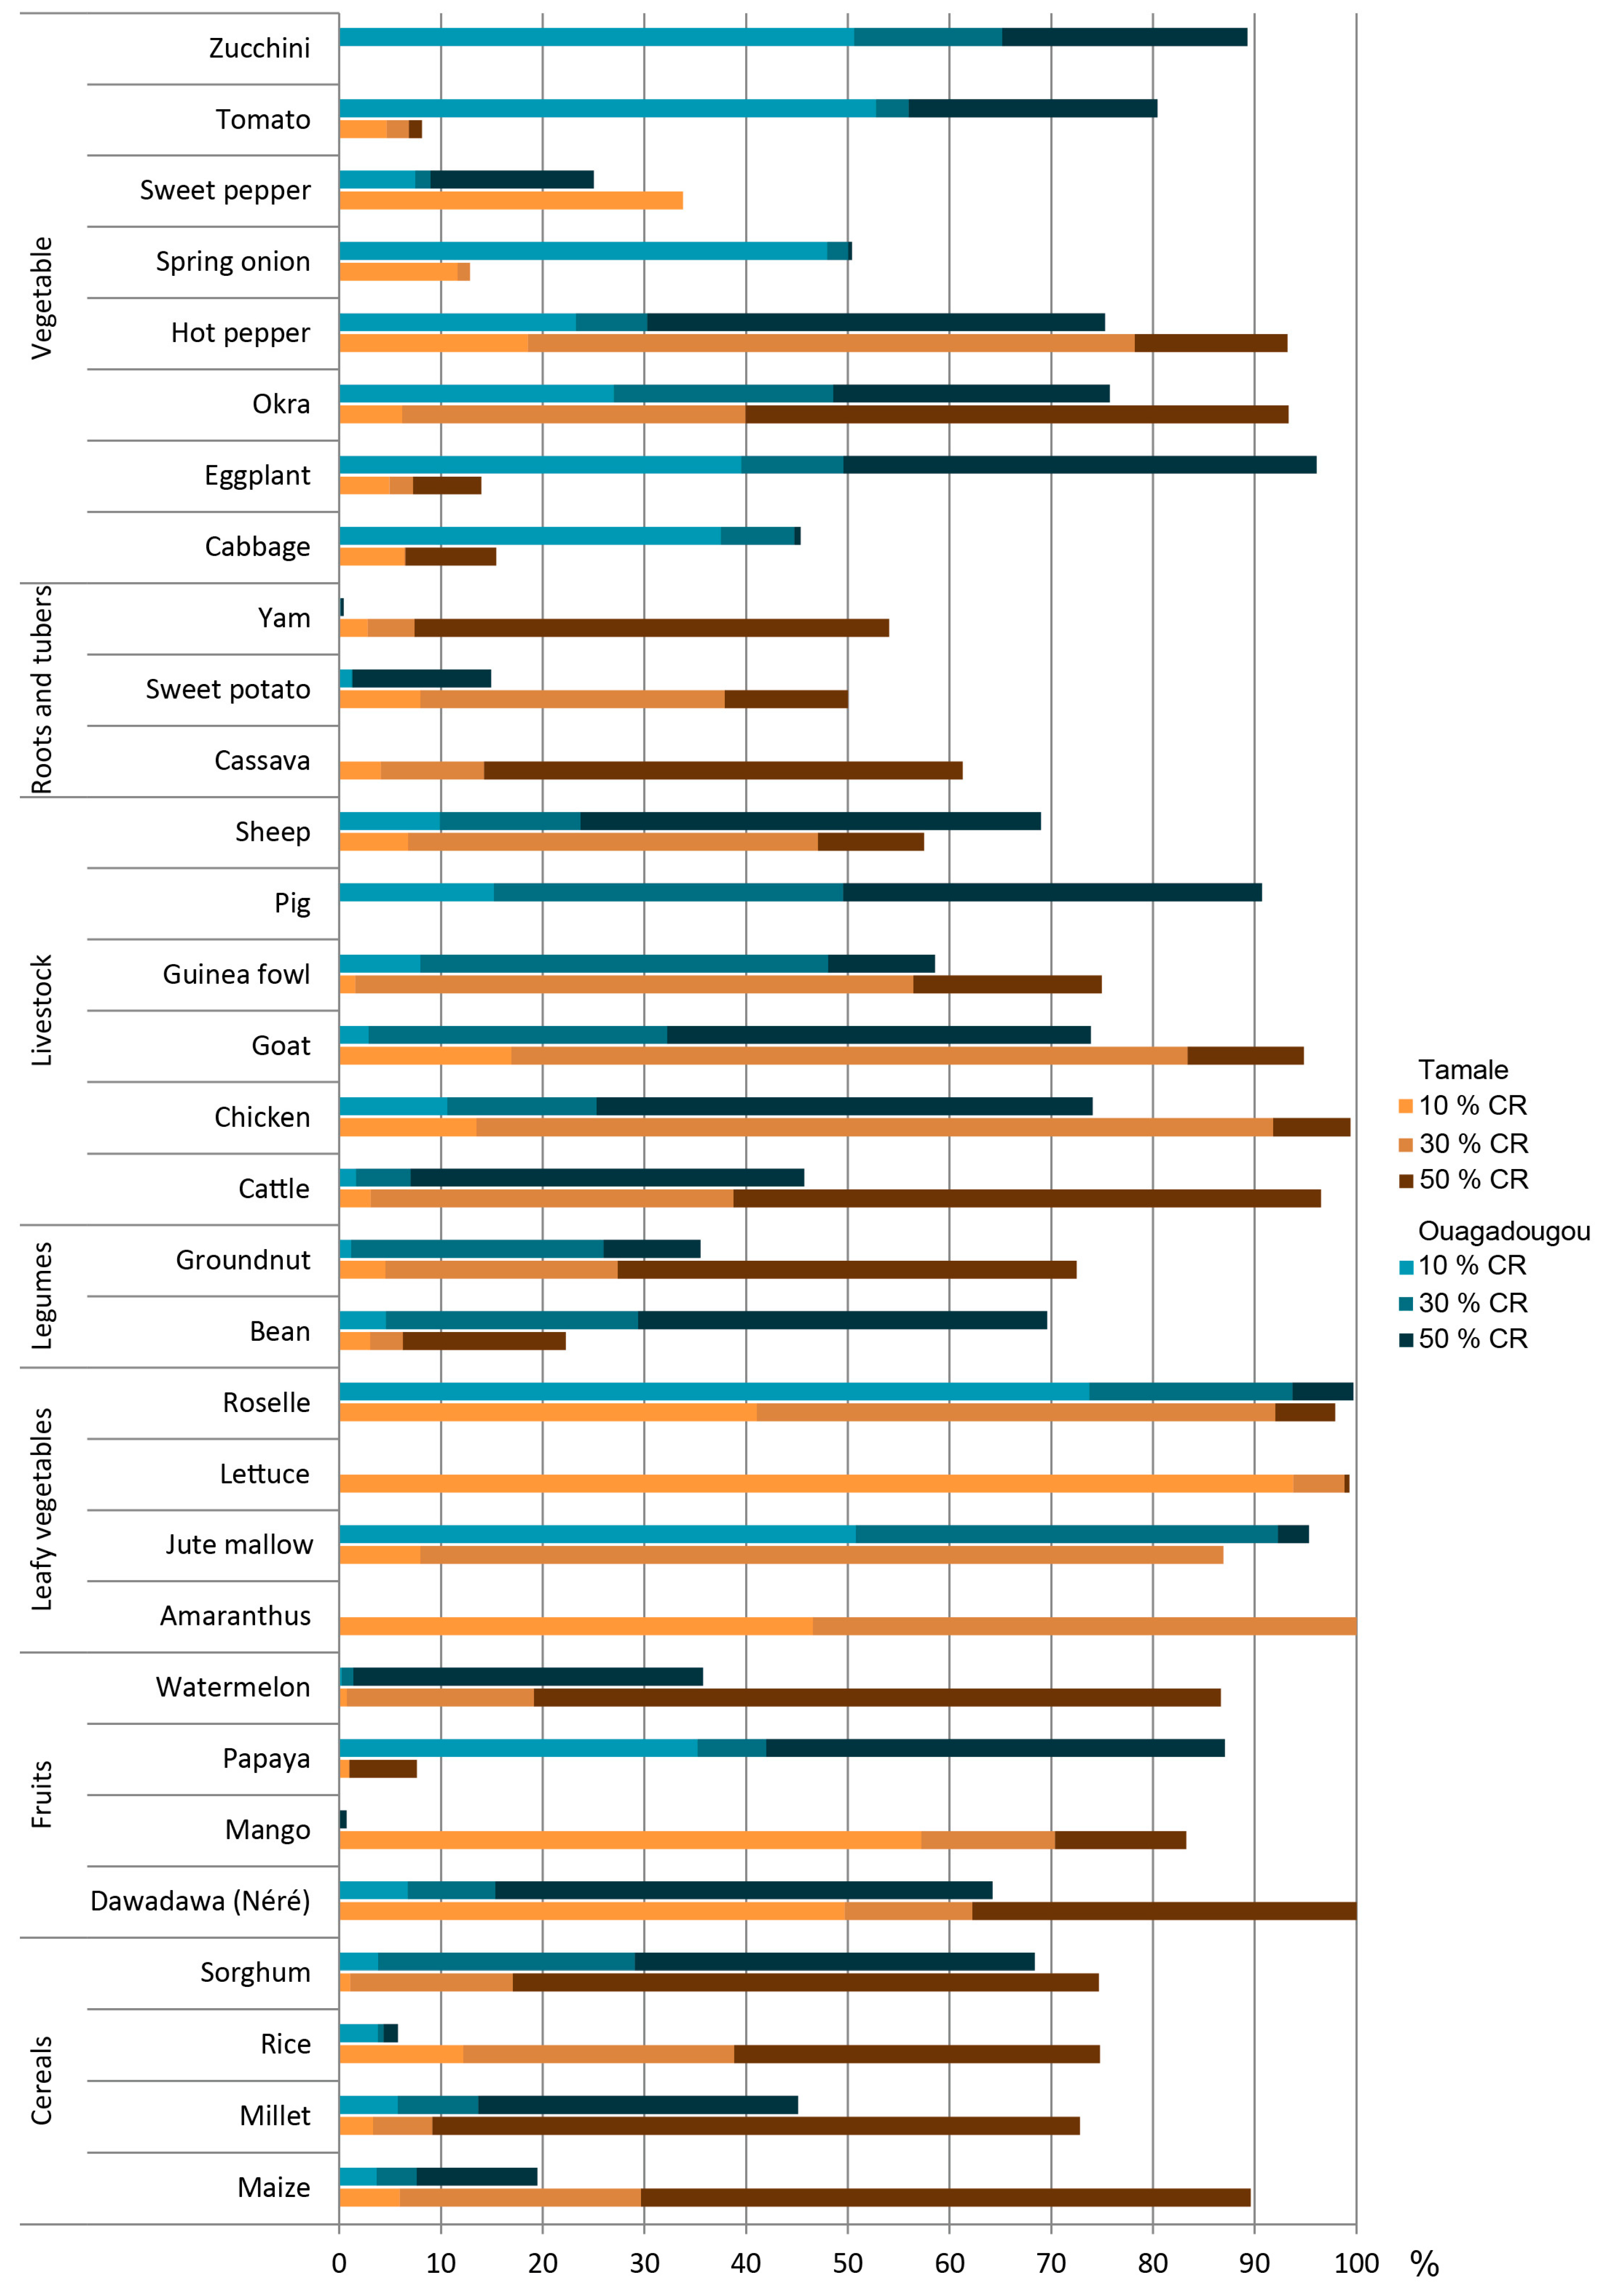
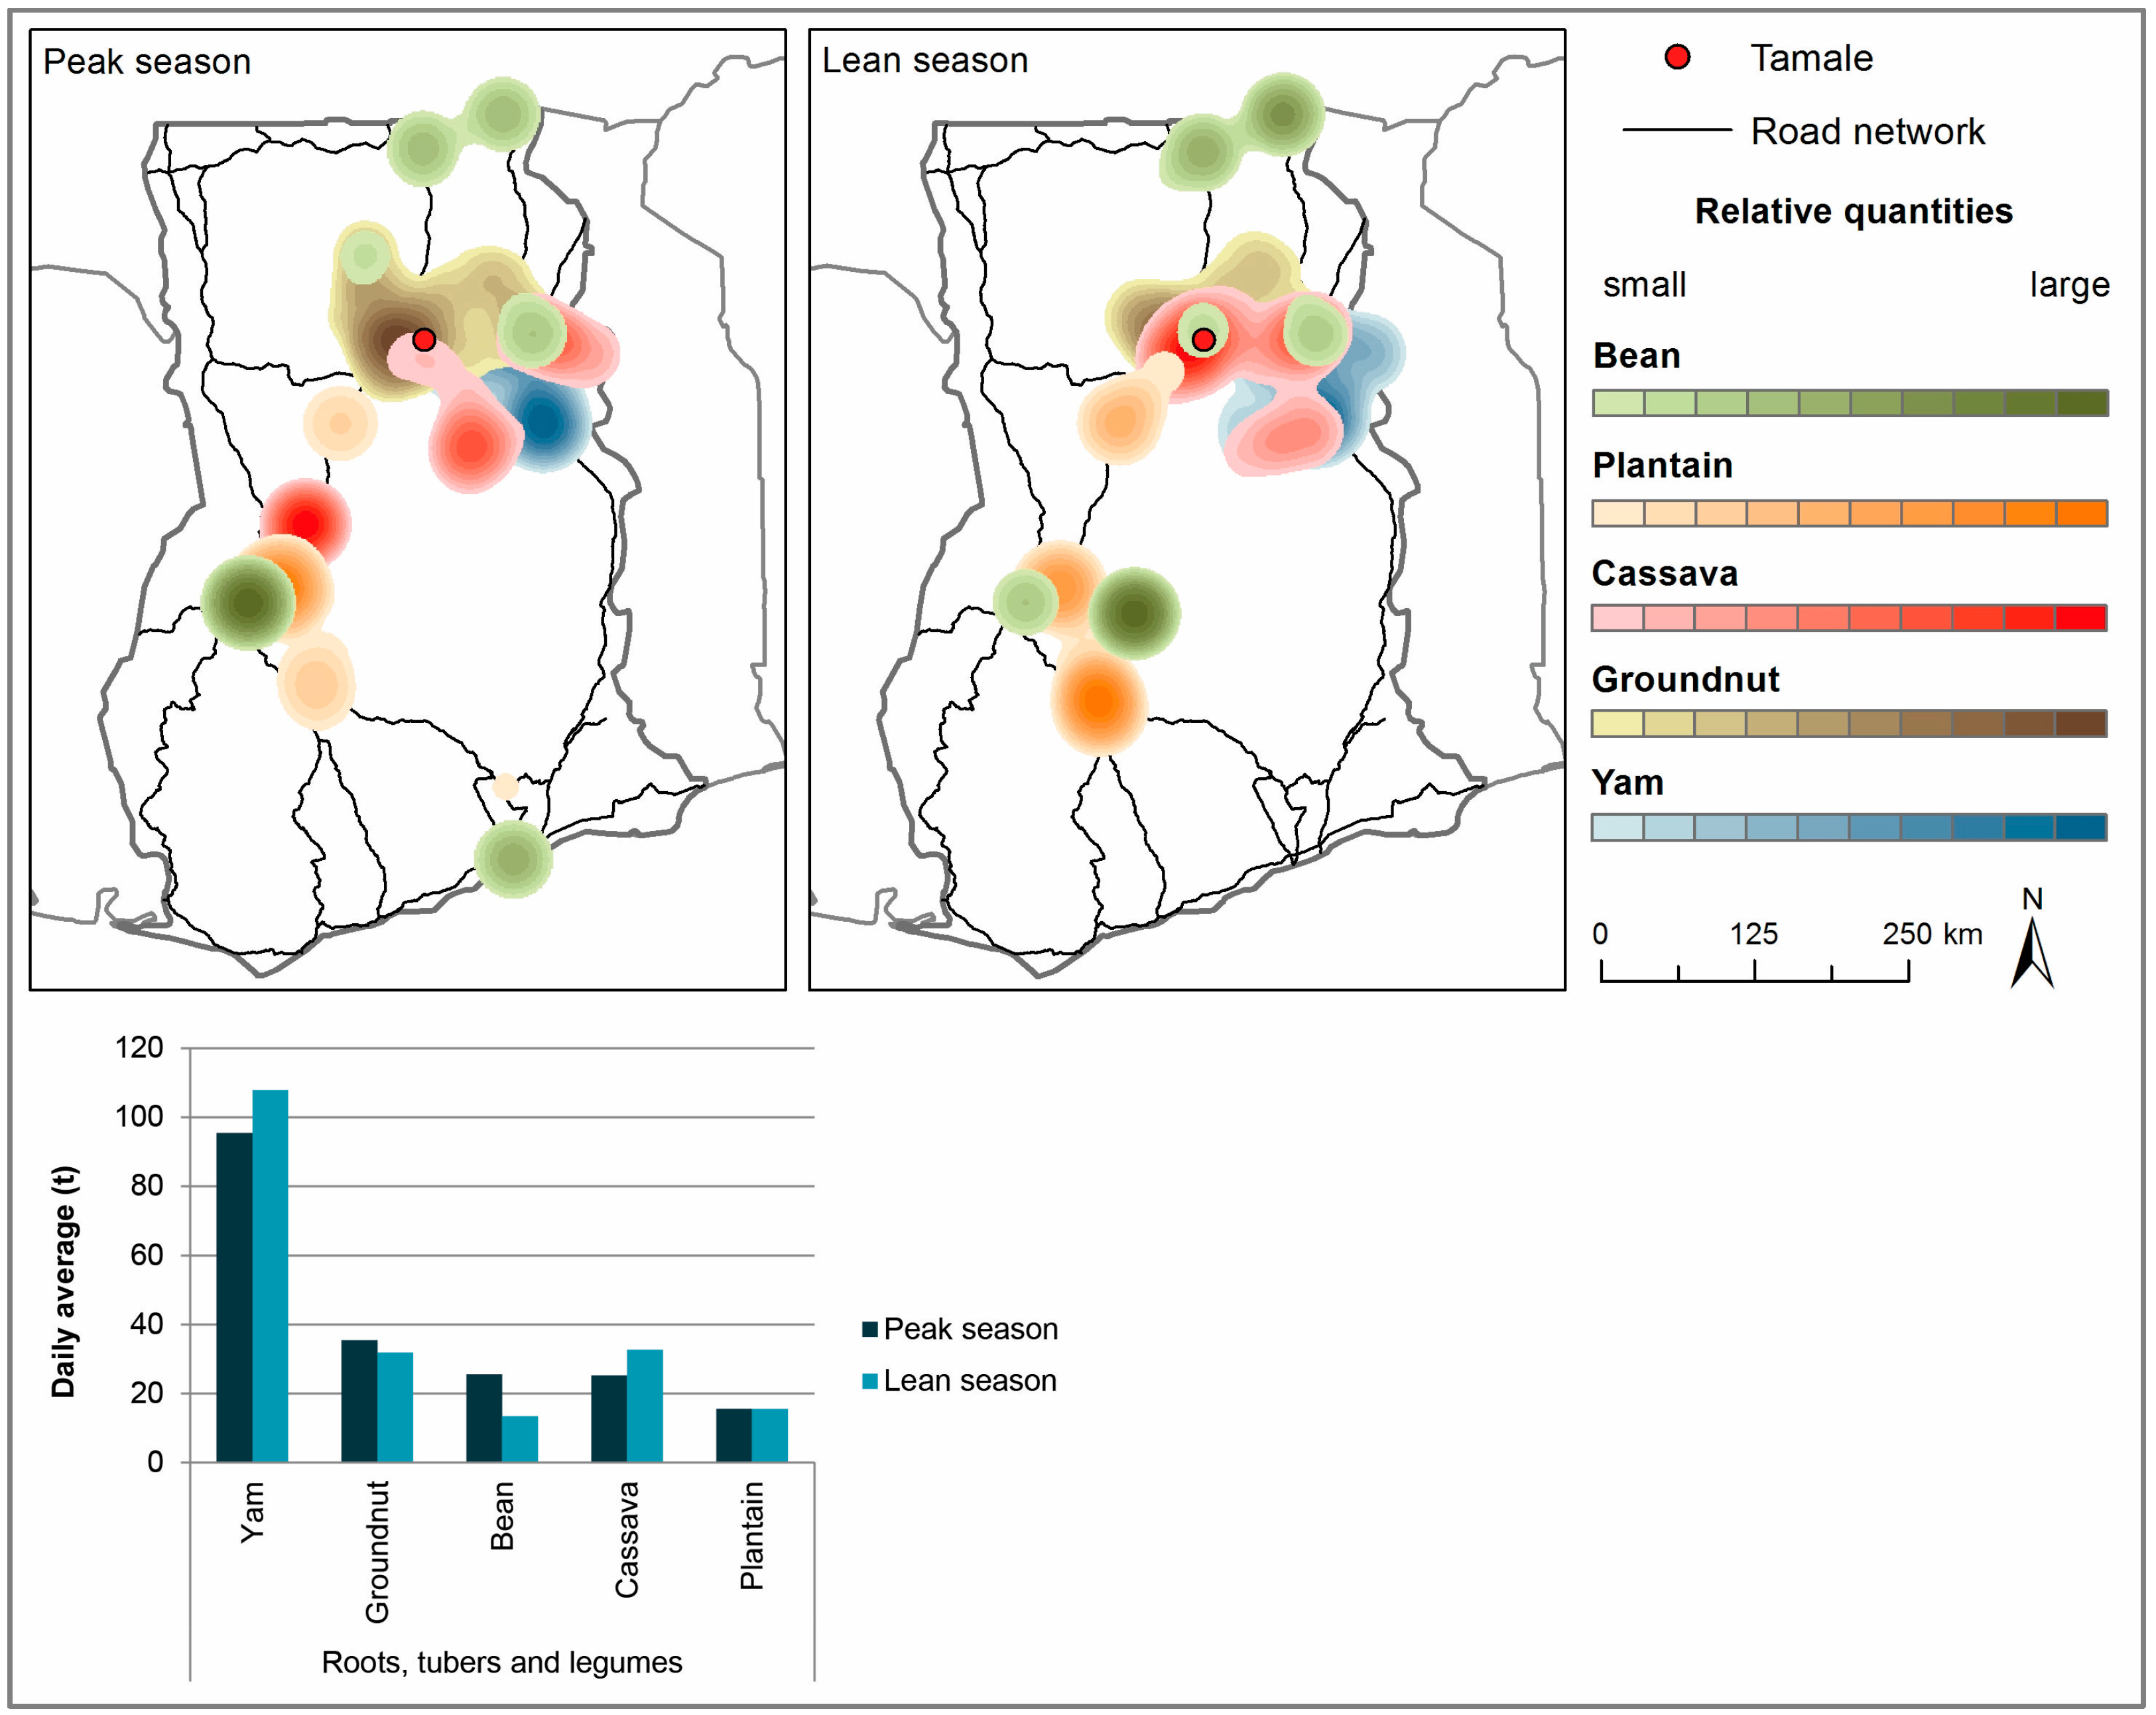
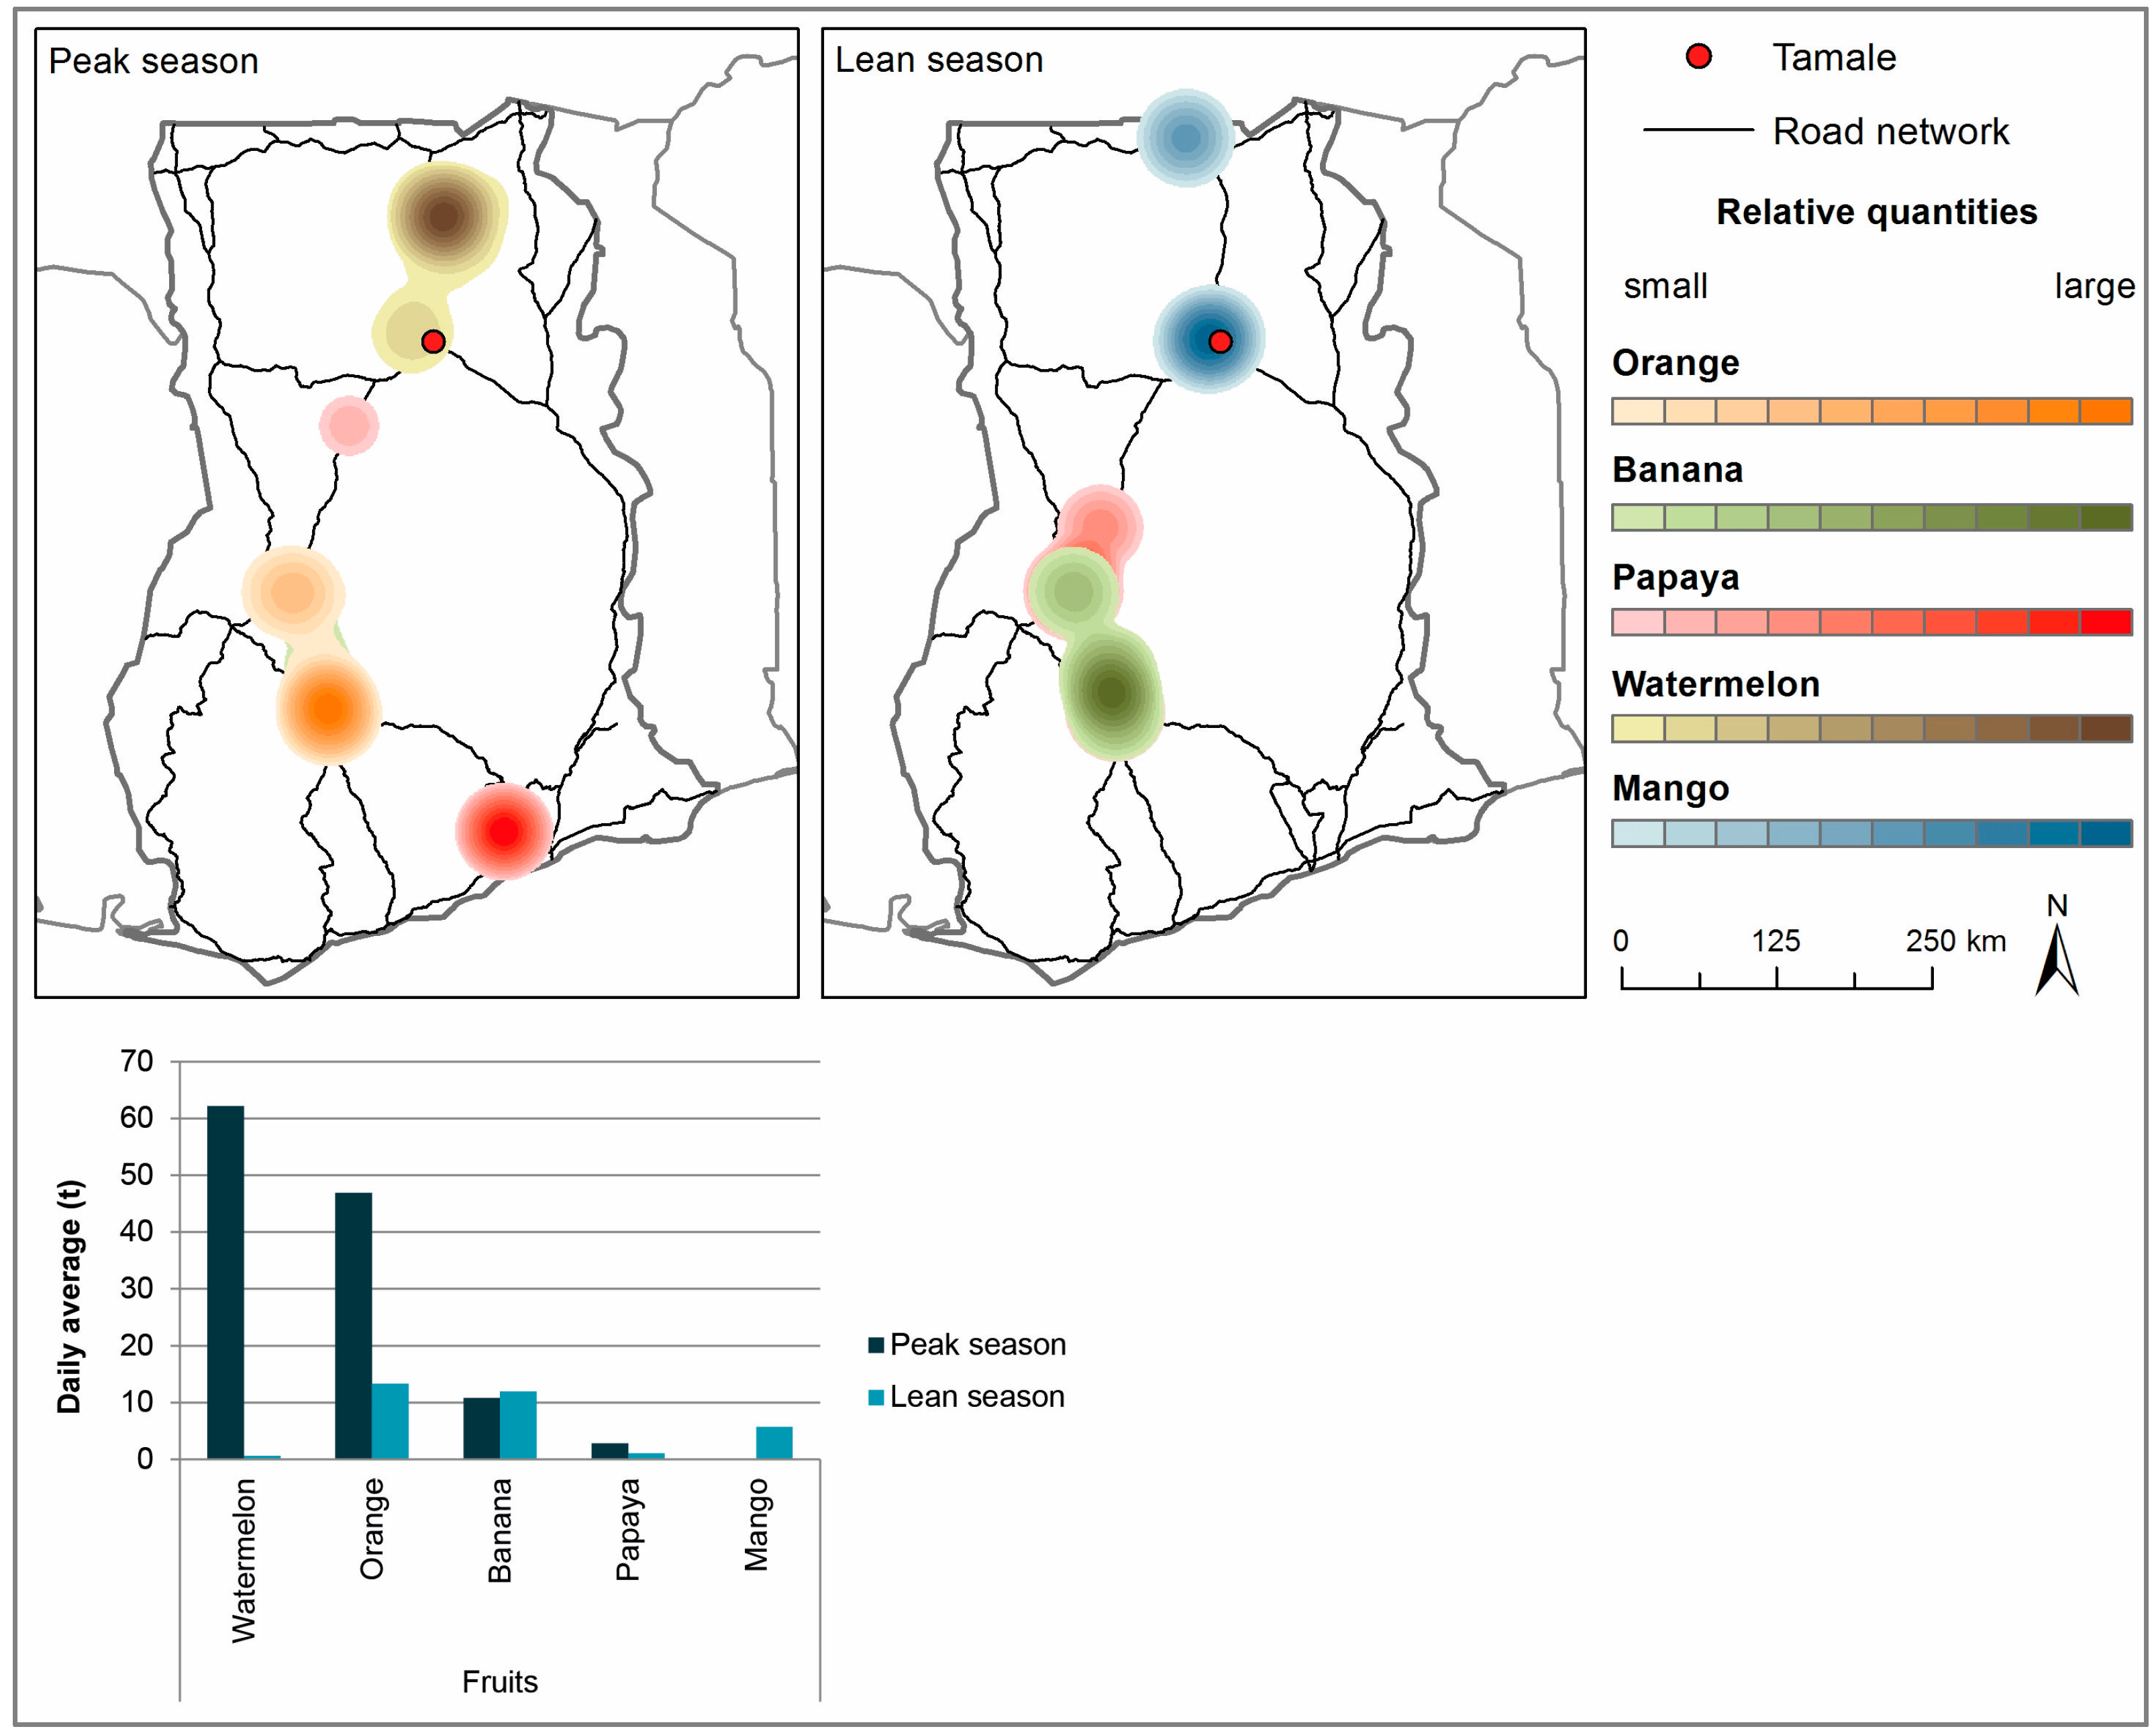
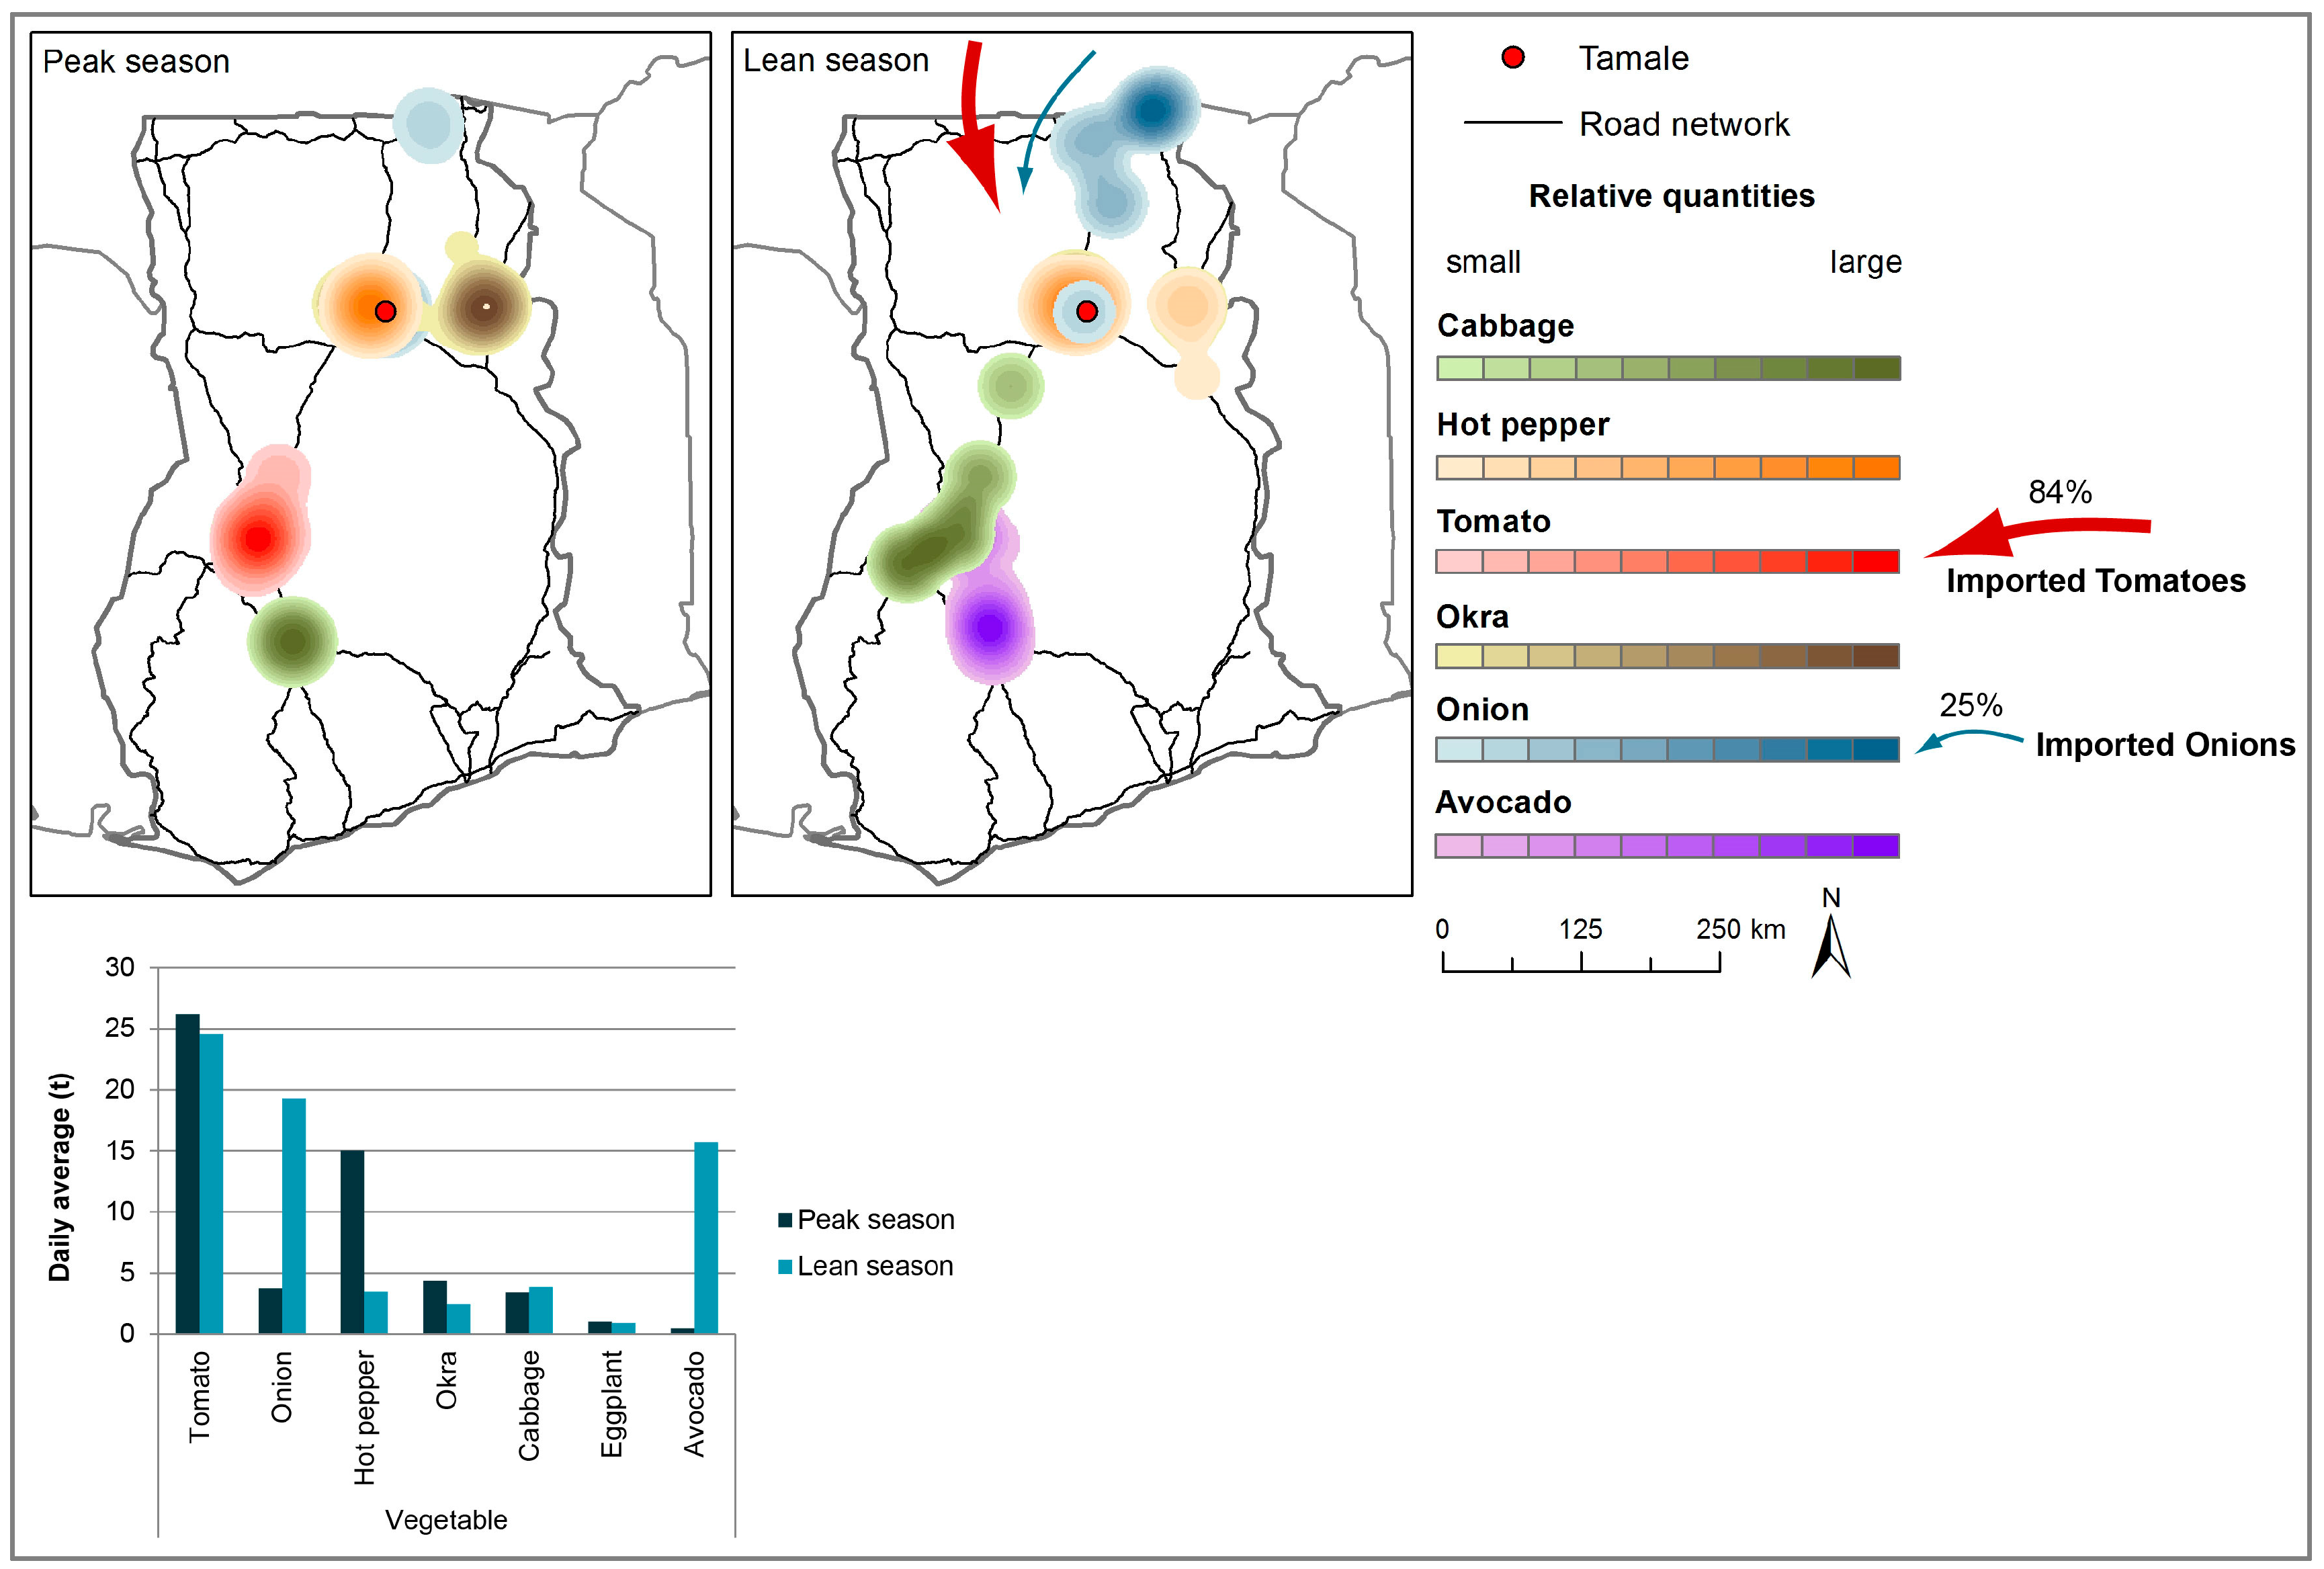
- Based on absolute fresh weight, the most common crops in each food group were selected for each city [40] (Figure 14 and Figure 15; Appendix Table A1).
- (3)
7. Limitations
8. Results and Discussion
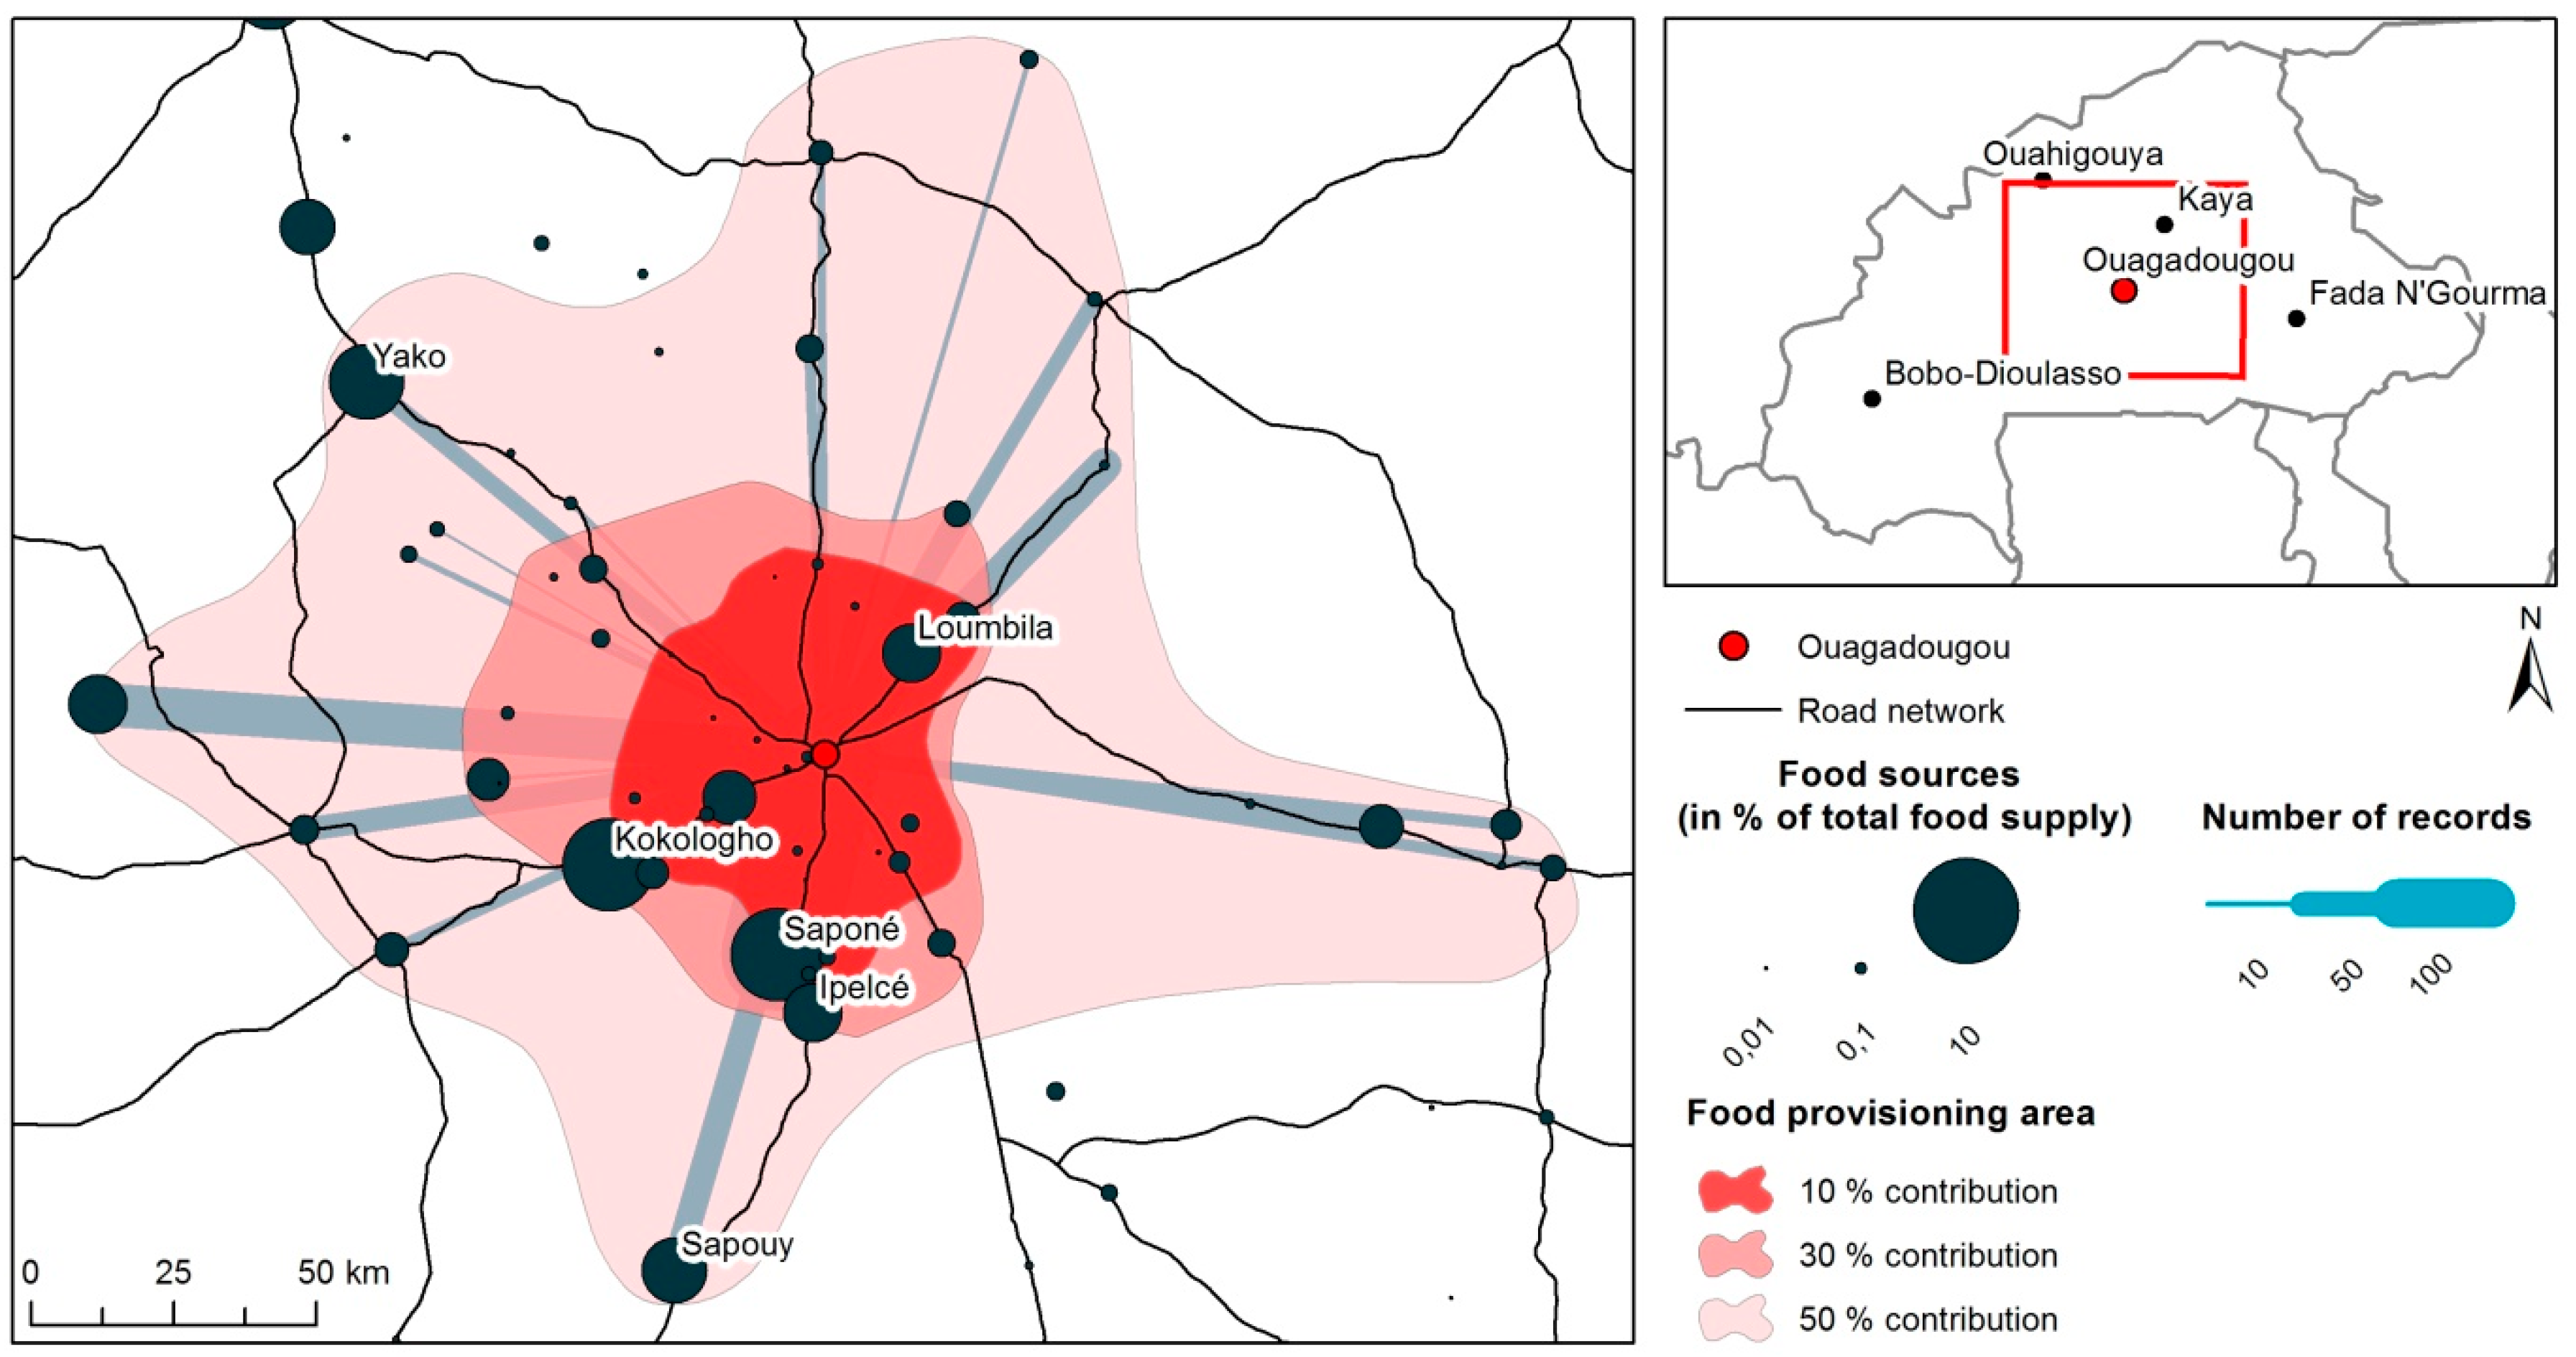
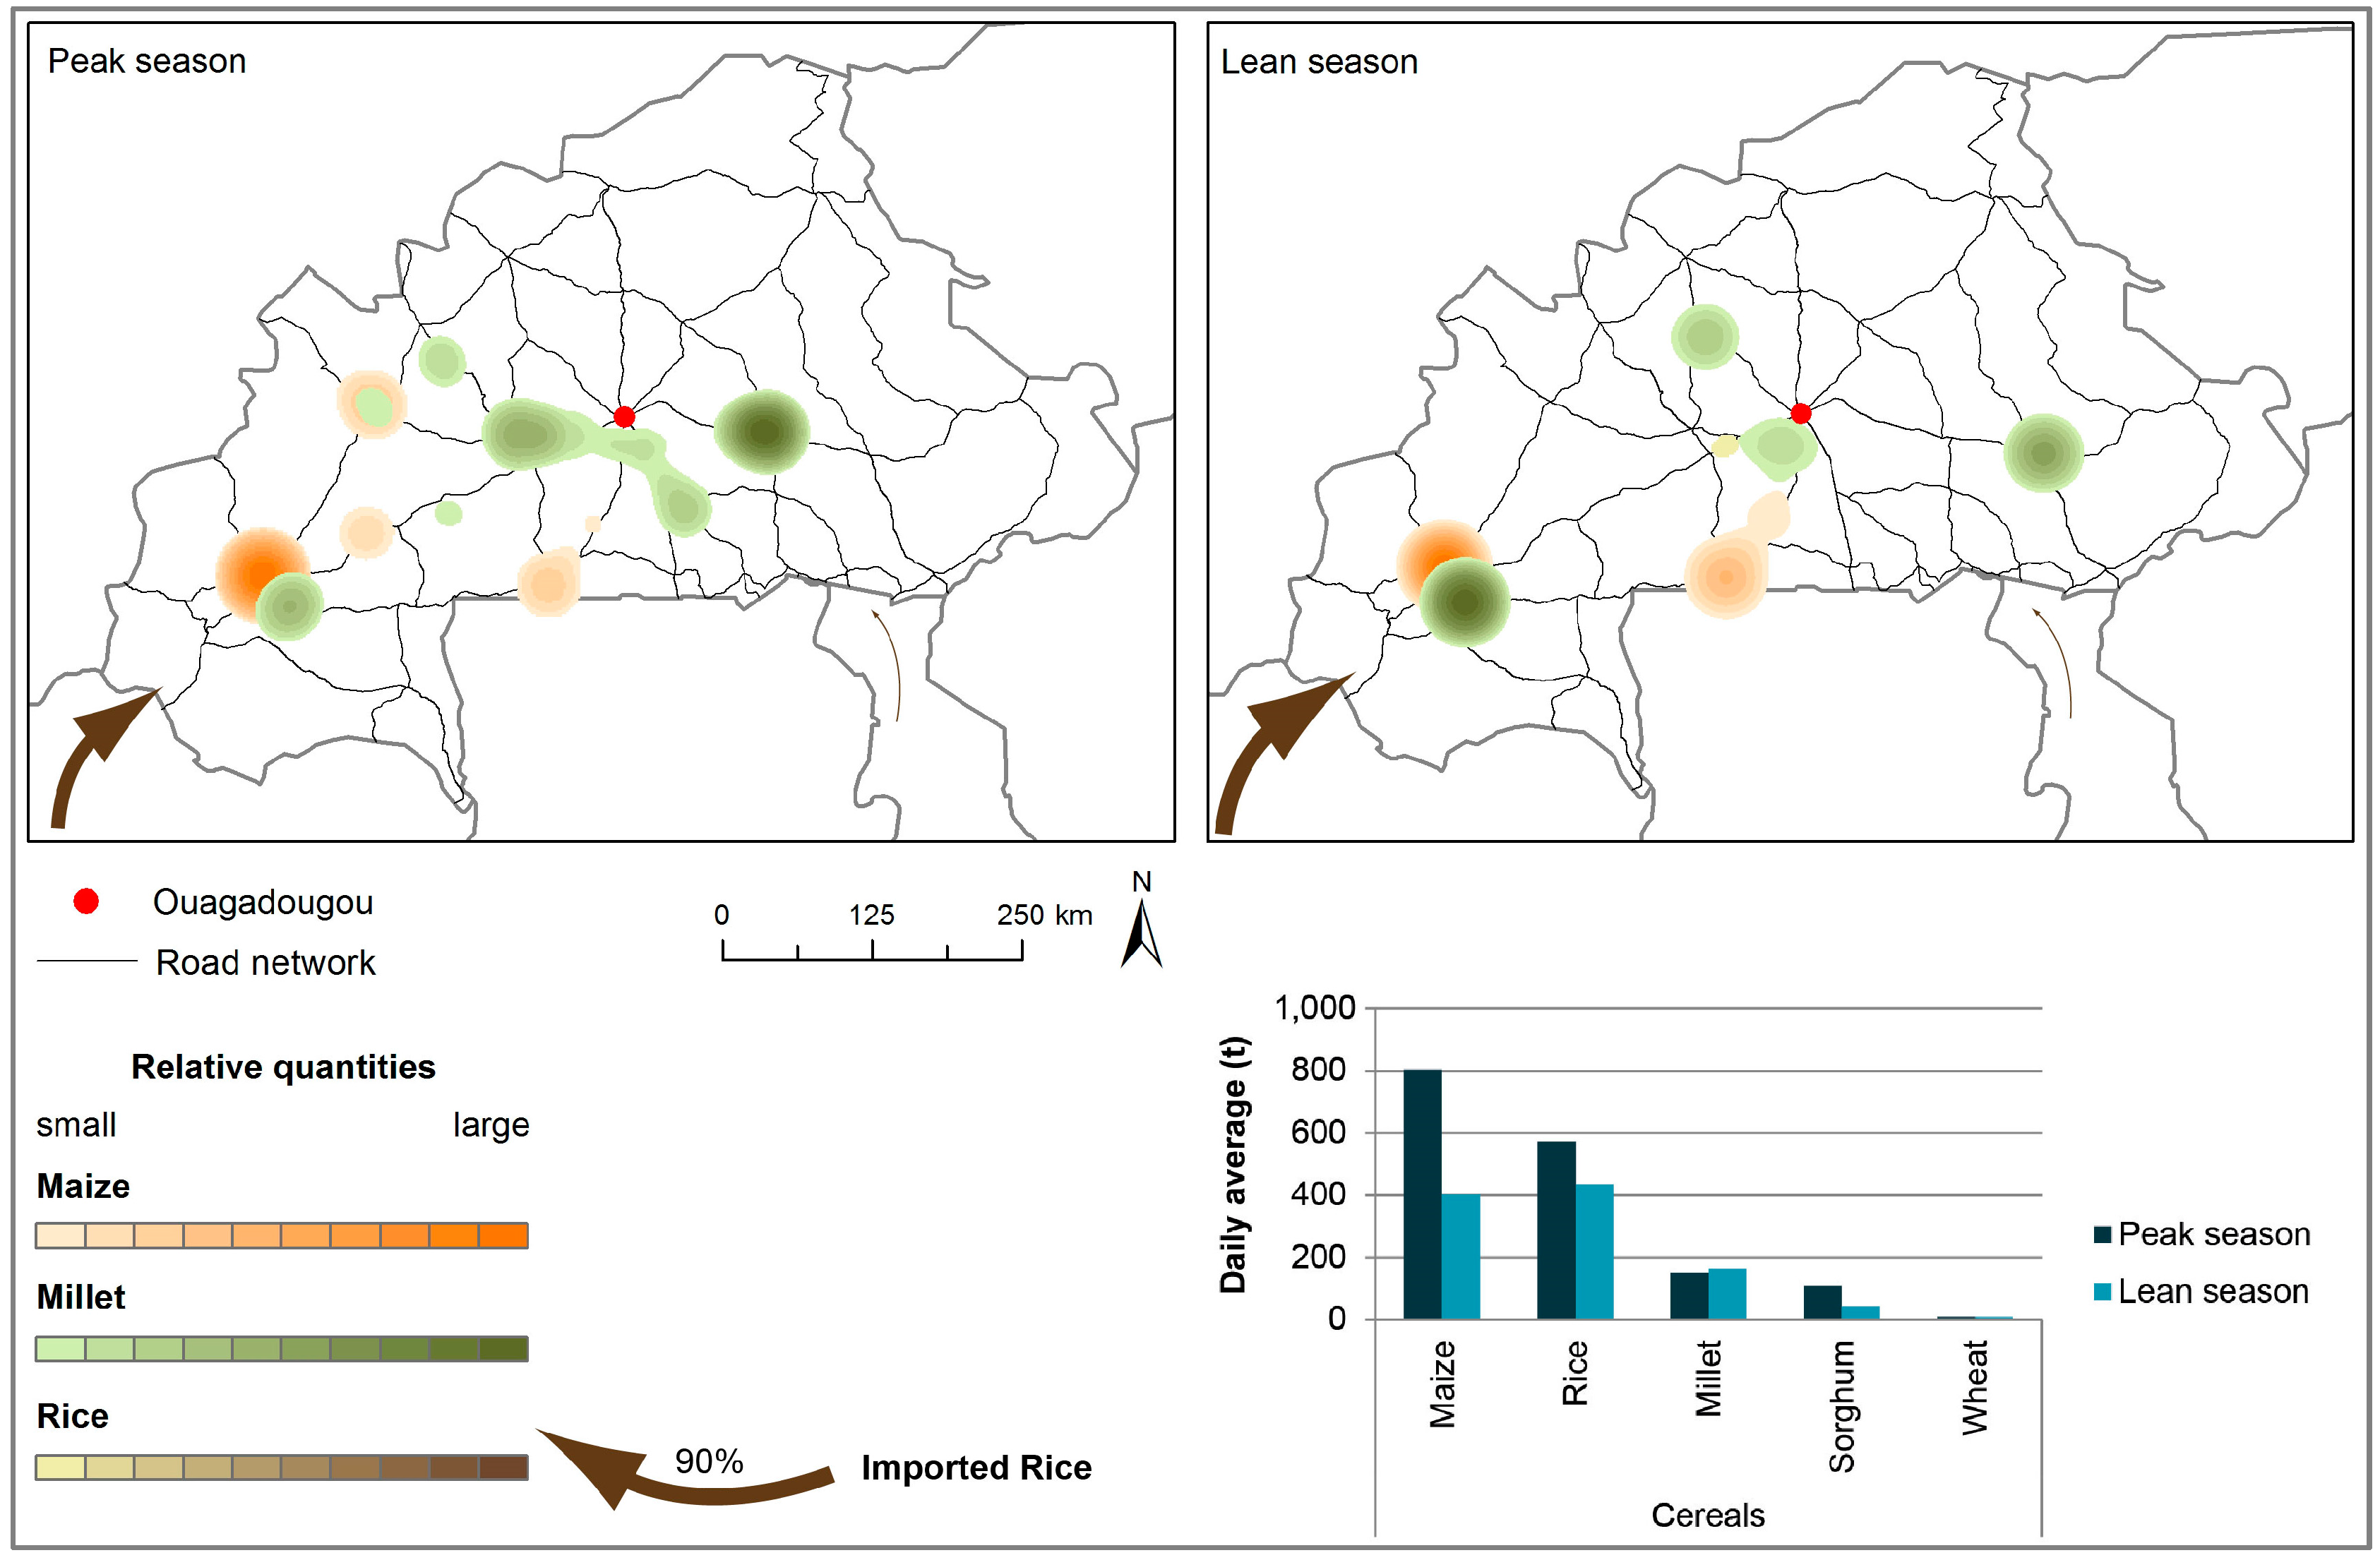
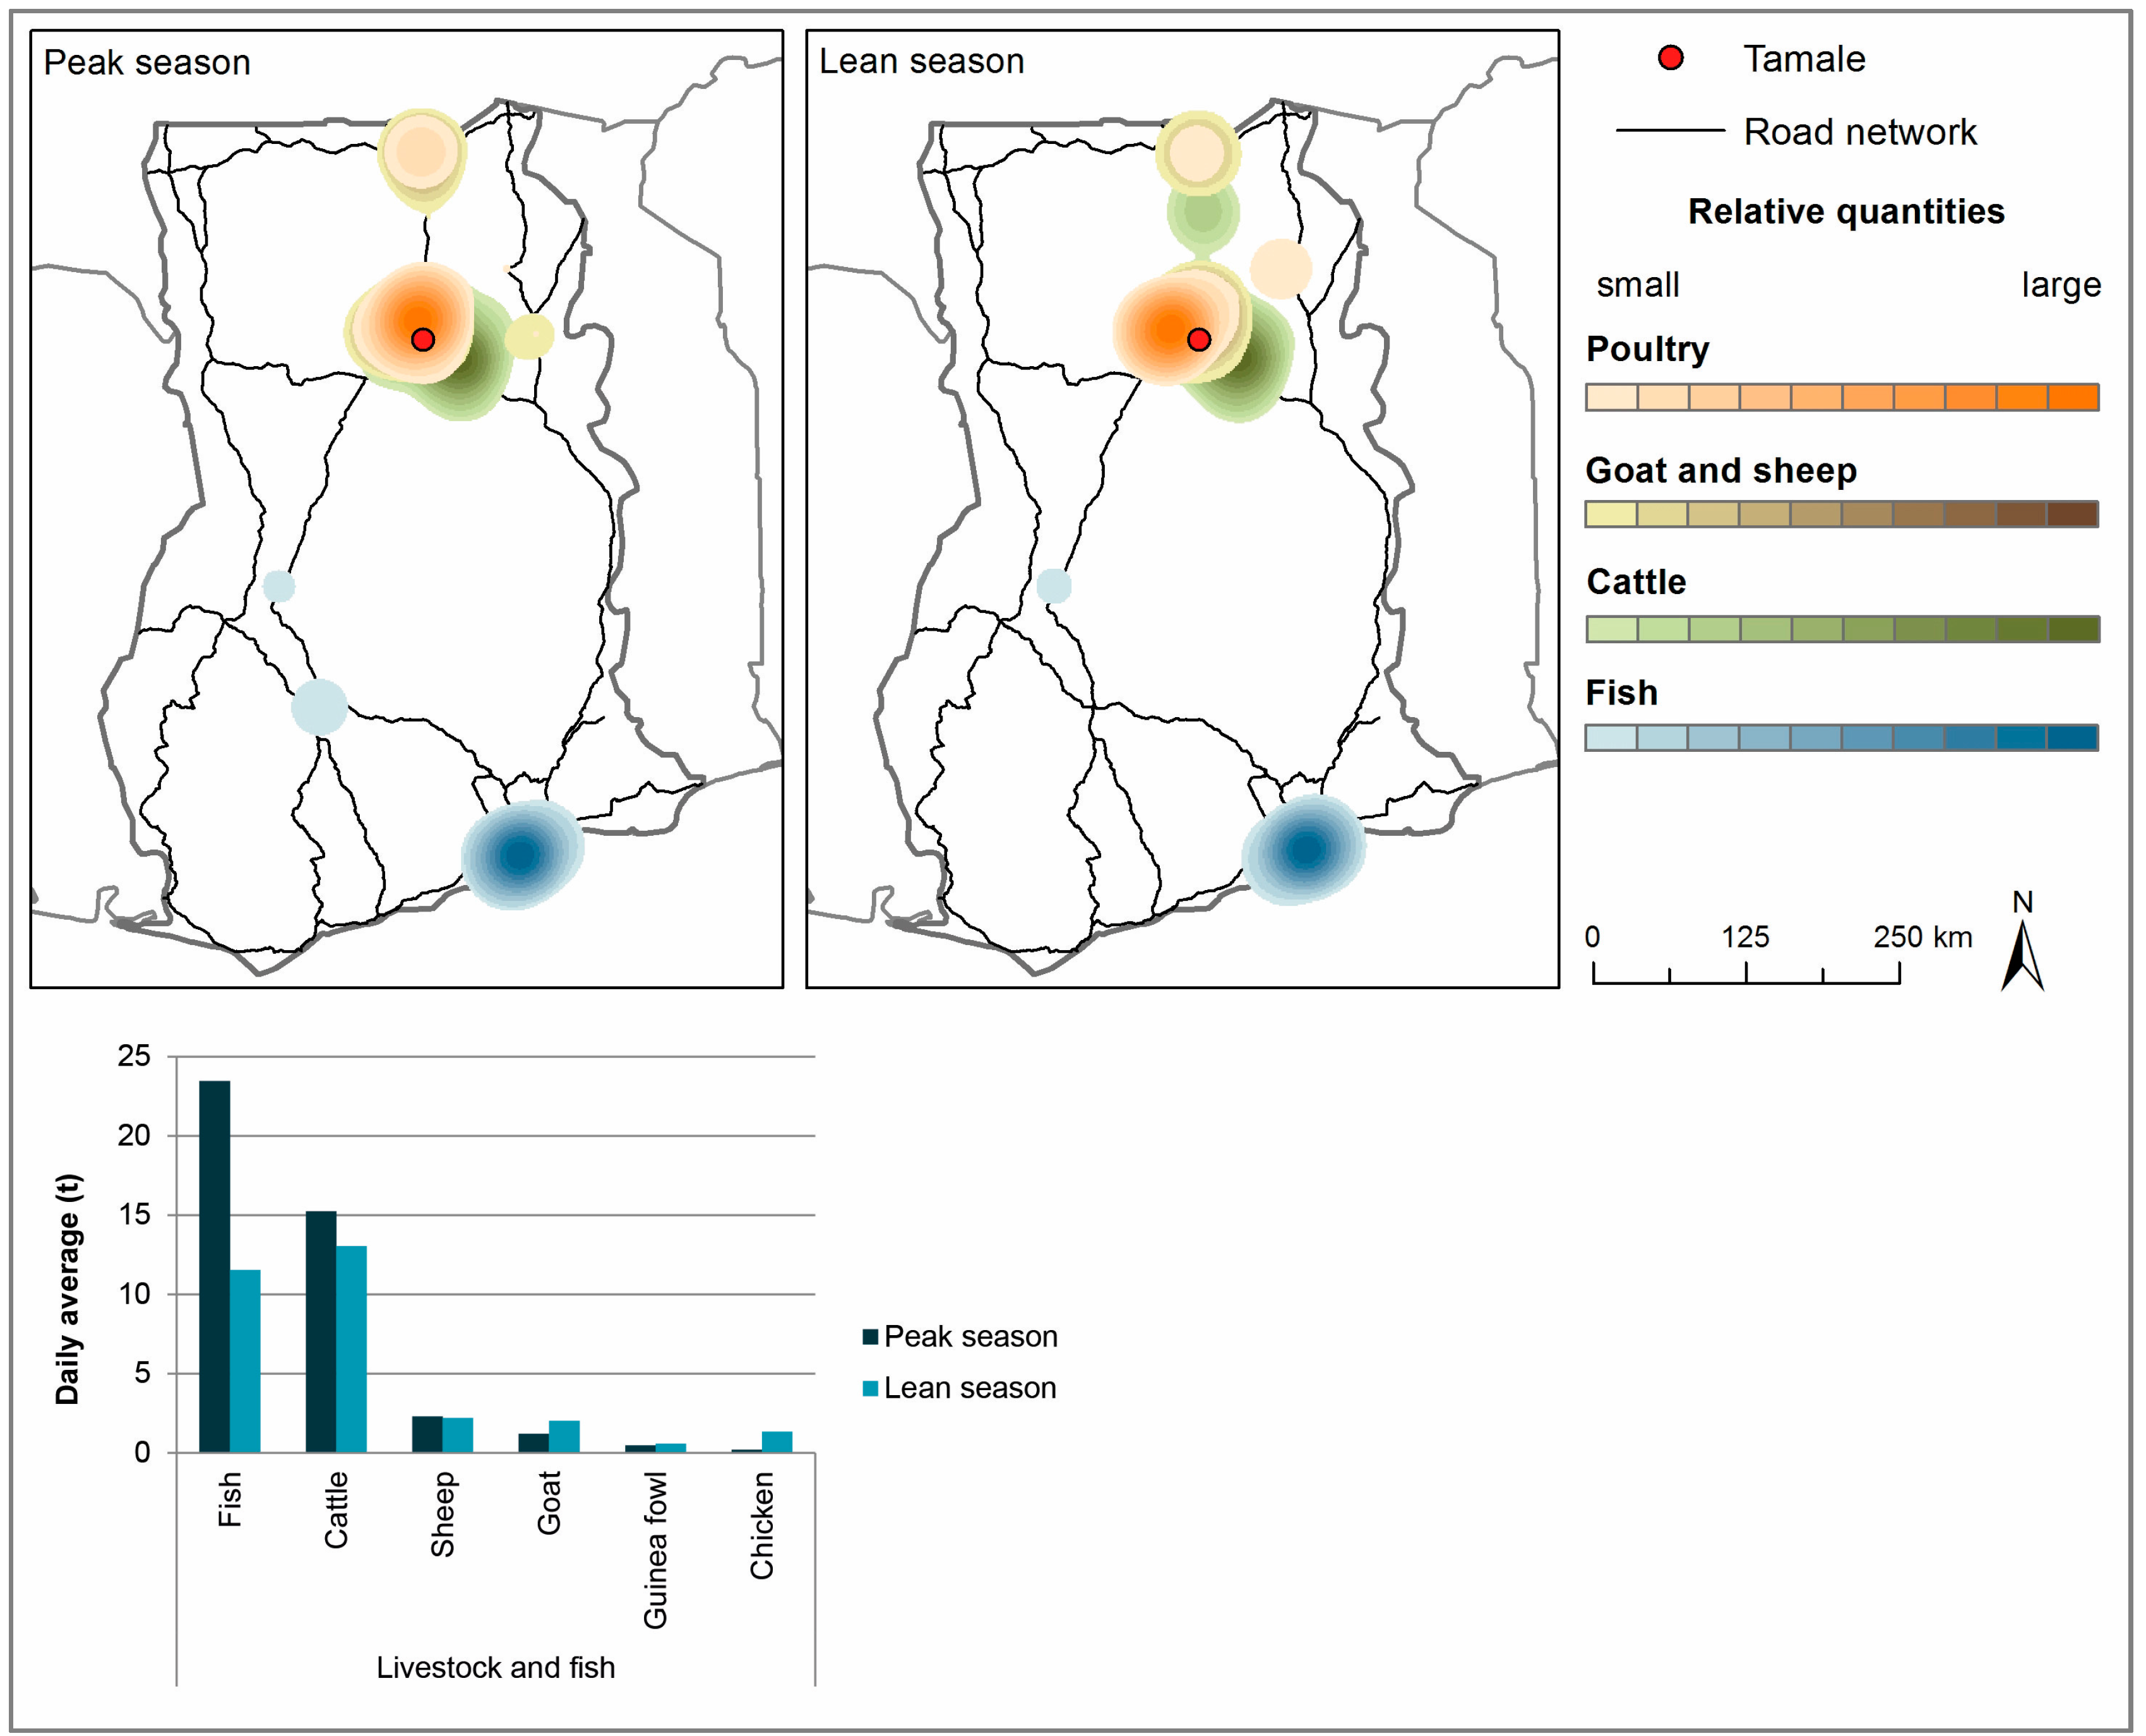
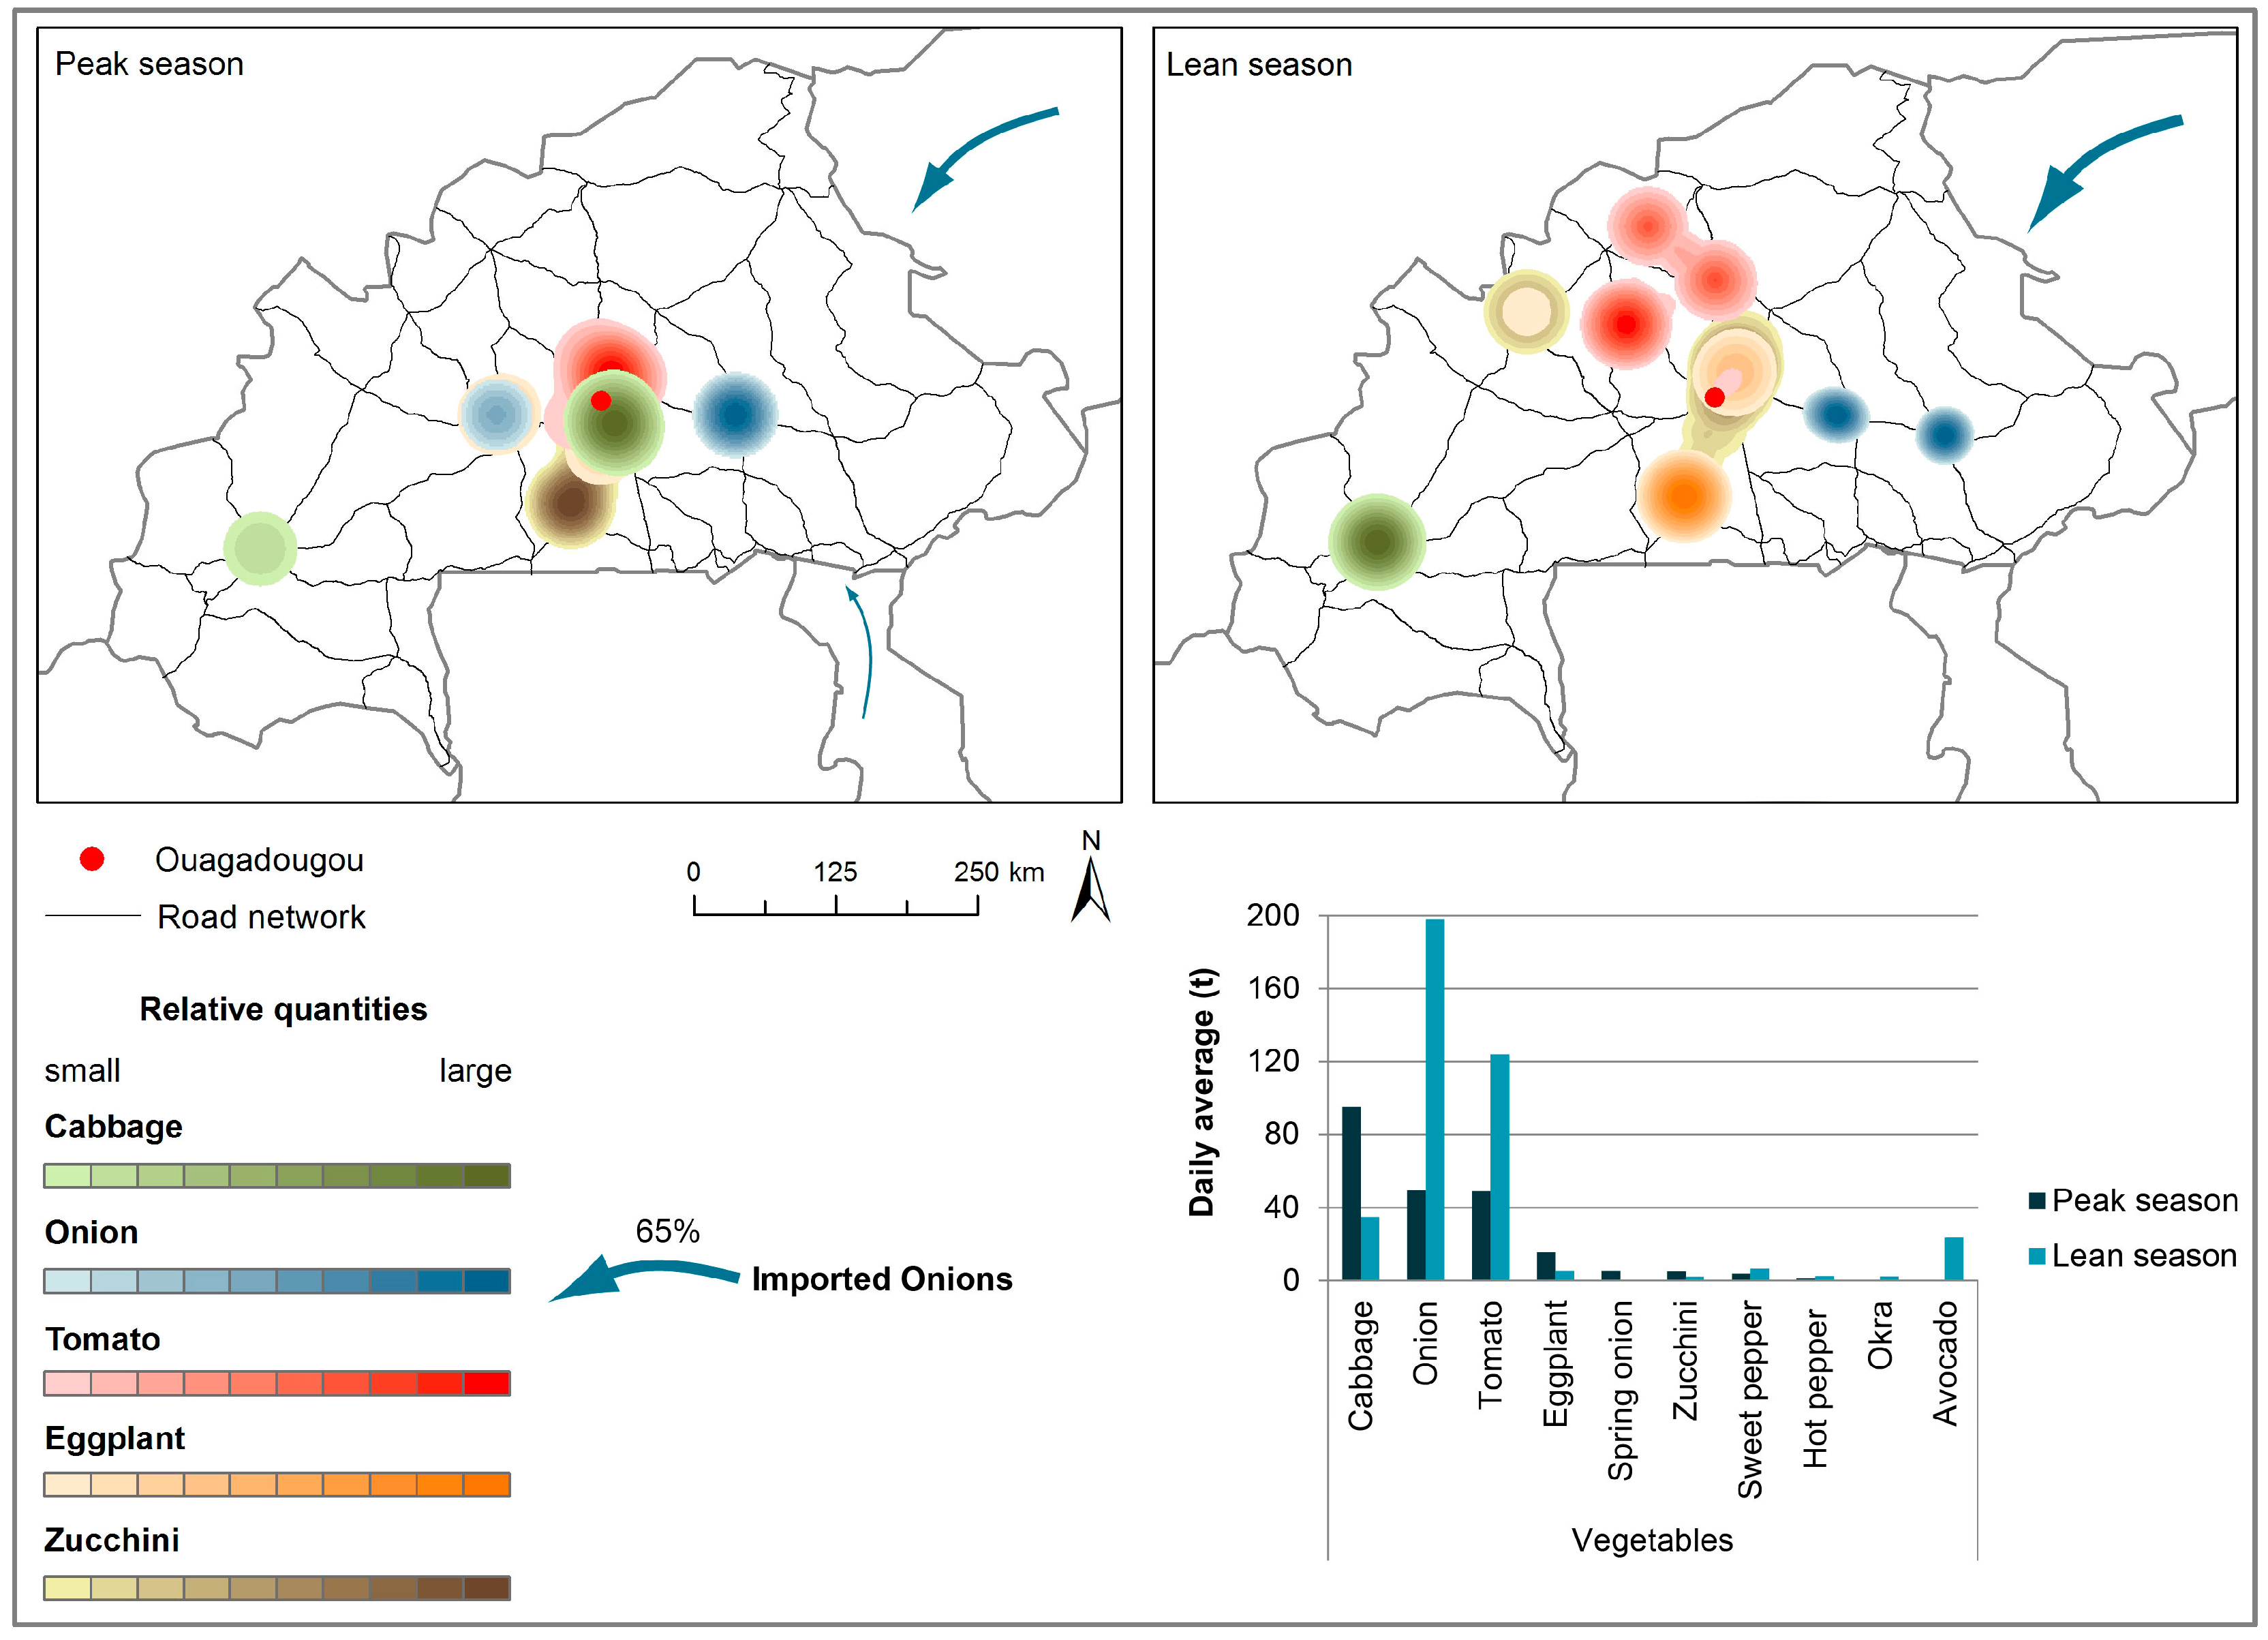
Urban Foodsheds
9. City Region Food Systems
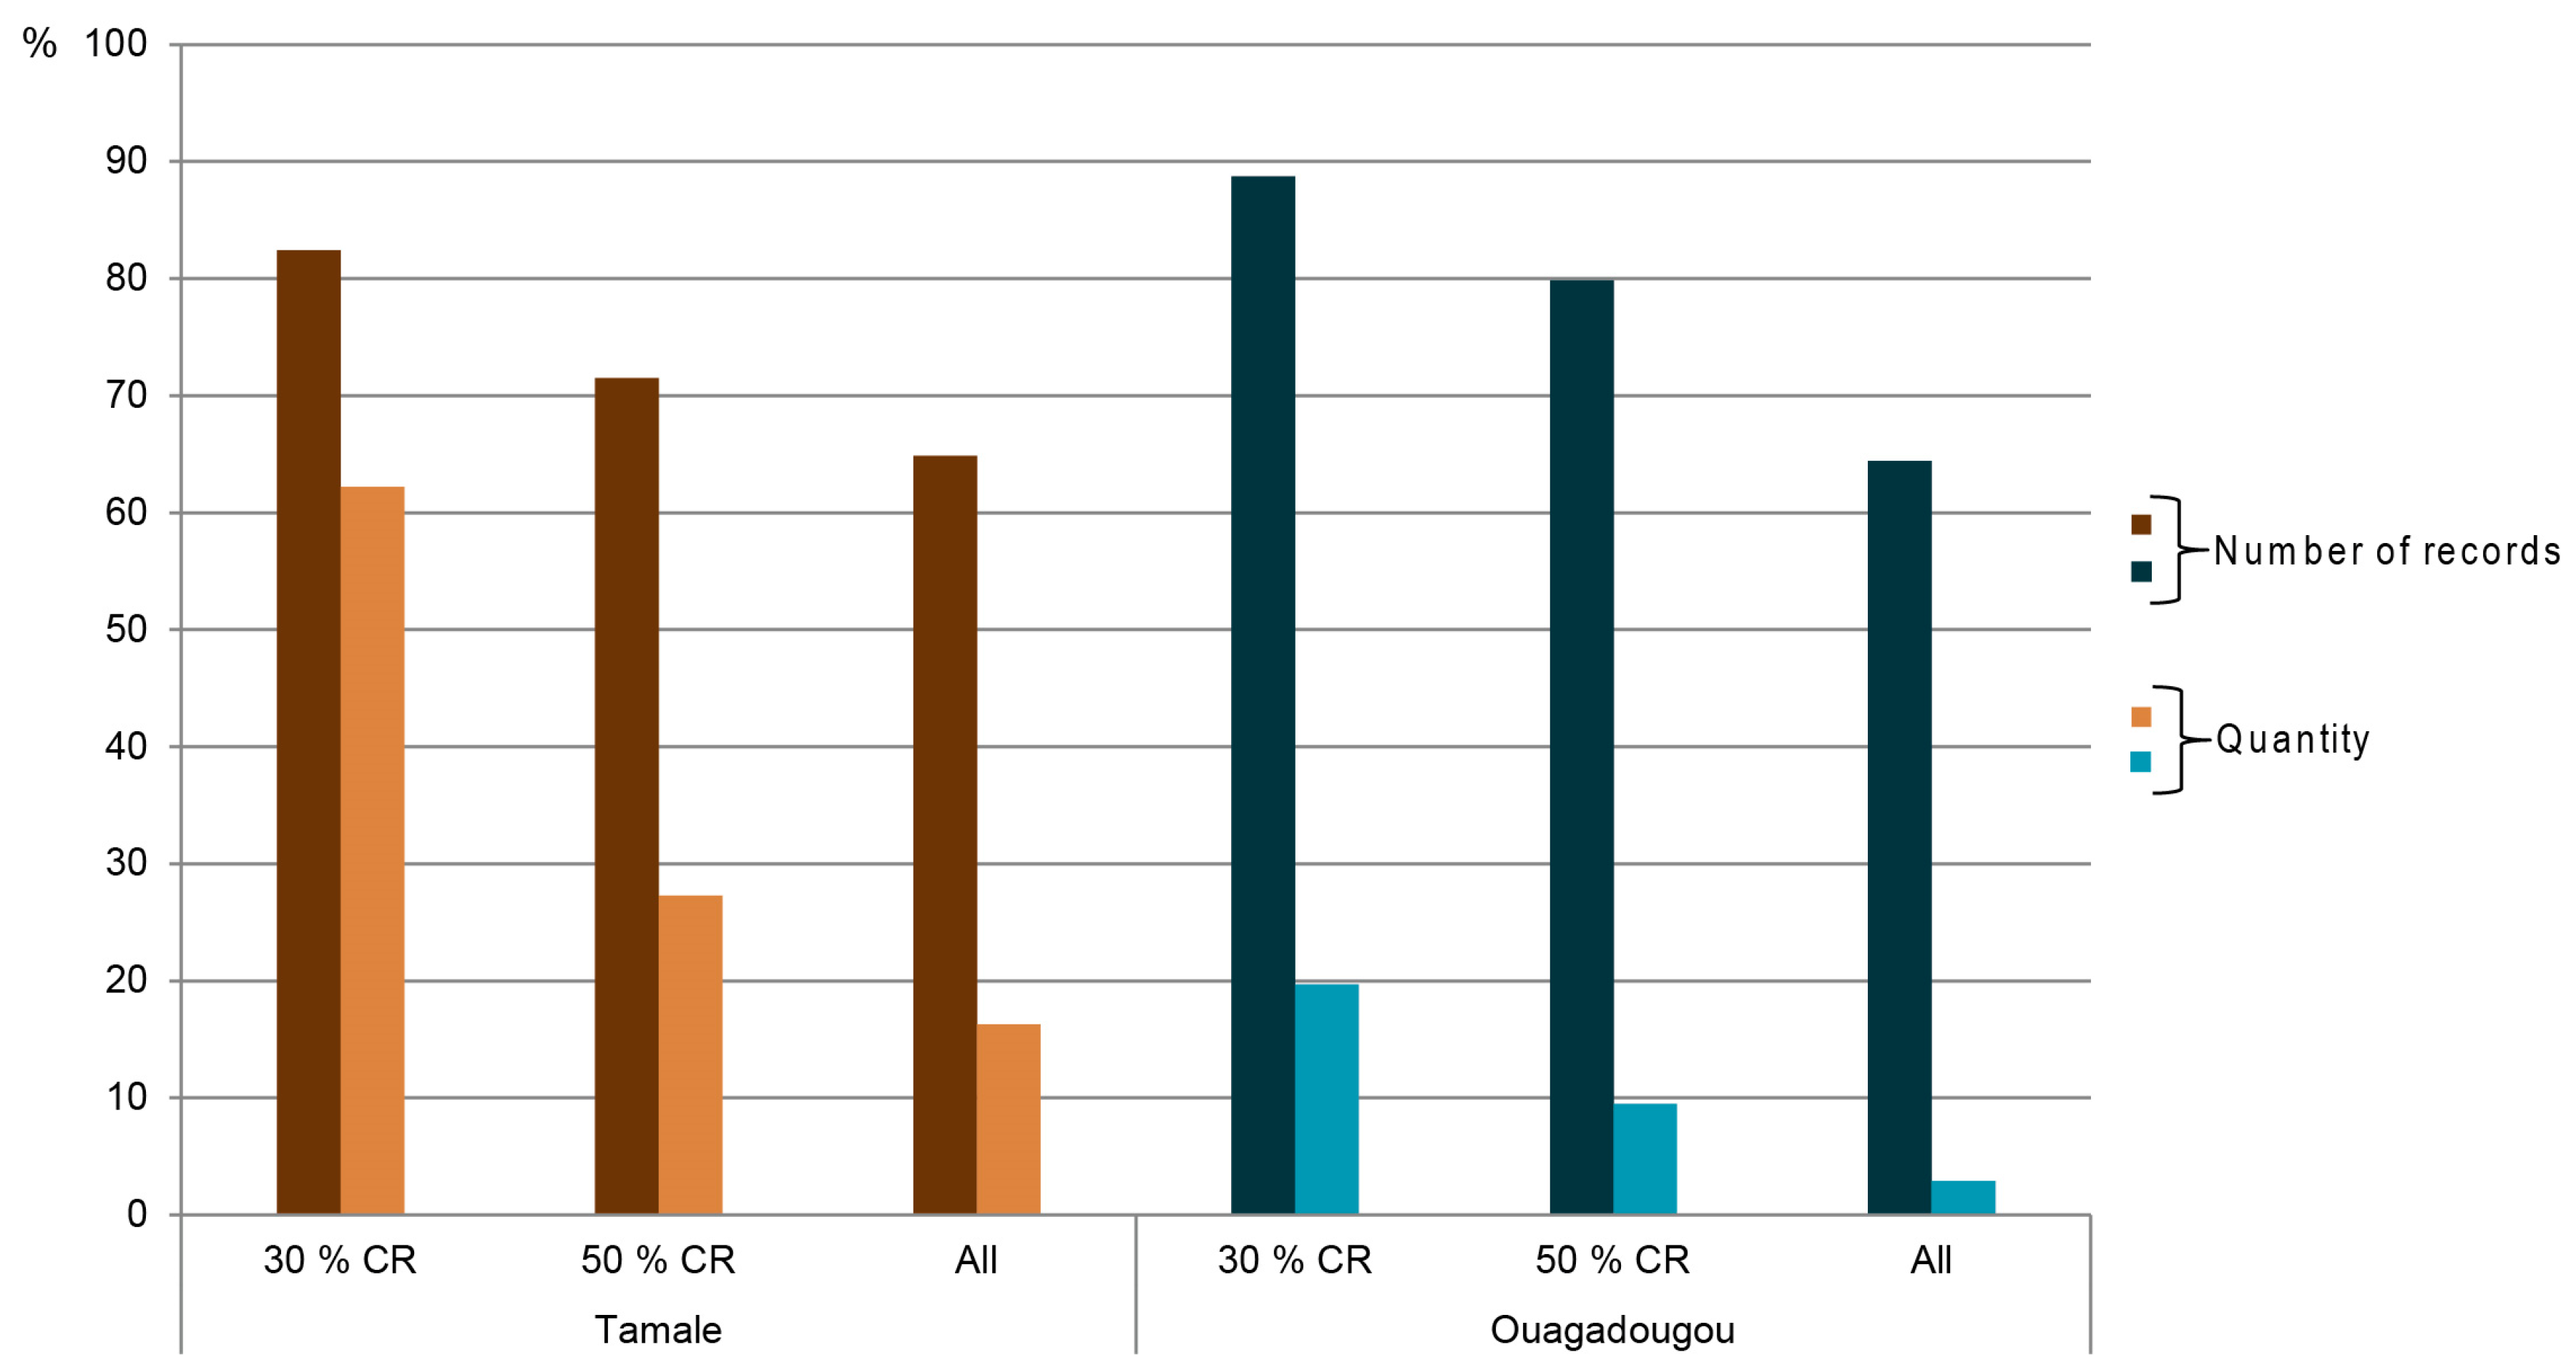
10. Sensitivity Assessment
11. Implications for Planning
11.1. Impacts on the City Region
11.2. Balanced Foodsheds
12. Conclusions
Acknowledgments
Author Contributions
Conflicts of Interest
Appendix A

| Ouagadougou | Tamale | |||
|---|---|---|---|---|
| Peak | Lean | Peak | Lean | |
| Cereals | Rice | Rice | Maize | Maize |
| Maize | Maize | Rice | Rice | |
| Millet | Millet | Millet | ||
| Fish | Fish | Fish | Fish | Fish |
| Livestock | Chicken | Chicken | Goat | Goat |
| Goat | Goat | Cattle | Cattle | |
| Cattle | Cattle | Sheep | Sheep | |
| Sheep | Sheep | |||
| Fruits | Banana | Mango | Watermelon | Mango |
| Watermelon | Dawadawa (Néré) | Orange Banana | Banana | |
| Vegetables | Cabbage | Cabbage | Onion | Onion |
| Tomato | Tomato | Pepper (hot) | Avocado | |
| Onion | Onion | Tomato | Tomato | |
| Leaf vegetables | Roselle | Lettuce | ||
| Jute | Jute | |||
| Legumes | Groundnut Bean | Groundnut Bean | Groundnut Bean | Groundnut Bean |
| Sweet potato | Potato | Cassava | Cassava | |
| Roots and tubers | Yam | Yam | Plantain | Plantain |
| Yam | Yam | |||
| Household Expenditure on Little to Non-Processed Food (in %) * | ||
|---|---|---|
| Burkina Faso | Ghana | |
| Other cereals, flour and other products | 28.11 | 6.25 |
| Rice | 20.49 | 11.21 |
| Vegetables including legumes | 18.07 | 15.02 |
| Fish | 11.00 | 23.64 |
| Beef and veal | 5.44 | 1.89 |
| Frozen, preserved or processed vegetables | 5.38 | 0.53 |
| Lamb, mutton and goat | 4.33 | 8.29 |
| Fresh fruit | 1.87 | 9.48 |
| Roots and tubers | 1.73 | 14.43 |
| Frozen, preserved or processed fruit | 0.83 | 3.08 |
| Poultry | 0.75 | 3.04 |
| Other meats and meat preparations | 0.68 | 0.52 |
| Eggs and egg-based products | 0.56 | 2.02 |
| Fresh milk | 0.40 | 0.11 |
| Pork | 0.36 | 0.48 |


References
- United Nations Human Settlements Programme (UN-Habitat). The State of African Cities 2014: Re-Imagining Sustainable Urban Transitions; United Nations Human Settlements Programme (UN-Habitat): Nairobi, Kenya, 2014. [Google Scholar]
- Reardon, T.A. Growing Food for Growing Cities: Transforming Food Systems in an Urbanizing World. 2006. Available online: https://www.thechicagocouncil.org/sites/default/files/report_growingfoodforgrowingcities2.pdf (accessed on 9 November 2016).
- Peters, C.J.; Bills, N.L.; Wilkins, J.L.; Fick, G.W. Foodshed analysis and its relevance to sustainability. Renew. Agric. Food Syst. 2009, 24, 1–7. [Google Scholar] [CrossRef]
- Flora, C.B. Food security in the context of energy and resource depletion: Sustainable agriculture in developing countries. Renew. Agric. Food Syst. 2010, 25, 118–128. [Google Scholar] [CrossRef]
- Bellows, A.C.; Hamm, M.W. Local autonomy and sustainable development: Testing import substitution in localizing food systems. Agric. Hum. Values 2001, 18, 271–284. [Google Scholar] [CrossRef]
- Feagan, R. The place of food: Mapping out the “local” in local food systems. Prog. Hum. Geogr. 2007, 31, 23–42. [Google Scholar] [CrossRef]
- DuPuis, E.M.; Goodman, D. Should we go “home” to eat? Toward a reflexive politics of localism. J. Rural Stud. 2005, 21, 359–371. [Google Scholar] [CrossRef]
- Donald, B.; Gertler, M.; Gray, M.; Lobao, L. Re-regionalizing the food system? Camb. J. Reg. Econ. Soc. 2010, 3, 171–175. [Google Scholar] [CrossRef]
- ISU (International Sustainability Unit). Food in an Urbanised World: The Role of City Region Food Systems in Resilience and Sustainable Development; ISU (International Sustainability Unit): London, UK, 2015. [Google Scholar]
- FAO (Food and Agriculture Organisation of the United Nations). Profitability and Sustainability of Urban and Peri-Urban Agriculture; FAO: Rome, Italy, 2007. [Google Scholar]
- Amerasinghe, P.; Bhardwaj, R.M.; Scott, C.; Jella, K.; Marshall, F. Urban Wastewater and Agricultural Reuse Challenges in India; International Water Management Institute: Colombo, Sri Lanka, 2013. [Google Scholar]
- Magnusson, U.; Bergmann, K.F. Urban and Peri-Urban Agriculture for Food Security in Low-Income Countries—Challenges and Knowledge Gaps. 2014. Available online: http://www.siani.se/sites/clients.codepositive.com/files/document/slu-global-report-2014-4-urban-and-peri-urban-agriculture-for-food-security-webb.pdf (accessed on 9 November 2016).
- Forster, T.; Escudero, A.G. City Regions as Landscapes for People, Food and Nature; EcoAgriculture Partners, on behalf of the Landscapes for People, Food and Nature Initiative: Washington, DC, USA, 2014. [Google Scholar]
- Hinrichs, C. The practice and politics of food system localization. J. Rural Stud. 2003, 19, 33–45. [Google Scholar] [CrossRef]
- Born, B.; Purcell, M. Avoiding the local trap: Scale and food systems in planning research. J. Plan. Educ. Res. 2006, 26, 195–207. [Google Scholar] [CrossRef]
- Battersby, J. The need for a diverse and responsive food system. Urban Agric. Mag. 2014, 27, 10–12. [Google Scholar]
- Elbehri, A. Rebuilding West Africa’s Food Potential: Policies and Market Incentives for Smallholder-Inclusive Food Value Chains; FAO: Rome, Italy, 2013. [Google Scholar]
- Kneafsey, M. The region in food—Important or irrelevant? Camb. J. Reg. Econ. Soc. 2010, 3, 177–190. [Google Scholar] [CrossRef]
- Thompson, E.; Harper, A.M.; Kraus, S. Think Globally—Eat Locally: San Francisco Foodshed Assessmen. 2008. Available online: http://www.thegreenhorns.net/wp-content/files_mf/1340378421SanFranciscoFoodShedAssessment.pdf (accessed on 9 November 2016).
- Peters, C.J.; Bills, N.L.; Lembo, A.J.; Wilkins, J.L.; Fick, G.W. Mapping potential foodsheds in New York State: A spatial model for evaluating the capacity to localize food production. Renew. Agric. Food Syst. 2009, 24, 72–84. [Google Scholar] [CrossRef]
- Forkes, J. Measuring the Shape and Size of the Foodshed. Ph.D. Thesis, University of Toronto, Toronto, ON, Canada, 2011. [Google Scholar]
- Zumkehr, A.; Campbell, J.E. The potential for local croplands to meet US food demand. Front. Ecol. Environ. 2015, 13, 244–248. [Google Scholar] [CrossRef]
- Gunasekera, J. Report of the Food Flow Mapping: Kesbewa Urban Area; Janathakshan Guarantee Ltd.: Colombo, Sri Lanka, 2012. [Google Scholar]
- Mukui, J.T. Urban and Peri-Urban Agriculture and Rural-to-Urban Food Flows: Case Study of Nairobi: Consultant report prepared for Urban Economy and Finance Branch; United Nations Human Settlements Programme (UN-HABITAT): Nairobi, Kenya, 2002. [Google Scholar]
- Drechsel, P.; Graefe, S.; Fink, M. Rural-Urban Food, Nutrient and Virtual Water Flows in Selected West African Cities. 2007. Available online: http://www.iwmi.cgiar.org/Publications/IWMI_Research_Reports/PDF/PUB115/RR115.pdf (accessed on 9 November 2016).
- Haggblade, S.; Longabaugh, S.; Boughton, D.; Dembelé, N.; Diallo, B.; Staatz, J.; Tschirley, D. Staple Food Market Sheds in West Africa. MSU International Development Working Paper 121. 2012. Available online: http://fsg.afre.msu.edu/papers/idwp121.pdf (accessed on 9 November 2016).
- Institut National de la Statistique et de la Démographie. Annuaire statistique 2014; Institut National de la Statistique et de la Démographie: Ouagadougou, Burkina Faso, 2015. [Google Scholar]
- Ghana Statistical Service. 2010 Population & Housing Census: National Analytical Report; Ghana Statistical Service: Accra, Ghana, 2013. [Google Scholar]
- USAID (United States Agency for International Development). Fact Sheet Burkina Faso: Agriculture and Food Security (Fact Sheet); USAID: Washington, DC, USA, 2015.
- Ministry of Economy and Finance, Burkina Faso. Investing in Future: Accelerated Growth and Sustainable Development: Business Environment, Investment Opportunities and Public-Private Partnership; Ministry of Economy and Finance, Burkina Faso: Ouagadougou, Burkina Faso, 2011.
- Chauvin, N.D.; Mulangu, F.; Porto, G. Food Production and Consumption Trends in Sub-Saharan Africa: Prospects for the Transformation of the Agricultural Sector; UNDP, Regional Bureau for Africa: New York, NY, USA, 2012. [Google Scholar]
- Bourdet, Y. External Shocks, Exchange Rate Regime and Growth in Burkina Faso and Mali. 2004. Available online: http://www.sida.se/contentassets/022bca5dc1b2482f9ede2ee665124a07/external-shocks-exchange-rate-regime-and-growth-in-burkina-faso-and-mali_1417.pdf (accessed on 9 November 2016).
- Bellwood-Howard, I.; Haring, V.; Karg, H.; Roessler, R.; Schlesinger, J.; Shakya, M. Characteristics of urban and Peri-Urban Agriculture in West Africa: Results of an Exploratory Survey Conducted in Tamale (Ghana) and Ouagadougou (Burkina Faso); International Water Management Institute (IWMI): Colombo, Sri Lanka, 2015. [Google Scholar]
- UNDP (United Nations Development Programme). The Ghana Human Development Report 2007: Towards a More Inclusive Society; UNDP: Accra, Ghana, 2007. [Google Scholar]
- WFP (World Food Programme). Ghana. 2016. Available online: http://www.wfp.org/node/34673726 (accessed on 02 July 2016).
- Auricht, C.; Dixon, J.; Boffa, J.-M.; Garrity, D. Farming Systems of Africa. In Atlas of African Agriculture Research and Development. Revealing Agriculture’s Place in Africa; Sebastian, K., Ed.; International Food Policy Research Institute: Washington, DC, USA, 2014; pp. 14–15. [Google Scholar]
- Hill, P. Notes on traditional market authority and market periodicity in West Africa. J. Afr. Hist. 1996, 7, 295–311. [Google Scholar] [CrossRef]
- Riemann, D.; Glaser, R.; Kahle, M.; Vogt, S. The CRE tambora.org—New data and tools for collaborative research in climate and environmental history. Geosci. Data J. 2015, 2, 63–77. [Google Scholar] [CrossRef]
- Blay-Palmer, A.; Renting, H.; Dubbeling, M. City-Region Food Systems: A Literature Review. 2015. Available online: http://www.ruaf.org/sites/default/files/City%20Region%20Food%20Systems%20literature%20review.pdf (accessed on 9 November 2016).
- FAO (Food and Agriculture Organization of the United Nations). Program of Food Consumption Surveys; FAO: Rome, Italy, 1964. [Google Scholar]
- Ghana Statistical Service. Ghana Living Standards Survey Round 6 (GLSS 6): Main Report; Ghana Statistical Service: Accra, Ghana, 2014. [Google Scholar]
- Institut National de la Statistique et de la Démographie. Recensement Général de la Population et de l'habitation de 2006: Résultats Définitifs; Institut National de la Statistique et de la Démographie: Ouagadougou, Burkina Faso, 2008. [Google Scholar]
- The World Bank. 2010. Available online: http://datatopics.worldbank.org/consumption (accessed on 15 May 2016).
- FEWS NET. Burkina Faso Price Bulletin: June 2014. 2014. Available online: http://reliefweb.int/sites/reliefweb.int/files/resources/Burkina%20Faso_2014_06_PB_EN.pdf (accessed on 9 November 2016).
- FAOSTAT. Available online: http://faostat3.fao.org/browse/T/TP/E (accessed on 19 May 2016).
- Angelucci, F.; Asante-Poku, A.; Anaadumba, P. Analysis of Incentives and Disincentives for Rice in Ghana: Draft Version; (Technical notes series, MAFAP); FAO: Rome, Italy, 2013. [Google Scholar]
- FEWS NET. Production and Market Flow Map: Burkina Faso Maize. 2009. Available online: http://www.fews.net/sites/default/files/documents/reports/bf_fullmap_maize_norm.pdf (accessed on 15 June 2016).
- Terpend, N. An Assessment of Knowledge about Trade and Markets Related to Food Security in West Africa; FAO: Rome, Itlay, 2006. [Google Scholar]
- OECD (Organisation for Economic Co-operation and Development). Settlement, Market and Food Security. In West African Futures; OECD Publishing: Paris, France, 2013. [Google Scholar]
- Bruyas, C. Road Governance Study: Current Status, Analysis, and Recommendations; Trade Hub Communications: Bethesda, MD, USA, 2014. [Google Scholar]
- CILSS (Comité permanent Inter-Etats de Lutte contre la Sécheresse dans le Sahel) and USAID. Road Harassment Report; CILSS, USAID: Ouagadougou, Burkina Faso; Washington, DC, USA, 2013.
- Teravaninthorn, S.; Raballand, G. Transport Prices and Costs in Africa: A review of the International Corridors; The World Bank: Washington, DC, USA, 2009. [Google Scholar]
- FAO (Food and Agriculture Organization of the United Nations). The State of World Fisheries and Aquaculture: Opportunities and Challenges; FAO: Rome, Italy, 2014. [Google Scholar]
- Ministry of Food and Agriculture, Ghana. Fish Production, Imports, Exports & Consumption. 2011. Available online: http://mofa.gov.gh/site/?page_id=2862 (accessed on 15 May 2016). [Google Scholar]
- UN Comtrade. 2015. Available online: http://comtrade.un.org/data/ (accessed on 15 May 2016).
- USAID. West Africa Trade and Investment Hub. Anti-Corruption Campaign Underway with Trade Hub Backing. 2016. Available online: https://www.watradehub.com/en/anti-corruption-campaign-underway-trade-hub-backing/ (accessed on 15 May 2016).
- Kamuanga, M.J.B.; Somda, J.; Sanon, Y.; Kagoné, H. Livestock and Regional Market in the Sahel and West Africa: Potentials and Challenges. 2008. Available online: https://www.oecd.org/swac/publications/41848366.pdf (accessed on 9 November 2016).
- Schneider, K.; Gugerty, M.K.; Plotnick, R.; Anderson, C.L. Poultry market in West Africa: Overview & Comparative Analysis. 2010. Available online: https://evans.uw.edu/sites/default/files/Evans%20UW_Request%2082_Poultry%20Market%20Analysis%20Overview_7-16-2010_0.pdf (accessed on 9 November 2016).
- Schneider, K.; Gugerty, M.K.; Plotnick, R. Poultry Market in West Africa: Burkina Faso. 2010. Available online: https://evans.uw.edu/sites/default/files/Evans%20UW_Request%2084_Poultry%20Market%20Analysis%20Burkina%20Faso_5-28-2010_0.pdf (accessed on 9 November 2016).
- Ching, L.L.; Edwards, S.; Scialabba, N.E.-H. Climate Change and Food Systems Resilience in sub-Sahara Africa; FAO: Rome, Italy, 2011. [Google Scholar]
- Adimabuno, A.M. Marketing and Market Queens: A Case of Tomato Farmers in the Upper East Region of Ghana. Ph.D. Thesis, University of Bonn, Bonn, Germany, 2010. Available online: http://hss.ulb.uni-bonn.de/2010/2335/2335.pdf (accessed on 17 December 2014). [Google Scholar]
- Amikuzuno, J.; Ihle, R. Seasonal asymmetric price transmission in Ghanaian tomato markets: Adapting Johansen’s estimation method. In Proceedings of the Poster presented at the Joint 3rd African Association of Agricultural Economists (AAAE) and 48th Agricultural Economists Association of South Africa (AEASA) Conference, Cape Town, South Africa, 19–23 September 2010.
- Baba, I.I.Y.; Yirzagla, J.; Mawunya, M. The tomato industry in Ghana—Fundamental challenges, surmounting strategies and perspectives. A review. Int. J. Curr. Res. 2013, 5, 4102–4107. [Google Scholar]
- Robinson, E.J.Z.; Kolavalli, S.L. The case of tomato in Ghana: Marketing. 2010. Available online: http://citeseerx.ist.psu.edu/viewdoc/download?doi=10.1.1.222.5285&rep=rep1&type=pdf (accessed on 9 November 2016).
- Moustier, P.; Renting, H. Urban agriculture and short chain food marketing in developing countries. In Cities and Agriculture—Developing Resilient Urban Food Systems; de Zeeuw, H., Drechsel, P., Eds.; Routledge: London, UK, 2015; pp. 121–138. [Google Scholar]
- Drechsel, P.; Keraita, B. Irrigated Urban Vegetable Production in Ghana: Characteristics, Benefits and Risk Mitigation; International Water Management Institute (IWMI): Colombo, Sri Lanka, 2014. [Google Scholar]
- Karg, H.; Hologa, R.; Schlesinger, J.; Drescher, A.; Glaser, R. Characteristics of the periurban: A multi-method approach applied to Tamale, Ghana. Landsc. Urban Plan. 2016. submitted. [Google Scholar]
- McKim, W. The periodic market system in Northeastern Ghana. Econ. Geogr. 1972, 48, 333–344. [Google Scholar] [CrossRef]
- Drechsel, P.; Karg, H.; Appoh, R.K.; Akoto-Danso, E.K. Resilience of Rural-Urban Food Flows in West Africa. In Proceedings of the International conference on Agri-Chains and Sustainable Development: Linking Local and Global Dynamics, Montpellier, France, 12–14 December 2016.
- Drechsel, P.; Karg, H.; Amoah, P. Food flows and waste: Planning for the dirty side of urban food security. In Integrating Food into Urban Planning; UCL Press: London, UK, 2016; submitted. [Google Scholar]
- IRIN (Integrated Regional Information Networks). 2007. Available online: http://reliefweb.int/report/ghana/ghana-food-shortages-follow-drought-floods (accessed on 8 June 2016).
- Tendall, D.M.; Joerin, J.; Kopainsky, B.; Edwards, P.; Shreck, A.; Le, Q.B.; Kruetli, P.; Grant, M.; Six, J. Food system resilience: Defining the concept. Glob. Food Secur. 2015, 6, 17–23. [Google Scholar] [CrossRef]


| Survey Periods | Season | Total Number of Records | Missing Values (%) | Total Incoming Records (%) | Incoming Records with Urban Destination (%) | |||
|---|---|---|---|---|---|---|---|---|
| Quantity/Unit | Source | Destination | ||||||
| Tamale | 18–24 November 2013 | Peak | 14,178 | 2.6 | 12.0 | 11.4 | 60.7 | 54.7 |
| 17–22 November 2014 | ||||||||
| 7–13 April 2014 | Lean | 13,159 | 1.5 | 11.0 | 10.8 | 47.8 | 41.1 | |
| 16–22 March 2015 | ||||||||
| Ouagadougou | 6–12 May 2014 | Lean | 6332 | 0.4 | 38.0 | 38.9 | 57.3 | 32.0 |
| 1–6 December 2014 | Peak | 6834 | 0.6 | 28.6 | 28.2 | 67.4 | 44.2 | |
© 2016 by the authors; licensee MDPI, Basel, Switzerland. This article is an open access article distributed under the terms and conditions of the Creative Commons Attribution (CC-BY) license (http://creativecommons.org/licenses/by/4.0/).
Share and Cite
Karg, H.; Drechsel, P.; Akoto-Danso, E.K.; Glaser, R.; Nyarko, G.; Buerkert, A. Foodsheds and City Region Food Systems in Two West African Cities. Sustainability 2016, 8, 1175. https://doi.org/10.3390/su8121175
Karg H, Drechsel P, Akoto-Danso EK, Glaser R, Nyarko G, Buerkert A. Foodsheds and City Region Food Systems in Two West African Cities. Sustainability. 2016; 8(12):1175. https://doi.org/10.3390/su8121175
Chicago/Turabian StyleKarg, Hanna, Pay Drechsel, Edmund K. Akoto-Danso, Rüdiger Glaser, George Nyarko, and Andreas Buerkert. 2016. "Foodsheds and City Region Food Systems in Two West African Cities" Sustainability 8, no. 12: 1175. https://doi.org/10.3390/su8121175