1. Introduction
The interest in issues related to urban food supply is not new. While major efforts in this direction are addressed at developing countries, where the main problem concerns the improvement of food security [
1], the theme is also on the rise in the Global North, where it attracts academic and scientific attentions and has entered the agendas of both policy makers and civil society.
It is especially within the debate of urban resilience [
2] and metabolism [
3] that such an aspect has gained increasing importance. Along with the flows of energy, water, and materials, the interaction of urban food systems and nature for nutrients and food [
4] has become a central issue. Since the 1970s, the progressive rise of urban agriculture movement has further exacerbated this awareness. As a result, a vast array of experiences of food production in cities [
5,
6] can be found. From professional agriculture in peri-urban and rural areas, to cultivations of food crops in the inner city, the limited potential of feeding cities from within is specific to developed countries. It is reported that in The Netherlands, the production of food within urban boundaries can meet only 0.0018% of food consumption [
7]; a recent survey in Milan city, Italy, estimated that urban gardens could provide an additional 1% of fruit and vegetables (unpublished data). Feeding a city is thus one of the most relevant challenges for modern productive systems, as its overcoming may involve food security and safety, high-quality food products, low energy consumption, and the sustainability of the urban model in general.
The expected increase in urban population and the expansion of metropolitan areas worldwide [
8] call for the enhancement of productivity and the agricultural sector to meet the higher food demand. Given the current relatively scarce amount of agricultural land in urban areas, higher demands may contribute to the intensification of urban land use, as well as to the growing dependency on food imports from remote landscapes.
Long before the eighteenth century, food supply was already globalized. With the advent of the Industrial Revolution, it gained a new edge: food then began to be mobilized in global production and trade systems, governed through global institutions [
9] and consumed more and more away from its production site, with cities worldwide sourcing most of their food products from international trade. This trend towards globalization further gained pace with the process of trade liberalization and market enlargement after the Second World War, and has been increasing since the 1980s. Following the Uruguay Round Agreement on Agriculture (1994) [
10], such conditions have been putting increasing pressure on the potential earnings of agricultural producers. Farming systems in both rural and urban areas have thus adapted to the opportunities offered by commodity market conditions, CAP (Common Agricultural Policy) reforms [
11], and competition for prime croplands [
12]; in this way, the comparison between production costs and international market prices generally leads food products to be more often transferred from places where their production is cheaper to others that ensure increased and more profitable sales. Global markets represent the primary means of commercialization of agricultural products, which are allocated to consumers via the agro-food industry, wholesale channels, and the distribution sector. It is reported that in Western European countries only 20% of production is marketed locally [
13]. However, we must recognize that the global market supply is often not adequately meeting the food demand, nor the goals of food security [
14], accessibility [
15], and economic resilience [
16]; in addition, the long-distance transport of food cannot ensure environmental sustainability [
17].
Growing dependence on global markets and international trade is coupled with a parallel augmentation of the geographic separation between production and consumption locations [
18,
19]. Along with the lengthening of the distribution chain [
20] and the perception of consumers about “placeless” products [
21], this has led to a disconnection of many cities from their surrounding agricultural areas, which until then had been an important source of fresh food, in favor of more profitable land uses [
22]. The dependence on global resources [
23,
24] is further increased, exacerbating land displacement and pushing the boundaries of what was originally a bio-geographic food supply region [
25]. In this regard, fostering localism in urban agro-food systems may represent a strategy and an opportunity to achieve positive externalities in the territory. It might offer further opportunities to encourage the efficient use of resources [
26] and their valorization, foster economic viability and sustainability in peri-urban areas [
27], benefit from greater competitiveness [
28], and establish peculiar forms of local governance [
29]. Actually, as Brunori et al. [
30] pointed out, a clear superiority of the local type over the global dimension cannot be precisely defined, as it is dependent on manifold site-specific conditions and subjective instances. The localization of food systems therefore emerges as a typical problem and reflects what Born and Purcell [
31] conceptualized as the “local trap”. The authors argued that more often local-scale food systems are assumed to be inherently good, sustainable, and just [
32]. Such an approach, however, fails to adequately describe all the outcomes, good and bad, produced by a food system; irrespective of the scale, they, in fact, rely on the agendas and practices pursued by their respective actors. Planners, and decision-makers in general, must carry out extensive empirical studies aimed at determining the opportunity to stress the local component, if inherently desirable. Within this conceptual framework, the capabilities and performances of food systems at different scales should be first explored to determine which one, and in which conditions, might be more desirable than others. At the same time, overcoming the trivial local–global dichotomy represents a major challenge for the near future, aiming at sustainable and resilient food provision of big cities and metropolitan areas. This means recognizing the coexistence of both the components within a complex system and strengthening their respective capabilities. In other words, the dynamics between production and consumption should be able to respond to the requirements of domestic supply, maintain interrelations within the global context, and meet consumers’ demand for more direct relationships with food producers. In this sense, regionalized food systems and shortened food chains [
33,
34] have been assuming increasing importance as a practical expression of reconnection between food and its source, in terms of both organizational and geographical proximity [
19,
35].
Likely, this novel perspective would lead to the creation of favorable conditions for strengthening a system’s resilience against various events, from food price surge to climate change effects, escalation of land use conflicts, and rapid urbanization. In addition, the enhancement of agriculture and food sectors may lead the territory to benefit from economic viability and social concerns. Food as an urban issue affects all the components of sustainability, from the local economy to the environment, public health, the quality of neighborhoods [
36], and a wide range of other sectors [
37,
38]. The management of an urban food system is a key element for more effective urban–rural associations [
39]. Thus, the promotion of a sustainable agro-food system requires its multifunctional nature to not be excluded from city planning and urban policies. To date, the food system and food-related issues have been largely perceived to concern rural areas only, and are therefore not covered by urban policy agendas [
36]. The increasing role of cities as key transition spaces [
40], and the recognized benefits of re-localization have stimulated the creation of new consumer–farmer relationships and interconnections between urban areas and their surrounding rural land [
41], resulting in a mixed urban–rural zone that may play an important role in supporting urban sustainability [
42]. At the same time, preserving agriculture is hampered by the lack of a proper understanding of the overall characteristics of city regions; similarly, the promotion and development of urban food strategies and other related policies require a sufficient knowledge base to be effective [
43]. Thus, the need for analysis and governance tools has grown. Regional systems must be assessed by addressing local and regional food production and consumption, economic viability [
44] and population outcomes in both urban and rural areas [
39] to determine how policies at all levels can better promote positive and local practices [
45].
Measuring Localism, Urban Food Provision, and Connections with the Global Level
The scientific debate has brought a number of approaches and models to investigate the role and potential use of local resources and their interconnections at the global level. Analyses in this regard concern the estimation of regional food balances, which are based on the comparison between quantities of food supply and demand [
46,
47,
48,
49,
50,
51,
52,
53,
54,
55,
56,
57]. Often these works merely analyze individual urban areas, regarding a sole product or a limited number of food categories, with scarce evidence on the role of dietary habits and agricultural production as a whole (e.g., [
56,
57]). Moreover, they primarily focus on specific aspects, such as farmland, production quantity, nutritional content, or even micronutrients [
25]. Yet, while deepening production–consumption relations in these terms, they do not dwell on any economic dimension.
Though food balance sheets may contribute in describing the economics of primary food production, approaches based on these assumptions fail to study in depth the relationships between food sovereignty, dietary requirements, international or interregional trade, and indirect land use changes. From such an approach two main problems arise. Besides value-added, agricultural production is already characterized by an intrinsic production value, expressed by the farm-gate price of raw food products. This aspect is frequently neglected in food balance analyses, which therefore do not provide indications of the connections between local and market conditions and the chances to enhance the primary sector. In addition, turning to national statistics does not enable us to capture the local (or regional) origin of food products, nor is the related data effectively representative of the different regional contexts at the national level. Rather, data demand occurs at the regional level, where activities of relevant actors in the agro-food sector take place and where policies, regulations, and interventions are effective. It is especially at this level that the importance of deepening food supply–demand relations emerges, paying attention to the strategic role agriculture in city regions can play in re-connecting production and consumption sites and enhancing local resources.
The complexity of agro-food systems in urban regions requires their adequate and comprehensive characterization. It should be determined how the system can respond to the challenges of domestic supply, compete in the global context, and meet consumers’ demand for a more direct relationship with food producers, for instance through the development of local systems. A recent theory put forward the concept of Metropolitan Agro-Food System, as “the space where urbanisation processes related to urban (food) consumption, recreational behaviour and preferences, infrastructure and urbanisation meet within a distinct eco-functional and socio-political context” [
48] (p. 68). From this point of view, metropolitan regions play a key role as intermediate levels between the local and the global scale; their extreme dynamism in extension, land use changes, and landscape character results in modifying the relationships between urban food production and consumption. According to Meyfroidt et al. [
58], methods coupling local and global processes are required to ensure a better understanding of the causal relationships that link land use change, trade, policies, demographic projections, and modifications in lifestyles. This highlights the need to identify suitable fact-finding tools, not only adequate for such a purpose but also flexible enough to be adopted in various spatial contexts and at different levels. Therefore, it is the purpose of this study to present a novel way of exploring the relationship between food supply and demand. Accordingly, an economic model is introduced and applied in a comparative study of five European city regions, namely the Berlin, Ljubljana, London, Milan, and Rotterdam metropolitan regions. The methodological framework provided aims at overcoming the limits and gaps of existing studies, by introducing and combining economic-based indexes. The model will explicitly derive (i) the main features of the regional agro-food system; (ii) information on the capacities and opportunities of local agriculture to adequately respond to food demand; as well as (iii) insights on the interconnections among localism, global competitiveness of agricultural sectors, and land use change.
The next section introduces the methodological approach adopted, based on the use of secondary data, as well as the regions taken as examples for the application of the method. Later on, results are discussed, with special attention to the joint analysis of different economic aspects. Finally, some general conclusions are drawn, consistent with the fact-finding nature of the proposed method.
2. Materials and Methods
The methodological approach aims to assess the ability of regional agricultural food production in adequately complying with food requirements and, at the same time, its prevalent positioning in local or global markets.
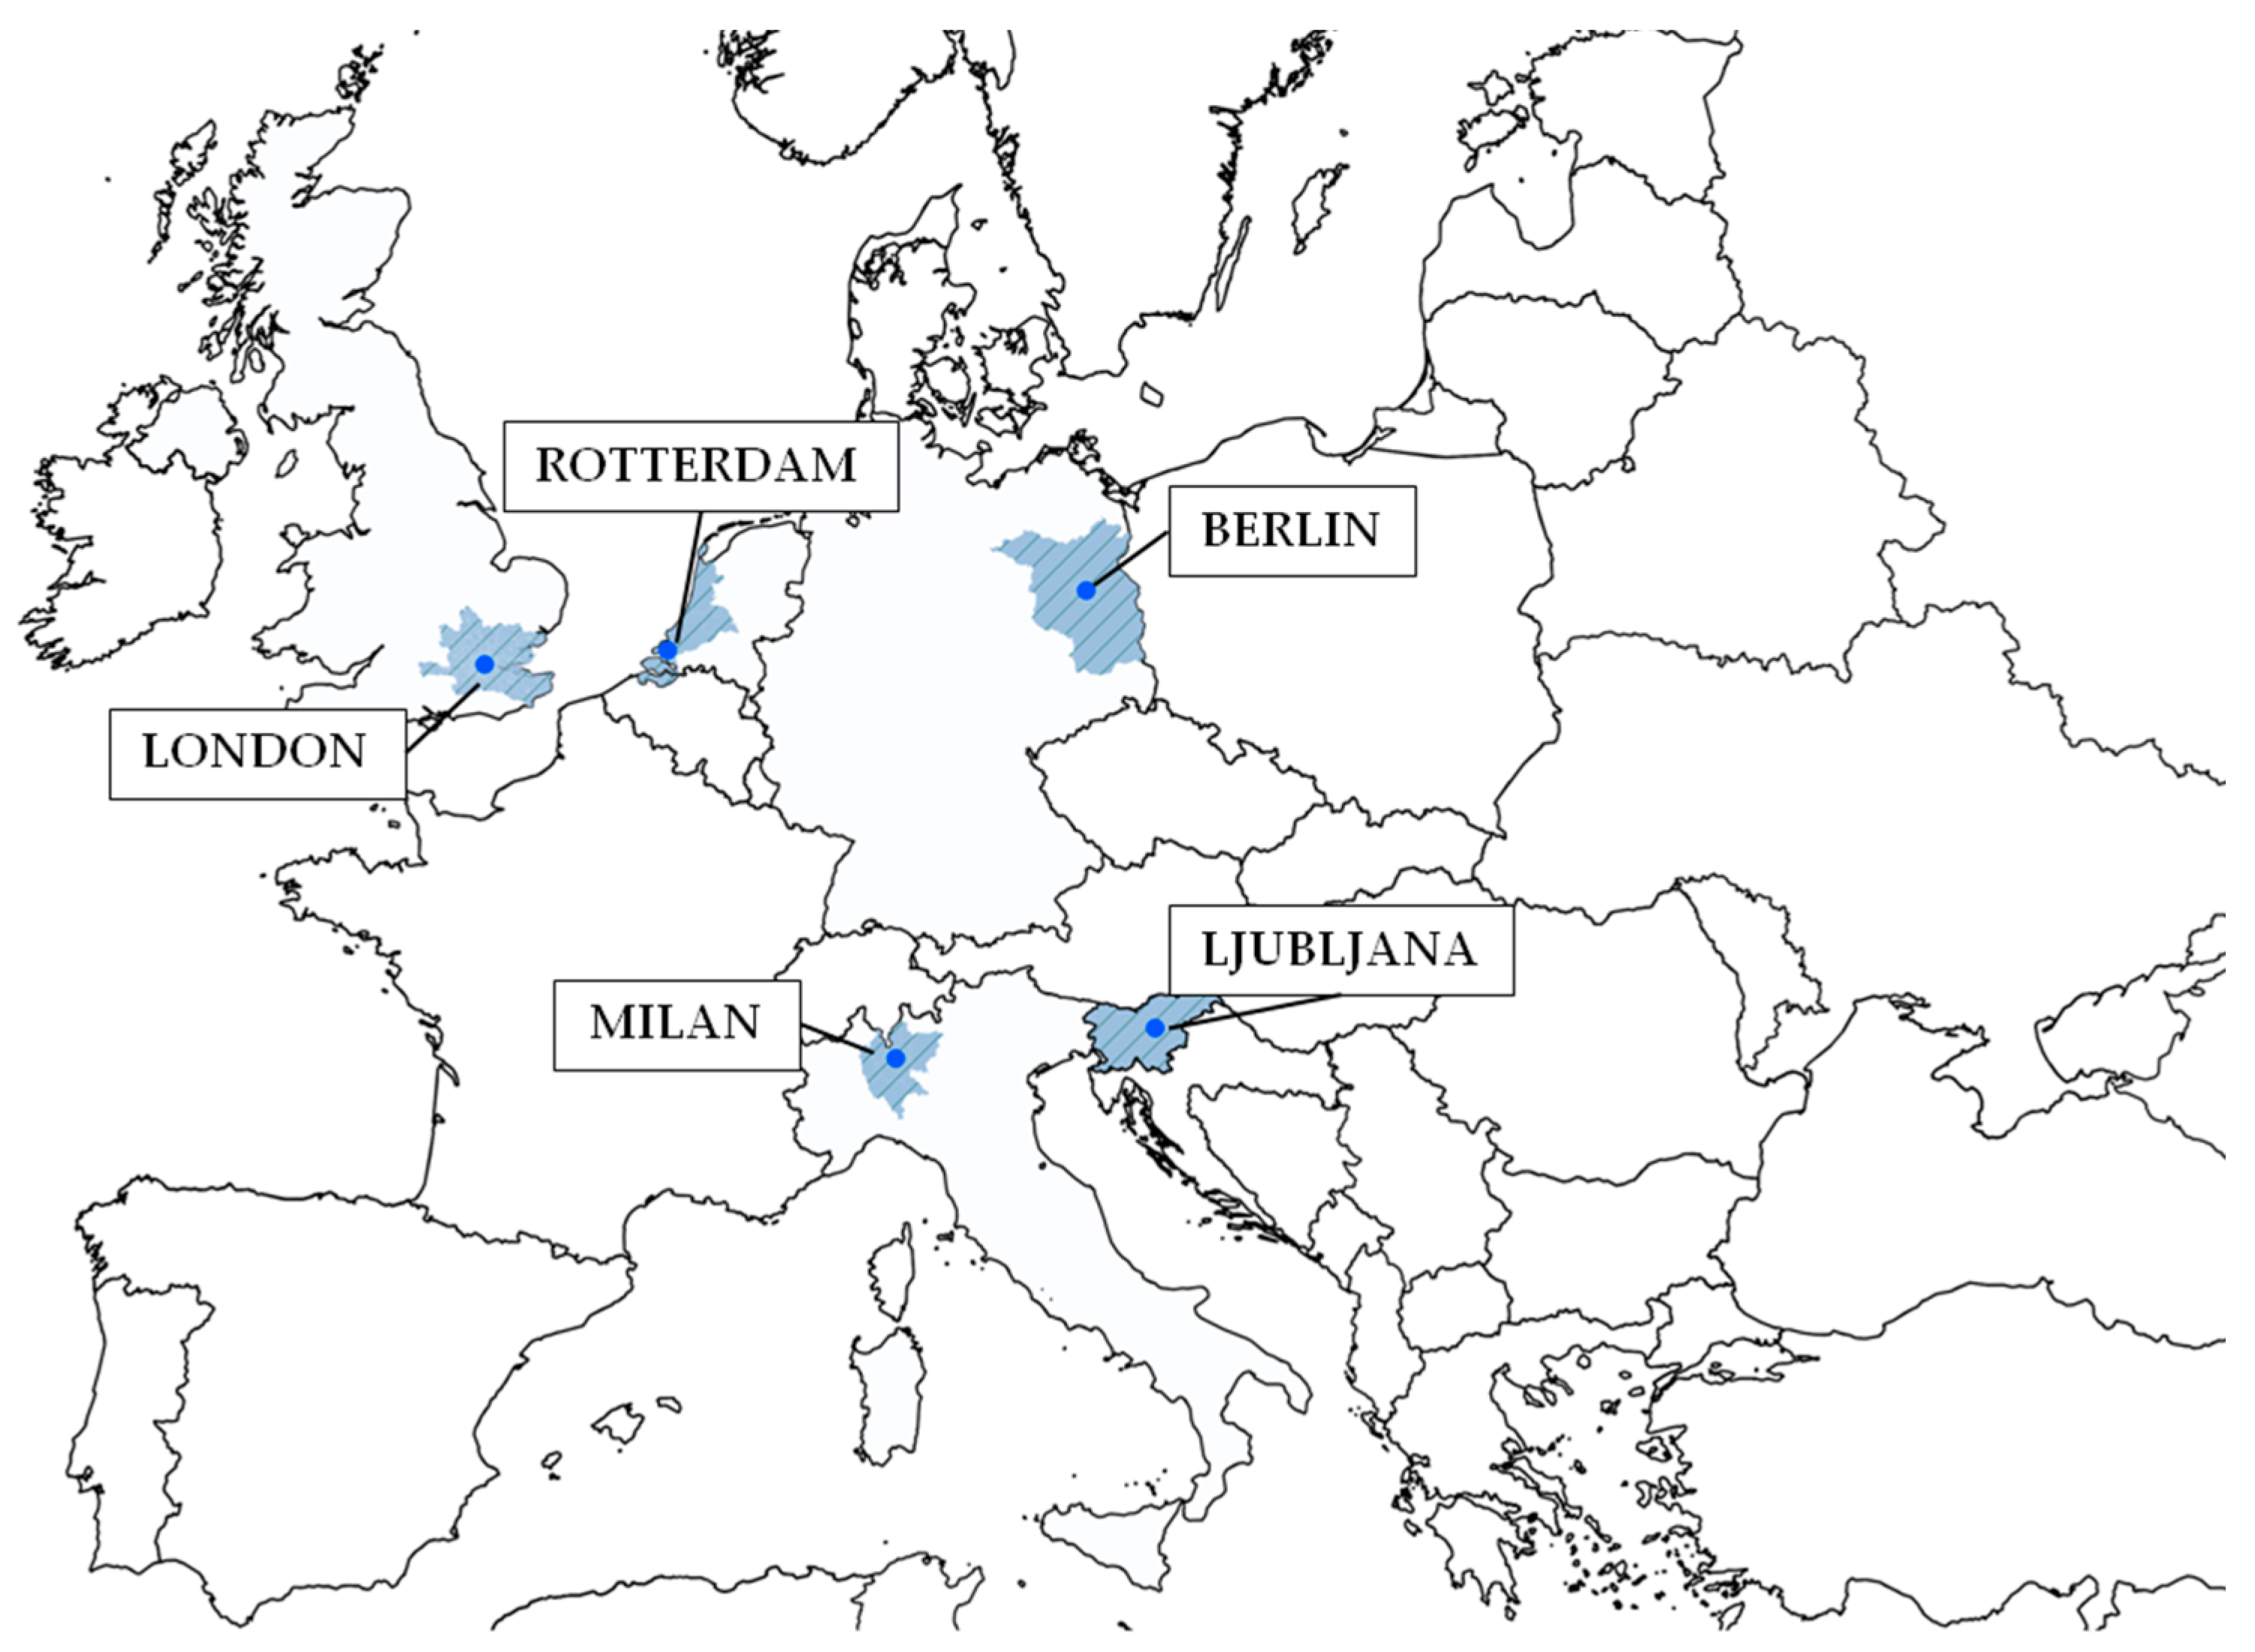
From this point of view, the model offers an analytical and comparative study of some specific regions, taken as examples for the application of the methodology. In particular, the European metropolitan regions presented here as case study areas are the concrete regional cases investigated by the authors during the running period of the FP7 FOODMETRES project, funded by European Union. In more detail, the analysis focused on five regions that differ in territorial and demographic features, as well as in the structural characteristics of the primary sector (
Table 1): the metropolitan regions of Berlin (Germany), London (United Kingdom), Milan (Italy), and Rotterdam (The Netherlands) as defined by the OECD [
59], and Ljubljana (Slovenia) [
50] (
Figure 1). In some cases, they correspond to specific administrative jurisdictions—e.g., Berlin-Brandenburg and Slovenia, while others are a set of lower-level administrative units (NUTS2 or NUTS3), which when scaled up are not officially recognized as a whole.
2.1. The Methodological Approach
A specific reference framework is provided to identify the economic role of different production sectors based on the formulation of simplified food balances at the regional level.
The first step of the approach consists of the identification of agricultural primary products to be considered in the subsequent phases of the analysis, to which both regional food supply and demand have been traced back. The choice of such staple foods relies on the necessity to ensure the linkages with the regional agricultural contexts. From this perspective, foods of non-agricultural (fish and aquaculture products) and non-local origin (e.g., coffee, tea, cocoa, and similar) have been excluded from the analysis, as well as those not strictly related to agricultural land use (i.e., soft drinks, cultivated fungi, and honey), or with a minor role in diet composition, such as products for special nutritional use or foods for infants and small children.
Subsequently, each raw product has been aggregated into further categories, namely the f commodity groups of (i) cereals; (ii) fruit; (iii) oil plants; (iv) potatoes; (v) sugar beets (representative of sugar crops in continental and temperate areas); (vi) vegetables; (vii) wine grapes; (viii) eggs; (ix) meat; and (x) milk.
2.2. Regional Food Supply
The quantitative analysis of local food supply is based on the actual regional production pattern, as surveyed in either regional or national statistics. Two different approaches were adopted to quantify the supplied amounts of primary products, according to their origin. The total production (t/year) of each plant-origin commodity group is the result of
where
a is the agricultural areas (ha) and
y the average yields (metric tons/ha) of their respective individual raw products
p.Concerning foods of animal origin, the supplied amount
S (t/year) of each animal product
b depends on the function
B:
which combines the
h animal heads (number of heads), the productivity per head (t/head),
k, and, in case, the slaughtering yield
g (dead weight/live weight, %).
2.3. Regional Food Demand
On the demand side, the food consumption pattern was adopted as a proxy for food demand. Data collected by national nutritional surveys [
70,
71] were used in this sense. Given the food consumption provided for different age classes, a further assumption was made to allow a comparison between the same age classes across different areas. The analysis was then performed based on the dietary habits of the adult population (18–64 years old) only: their respective food consumptions were imputed to the regional population as a whole, of which they represent the largest proportion.
Thus, for each city region, the annual consumed amount (
D, t/year) of different food products (
s) was back transformed into the corresponding amount of primary product
p:
and then aggregated into the aforementioned
f commodity groups:
by the combination with regional population (
n) and, if necessary, a suitable conversion factor (
ty, dimensionless) to express the amount of primary product contained in the final product.
2.4. Relationships between Food Dimensions
From the comparison of both the food dimensions, a simplified economic balance was introduced to describe the use of local resources only for food production. In this sense, the Economic Balance Index (EBI, dimensionless) (Equation (5)) was used to depict the economic performances of each productive sector:
where
PPp is the farm-gate price (in €/t) of each primary product. A five-year mean (2009–2013) was used to quantify raw products’ prices, with the aim of reducing the impact of their volatility on the final result. Apart from both interregional and international trade exchanges and agricultural value added, this approach indicates the potential to reinforce and strengthen regional economic viability and identifies how much the local productions satisfy the local demand, as the results of the value assumed by the index. Accordingly, an economic deficit (i.e.,
EBIf < 1, henceforth DEFICIT) or an economic surplus (i.e.,
EBIf ≥ 1, henceforth SURPLUS) may be determined for each commodity group.
It must be considered that agricultural practices are not only intended for food production. Rather, other primary activities—from floriculture and nurseries to the cultivation of energy crops—make use of the same productive factors, especially of agricultural land. Consequently, the specific contribution of each food production sector (Relative Importance over Supply,
RISf, dimensionless) (Equation (6)) to the regional economic viability emerges in comparison with the production value generated by agriculture as a whole:
with
o the aforementioned other activities and
PPo their respective producer prices.
In a similar way, it is possible to quantify the production value corresponding to the pattern of food demand, as well as the shares of the total value thus identified as attributable to each commodity group (i.e., the Relative Importance over Demand,
RIDf dimensionless):
Once again, the comparison of the two elements enables a deeper understanding of how the local and global dimensions of the food system are related. The ratio between Equations (6) and (7), i.e., Market Orientation Index (MOI, dimensionless), defines the specific market orientation of different staple food groups:
The opportunities to be locally consumed or mainly commercialized on and through more global markets in fact depend on the relative economic importance of a product in the respective sector, in comparison with the role it plays in local consumption. Therefore, the values of the respective indexes emphasize the levels of openness to markets of different sectors. In this regard, two main situations were distinguished based on the different proportional relations between the elements:
the prevalent orientation to global markets (, henceforth GLOBAL) is typical of the productive sectors that mostly contribute to the formation of the agricultural value. This case proves the competitiveness of the sector, as well as its prevailing openness to wider competitive markets;
the primarily local context-oriented behavior (, henceforth LOCAL) explicitly refers to sectors characterized by lower competitiveness and exposure to global markets, with a greater propensity to meet their own domestic demand.
Finally, each commodity group was positioned in relation to the combination of the two different economic aspects described. In this sense, four categories were identified, namely:
GLOBAL × SURPLUS ( and ): sectors with a remarkable competitiveness and a positive economic balance at the regional level, ensured by the higher amounts produced linked to the relatively scarce amount consumed;
LOCAL × DEFICIT ( and ), sectors characterized by a limited market competitiveness and simultaneously by a negative economic balance;
LOCAL × SURPLUS ( and ) sectors that, despite having a positive balance, are not able to weigh as much as they do on the demand side;
GLOBAL × DEFICIT ( and ). Sectors in this group have remarkable competitiveness but a negative economic balance at the regional level, owing to the relatively scarce amounts produced.
3. Results
With regard to the economic balance of their agricultural food production, case study regions show similar behaviors, as a result of both dietary and production patterns. In general terms, such levels are strictly linked to the prevalent urban nature of the areas, as no largely positive values are evident. As summarized in
Table 2, the various EBI for total food sectors range between the minimum value of the London region (0.19), and the perfect balance observed in Berlin-Brandenburg. This means that in the former case food demand prevails over supply and the productive pattern is not sufficient for meeting the respective demand. Conversely, the latter situation indicates the large importance of the agricultural production, which is able to satisfy the regional food demand. Although EBI for total agriculture (food + non-food) depends on economic surpluses to compensate for deficits in other sectors, it does not specify the features of each individual commodity group.
At this level, a positive economic balance for a food category does not necessarily identify the group itself as the product of agricultural specialization; rather, the number of commodity groups with a favorable EBI indicates whether the primary production is diversified or not. In the German case study, the large expanse of agricultural land around Berlin provides heterogeneity in its production system, as demonstrated by most of the food products being characterized by a positive EBI, from cereals (1.82) to oil crops (4.37). Different conditions are seen in other metropolitan regions. With regard to the London area, the large demand for food from the urban population is not adequately met by the productivity of regional agriculture. Despite the significant availability of agricultural land around the city and its conurbation, the features of the agricultural system are not evident at first glance. In this case, the resources (i.e., agricultural land) used are mostly intended for some products that are cultivated in a widespread manner and show significant economic surpluses, namely sugar beets and oil plants. On the other hand, other cultivations are practiced as well: no significant differences in the EBI can be found among these commodity groups, indicating a quite heterogeneous production pattern for the rest of the products.
Regional agriculture in the Milan area specializes in cereal cultivation and in the milk and dairy sector. This causes the respective economic balances to be more positive than those for other food categories. In contrast, the other categories do not fulfill their respective demand, as is particularly evident for potatoes, sugar beet, and fruit.
Similarly, the Ljubljana region is characterized by a greater orientation of agriculture towards cereal cultivation (the highest EBI in the region) and dairy cattle breeding. In contrast, site-specific conditions are not suitable for the cultivation of other crops of temperate or continental origin; a demand for them is, however, expressed, leading to EBI equal to 0, as occurs for wine grapes in most regions. In the case of the Ljubljana metropolitan area, such a peculiarity can be found for sugar beets. The reasons behind this result are to be traced back to CAP (Common Agricultural Policy) implementation: factories closed after subsidy payments were available for closing production. Despite opposite conditions, a more favorable agricultural area/people ratio (
Table 1) ensures a more positive economic balance for the region.
The Rotterdam region shows marked similarities with the Italian case study, in terms of both demographic and territorial features (
Table 1), as well as due to the presence of a highly specialized primary sector. In this sense, different agricultural land use leads products that traditionally characterize Dutch agriculture to gain economic importance: horticultural food crops (EBI = 2.84) and the milk sector (1.84). In addition, the large-scale production of sugar beets, especially in the northern part of the region, ensures its oversupply, with an EBI that is one of the highest among all the case study areas (3.41). The productive pattern thus affects the compliance of the food supply with demand; at the same time, the economic balance of the whole agricultural sector and its performance are also influenced by other land-based activities not intended for food production. Though involving just a minor portion of the available agricultural area, their role at the regional level emerges as fundamental in ensuring economic viability. Observing the composition of the production value, as shown in
Table 3, this is still particularly evident for the Rotterdam region.
It is noteworthy that, in this area, a very high level of production characterizes the production model, which is consequently able to hold a largely positive agricultural economic balance (EBI > 0). In this case, the economic performance of agriculture as a whole mostly relies upon the value generated by non-food products (11.5%), especially flower cultivation (7.9%), and underlines their decisive role in shifting the regional EBI to a positive value. Such a contribution, though less evident and more limited, can also be found in the other case study regions. In the metropolitan area of Berlin, the cultivation of crops for bio-energy production (3.5% of production value) increases the economic viability of agriculture, with the EBI rising to 1.03. Likewise, in Slovenia nurseries contribute to 2.9% of the total, and allow an increase in the index of the same amount. In the Milan area non-food production generates the highest value after Rotterdam, whereas in London, it is rather diversified, with the major contribution from other arable crops and perennial plants. Despite such deviations, some similarities among regions can be found, particularly from the observation of profitability per hectare. This approach makes it possible to avoid scale dependency and facilitate a comparison among different areas. As concerns food crop cultivation, Milan and London show similar values (average of 757 €/ha), not too dissimilar to the Slovenian value; other areas are characterized by a much lower (Berlin) or higher (Rotterdam) profitability. On the contrary, larger deviations are seen in livestock production: in this case a trend is not proportional to absolute values, due to both the different production pattern and the available agricultural area.
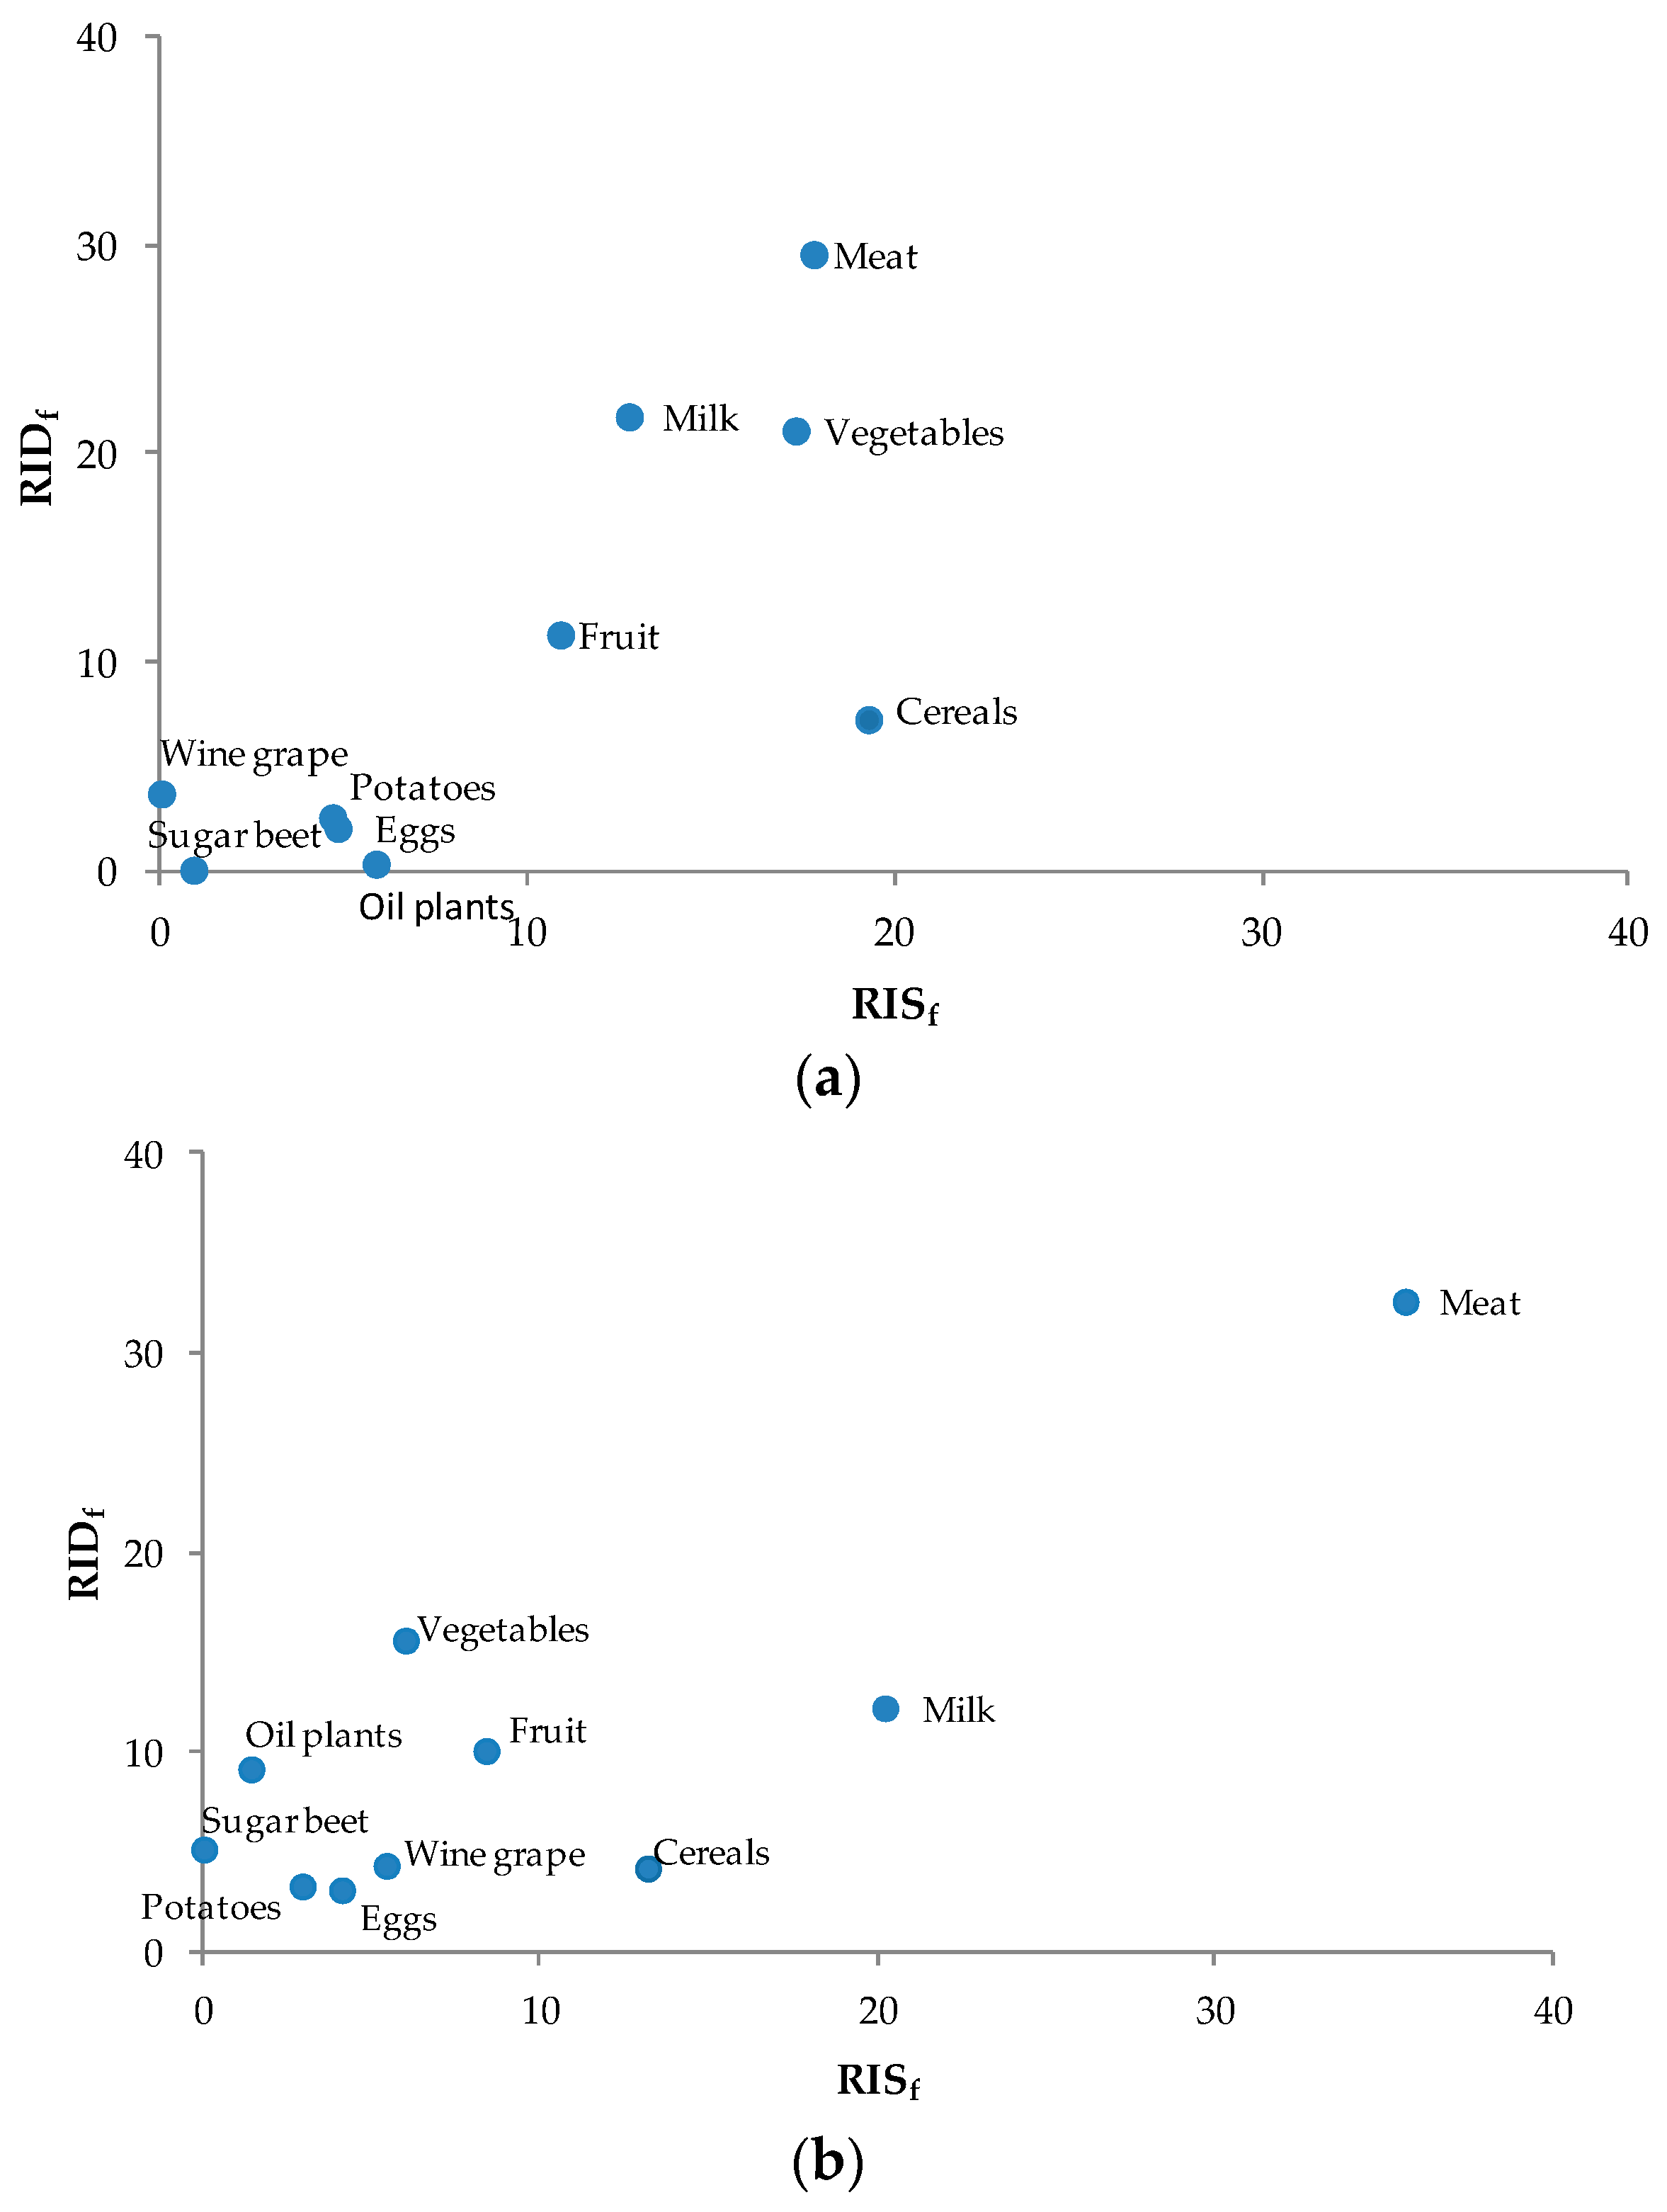
In a similar way, each individual food category contributes differently to the total value. In this sense, the share attributable to different sectors reveals the relative importance of commodity groups on both the supply and the demand side. With respect to case study areas, a prominent role is played by animal products, particularly the meat and milk sectors. Such products represent more than 70% of the value supplied in the Berlin (71.9%) and Milan (72.1%) regions, with a minimum in the London area (35.3%) (data not shown). Here, the total offered value is more diversified. In this case, important roles are played by meat and vegetables, which represent 17.8% and 17.3% of supply share and 29.6% and 21.8% of demand share, respectively; conversely, cereals contribute to 7.3% of demand but more than 19% of supply (
Figure 2a). In the Ljubljana metropolitan region (
Figure 2b), livestock meat is the sector to which we can ascribe the largest part of the production value, from both the demand and the supply side. The importance of fruit and vegetables instead prevails in the demand, while, conversely, cereals and milk represent over a third of the production value generated by total agricultural production.
Along with other products of animal origin, higher levels of openness to market characterize these same sectors (
Table 4), irrespective of their self-sufficiency level.
Sugar beets in London, which play a prominent role in the supply side, have the highest MOI in the region (11.17), ranking second after oil plants (15.76). The latter similarly show the highest value of MOI (4.23) in Berlin-Brandenburg, also thanks to the large use of oil plants for energy purposes. In this region, most of the food categories are global market-oriented; in contrast, in the Milan metropolitan area, the propensity towards local markets prevails, except in the cereal and milk sectors. This is a further confirmation of their competitiveness, as practically demonstrated by the importance assumed outside the region and worldwide of their respective processed foods, especially dairy products. In the Rotterdam metropolitan area, the range of commodity groups with greater propensities to target the global market is very limited, namely horticultural products (i.e., vegetables and potatoes) and sugar beets, with MOIs markedly different from the others.
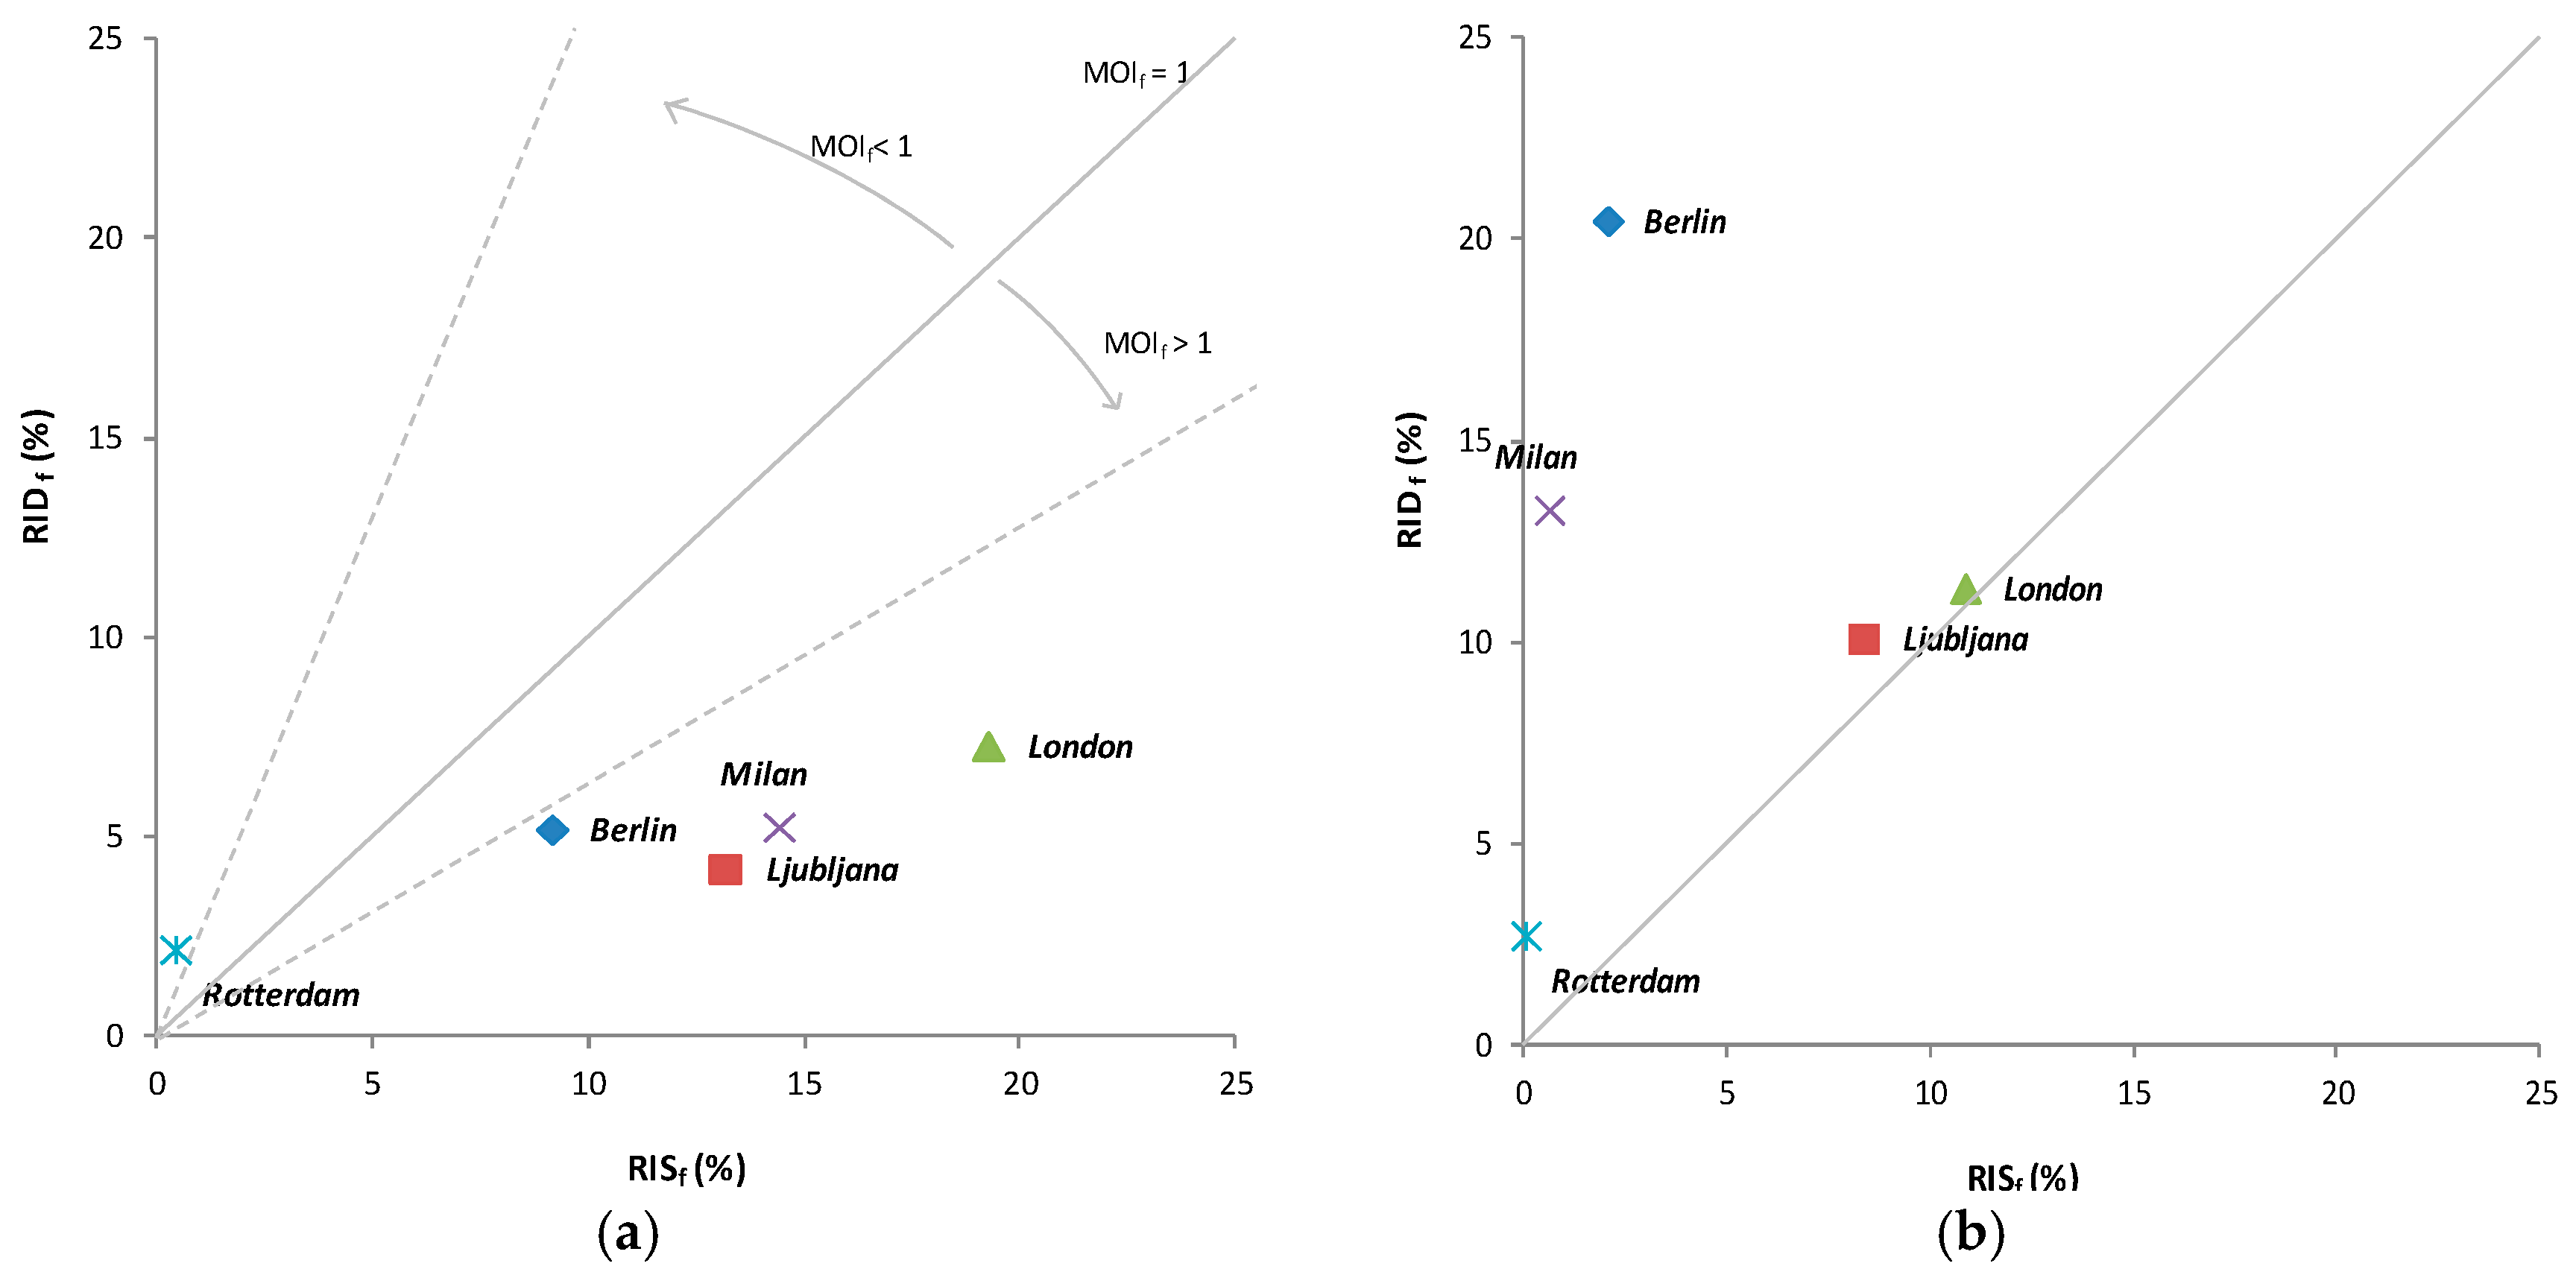
Some commonalities across regions are noticeable. In general terms, the cereal sector is more frequently oriented towards the global market. This is valid with the exception of the Rotterdam metropolitan region, where the economics of cereal production reveal its lower competitiveness compared to other areas. This becomes evident when a graphical representation of such an assertion is provided. MOI can in fact be interpreted as the slope of the line joining, in a scatter graph, the point P(RIS, RID) with the origin O(0,0) of the Cartesian axes. The greater the slope, the less the MOI. Observing
Figure 3a, this means that moving from points identifying Ljubljana or London to Milan, Berlin, and Rotterdam, the openness to market of the sector progressively decreases. Such an approach enables an easy comparison among either regions or commodities, especially when manifold elements are simultaneously plotted.
Conversely to cereals, the fruit sector (
Figure 3b) turns out to be one of the least competitive, with a larger propensity to local markets at both the individual regional level and in the multi-regional context as a whole (
Table 5). In all the case study areas, the economic importance on the demand side prevails over the generated value, likely resulting in a greater orientation aimed at satisfying local markets rather than global ones. This behavior is particularly evident in the Rotterdam, Milan, and Berlin regions, for which RID values are 10, 20, and 39 times higher, respectively, than RIS. Similar MOI values are observed in the Ljubljana and London areas, a condition that leads such production to be more competitive if compared with other regions.
The positioning of different food groups according to both dimensions, i.e., EBI and MOI, (
Table 5), enables a further comparative analysis of the case study areas. It describes how each group is composed of heterogeneous products, in terms of both typology and number. In most cases, it is not possible to associate a food category with a precise market orientation or with a particular economic balance. However, some general considerations can be noted and a correspondence exists between the values of indexes. This relationship is particularly evident in the Rotterdam and Berlin regions, where all the commodity groups with an economic surplus are coupled with a prevalent exposure to global markets, while a lower self-sufficiency level occurs alongside a scarcer competitiveness. Some exceptions to this general behavior can be noted in other areas. In the Milan metropolitan region, the milk sector, though characterized by a deficit in its economic balance, is mainly global-market-oriented. The same is occurring in Ljubljana and London, with regard to the number and typology of primary products included in the GLOBAL-DEFICIT group: meat and wine grapes in Slovenia; and cereals, eggs, and potatoes in the London area.
4. Discussion
Defining the features of agricultural systems in city regions gives the chance to strengthen specific food or agricultural productions and revitalize the overall economy, and demonstrates the complexity that characterizes agricultural systems.
From the analysis of the economic performance of different agricultural sectors, the prevalent urban nature of the areas emerges as a first concern, as no largely positive values of EBI are evident, neither for food production nor for agriculture as a whole. The overall performances of urban agro-food systems do not reveal, however, the peculiar features of each individual commodity group. At this latter level, the analysis performed notes the peculiarities of each regional system, reflecting their production capacities and depicting the specialization of the primary sector. For instance, the Milan area is characterized by a polycentric structure, where a higher population density is coupled with a scarce extent of agricultural land and where intense competition over land use occurs [
72]. As a consequence, agriculture as a whole, though a deeply rooted activity, can only provide scarce production to meet demand. Despite this, the EBI at commodity level reflects its specialization in both cereal cultivation and the milk sector, thanks to the presence of the main rice-cultivated area in Europe and the regional provision of over 10% of national milk production.
In addition, the geographic dimension of food production–consumption relationship becomes more evident. From the observation of EBI, we see the interconnections between the local dimension of food production and the global level, where these products are mostly destined. With particular regard to the vast range of staple foods considered, the analysis notes the peculiarities of each regional system, given the economic balance affected by the possible excess of supply, rather than by farm-gate prices. In the light of the assumptions made for the definition of the respective index, the EBI itself—irrespectively of the commodity—is basically equivalent to the level of regional food self-sufficiency, and indicates the potentialities of the region in fulfilling specific food requirements with the use of domestic agricultural resources only. The EBI approach may thus denote the origin of products, as well as the simultaneous dependence on other production areas and/or the propensity to commercialization on a global scale. On one hand, a positive economic balance highlights the suitability for overproductions to be commercially exported from the region; on the other hand, what the regional system cannot provide must be imported from elsewhere. This is, on the whole, consistent with the current context of a globalized world, where the enhancement of the local dimension, though often encouraged, has to face the challenges of interconnected and globalized markets. Though local production systems are deeply rooted in the local territory, they gain vitality from their relationships with larger markets and exports abroad. This is particularly evident for the areas analyzed in this paper, especially Rotterdam and Milan area (part of the Lombardy region), which are two of the most important food hubs worldwide and the main commercial partners in agriculture for most European and extra-European countries [
73], with EU Member States well integrated into world markets. This generally leads to further exacerbating land displacement between food production and consumption sites [
74]; this fact, rather than having a macro-economic importance—that remains linked to national level and accounts—acquires geographic, environmental, and cultural significance, implying different pressures on land use, flows of commodities, transports, and all consequences related to land displacement itself. As Noleppa and Cartsburg [
75] pointed out, however, the information base on agricultural self-sufficiency is very weak. This research demonstrates the possibility to curb this limit by making use of a combination of secondary data, sourced at both the supra-national and the regional level; still, it should be considered a further attempt to contribute in depicting such levels in European areas, which provides information at a spatial scale (i.e., the regional level) not usually investigated.
Nonetheless, in developed countries, food self-sufficiency is not a policy objective aimed at achieving food sovereignty; rather, it is recognized that it can support the enhancement of local agricultural systems, as required by consumers, the general public, and food movements, and that the implementation of territorial policies is consistent with the opportunity to significantly contribute to local markets. This could be strategic to the maintenance of peri-urban agriculture, strengthening farms’ resilience and the role of peri-urban agriculture itself in providing sufficient amounts of raw products to meet consumer demand.
From this perspective, exploiting local resources may enable a readjustment between production and consumption sites. However, the presence of heterogeneous conditions within a city region has repercussions on the overall performance of the agricultural system and reveals the relationship between food supply and demand as a whole. Thus, the chance to enlarge the possibility of finding food resources within regions largely relies on manifold factors, strictly linked to exogenous and endogenous conditions in the agricultural and food systems. Geographic limitations, orographic (e.g., slope and exposure) and soil conditions, the availability of natural resources (e.g., land and water), along with climatic and environmental variables in the region—which together over time have shaped both the production structure and agricultural landscapes worldwide—are fundamental drivers directing agricultural activities and ensuring adequate production and economic results. Such performances are also the result of a primary sector that is facing multiple constraints, from the expansion of metropolitan areas to the urbanization phenomenon, the diminution of arable land, and the multifunctionality of agriculture [
76], which affect its production capacities. In addition, market behavior, the rules within the food supply chain of a specific food sector, and the presence of agricultural, territorial, and environmental policies, risk management and other stochastic drivers may further affect the actual agricultural land use options and the food provisioning associated with them. As indicated in a working paper of the Presidency for the informal meeting of EU Agriculture Ministers [
77], the trend of self-sufficiency of sugar used in food production declined over time. This was a direct consequence of the reform of the sugar regime in the EU, and justifies the scarce production value associated with the regional production of sugar beet. In fact, Slovenia closed sugar beet production after subsidy payments were available for that. At that time, such a strictly political decision was criticized by farmers, who are now slowly organizing as after 2018 it will again be possible to grow sugar beet.
An alternative land use pattern has an impact on the other economic components investigated. Carrying out agricultural activities with a higher intrinsic value may strongly contribute to the economic viability of agriculture as a whole. Yet the ability to diversify agricultural activities and cultivations relies on multiple conditions, both internal and external (i.e., governance interventions and policies) to the agro-food system, and may benefit from urban–rural relationships. At the same time, the aforementioned territorial specificities and the actual possibilities of converting either agricultural or marginal land for food production and cultivation should be taken into account. Such possible scenarios impact on other economic dimensions and, in particular, as regard more specifically this paper, the components of the market orientation index (MOI).
With the analysis of market orientation, the focus on the economic dimension shifts from targeting an individual commodity group to viewing the entire productive system. Different production patterns, as well as changes in diet, would determine a different composition of the generated agricultural value, with consequent modifications in the economic role of the various individual productions. In this sense, the great interdependence among commodity groups emerges, with their final results significantly affected by the presence and the importance of the others. Irrespective of the amounts produced, each commodity group is characterized by a peculiar level of openness to the market, as indicated by the respective MOI. As a direct consequence, the related global component chosen to describe this behavior stands out for a different meaning of the local–global dichotomy. Rather than the geographic separation and interlinkages of agricultural production and food consumption, it better outlines the potential market extent at which products are placed. This points out the competitiveness of different agricultural food sectors. However, we can say that, at the regional level, such analysis better reveals that—given site-specific conditions—some sectors are less competitive than others.
Results in this sense are therefore to be explained in purely relative terms, in a comparison of different areas made possible by the use of specific index that avoids scale dependency. In addition, they don’t represent a precise and static condition. This is by virtue of the manifold factors involved in modifying both the production system and the consumption pattern, demonstrating the highly volatile nature of the economic characterization. These factors, however, are not noticeable in the short term, but rather can be observed in the medium and medium–long term. In this regard, for instance, the volatility of commodities’ farm-gate prices is a crucial element to determine market orientation and overall economic performance. Openness to the market, as introduced in this paper, is actually a general trend, given that in its computation volatility has been limited by using long-term average prices. The importance of a specific sector therefore depends on the economic system and price formation process operating in the supra-regional and international markets. Embarking actions and interventions in this matter is complex; individual farmers definitely play a subordinate role, as their limited room to maneuver allows them to autonomously decide only how to dispose of their immediately available resources. According to producer’s behavior aimed at maximizing profits, they can opt for different production decisions, affecting both production and economic dimensions.
The combination of MOI and EBI confirms the typical features of agro-food systems in Western countries: a strong specialization in some well-developed sectors mostly allocating products to global markets and others that are smaller and more targeted to local and regional markets. However, based on the evidence provided in this paper, the reconnection and the readjustment between food supply and demand may contradict the broader economic enhancement of regional production. At the same time, measuring the economy by current values and market prices fails to adequately capture the effects of non-market goods and values not proposed in the assessment—like healthy diet or clean rivers (i.e., natural and social capital)—on regional economic viability.
All the mentioned conditions should be considered by all the actors operating in the agro-food sector and by stakeholders within the governance and policy-making processes when adopting interventions to effectively exploit local resources and economically enhance the region. In this sense, the defined classification determines how the relationships between food supply and demand in urban regions are linked to one another in a complex structure composed of interactions between the local and global dimensions.
5. Conclusions
In the wider debate on food re-localization, the identification of best practices in the agro-food sector, as well as the assessment of their performance, their impact on sustainability components, and their contribution to achieving multiple political goals, requires adequate assessment and monitoring tools. The described instrument delivers relevant information on the food supply–demand balance, an ex ante assessment of changing scenario situations and the potential to optimize production. In fact, despite production choices mainly being driven by global market rules, new social pressures and discussions [
78] are emerging, as well as health and environmental concerns that could determine a different land use plan by defining what to produce, where, and how. In this regard, more research into the consequences of a transition from global to regional food production should be conducted. In this sense, the use of fact-finding instruments and preliminary analysis is strongly encouraged to verify the complexity of the relationships between food production and consumption and to indicate the potentialities, strengths, and weaknesses of the regional system. The economic assessment of the relationships between food demand and supply presented in this paper is particularly relevant for policies aiming at making the food security of urban and metropolitan regions more sustainable. The adopted approach introduces a novel perspective into this topic, by addressing the economic dimension of the regional (metropolitan) agro-food system. It offers a basic set of information about the agro-food system, revealing the relationship between the first and last step of the food chain at the raw product level. It has highlighted those sectors with a greater chance, compared with others, of territorial rapprochement either for environmental reasons or to simplify the supply chain in respect of consumer demand and favor the adaptation to a greater proximity to the consumer. Still, the data produced can help us to understand the system as it is and give advice on how to transition it to other forms of trade and supply chains. Finally, the element of market orientation, being non-scale-dependent, is particularly effective in the comparison of different areas.
Results from the methodological framework play a fundamental role in the identification of the strengths, weaknesses, and critical points of the regional agricultural system, aimed at providing robust information for policy and planning interventions targeted to both the agricultural and food sectors, with urban food planning approaches included. Given the dynamics and multiple actors operating in an urban environment, a comprehensive territorial policy able to address the challenges of food sovereignty and related issues should reflect the complexity of city region systems. At the same time, it must be pointed out that the adoption of specific initiatives by decision-makers—e.g., the promotion of short food chains and local products, or the valorization of specific production sectors and environmentally friendly practices—determines cascading effects on the territory and on its possible further socioeconomic development, with consequent impacts on the entrepreneurs potentially involved and on society, which expresses demand for food. Therefore, preliminary analyses such as that presented in this paper can assist stakeholders and policy-makers during the decision-making process in order to properly assess and/or manage social wellbeing and regional economic viability.


 ,
, 

