
Technology-Based New Service Idea Generation for Smart Spaces: Application of 5G Mobile Communication Technology


Abstract
:1. Introduction
2. Background
2.1. Technology-Based New Service Idea Generation
2.2. Value Innovation
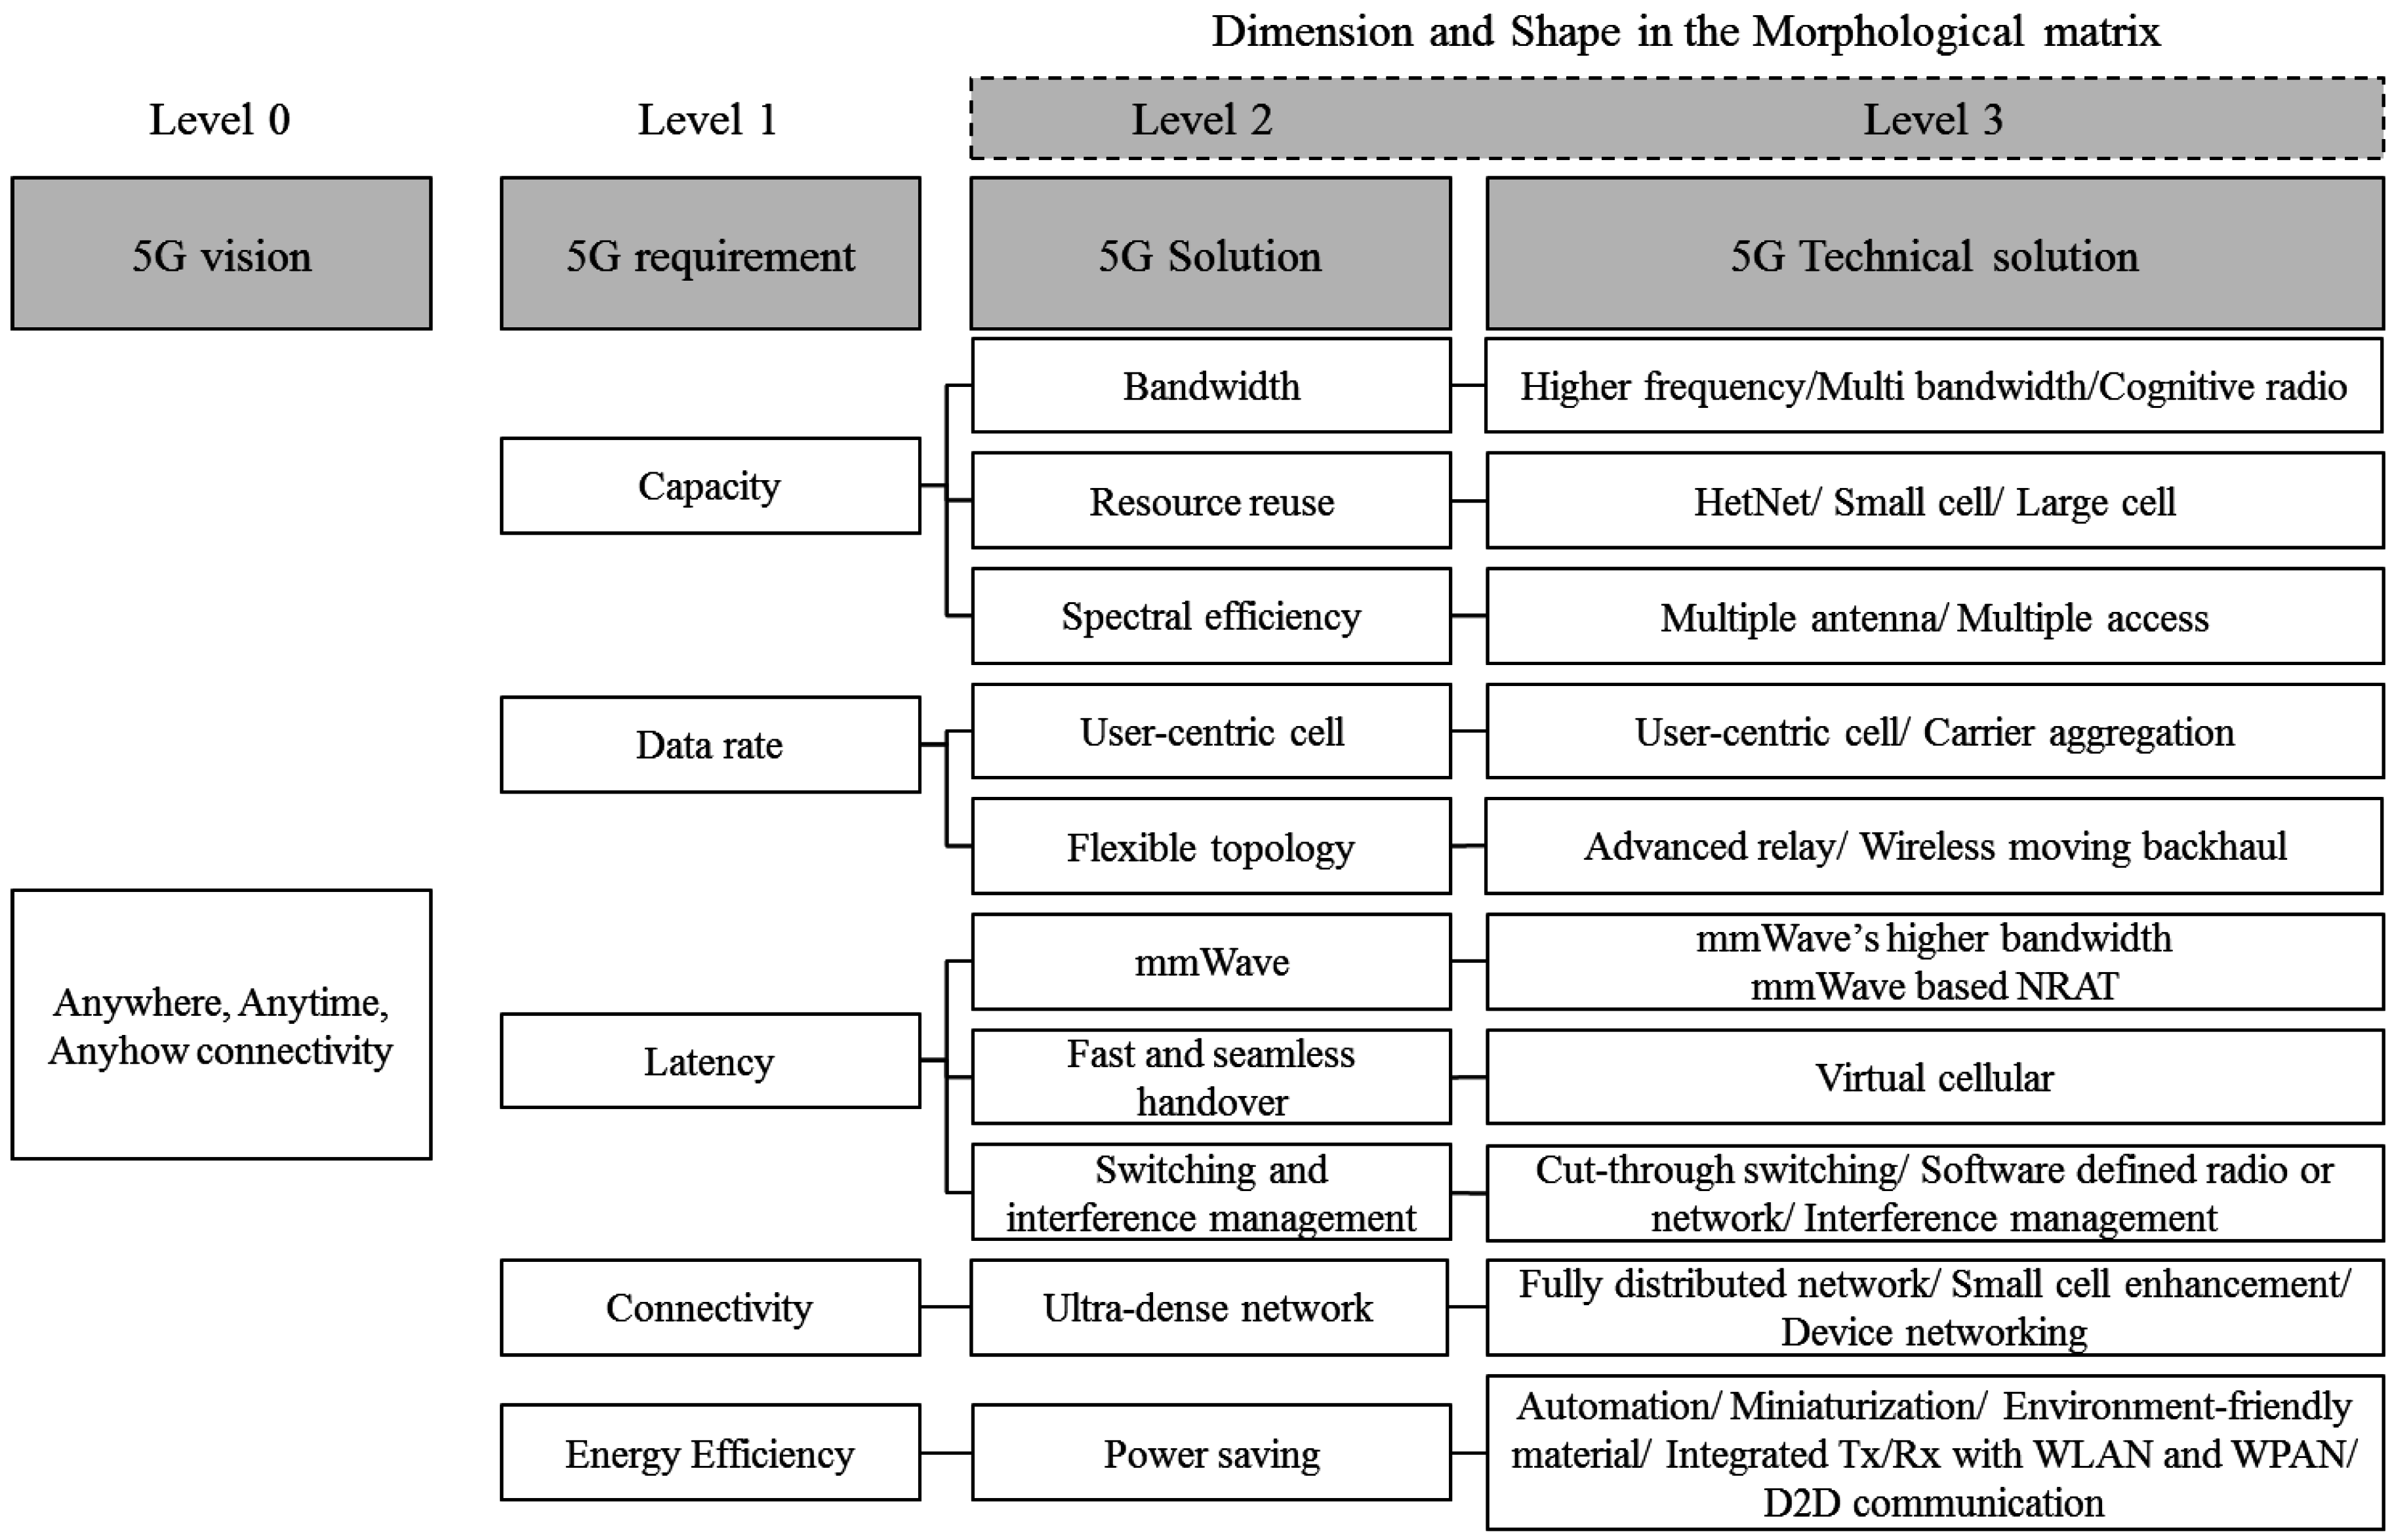
2.3. Morphology Analysis
3. Research Framework
3.1. Basic Concept
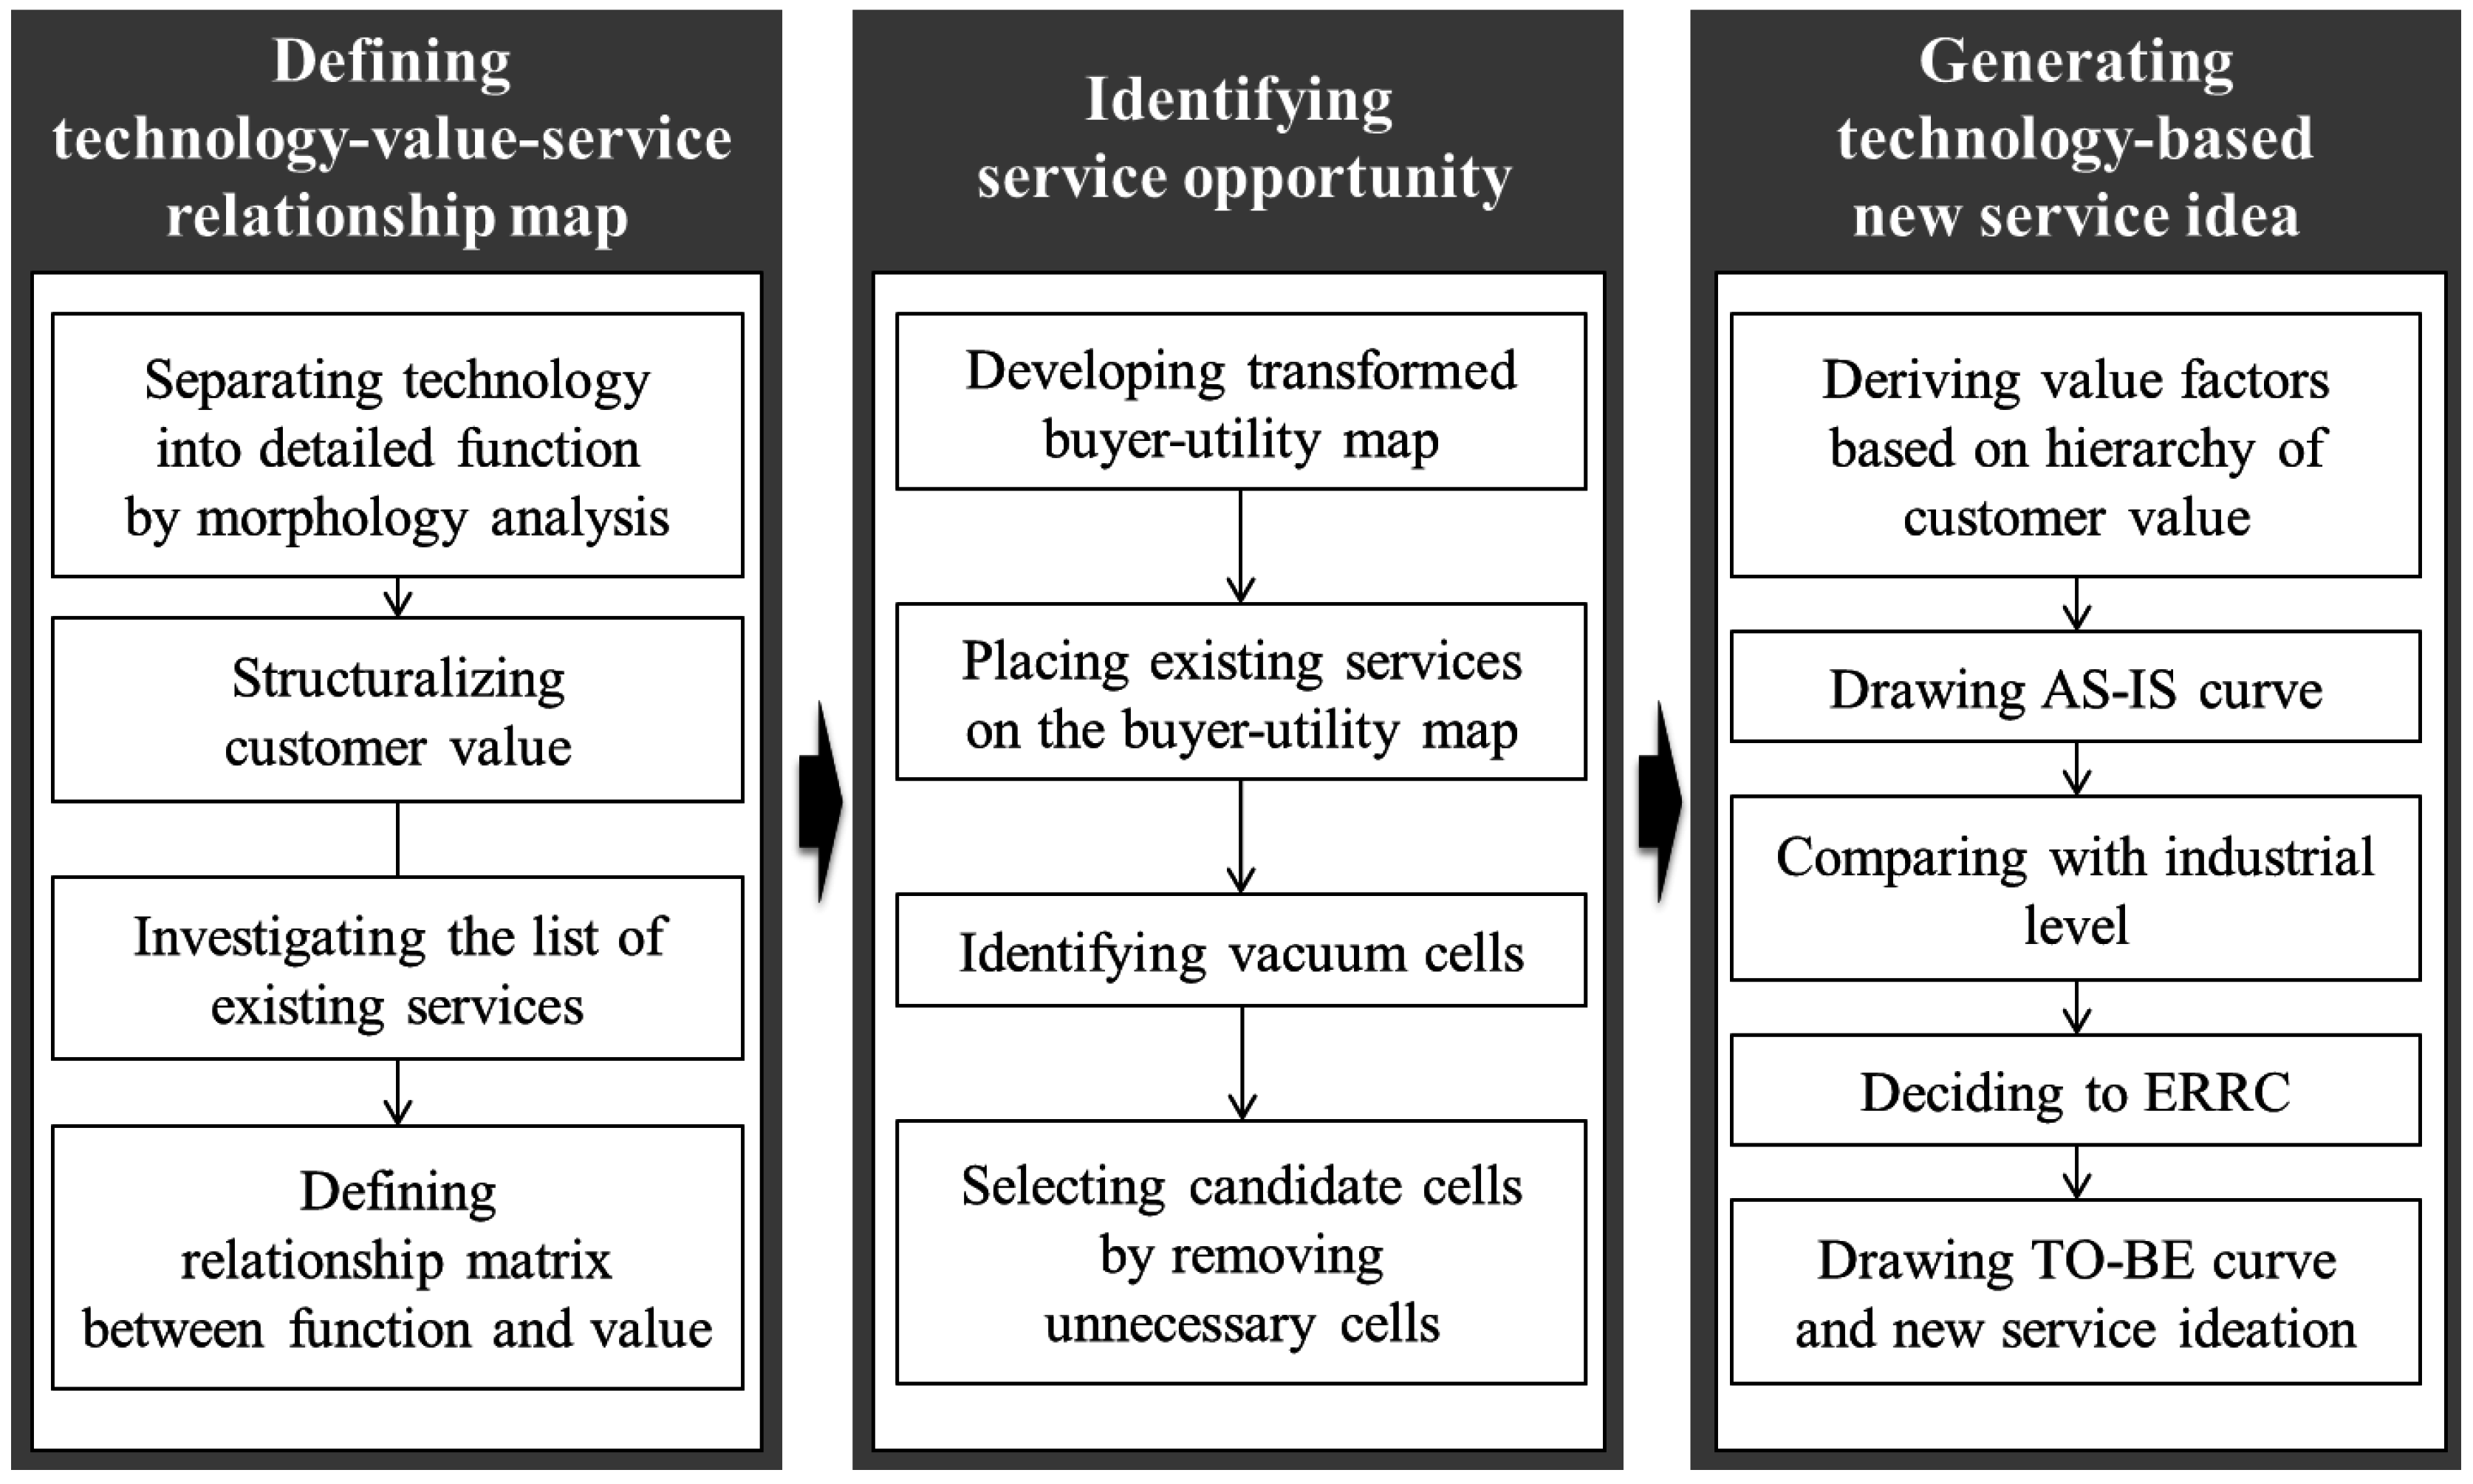
3.2. Overall Process
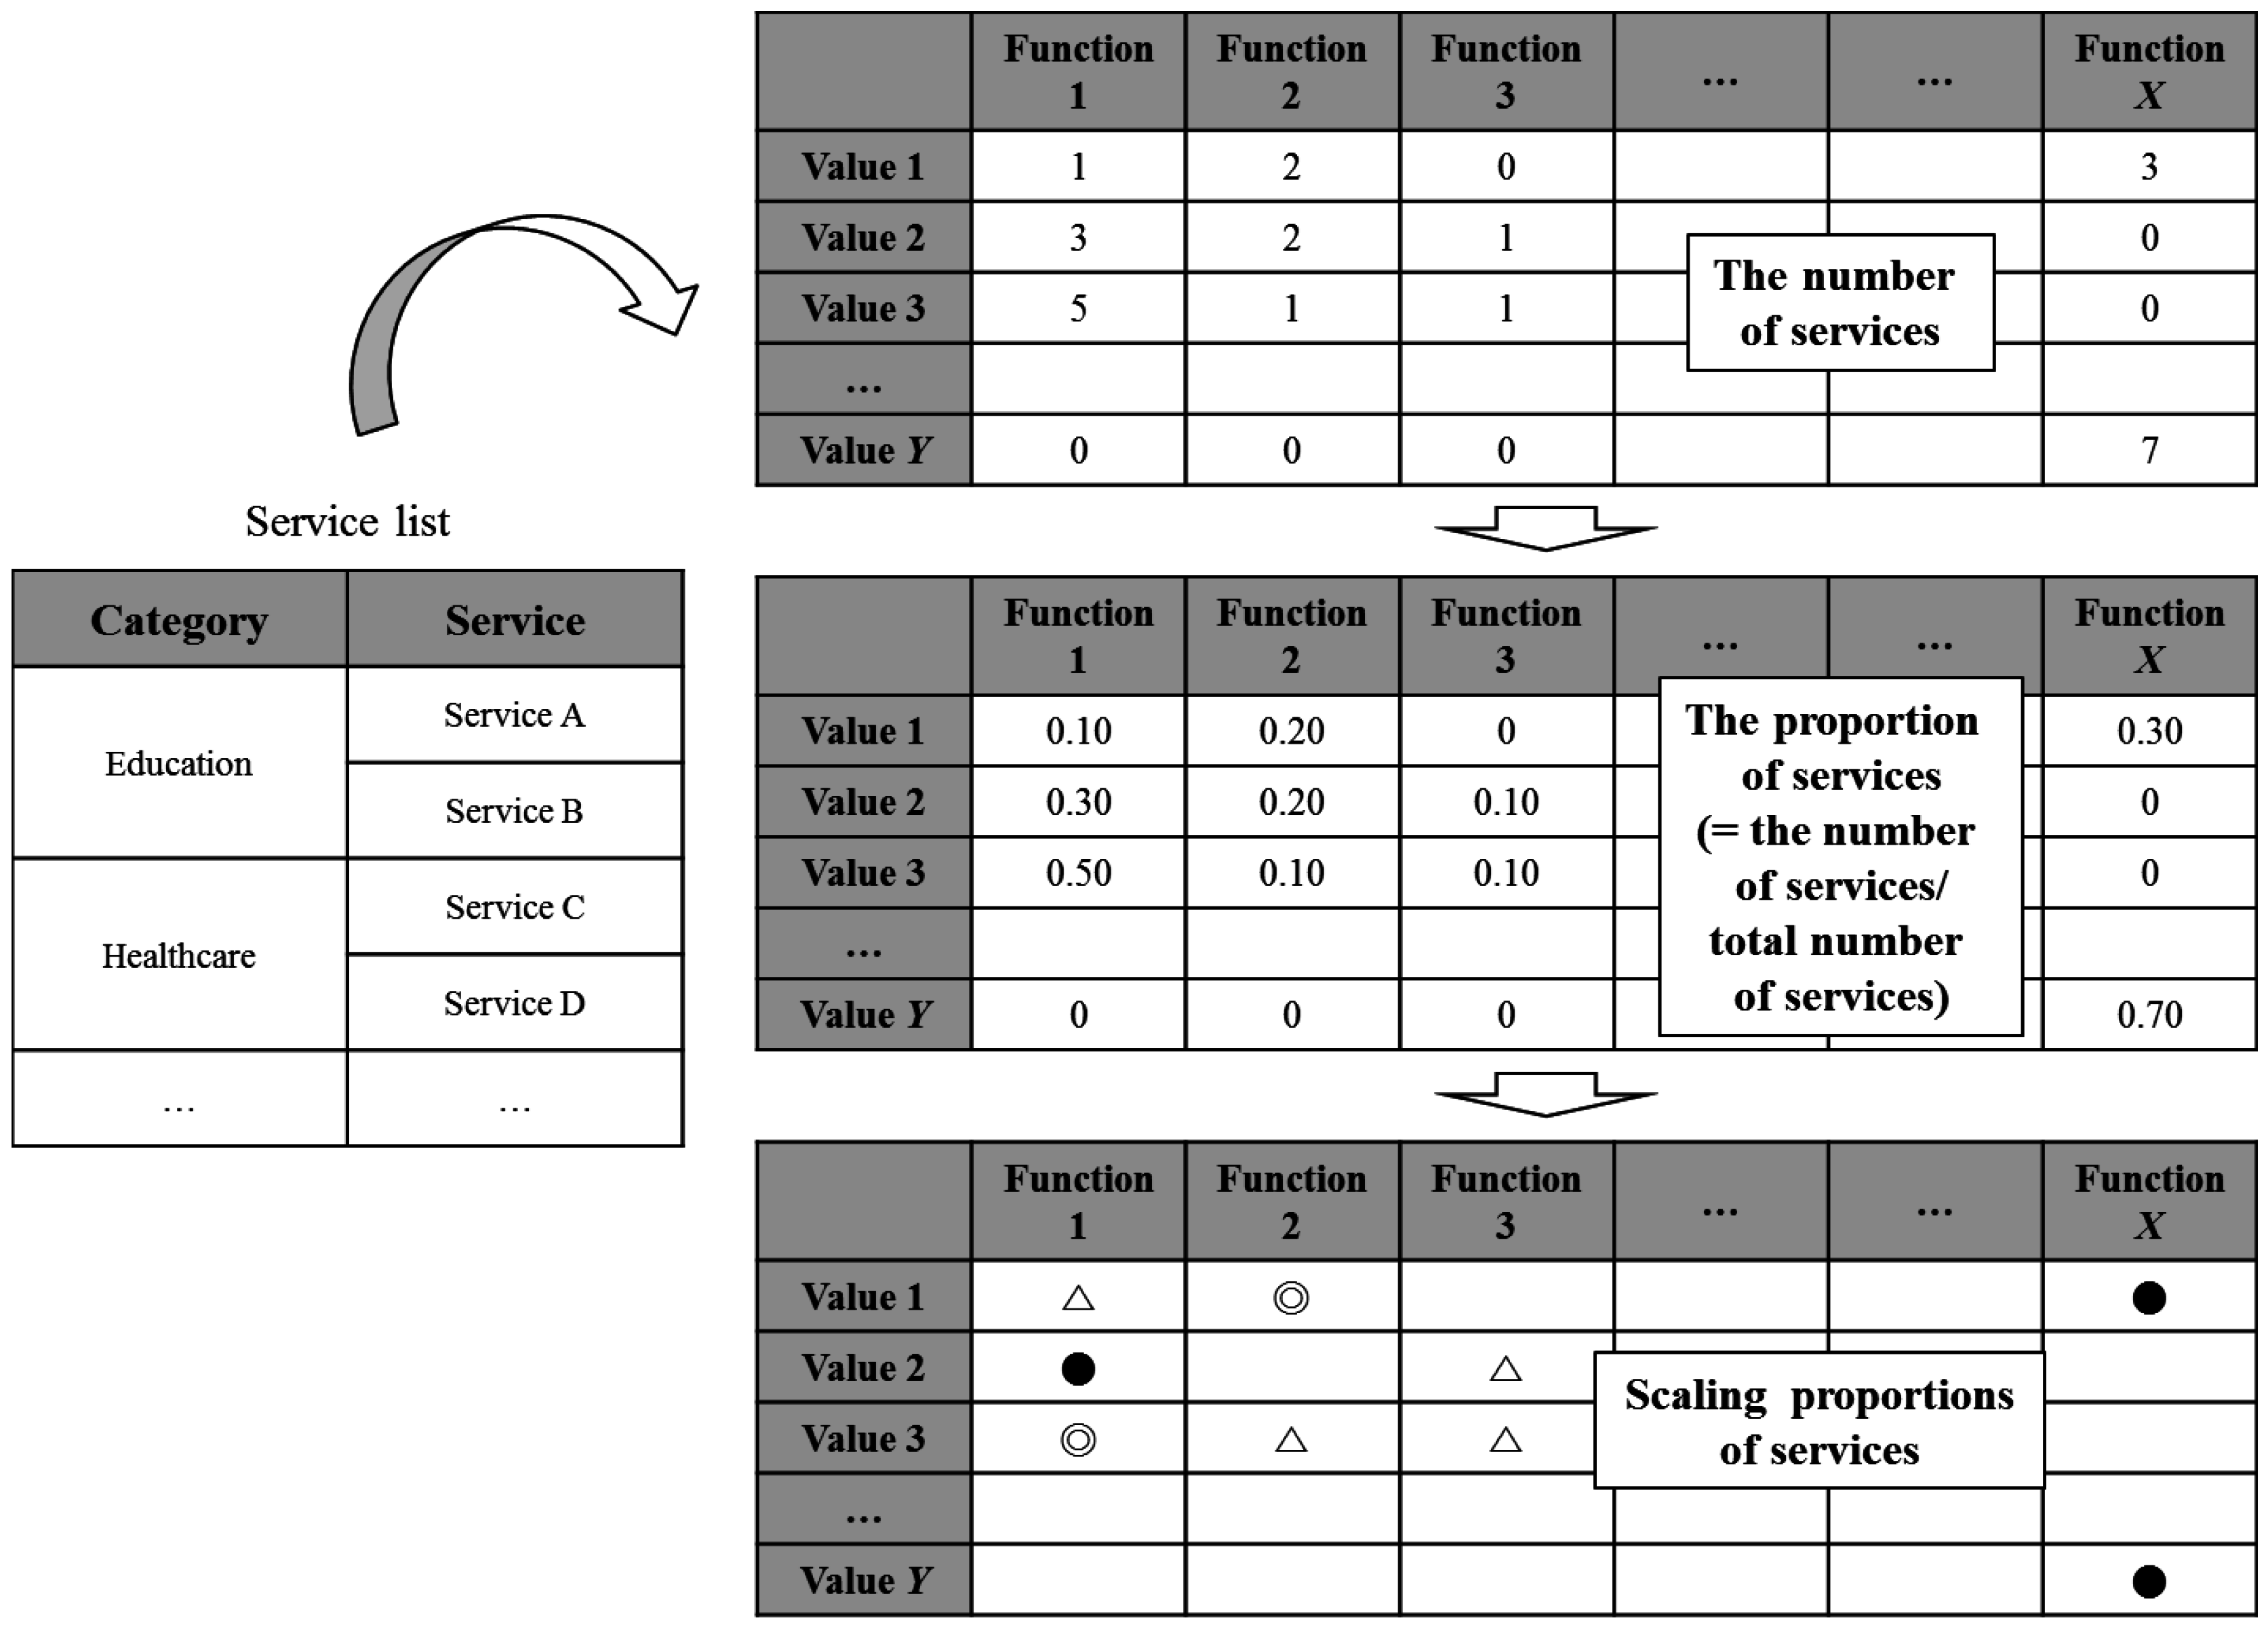
3.2.1. Defining Technology-Value-Service Relationship Map
3.2.2. Identifying Service Opportunities
3.2.3. Generating New Technology-Based Service Ideas
4. Generation of Technology-Oriented Services for Smart Spaces
4.1. Defining the Technology-Value-Service Relationship Map
4.2. Identifying Service Opportunities for Smart Spaces
4.3. Generating New Technology-Based Service Ideas
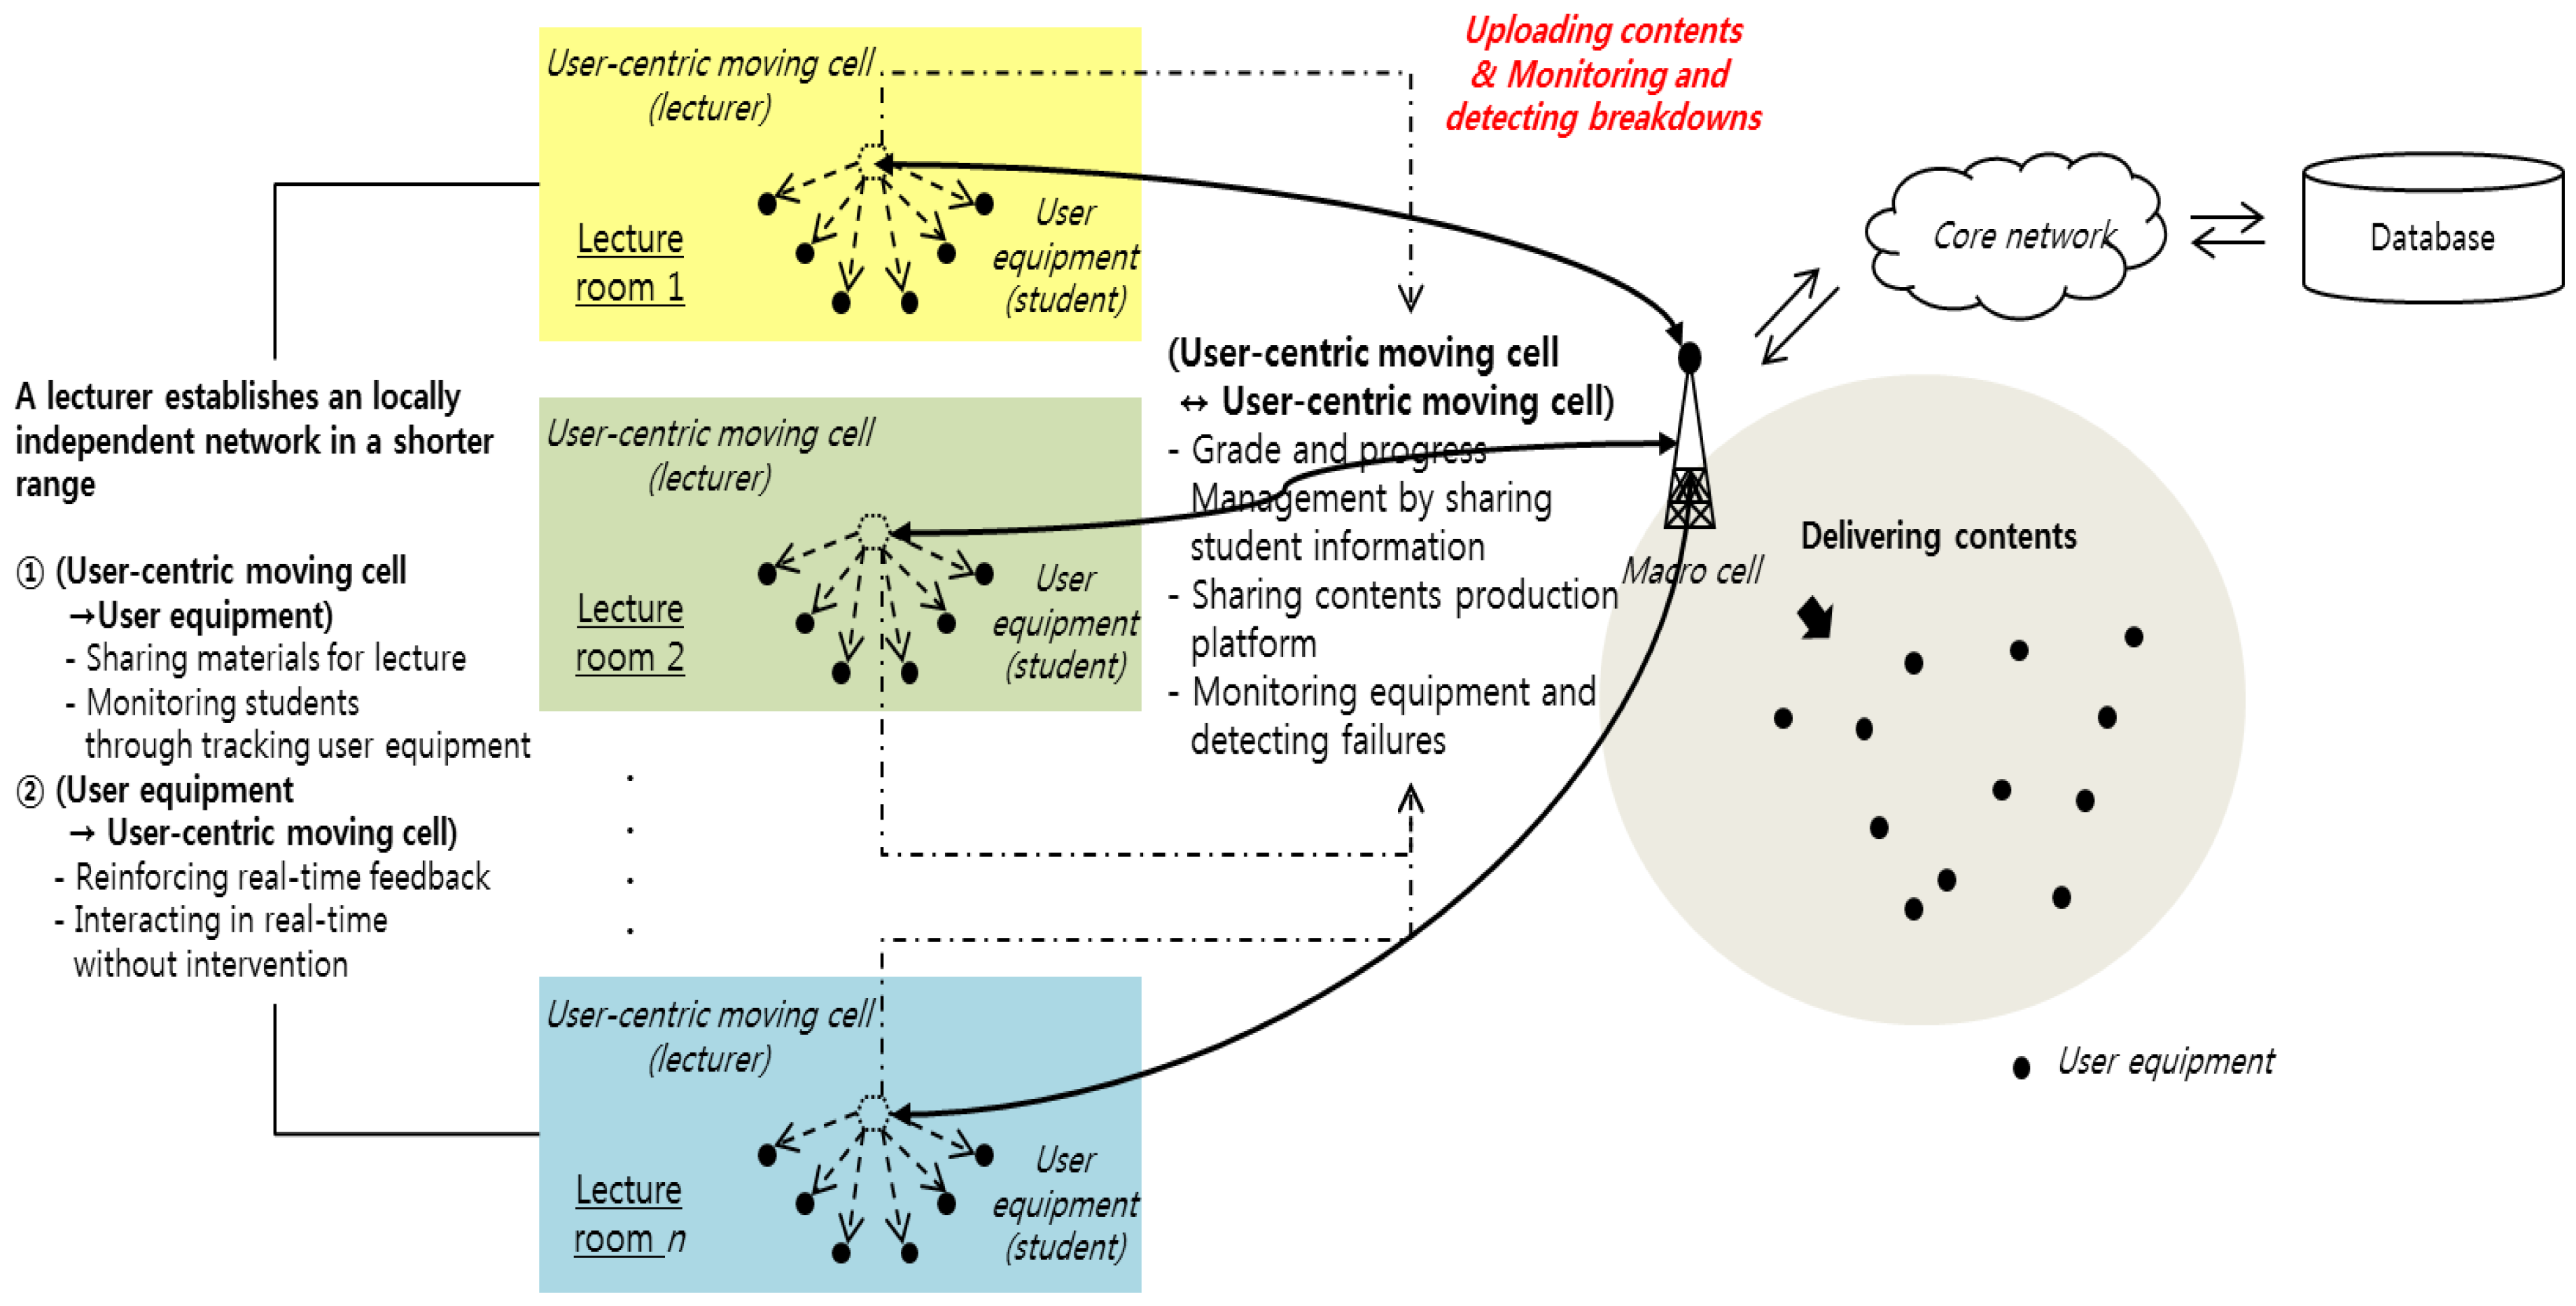
4.4. Service Scenario
5. Conclusions and Future Research
Acknowledgment
Author Contributions
Conflicts of Interest
References
- Jeong, W. Smart space technology utilized by hyper-network media. In Proceedings of the 24th Korea Internet Conference, Seoul, Korea, 20–21 June 2016.
- Milgram, P.; Kishino, F. A taxonomy of mixed reality visual displays. IEICE Trans. Inf. Syst. 1994, 77, 1321–1329. [Google Scholar]
- Wellmann, B. Physical place and cyberplace: The rise of networked individualism. Int. J. Urban Reg. Res. 2001, 25, 227–252. [Google Scholar] [CrossRef]
- Deloitte Touche Tohmatsu Limited; World Economic Forum. Risk and Responsibility in a Hyperconnected World—Pathways to Global Cyber Resilience; World Economic Forum: Geneva, Switzerland, 2012. [Google Scholar]
- Parker, K.; Mainelli, M. Great mistakes in technology commercialization. Strateg. Chang. 2001, 10, 383–390. [Google Scholar] [CrossRef]
- Conceição, P.; Hamill, D.; Pinheiro, P. Innovative science and technology commercialization strategies at 3M: A case study. J. Eng. Technol. Manag. 2002, 19, 25–38. [Google Scholar] [CrossRef]
- Schilling, M.A. Technology success and failure in winner-take-all markets: The impact of learning orientation, timing, and network externalities. Acad. Manag. J. 2002, 45, 387–398. [Google Scholar] [CrossRef]
- Li, H.; Hu, B. Study on efficiency optimization of R&D resources allocation in Shanhai. Am. J. Ind. Bus. Manag. 2014, 4, 217–222. [Google Scholar]
- Leung, C.M.; Kwok, Y.K. Real options game analysis of sleeping patents. Decis. Econ. Financ. 2011, 34, 41–65. [Google Scholar] [CrossRef]
- Cincera, M.; Czarnitzki, D.; Thorwarth, S. Efficiency of Public Spending in Support of R&D Activities; Directorate General Economic and Monetary Affairs (DG ECFIN); European Commission: Brussels, Belgium, 2009. [Google Scholar]
- An, H.J.; Ahn, S.-J. Emerging technologies—Beyond the chasm: Assessing technological forecasting and its implication for innovation management in Korea. Technol. Forecast. Soc. Chang. 2016, 102, 132–142. [Google Scholar] [CrossRef]
- Peng, Y.-N.; Sanderson, S.W. Crossing the chasm with beacon products in the portable music player industry. Technovation 2014, 34, 77–92. [Google Scholar] [CrossRef]
- Matthing, J.; Kristensson, P.; Gustafsson, A. Developing successful technology-based services: The issue of identifying and involving innovative users. J. Serv. Mark. 2006, 20, 288–297. [Google Scholar] [CrossRef]
- Alm, I.; Perry, C. A customer-oriented new service development process. J. Serv. Mark. 2002, 16, 515–534. [Google Scholar] [CrossRef]
- Martin, C.R.; Horne, D.A. Level of success inputs for service innovations in the same firm. Int. J. Serv. Ind. Manag. 1995, 6, 40–56. [Google Scholar]
- Gordon, G.; Kaminski, P.; Calantone, R.; Benedetto, A.D. Linking customer knowledge with successful service innovation. J. Appl. Bus. Res. 1993, 9, 129–139. [Google Scholar] [CrossRef]
- Kim, W.C.; Mauborgne, R. Value innovation: A leap into the blue ocean. J. Bus. Strategy 2005, 26, 22–28. [Google Scholar]
- Kim, W.C.; Mauborgne, R. Value innovation—The strategic logic of high growth. Harv. Bus. Rev. 1997, 75, 102–112. [Google Scholar] [PubMed]
- Nemet, G.F. Demand-pull, technology-push, and government-led incentives for non-incremental technical change. Res. Policy 2009, 38, 700–709. [Google Scholar] [CrossRef]
- Brem, A.; Voigt, K.-I. Integration of market pull and technology push in the corporate front end and innovation management—Insights from the German software industry. Technovation 2009, 29, 351–367. [Google Scholar] [CrossRef]
- Gerpott, T.J. Strategisches Technologie-und Innovationsmanagement; Schäffer-Poeschel Verlag: Stuttgart, Germany, 2005. (In German) [Google Scholar]
- Burgelman, R.; Sayles, L. Transforming Invention into Innovation: The Conceptualization Stage; Strategic Management of Technology and Innovation; McGraw-Hill: Boston, MA, USA, 2004; pp. 682–690. [Google Scholar]
- Walsh, S.T.; Kirchhoff, B.A.; Newbert, S. Differentiating market strategies for disruptive technologies. IEEE Trans. Eng. Manag. 2002, 49, 341–351. [Google Scholar] [CrossRef]
- Di Stefano, G.; Gambardella, A.; Verona, G. Technology push and demand pull perspectives in innovation studies: Current findings and future research directions. Res. Policy 2012, 41, 1283–1295. [Google Scholar] [CrossRef]
- Nijssen, E.J.; Hillebrand, B.; Vermeulen, P.A.; Kemp, R.G. Exploring product and service innovation similarities and differences. Int. J. Res. Mark. 2006, 23, 241–251. [Google Scholar] [CrossRef]
- Griffin, A. PDMA research on new product development practices: Updating trends and benchmarking best practices. J. Prod. Innov. Manag. 1997, 14, 429–458. [Google Scholar] [CrossRef]
- Möller, K.; Rajala, R.; Westerlund, M. Service innovation myopia? A new recipe for client-provider value creation. Calif. Manag. Rev. 2008, 50, 31–48. [Google Scholar] [CrossRef]
- Candi, M. The role of design in the development of technology-based services. Des. Stud. 2007, 28, 559–583. [Google Scholar] [CrossRef]
- Van Riel, A.C.R.; Semeijn, J.; Hammedi, W.; Henseler, J. Technology-based service proposal screening and decision-making effectiveness. Manag. Decis. 2011, 49, 762–783. [Google Scholar] [CrossRef]
- Knot, E.A.R.; van den Ende, J.; Vergragt, P. Flexibility strategies for sustainable technology development. Technovation 2001, 21, 335–343. [Google Scholar] [CrossRef]
- Lee, E.; Lee, J.; Eastwood, D. A two-step estimation of consumer adoption of technology-based service innovations. J. Consum. Aff. 2003, 37, 256–282. [Google Scholar] [CrossRef]
- Urban, G.L.; Hauser, J.R. Design and Marketing of New Products, 2nd ed.; Prentice Hall: Englewood Cliffs, NJ, USA, 1993. [Google Scholar]
- Cooper, R.G. Winning at New Products: Accelerating the Process from Idea to Launch; Addison-Wesley Publishing Co.: Boston, MA, USA, 2001. [Google Scholar]
- Ahn, J.-H.; Skudlark, A. Managing risk in a new telecommunications service development process through a scenario planning approach. J. Inf. Technol. 2002, 17, 103–118. [Google Scholar] [CrossRef]
- Oh, Y.; Suh, E.-H.; Hong, J.; Hwang, H. A feasibility test model for new telecom service development using MCDM method: A case study of video telephone service in Korea. Expert Syst. Appl. 2009, 36, 6375–6388. [Google Scholar] [CrossRef]
- Ernst & Young Global Limited (EYGM). Global Telecommunications Study: Navigating the Road to 2020; EYGM Limited: Los Angeles, CA, USA, 2015. [Google Scholar]
- Robles, T.; Mitjana, E.; Ruiz, P. Usage scenarios and business opportunities for systems beyond 3G. In Proceedings of the IST Mobile and Wireless Telecommunications Summit 2002, Thessaloniki, Greece, 16–19 June 2002.
- METIS Project. Scenarios, Requirements and KPIs for 5G Mobile and Wireless System; The METIS 2020 Project: Stockholm, Sweden, 2013. [Google Scholar]
- Nokia Oyj. 5G Use Cases and Requirements; Nokia Co.: Espoo, Finland, 2014. [Google Scholar]
- Kim, S.; Yoon, B. A systematic approach for new service concept generation: Application of agent-based simulation. Expert Syst. Appl. 2014, 41, 2793–2806. [Google Scholar] [CrossRef]
- Lee, C.; Song, B.; Park, Y. Generation of new service concepts: A morphology analysis and genetic algorithm approach. Expert Syst. Appl. 2009, 36, 12454–12460. [Google Scholar] [CrossRef]
- Matthing, J.; Sandén, B.; Edvardsson, B. New service development: Learning from and with customers. Int. J. Serv. Ind. Manag. 2004, 15, 479–498. [Google Scholar] [CrossRef]
- Alam, I. An exploratory investigation of user involvement in new service development. J. Acad. Mark. Sci. 2004, 30, 250–261. [Google Scholar] [CrossRef]
- Kim, C.; Jeon, J.-H.; Kim, M.-S. Identification and Management of opportunities for technology-based services: A patent-based portfolio approach. Innov. Manag. Policy Pract. 2015, 17, 232–249. [Google Scholar] [CrossRef]
- Luo, J.; Olechowski, A.L.; Magee, C.L. Technology-based design and sustainable economic growth. Technovation 2014, 34, 663–677. [Google Scholar] [CrossRef]
- Hertenstein, J.H.; Platt, M.B.; Veryzer, R.W. The impact of industrial design effectiveness on corporate financial performance. J. Prod. Innov. Manag. 2005, 22, 3–21. [Google Scholar] [CrossRef]
- Walsh, V. Design, innovation and the boundaries of the firm. Res. Policy 1996, 25, 509–529. [Google Scholar] [CrossRef]
- Kim, W.C.; Mauborgne, R. Strategy, value innovation, and the knowledge economy. MIT Sloan Manag. Rev. 1999, 40, 41–54. [Google Scholar]
- Rogers, E.M. Diffusion of Innovations; Simon and Schuster: New York, NY, USA, 2010. [Google Scholar]
- Hargadon, A.; Sutton, R.I. Technology brokering and innovation in a product development firm. Adm. Sci. Q. 1997, 42, 716–749. [Google Scholar] [CrossRef]
- Altshuller, G.; Shulyak, L.; Rodman, S. The Innovation Algorithm: TRIZ, Systematic Innovation and Technical Creativity; Technical Innovation Center, Inc.: Worcester, MA, USA, 1999. [Google Scholar]
- Yamashina, H.; Ito, T.; Kawada, H. Innovative product development process by integrating QFD and TRIZ. Int. J. Prod. Res. 2002, 40, 1031–1050. [Google Scholar] [CrossRef]
- Zhang, J.; Tan, K.C.; Chai, K.H. Systematic innovation in service design through TRIZ. In Proceedings of the EurOMA-POMS Annual Conference, Lake Como, Italy, 16–18 June 2003.
- Magnusson, P.R.; Matthing, J.; Kritensson, P. Managing user involvement in service innovation: Experiments with innovating end users. J. Serv. Res. 2003, 6, 111–124. [Google Scholar] [CrossRef]
- Thomke, S.; Hippel, E.V. Customers as innovators: A new way to create value. Harv. Bus. Rev. 2002, 80, 74–81. [Google Scholar]
- Olson, E.L.; Bakke, G. Implementing the lead user method in a high technology firm: A longitudinal study of intentions versus actions. J. Prod. Innov. Manag. 2001, 18, 388–395. [Google Scholar] [CrossRef]
- Kim, W.C.; Mauborgne, R. Blue Ocean Strategy; Harvard Business Review Press: Watertown, MA, USA, 2005. [Google Scholar]
- Kim, W.C.; Mauborgne, R. Blue ocean strategy: From theory to practice. Calif. Manag. Rev. 2005, 47, 105–121. [Google Scholar] [CrossRef]
- Chaoren, L.; Thawatthatree, A. Use Value Innovation to Create Competitive Advantages in Blue Ocean: A Case Study of IKEA in Nanjing. Master’s Thesis, Karlstad University, Karlstad, Sweden, 2015. [Google Scholar]
- Keränen, J.; Jalkala, A. Three strategies for customer value assessment in business markets. Manag. Decis. 2014, 52, 79–100. [Google Scholar] [CrossRef]
- Landroguez, S.M.; Castro, C.B.; Cepeda-Carrión, G. Creating dynamic capabilities to increase customer value. Manag. Decis. 2011, 49, 1141–1159. [Google Scholar] [CrossRef]
- Woodruff, R.B. Customer value: The next source for competitive advantage. J. Acad. Mark. Sci. 1997, 25, 139–153. [Google Scholar] [CrossRef]
- Eggert, A.; Ulaga, W. Customer perceived value: A substitute for satisfaction in business markets? J. Bus. Ind. Mark. 2002, 17, 107–118. [Google Scholar] [CrossRef]
- Grönroos, C. A service perspective on business relationships: The value creation, interaction and marketing interface. Ind. Mark. Manag. 2011, 40, 240–247. [Google Scholar] [CrossRef]
- Lai, A.W. Consumer values, product benefits and customer value: A consumption behavior approach. Adv. Consum. Res. 1995, 22, 381–388. [Google Scholar]
- Kim, W.C.; Mauborgne, R. Knowing a winning business idea when you see one. Harv. Bus. Rev. 2000, 78, 129–138. [Google Scholar] [CrossRef]
- Kabukin, D. Reviewing the Blue Ocean Strategy. Is the Blue Ocean Strategy Valid and Reliable? Master’s Thesis, University of Twente, Enschede, The Netherlands, 2014. [Google Scholar]
- Sheehan, N.T.; Bruni-Bossio, V. Strategic value curve analysis: Diagnosing and improving customer value propositions. Bus. Horiz. 2015, 58, 317–324. [Google Scholar] [CrossRef]
- Mohamed, Z.A.; Hilman, H.; Bahaman, U.S. The blue ocean strategy; Case study analysis of its implementation in 14 different agencies in Malaysia. Dev. Ctry. Stud. 2014, 4, 105–119. [Google Scholar]
- Wenzel, H.; Förster, A. Blue Ocean Strategy: How IKEA Created a New Market; Grin Verlag (GRIN): München, Germany, 2013. [Google Scholar]
- Kano, N.; Seraku, N.; Takahashi, F.; Tsuji, S. Attractive quality and must be quality. Quality 1984, 14, 39–48. [Google Scholar]
- Cohen, L. Quality Function Deployment; Prentice Hall: Englewood Cliffs, NJ, USA, 1995. [Google Scholar]
- Zwicky, F. Discovery, Invention, Research—Through the Morphological Approach; Macmilan Company: New York, NY, USA, 1969. [Google Scholar]
- Hall, A.D. Three-dimensional morphology of systems engineering. In Contributions to a Philosophy of Technology; Springer: Amsterdam, The Netherlands, 1969; pp. 174–186. [Google Scholar]
- Feng, X.; Fuhai, L. Patent text mining and informetric-based patent technology morphological analysis—An empirical study. Technol. Anal. Strateg. Manag. 2012, 24, 467–479. [Google Scholar] [CrossRef]
- Ritchey, T. Modelling alternative futures with general morphological analysis. World Future Rev. 2011, 3, 83–94. [Google Scholar] [CrossRef]
- Ritchey, T. Fritz Zwicky, morphologie and policy analysis. In Proceedings of the 16th EURO Conference on Operational Analysis, Brussels, Belgium, 29–31 May 1998.
- Prokopska, A. Application of morphological analysis methodology in architectural design. Acta Polytech. 2001, 41, 46–54. [Google Scholar]
- Medina, G.V.; Pham, M.T.; Marquis-Favre, W. A modified Zwicky’s morphological analysis: Application to the design of a robotic laparoscope. In Proceedings of the 4th European Conference of the International Federation for Medical and Biological Engineering, Antwerp, Belgium, 23–27 November 2009.
- Song, M.J.; Lee, J.-G.; Park, J.-M.; Lee, S. Triggering navigators for innovative system design: The case of lab-on-a-chip technology. Expert Syst. Appl. 2012, 39, 12451–12459. [Google Scholar] [CrossRef]
- Im, K.; Cho, H. A systematic approach for developing a new business model using morphological analysis and integrated fuzzy approach. Expert Syst. Appl. 2013, 40, 4463–4477. [Google Scholar] [CrossRef]
- Yoon, B.; Park, Y. A systematic approach for identifying technology opportunities: Keyword-based morphology analysis. Technol. Forecast. Soc. Chang. 2005, 72, 145–160. [Google Scholar] [CrossRef]
- Yoon, B. On the development of a technology intelligence tool for identifying technology opportunity. Expert Syst. Appl. 2008, 35, 124–135. [Google Scholar] [CrossRef]
- Yoon, B.; Park, Y. Development of new technology forecasting algorithm: Hybrid approach for morphology analysis and conjoint analysis of patent information. IEEE Trans. Eng. Manag. 2007, 54, 588–599. [Google Scholar] [CrossRef]
- Yoon, B.; Phaal, R.; Probert, D. Morphology analysis for technology roadmapping: Application of text mining. R&D Manag. 2013, 40, 51–68. [Google Scholar]
- Rokeach, M. The Nature of Human Values; Free Press: New York, NY, USA, 1973. [Google Scholar]
- Škudienė, V.; Nedzinskas, Š.; Ivanauskienė, N.; Auruškevičienė, V. Customer perceptions of value: Case of retail banking. Organ. Mark. Emerg. Econ. 2012, 3, 75–88. [Google Scholar]
- Tehrani, M.N.; Uysal, M.; Yanikomeroglu, H. Device-to-device communication in 5G cellular networks: Challenges, solutions, and future directions. IEEE Commun. Mag. 2014, 52, 86–92. [Google Scholar] [CrossRef]
- Wu, S. Application of D2D in 5G networks. ZTE Technol. 2015, 17, 158. [Google Scholar]
- Lin, X.; Ratasuk, R.; Ghosh, A.; Andrews, J.G. Modeling, analysis, and optimization of multicast device-to-device transmissions. IEEE Trans. Wirel. Commun. 2015, 13, 4346–4359. [Google Scholar] [CrossRef]
- Phunchongharn, P.; Hossain, E.; Kim, D.I. Resource allocation for device-to-device communications underlaying LTE-Advanced networks. IEEE Wirel. Commun. 2013, 20, 91–100. [Google Scholar] [CrossRef]
- ATutor. ATutor Learning Management Tools. Available online: www.atutor.ca (accessed on 1 November 2016).
- Edmodo. Online Learning Programs. Available online: www.edomodo.com (accessed on 1 November 2016).
- Sakai. Features of Sakai. Available online: https://www.sakaiproject.org/node/1377 (accessed on 1 November 2016).
- Sumtotal. The Latest SumTotal Talent Expansion Suite Is Here. Available online: http://www.sumtotalsystems.com/winter2016/ (accessed on 1 November 2016).
- Capterra. Top LMS Software. Available online: http://elearninginfographics.com/top-lms-software-infographic/?utm_campaign=elearningindustry.com&utm_source=%2Fthe-20-best-learning-management-systems&utm_medium=link (accessed on 14 October 2016).
- Graf, S.; List, B. An evaluation of open source e-learning platforms stressing adaptation issues. In Proceedings of the 5th IEEE International Conference on Advanced Learning Technologies (ICALT’05), Kaohsiung, Taiwan, 5–8 July 2005; pp. 163–165.
- Dagger, D.; O’Connor, A.; Lawless, S.; Walsh, E.; Wade, V.P. Service-oriented e-Learning platforms: From monolithic systems to flexible services. IEEE Internet Comput. 2007, 11, 28–35. [Google Scholar] [CrossRef]


| Types of Value | Description | Detailed Customer Value | |
|---|---|---|---|
| Economic | Values providing economic utility to customer by cost-saving, making profit | Cost-saving, Profitable | |
| Emotional | Personal | Emotions individual customer can experience through product and service | Happiness, beauty, Self-control, Capability, Self-respect, Comfortable life, Relief, Health, Fun, exciting life, Satisfaction, Courage, a sense of accomplishment, Love |
| Community | Emotions a community can feel and experience through product and service | Cheerfulness, Honesty, Safety, Helpfulness | |
| Epistemic | Values related to increasing intellectual capability | Intelligent, Wisdom, Rich information, Curious, Educational, Logic | |
| Social | Values provided to society | Social recognition, Salvation, Equality, Security, Close relationship | |
| Functional | Values related to function or features of product and service | Available, Unique, Efficient, Effective, Superior | |
| Intelligent SON | Cell-to-Cell Communication | D2D | M2M | User-Centric Contents Delivery | Cloud Service | |
|---|---|---|---|---|---|---|
| Emotional value | Smart city | NFC payment; Intelligent bedside system; Bubblino; Pet tracker … | Smart building; Smart city; Smartthings; AgileTrac; AeroScout; Pet tracker ... | Live broadcasting; Moodle; Edmodo; BlackBoard; SumTotal … | Moodle; SumTotal … | |
| Epistemic value | Moodle | Moodle | Moodle; Edmodo; SumTotal … | Moodle; Edmodo; SumTotal … | ||
| Economic value | Smart city; Automatic brightness control system; Smartgrid … | Automatic brightness control; NFC payment … | Smartthings; Electrical lighting and management system … | |||
| Social value | Smart clean system; Smart broadcast control system; Smart safezone … | Automatic brightness control system; Real-time vehicle control system | AgileTrac; AeroScout; Intelligent traffic system … | |||
| Functional value | Smart city; Building energy management system … | Automatic brightness control system; Google glass … | Smart building; Smart city; Smartthings; Builidng energy management system … | Smart watch; Google glass; OnStar | Smart watch |
| Cycles | Purchase | Delivery | Use | Supplements | Maintenance | Disposal | |
|---|---|---|---|---|---|---|---|
| Value | |||||||
| Emotional value | ATutor; Edmodo; Moodle; Sakai; Sumtotal | ATutor | |||||
| Epistemic value | ATutor; Moodle; Sakai; Sumtotal | ||||||
| Economic value | Moodle | Moodle | |||||
| Social value | ATutor | ||||||
| Functional value | Edmode; Sumtotal | Sumtotal | ATutor; Edmodo | ||||
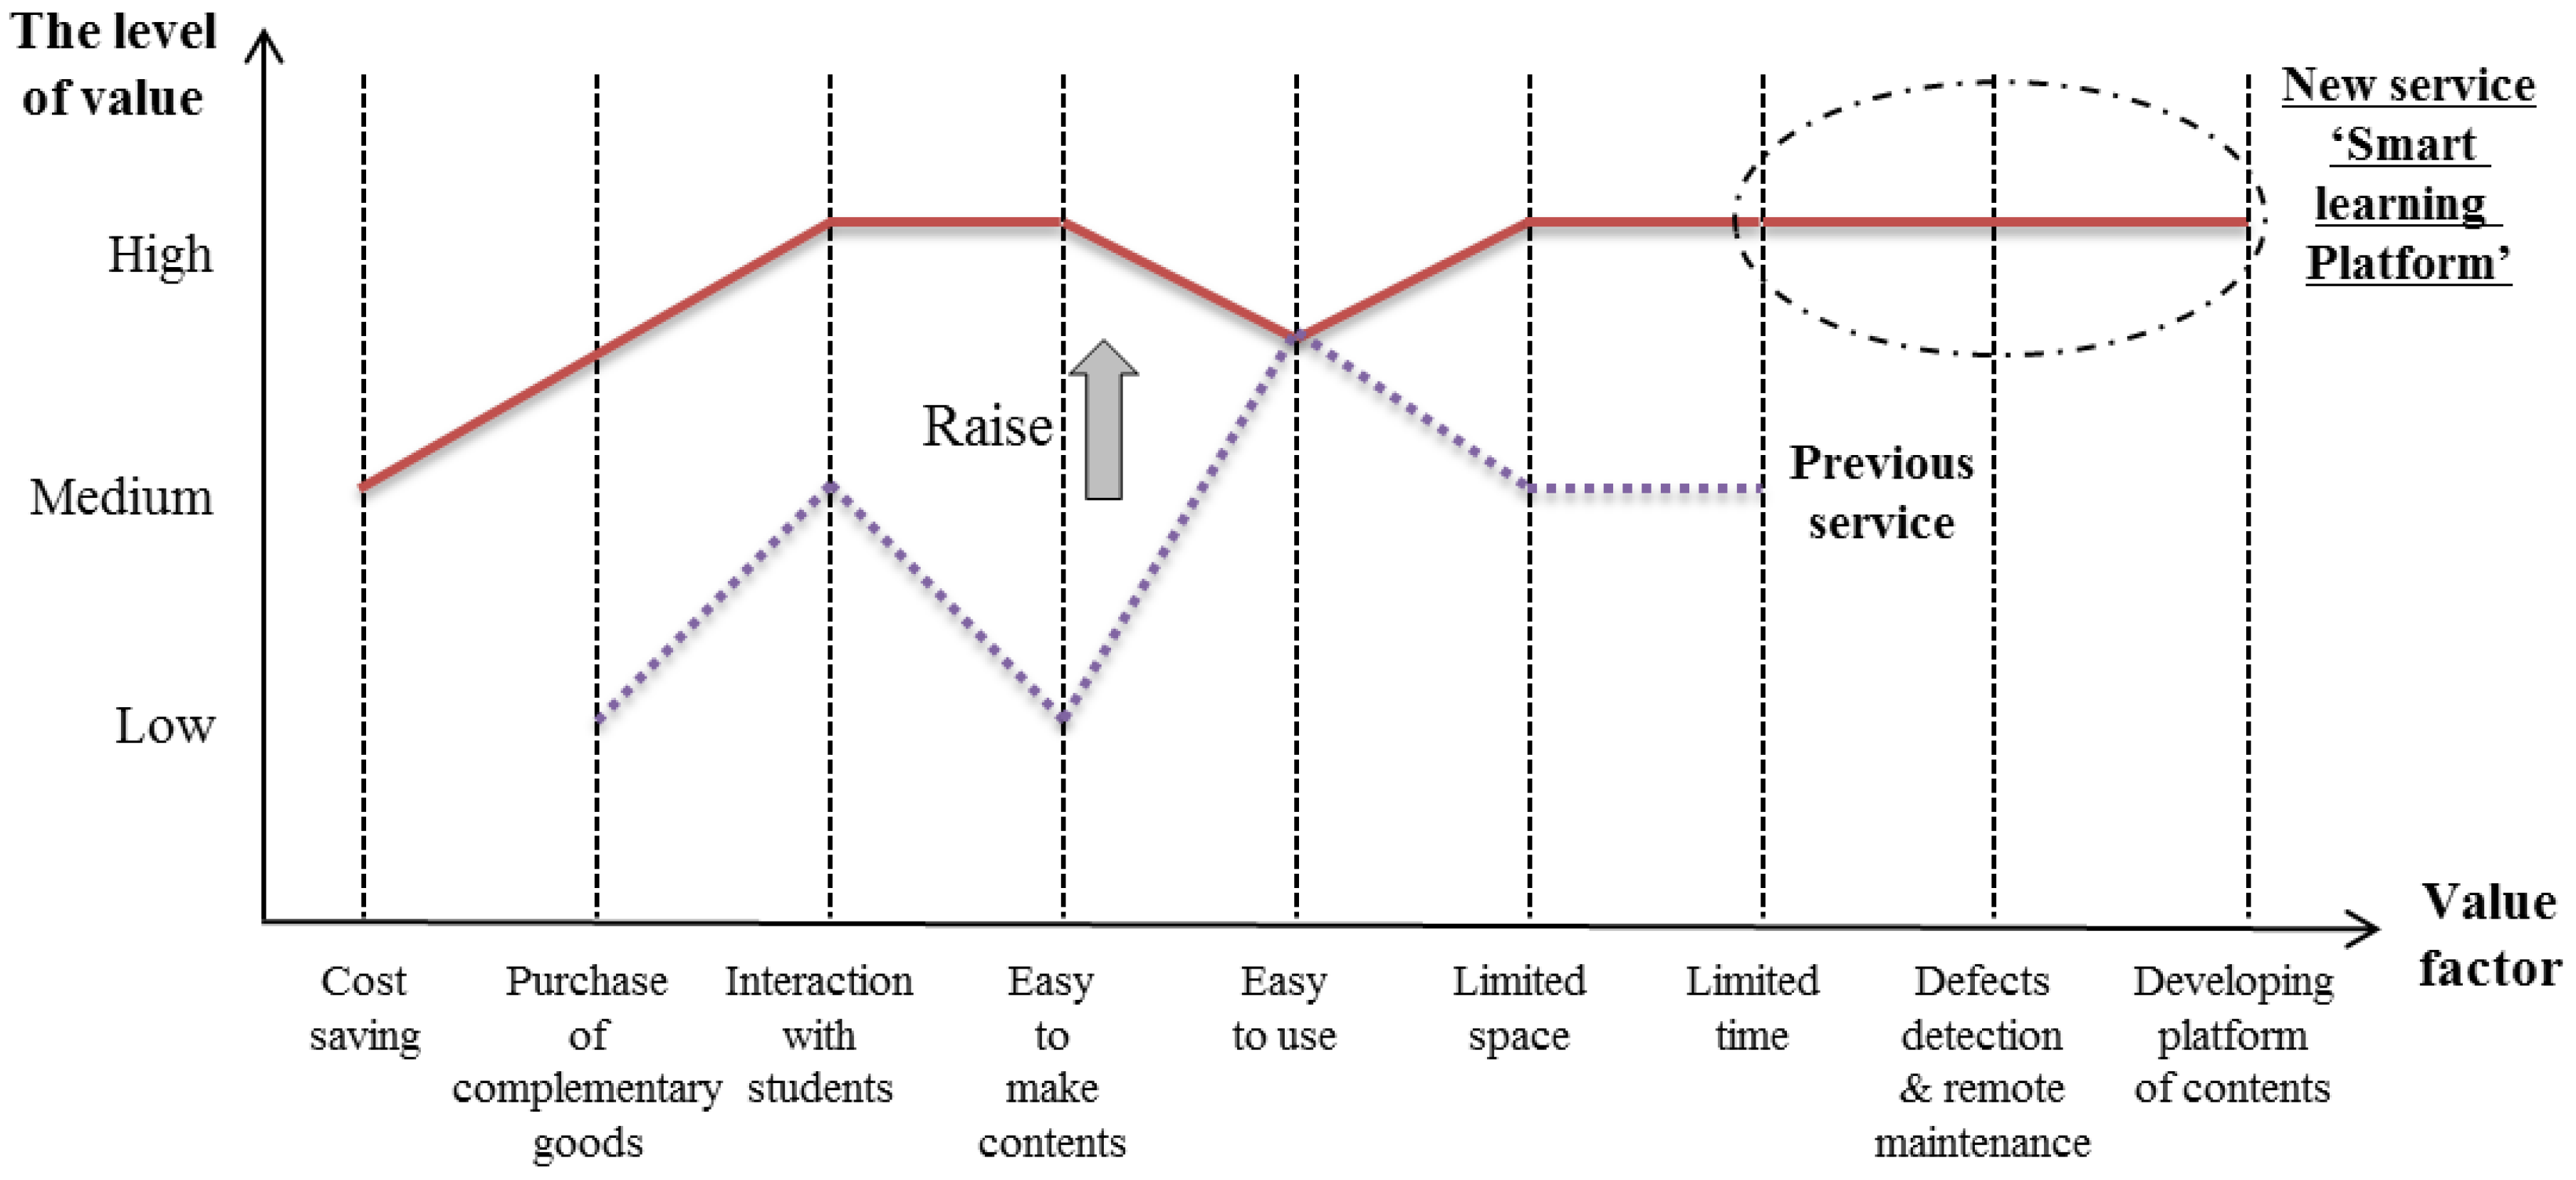
| Eliminate | Raise | ||||
|---|---|---|---|---|---|
| Value factor | Technological function | Customer value | Value factor | Technological function | Customer value |
| - | - | - | Interaction with students | M2M, D2D | Emotional value |
| Reduce | Create | ||||
| Value factor | Technological function | Customer value | Value factor | Technological function | Customer value |
| Purchase of supplementary | Intelligent SON, M2M | Economic value | Defects detection & Remote maintenance in real time | Intelligent SON; D2D, M2M | Economic value; Functional value |
| Limited time & space | Intelligent SON | Functional value | Mirroring | Intelligent SON; D2D, M2M | Economic value |
| Platform deployment | M2M, Cloud | Economic value; Functional value | |||
© 2016 by the authors; licensee MDPI, Basel, Switzerland. This article is an open access article distributed under the terms and conditions of the Creative Commons Attribution (CC-BY) license (http://creativecommons.org/licenses/by/4.0/).
Share and Cite
Jeong, S.; Jeong, Y.; Lee, K.; Lee, S.; Yoon, B. Technology-Based New Service Idea Generation for Smart Spaces: Application of 5G Mobile Communication Technology. Sustainability 2016, 8, 1211. https://doi.org/10.3390/su8111211
Jeong S, Jeong Y, Lee K, Lee S, Yoon B. Technology-Based New Service Idea Generation for Smart Spaces: Application of 5G Mobile Communication Technology. Sustainability. 2016; 8(11):1211. https://doi.org/10.3390/su8111211
Chicago/Turabian StyleJeong, Seonkoo, Yujin Jeong, Keeeun Lee, Sungjoo Lee, and Byungun Yoon. 2016. "Technology-Based New Service Idea Generation for Smart Spaces: Application of 5G Mobile Communication Technology" Sustainability 8, no. 11: 1211. https://doi.org/10.3390/su8111211