
Does Firms’ Innovation Promote Export Growth Sustainably?—Evidence from Chinese Manufacturing Firms

Abstract
:1. Introduction
2. Literature Review
3. Mechanisms Analysis
3.1. Profit Function
3.1.1. Demand
3.1.2. Supply
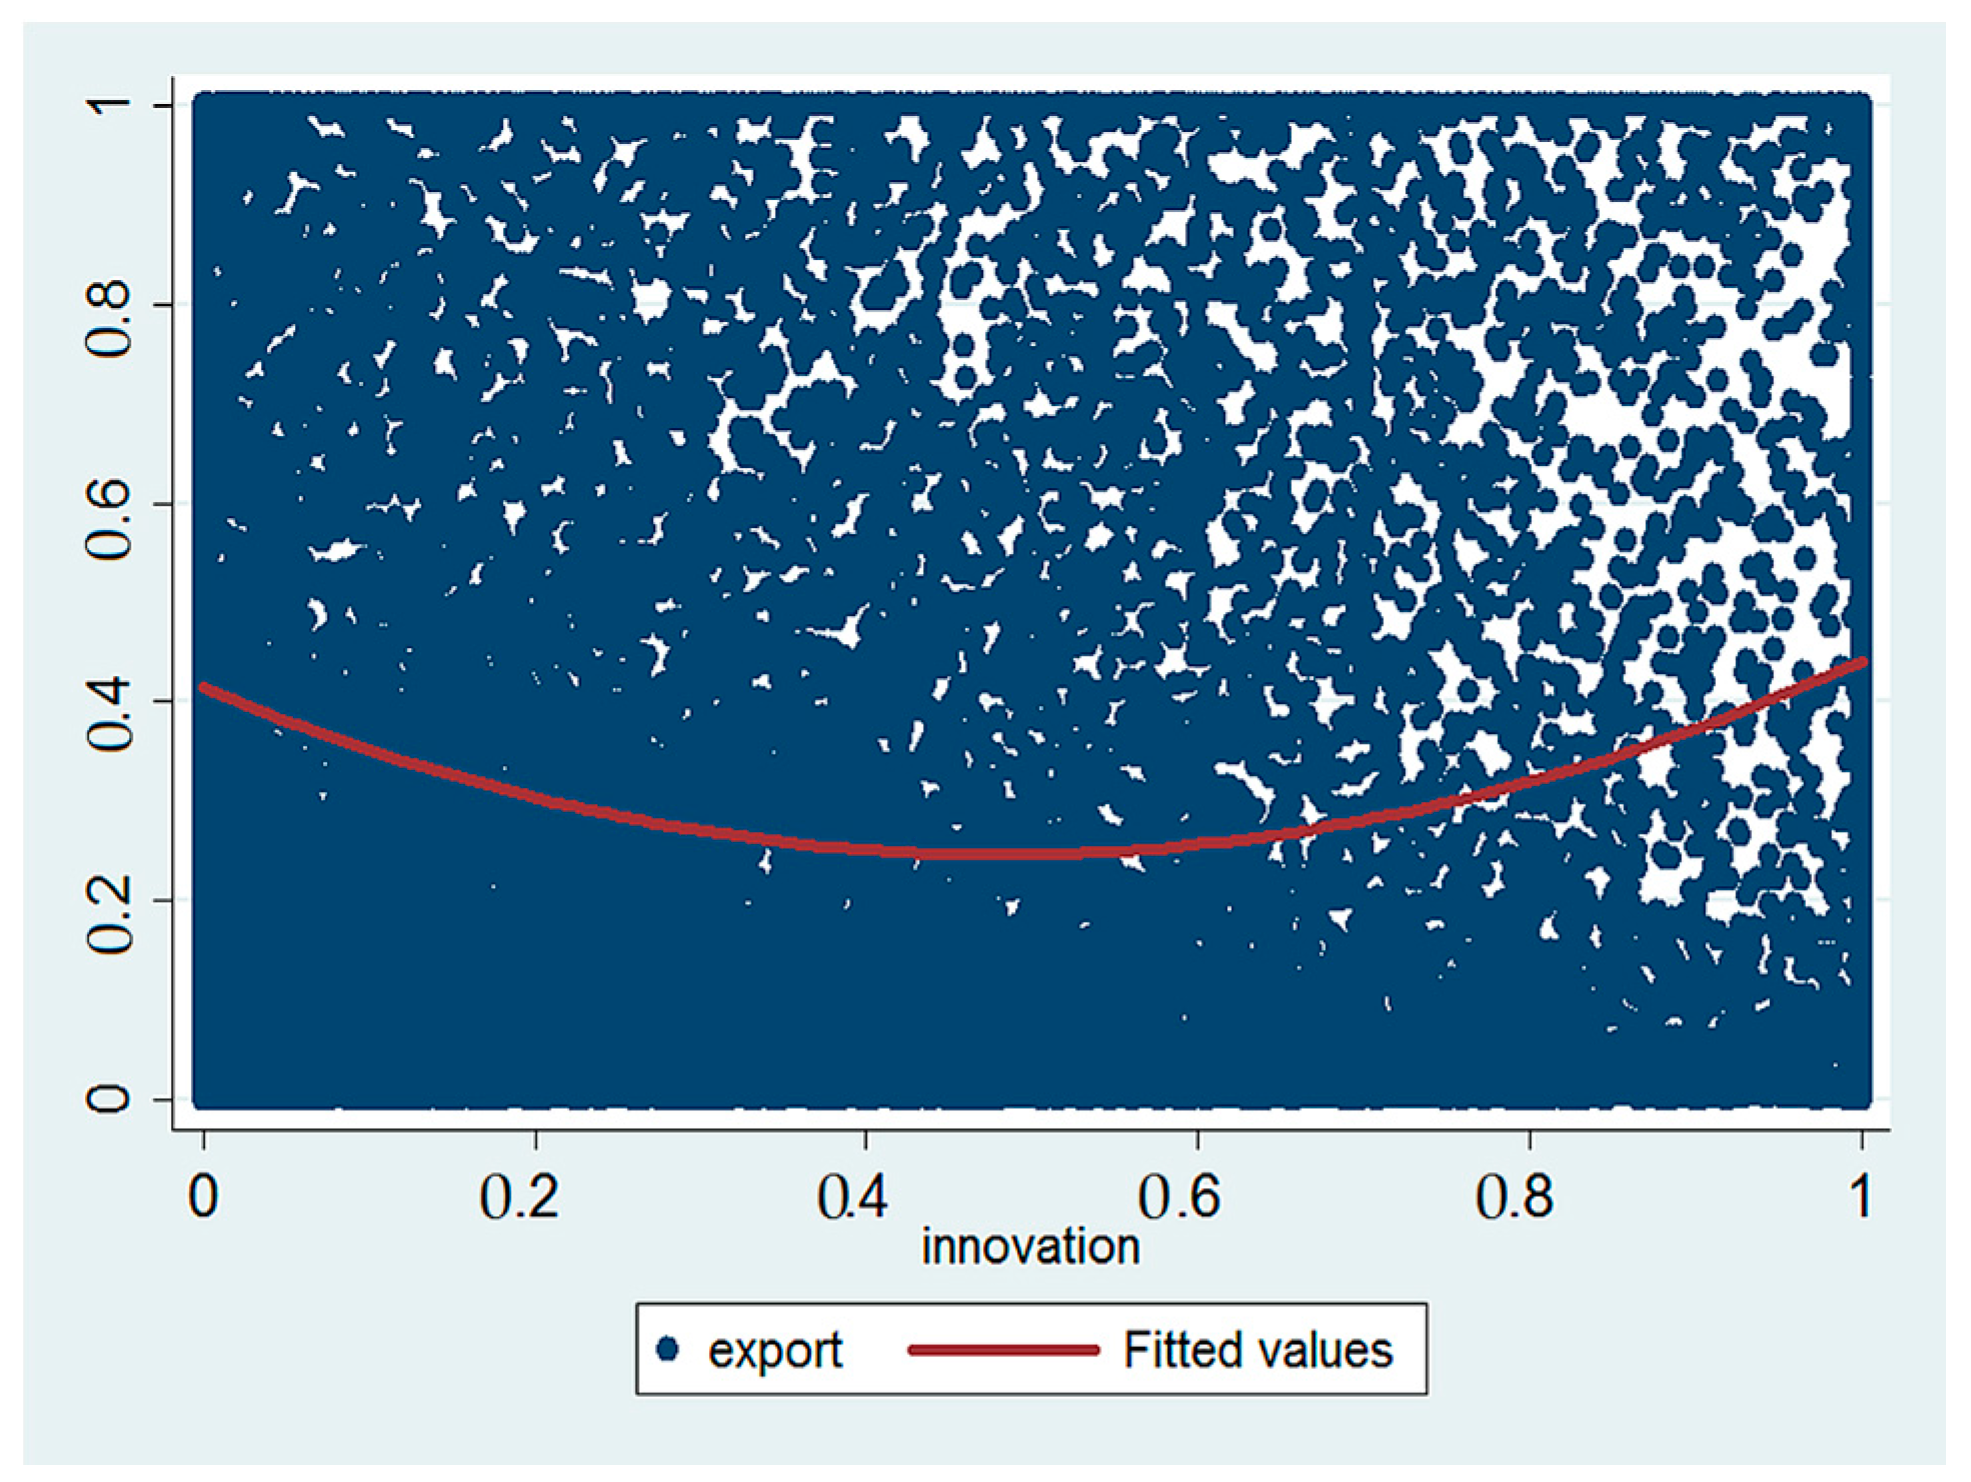
3.2. Innovation and Export Growth
3.2.1. Extensive Margin
3.2.2. Intensive Margin
4. Data and Modeling
4.1. Data
4.2. Modeling
5. Empirical Results
5.1. Baseline Regression Results for Innovation and Exports
5.2. Regression Results for Innovation and Exports in Different Technological Sectors
5.3. Threshold Effect Test
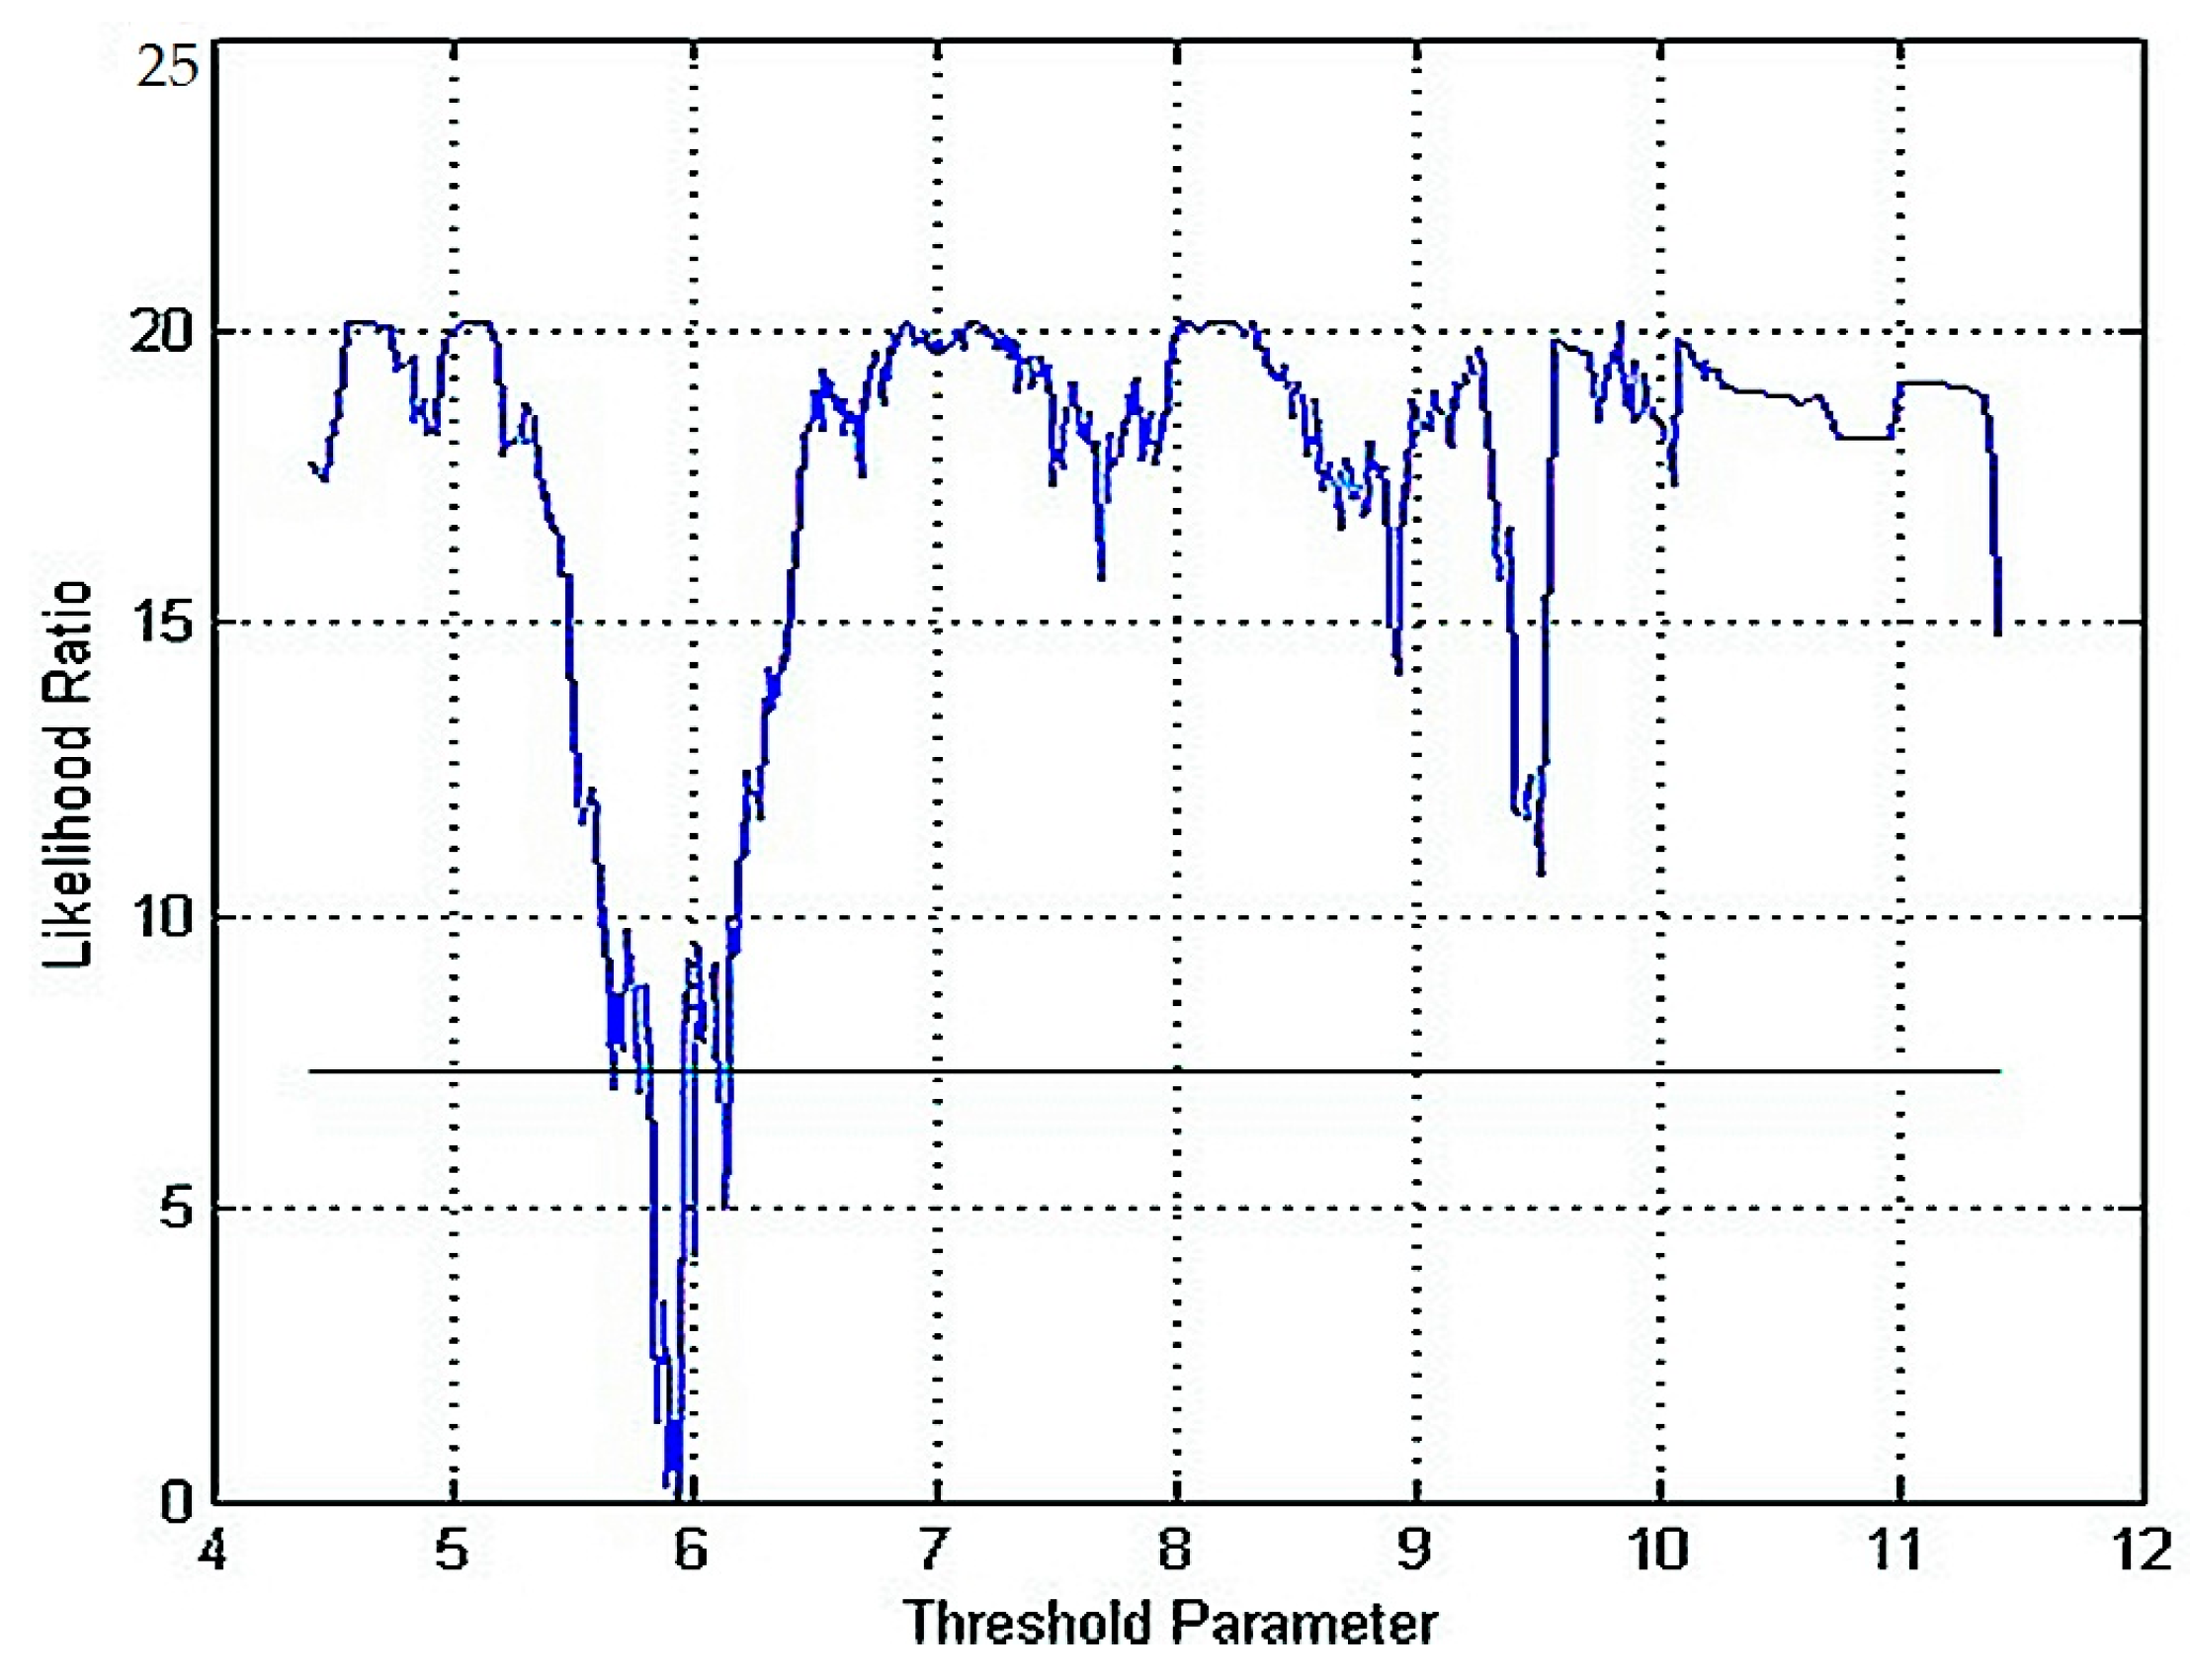
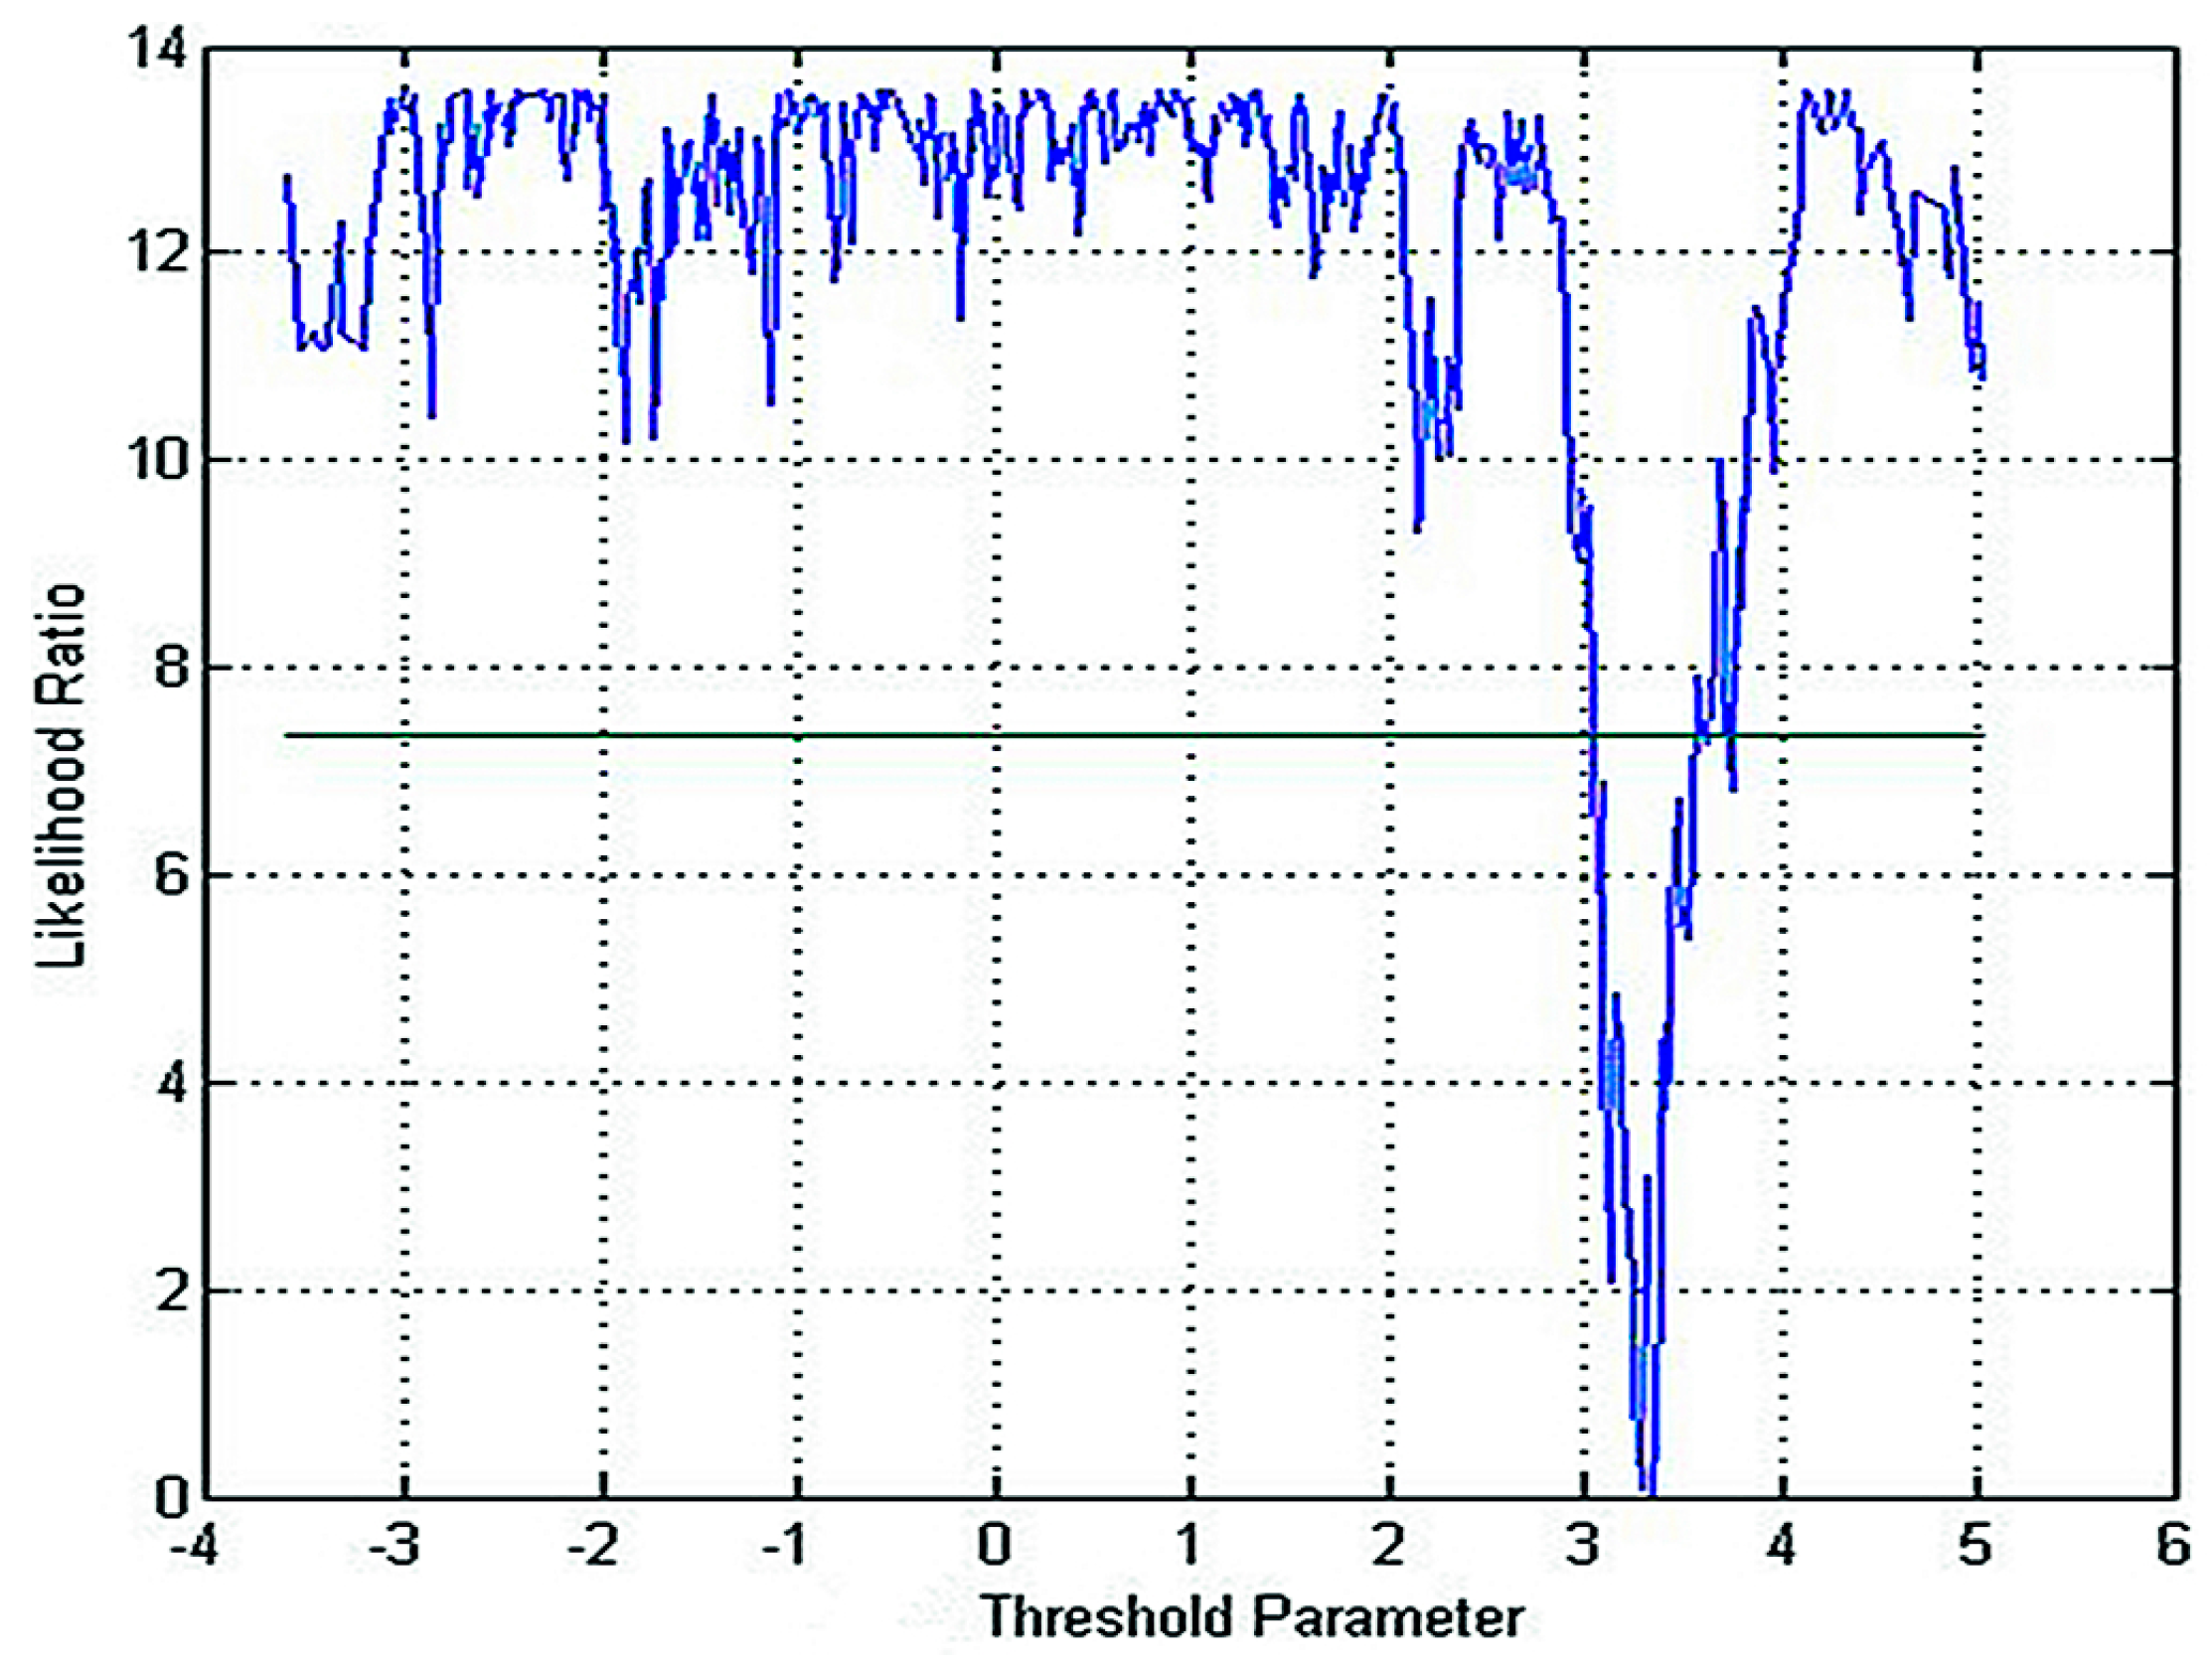
5.3.1. Testing for Threshold
5.3.2. Threshold Estimation
5.4. Further Statistics and Analysis
6. Discussion
6.1. Policy Implications
6.2. Limitations and Further Discussion
7. Conclusions
Acknowledgments
Author Contributions
Conflicts of Interest
Appendix A

| Year | All Firms | Innovators | Exporters | Innovation Intensity | Exporting Intensity |
|---|---|---|---|---|---|
| 2001 | 140,010 | 9865 | 34,555 | 0.046 | 0.155 |
| 2002 | 149,361 | 9991 | 38,407 | 0.042 | 0.162 |
| 2003 | 186,277 | 11,841 | 50,251 | 0.042 | 0.171 |
| 2004 | 223,657 | 18,721 | 62,493 | 0.050 | 0.169 |
| 2005 | 261,037 | 25,601 | 74,736 | 0.058 | 0.171 |
| 2006 | 290,153 | 29,437 | 78,477 | 0.067 | 0.162 |
| 2007 | 326,636 | 28,068 | 78,357 | 0.071 | 0.152 |
| 2008 | 280,970 | 25,819 | 59,611 | 0.067 | 0.149 |
| 2009 | 292,386 | 26,943 | 61,954 | 0.069 | 0.152 |
Appendix B
| Sectors | Firm Level | Exporting Proportion | Innovation Proportion | Innovation Intensity | Ln TFP |
|---|---|---|---|---|---|
| Manufacture of food products | High Technology | 0.193 | 0.121 | 0.027 | 5.069 |
| Manufacture of beverages | High Technology | 0.126 | 0.188 | 0.023 | 4.892 |
| Manufacture of tobacco products | High Technology | 0.253 | 0.414 | 0.025 | 6.482 |
| Manufacture of textiles | Low Technology | 0.369 | 0.101 | 0.017 | 4.712 |
| Manufacture of wearing apparel | Low Technology | 0.596 | 0.082 | 0.012 | 4.837 |
| Manufacture of leather and related products | Low Technology | 0.589 | 0.152 | 0.013 | 5.016 |
| Manufacture of wood and of products of wood and cork, except furniture; manufacture of articles of straw and plaiting materials | Low Technology | 0.253 | 0.104 | 0.006 | 4.772 |
| Manufacture of furniture | Low Technology | 0.437 | 0.124 | 0.010 | 4.790 |
| Manufacture of paper and paper products | Low Technology | 0.147 | 0.089 | 0.006 | 4.680 |
| Printing and reproduction of recorded media | Low Technology | 0.128 | 0.088 | 0.007 | 4.323 |
| Manufacture of coke and refined petroleum products | Low Technology | 0.085 | 0.149 | 0.010 | 5.533 |
| Manufacture of chemicals and chemical products | High Technology | 0.223 | 0.217 | 0.022 | 4.999 |
| Manufacture of basic pharmaceutical products and pharmaceutical preparations | High Technology | 0.248 | 0.445 | 0.055 | 4.961 |
| Manufacture of rubber and plastics products | Low Technology | 0.331 | 0.171 | 0.015 | 1.565 |
| Manufacture of other non-metallic mineral products | Low Technology | 0.182 | 0.135 | 0.012 | 4.692 |
| Manufacture of basic metals | Low Technology | 0.305 | 0.116 | 0.012 | 4.831 |
| Manufacture of machinery and equipment | Low Technology | 0.253 | 0.250 | 0.031 | 4.898 |
| Manufacture of motor vehicles, trailers and semi-trailers | High Technology | 0.382 | 0.245 | 0.025 | 4.928 |
| Manufacture of electrical equipment | High Technology | 0.406 | 0.361 | 0.057 | 5.040 |
| Manufacture of computer, electronic and optical products | High Technology | 0.636 | 0.131 | 0.013 | 4.891 |
| Other manufacturing | Low Technology | 0.054 | 0.056 | 0.006 | 5.695 |
Appendix C

References
- Melitz, M. The impact of trade on intra-industry reallocations and aggregate industry productivity. Econometrica 2003, 71, 1695–1725. [Google Scholar] [CrossRef]
- Bernard, A.B.; Eaton, J.; Jensen, J.B.; Kortum, S. Plants and productivity in international trade. Am. Econ. Rev. 2003, 93, 1268–1290. [Google Scholar] [CrossRef]
- Butos, P. Trade liberalization, exports and technology upgrading: Evidence on the impact of MERCOSUR on Argentinean firms. Am. Econ. Rev. 2011, 101, 304–340. [Google Scholar] [CrossRef]
- Caldera, A. Innovation and exporting: Evidence from Spanish manufacturing firms. Rev. World. Econ. 2010, 146, 657–689. [Google Scholar] [CrossRef]
- Krugman, P.A. Model of innovation, technology transfer, and the World distribution of income. J. Political Econ. 1979, 87, 253–266. [Google Scholar] [CrossRef]
- Grossman, G.M.; Helpman, E. Product development and international trade. J. Political Econ. 1989, 97, 1261–1283. [Google Scholar] [CrossRef] [Green Version]
- Eaton, J.; Kortum, S. Technology, trade and growth: A unified framework. Eur. Econ. Rev. 2001, 45, 742–755. [Google Scholar] [CrossRef]
- Eaton, J.; Kortum, S. Technology, geography, and trade. Econometrica 2002, 70, 1741–1779. [Google Scholar] [CrossRef]
- Grossman, G.M.; Helpman, E. Quality ladders and product cycles. Q. J. Econ. 1991, 106, 557–586. [Google Scholar] [CrossRef]
- Yeaple, S.R. A simple model of firm heterogeneity, international trade and wages. J. Int. Econ. 2005, 65, 1–20. [Google Scholar] [CrossRef]
- Aw, B.Y.; Roberts, M.J.; Winston, T. The complementary role of exports and R&D investments as sources of productivity growth. NBER Work. Pap. 2005. [Google Scholar] [CrossRef]
- Aw, B.Y.; Roberts, M.J.; Daniel, Y.X. R&D investments, exporting, and the evolution of firm productivity. Am. Econ. Rev. 2008, 98, 451–456. [Google Scholar]
- Basile, R. Export behavior of Italian manufacturing firms over the nineties: The role of innovation. Res. Policy. 2001, 30, 1185–1201. [Google Scholar] [CrossRef]
- Wagner, J. Exports and productivity: A survey of the evidence from firm-level data. World. Econ. 2007, 30, 60–82. [Google Scholar] [CrossRef]
- Girma, S.; Gorg, H.; Hanley, A. R&D and exporting: A comparison of British and Irish firms. Rev. World Econ. 2008, 144, 750–773. [Google Scholar]
- Harris, R.I.; Moffat, J.D. R&D, Innovation & Exporting in Britain: An Empirical Analysis. Available online: https://www.researchgate.net/publication/268352733 (accessed on 18 March 2011).
- Filipescu, D.A.; Prashantham, S.; Rialp, A.; Rialp, J. Technological innovation and exports: Unpacking their reciprocal causality. J. Int. Mark. 2013, 21, 23–38. [Google Scholar] [CrossRef]
- Rodil, O.; Vence, X.; Carreira, M.C. The relationship between innovation and export behaviour: The case of Galician firms. Technol. Forecast. Soc. Chang. 2015. [Google Scholar] [CrossRef]
- Imbriani, C.; Morone, P.; Testa, G. Innovation, quality and exports: The case of Italian SMEs. J. Int. Trade Econ. Dev. 2014, 23, 1089–1111. [Google Scholar] [CrossRef]
- Cassiman, B.; Golovko, E. Innovation and internationalization through exports. J. Int. Bus. Stud. 2011, 42, 56–75. [Google Scholar] [CrossRef]
- Lachenmaier, S.; Wößmann, L. Does innovation cause exports? Evidence from exogenous innovation impulses and obstacles using German micro data. Oxf. Econ. Pap. 2006, 58, 317–350. [Google Scholar] [CrossRef]
- Bartel, A.; Ichniowski, C.; Shaw, K. How does information technology affect productivity? Plant level comparisons of product innovation, process improvement, and worker skills. Q. J. Econ. 2007, 4, 1721–1758. [Google Scholar] [CrossRef]
- Becker, S.O.; Egger, P.H. Endogenous product versus process innovation and a firm’s propensity to export. Empir. Econ. 2007, 44, 1–26. [Google Scholar] [CrossRef]
- Cassiman, B.; Martinezros, E. Product innovation and exports: Evidence from Spanish manufacturing. IESE Work. Pap. 2007. Available online: http://dev3.cepr.org/meets/wkcn/6/6652/papers/Cassiman.pdf (accessed on 21 May 2007). [Google Scholar]
- Butter, F.D.; Möhlmann, J.L.; Wit, P. Trade and product innovations as sources for productivity increases: An empirical analysis. J. Prod. Anal. 2008, 30, 201–211. [Google Scholar] [CrossRef] [Green Version]
- Butter, F.D.; Essaghir, A. Productivity effects of trade and product innovations: An empirical analysis for 13 OECD countries. Appl. Econ. 2013, 45, 4412–4418. [Google Scholar] [CrossRef]
- Jakob, B.M. Innovations and manufacturing export performance in the OECD Countries. Oxf. Econ. Pap. 2008, 60, 143–167. [Google Scholar]
- Damijan, J.; Kostevc, Č.; Polanec, S. From innovation to exporting or vice versa? World Econ. 2010, 33, 374–398. [Google Scholar] [CrossRef]
- Yi, J.; Wang, C.; Kafouros, M. The effects of innovative capabilities on exporting: Do institutional forces matter? Int. Bus. Rev. 2013, 22, 392–406. [Google Scholar] [CrossRef]
- Matthieu, C.; Pamina, K. Structural gravity equations with intensive and extensive margins. Can. J. Econ. 2010, 43, 41–62. [Google Scholar]
- Hummels, D.; Klenow, P.L. The variety and quality of a nation’s exports. Am. Econ. Rev. 2005, 95, 704–723. [Google Scholar] [CrossRef]
- Felbermayr, G.J.; Kohler, W. Exploring the intensive and extensive margins of world trade. Rev. World Econ. 2006, 142, 642–674. [Google Scholar] [CrossRef]
- Dutt, P.; Mihov, I.; Zandt, T.V. The effect of WTO on the extensive and the intensive margins of trade. J. Int. Econ. 2013, 2, 204–219. [Google Scholar] [CrossRef]
- Helpman, E.; Melitz, M.J.; Rubinstein, Y. Estimating trade flows: Trading partners and trading volumes. Q. J. Econ. 2008, 123, 441–487. [Google Scholar] [CrossRef]
- Besedeš, T.; Prusa, T.J. The role of extensive and intensive margins and export growth. J. Dev. Econ. 2011, 2, 371–379. [Google Scholar] [CrossRef]
- Chen, W.C. The extensive and intensive margins of exports: The role of innovation. World Econ. 2013, 36, 607–635. [Google Scholar] [CrossRef]
- Klepper, S. Entry, exit, growth, and innovation over the product life cycle. Am. Econ. Rev. 1996, 86, 562–583. [Google Scholar]
- Verhoogen, E.A. Trade, quality upgrading, and wage inequality in the Mexican manufacturing sector. Q. J. Econ. 2008, 123, 489–530. [Google Scholar] [CrossRef]
- Ganotakis, P.; Love, J.M. R&D, product innovation, and exporting: Evidence from UK new technology based firms. Oxf. Econ. Pap. 2011, 63, 279–306. [Google Scholar]
- Olley, G.S.; Pakes, A. The dynamics of productivity in the telecommunications equipment industry. Econometrica 1996, 64, 1263–1297. [Google Scholar] [CrossRef]
- Levinsohn, J.; Petrin, A. Estimating production functions using inputs to control for unobservables. Rev. Econ. Stud. 2003, 70, 317–341. [Google Scholar] [CrossRef]
- Bernard, A.B.; Jensen, J.B.; Redding, S.; Scott, P.K. Firms in international trade. J. Econ. Perspect. 2007. [Google Scholar] [CrossRef]
- Agnihotri, A.; Bhattacharya, S. Determinants of export intensity in emerging markets: An upper echelon perspective. J. World Bus. 2015, 50, 687–695. [Google Scholar] [CrossRef]
- Serrasqueiro, Z.S.; Nunes, P.M. Performance and size: Empirical evidence from Portuguese SMEs. Small Bus. Econ. 2008, 31, 195–217. [Google Scholar] [CrossRef]
- Rasiah, R.; Shahrivar, R.B.; Yap, X.S. Institutional support, innovation capabilities and exports: Evidence from the semiconductor industry in Taiwan. Technol. Forecast. Soc. Chang. 2016, 109, 69–75. [Google Scholar] [CrossRef]
- Riding, A.; Orser, B.J.; Spence, M.; Belanger, B. Financing new venture exporters. Small Bus. Econ. 2012, 38, 147–163. [Google Scholar] [CrossRef]
- Freeman, J.; Styles, C. Does location matter to export performance? Int. Mark. Rev. 2013, 31, 181–208. [Google Scholar] [CrossRef]
- Long, C.; Zhang, X.B. Patterns of China’s industrialization: Concentration, specialization, and clustering. China Econ. Rev. 2012, 23, 593–612. [Google Scholar] [CrossRef]
- Faustino, H.C.; Matos, P.V. Exports, productivity and innovation: New firm level empirical evidence. Appl. Econ. 2015, 47, 4918–4933. [Google Scholar]
- Robert, M.J.; Tybout, J.R. The decision to export in Colombia: An empirical model of entry with sunk cost. Am. Econ. Rev. 1997, 87, 545–564. [Google Scholar]
- Foster, L.; Haltiwanger, J.; Syverson, C. Reallocation, firm turnover, and efficiency: Selection in productivity or profitability? Am. Econ. Rev. 2005, 98, 394–425. [Google Scholar] [CrossRef]
- Kugler, M.; Verhoogen, E. The quality-complementarity hypothesis: Theory and evidence from Colombia. NBER Work. Pap. 2008. [Google Scholar] [CrossRef]
- Imbs, J.; Wacziarg, R. Stages of diversification. Am. Econ. Rev. 2003, 90, 63–86. [Google Scholar] [CrossRef]
- Hausmann, R.; Hwang, J.; Rodrik, D. What You Export Matters. J. Econ. Growth 2007, 12, 1–25. [Google Scholar] [CrossRef]
- Hansen, B.E. Threshold effects in non-dynamic panels: Estimation, testing, and inference. J. Econ. 1999, 93, 345–368. [Google Scholar] [CrossRef]
- Schott, P.K. The relative sophistication of Chinese exports. Econ. Policy. 2008, 23, 5–49. [Google Scholar] [CrossRef]
- Coe, D.T.; Helpman, E. International R&D spillovers. Eur. Econ. Rev. 1995, 39, 859–877. [Google Scholar]
- Keller, W. International Technology Diffusion. J. Econ. Lit. 2004, 42, 752–782. [Google Scholar] [CrossRef]
- Greco, M.; Grimaldi, M.; Cricelli, L. An analysis of the open innovation effect on firm performance. Eur. Manag. J. 2016, 34, 501–516. [Google Scholar] [CrossRef]
- Ferreras-Méndez, J.L.; Newell, S.; Fernández-Mesa, A.; Alegre, J. Depth and breadth of external knowledge search and performance: The mediating role of absorptive capacity. Ind. Market. Manag. 2015, 47, 86–97. [Google Scholar] [CrossRef]
- West, J.; Bogers, M. Leveraging external sources of innovation: A review of research on open innovation. J. Prod. Innovat. Manag. 2014, 31, 814–831. [Google Scholar] [CrossRef]

| Variables | Mean Value | Standard Deviation | Minimum Value | Maximum Value | New Entry Mean Value | New Exit Mean Value | ||||||
|---|---|---|---|---|---|---|---|---|---|---|---|---|
| Exporting performance | ||||||||||||
| Extensive margin | 0.171 | 0.341 | 0 | 1 | 1 | 0 | ||||||
| Intensive margin | 0.276 | 0.447 | 0 | 1 | ||||||||
| Innovation activity | ||||||||||||
| Innovation dummy | 0.092 | 0.290 | 0 | 1 | 0.222 | 0.077 | ||||||
| Innovation intensity | 0.031 | 0.143 | 0 | 1 | 0.063 | 0.029 | ||||||
| Control variables | ||||||||||||
| Ln (TFP) | 4.351 | 1.052 | −5.209 | 12.490 | 4.539 | 4.598 | ||||||
| Ln (Geographic agglomeration index) | 2.037 | 2.035 | −6.279 | 8.052 | 2.511 | 2.542 | ||||||
| Ln (Age) | 1.832 | 0.935 | 0 | 4.060 | 1.827 | 1.963 | ||||||
| Ln (Number of employees) | 4.721 | 1.127 | 0.693 | 11.963 | 4.762 | 4.806 | ||||||
| Ln (Value of tax) | −3.680 | 1.136 | −15.350 | 5.152 | −3.73 | −3.648 | ||||||
| Receivable accounts ratio | 0.125 | 0.133 | 0 | 0.693 | 0.125 | 0.118 | ||||||
| Ln (Distance from the nearest seaport) | 6.799 | 0.544 | 0 | 8.169 | 6.223 | 7.115 | ||||||
| Variable | Direct Effect | Indirect Effect | Mutual Effects | |||
|---|---|---|---|---|---|---|
| Extensive Margin | Intensive Margin | Extensive Margin | Intensive Margin | Extensive Margin | Intensive Margin | |
| Innovation activity (t − 1) | ||||||
| Innovation intensity | 1.643 *** (0.103) | −0.356 *** (0.024) | 1.279 *** (0.178) | −0.365 *** (0.044) | ||
| Innovation intensity2 | −1.402 *** (0.119) | 0.492 *** (0.028) | −1.410 *** (0.120) | 0.478 *** (0.028) | ||
| Control variables (t − 1) | ||||||
| Ln (TFP) | 0.147 *** (0.042) | 0.016 (0.012) | 0.161*** (0.042) | 0.008 (0.012) | 0.142 *** (0.010) | 0.016 (0.012) |
| Innovation * Ln (TFP) | 0.097 *** (0.006) | 0.019 *** (0.006) | 0.075 ** (0.030) | 0.022 *** (0.007) | ||
| Ln (Ages) | 0.074*** (0.011) | 0.053 *** (0.003) | 0.064 *** (0.010) | 0.056 *** (0.003) | 0.075 *** (0.011) | 0.053 *** (0.003) |
| Ln (Number of employees) | 0.164 *** (0.008) | 0.031 *** (0.002) | 0.176 *** (0.008) | 0.035 *** (0.002) | 0.164 *** (0.008) | 0.031 *** (0.002) |
| Ln (Value of tax) | −0.073 *** (0.008) | −0.053 *** (0.002) | −0.073 *** (0.008) | −0.054*** (0.002) | −0.073 *** (0.008) | −0.053 *** (0.002) |
| Receivable accounts ratio | −0.205 *** (0.022) | −0.105 *** (0.025) | −0.189 *** (0.022) | −0.107 *** (0.026) | −0.195 *** (0.022) | −0.106 *** (0.025) |
| Ln (Geographic agglomeration index) | 0.038 *** (0.004) | −0.004 *** (0.001) | 0.036 *** (0.004) | −0.003 *** (0.001) | 0.038 *** (0.004) | −0.004 *** (0.001) |
| Ln (Distance from the nearest seaport) | −0.003 *** (0.001) | −0.001 *** (0.000) | −0.004 ** (0.002) | −0.002 ** (0.001) | −0.002 *** (0.000) | −0.003 *** (0.001) |
| Exportit−1 | 2.701 *** (0.018) | 2.710 *** (0.018) | 2.700 *** (0.017) | |||
| Fixed effects | Yes | Yes | Yes | |||
| λ | −0.114 *** (0.004) | −0.114 *** (0.004) | −0.114 *** (0.004) | |||
| Wald | 2907.89 (0.000) | 2723.06 (0.000) | 2908.28 (0.000) | |||
| LR test: chi2 (1) Prob > chi2 | 345.08 (0.000) | 396.05 (0.000) | 332.55 (0.000) | |||
| Observations | 1,144,415 | 1,144,415 | 1,144,415 | 1,144,415 | 1,144,415 | 1,144,415 |
| Variable | Low-Technology Sectors | High-Technology Sectors | ||
|---|---|---|---|---|
| Extensive Margin | Intensive Margin | Extensive Margin | Intensive Margin | |
| Innovation activity (t − 1) | ||||
| Innovation intensity | 1.101 *** (0.613) | −0.058 (0.118) | 1.760 *** (0.274) | −0.092 *** (0.002) |
| Innovation intensity2 | −1.147 *** (0.119) | 0.181 (0.365) | −1.114 *** (0.198) | 0.449 *** (0.121) |
| Control variables (t − 1) | ||||
| Ln (TFP) | 0.128 *** (0.005) | 0.012 (0.008) | 0.101 *** (0.005) | 0.018 (0.012) |
| Innovation * Ln (TFP) | 0.047 (0.109) | 0.032 (0.027) | 0.089 * (0.048) | 0.048 *** (0.007) |
| Ln (Ages) | 0.009 (0.013) | 0.011 *** (0.004) | 0.005 (0.010) | −0.011 *** (0.003) |
| Ln (Number of employees) | 0.145 *** (0.005) | 0.013 *** (0.002) | 0.046 *** (0.010) | 0.049 *** (0.005) |
| Ln (Value of tax) | −0.041 *** (0.012) | −0.008 ** (0.004) | −0.079 *** (0.012) | −0.048 *** (0.003) |
| Receivable accounts ratio | 0.372 *** (0.138) | −0.330 *** (0.043) | −0.389 *** (0.037) | −0.217 *** (0.014) |
| Ln (Geographic agglomeration index) | 0.031 *** (0.008) | 0.012 *** (0.002) | 0.036 *** (0.006) | −0.001 (0.001) |
| Ln (Distance from the nearest seaport) | −0.002 ** (0.001) | −0.002 (0.015) | −0.001 *** (0.000) | −0.003 *** (0.001) |
| Export it−1 | 2.933 *** (0.028) | 2.781 *** (0.024) | ||
| DUMMY | Yes | Yes | ||
| λ | −0.162 *** (0.008) | −0.129 *** (0.006) | ||
| Wald | 686.52 (0.000) | 1880.49 (0.000) | ||
| LR test: chi2 (1) Prob >chi2 | 164.21 (0.000) | 397.52 (0.000) | ||
| Observations | 794,276 | 794,276 | 350,139 | 350,139 |
| Extensive Margin | Intensive Margin | ||
|---|---|---|---|
| Single Threshold Test (p-value) | 0.05 | Single Threshold Test (p-value) | 0.01 |
| Double Threshold Test (p-value) | 0.68 | Double Threshold Test (p-value) | 0.11 |
| Triple Threshold Test (p-value) | 0.88 | Triple Threshold Test (p-value) | 0.10 |
| Innoit−1 (qit ≤ 3.36) | 0.008 ** (0.004) | Innoit−1 (qit ≤ 5.93) | −0.077 *** (0.036) |
| Innoit−1 (qit > 3.36) | −0.032 *** (0.009) | Innoit−1 (qit > 5.93) | 0.083 *** (0.023) |
| LR(γ) | 7.33 | LR(γ) | 7.19 |
| Sum of Square Errors | 1482.00 | Sum of Square Errors | 195.92 |
| Confidence Interval | (−1.14, 3.77) | Confidence Interval | (5.66, 6.14) |
| (10%, 5%, 1% critical values) | (11.5, 12.9, 17.5) | (10%, 5%, 1% critical values) | (10.2, 12.4, 18.2) |
| Extensive Margin | Innovation Intensity < 0.45 | Total Number of Firms | Proportion | Mean Value of Innovation Intensity | Mean Value of Export Intensity |
|---|---|---|---|---|---|
| new exporters (number of firms) | |||||
| 2002 | 3793 | 3963 | 95.71% | 0.044 | 0.405 |
| 2003 | 3913 | 4083 | 95.84% | 0.049 | 0.426 |
| 2004 | 6047 | 6362 | 95.10% | 0.062 | 0.373 |
| 2005 | 8147 | 8641 | 94.28% | 0.074 | 0.319 |
| 2006 | 7504 | 7981 | 94.02% | 0.068 | 0.394 |
| 2007 | 7054 | 7632 | 92.43% | 0.078 | 0.414 |
| 2008 | 5076 | 5322 | 95.37% | 0.063 | 0.389 |
| 2009 | 6065 | 6467 | 93.78% | 0.071 | 0.401 |
| Intensive Margin | Innovation Intensity > 0.38 | Total Number of Firms | Proportion | Mean Value of Innovation Intensity | Mean Value of Export Intensity |
|---|---|---|---|---|---|
| exporters of scale increase (number of firms) | |||||
| 2002 | 266 | 1441 | 18.46% | 0.638 | 0.248 |
| 2003 | 341 | 1723 | 19.79% | 0.651 | 0.278 |
| 2004 | 487 | 2026 | 24.06% | 0.672 | 0.313 |
| 2005 | 679 | 2398 | 28.32% | 0.692 | 0.348 |
| 2006 | 785 | 2761 | 28.43% | 0.687 | 0.356 |
| 2007 | 871 | 3087 | 28.21% | 0.696 | 0.340 |
| 2008 | 572 | 1873 | 30.54% | 0.673 | 0.314 |
| 2009 | 722 | 2608 | 27.68% | 0.685 | 0.327 |
© 2016 by the authors; licensee MDPI, Basel, Switzerland. This article is an open access article distributed under the terms and conditions of the Creative Commons Attribution (CC-BY) license (http://creativecommons.org/licenses/by/4.0/).
Share and Cite
Hao, L.; Qiu, B.; Cervantes, L. Does Firms’ Innovation Promote Export Growth Sustainably?—Evidence from Chinese Manufacturing Firms. Sustainability 2016, 8, 1173. https://doi.org/10.3390/su8111173
Hao L, Qiu B, Cervantes L. Does Firms’ Innovation Promote Export Growth Sustainably?—Evidence from Chinese Manufacturing Firms. Sustainability. 2016; 8(11):1173. https://doi.org/10.3390/su8111173
Chicago/Turabian StyleHao, Liangfeng, Bin Qiu, and Lisette Cervantes. 2016. "Does Firms’ Innovation Promote Export Growth Sustainably?—Evidence from Chinese Manufacturing Firms" Sustainability 8, no. 11: 1173. https://doi.org/10.3390/su8111173