Article

Land Degradation Monitoring in the Ordos Plateau of China Using an Expert Knowledge and BP-ANN-Based Approach

1
School of Geography, Beijing Normal University, Beijing 100875, China
2
State Key Laboratory of Earth Surface Processes and Resource Ecology, Beijing Normal University, Beijing 100875, China
3
Department of Geography, University of Wisconsin-Madison, Madison, WI 53706, USA
4
Jiangsu Center for Collaborative Innovation in Geographical Information Resource Development and Application and School of Geography, Nanjing Normal University, Nanjing 210023, China
5
State Key Laboratory of Resources and Environmental Information System, Institute of Geographic Sciences and Natural Resources Research, Chinese Academy of Sciences, Beijing 100101, China
6
Department of Geography, Kent State University, Kent, OH 44240, USA
7
China Institute of Water Resources and Hydropower Research, Beijing 100048, China
8
Bureau of Land and Resources, Feicheng 271600, China
*
Author to whom correspondence should be addressed.
Sustainability 2016, 8(11), 1174; https://doi.org/10.3390/su8111174
Submission received: 26 September 2016 / Accepted: 8 November 2016 / Published: 13 November 2016

Abstract

:
Land degradation monitoring is of vital importance to provide scientific information for promoting sustainable land utilization. This paper presents an expert knowledge and BP-ANN-based approach to detect and monitor land degradation in an effort to overcome the deficiencies of image classification and vegetation index-based approaches. The proposed approach consists of three generic steps: (1) extraction of knowledge on the relationship between land degradation degree and predisposing factors, which are NDVI and albedo, from domain experts; (2) establishment of a land degradation detecting model based on the BP-ANN algorithm; and (3) land degradation dynamic analysis. A comprehensive analysis was conducted on the development of land degradation in the Ordos Plateau of China in 1990, 2000 and 2010. The results indicate that the proposed approach is reliable for monitoring land degradation, with an overall accuracy of 91.2%. From 1990–2010, a reverse trend of land degradation is observed in Ordos Plateau. Regions with relatively high land degradation dynamic were mostly located in the northeast of Ordos Plateau. Additionally, most of the regions have transferred from a hot spot of land degradation to a less changed area. It is suggested that land utilization optimization plays a key role for effective land degradation control. However, it should be highlighted that the goals of such strategies should aim at the main negative factors causing land degradation, and the land use type and its quantity must meet the demand of population and be reconciled with natural conditions. Results from this case study suggest that the expert knowledge and BP-ANN-based approach is effective in mapping land degradation.

1. Introduction

Land degradation, which essentially describes the circumstances of the reduced biological productivity of land [1,2], ranks among the greatest global environmental challenges and affects the livelihoods of millions of people [1,2]. However, given the importance of the problem and its recognition as a global issue, it is surprising that to-date, no consensus has been established on adequate methods for land degradation monitoring and assessment [3]. Not surprisingly, the geographical extent of land degradation remains poorly understood [4,5,6,7]. The lack of information about its extent and intensity makes it difficult to formulate conscious land degradation prevention planning [8]. Therefore, monitoring land degradation is not only vital, but is also an urgent scientific issue that must receive attention; it is essential for promoting sustainable land utilization at local, regional and global scales. However, to meet practical needs, there still exists a huge gap in present studies.
The technology and products of remote sensing have been widely applied in land degradation monitoring [2,3,5,7,9,10,11,12,13,14,15,16,17,18,19,20,21,22,23,24,25,26,27,28,29,30,31,32,33,34,35,36,37,38,39,40,41,42]. Two main approaches, image classification [10,11,12,13,14,15,16,17,18,19,20,21,22,23] and using vegetation index/productivity as indicators [5,7,9,26,27,28,29,30,31,32,33,34,35,36,37,38,39,40,41], are usually followed. Image classification for land degradation monitoring usually relies on visual interpretation, statistical methods, including maximum-likelihood, clustering and discrimination analysis or methods based on principal components analysis, no matter what kinds of remote sensing images are used [10,11,12,13,14,15,16,17,18,19,20,21,22,23]. Although image classification methods can make comprehensive use of color, shape, texture and other features and are especially applicable to static detection of macro- and micro-scale desertification when combined with other non-remote sensing data and expert knowledge, however, in the case of large-scale land degradation monitoring, these methods are characterized by high workload and low efficiency, strong subjectivity for assessment and incomplete quantification [24,25,26].
Thereafter, the products of vegetation indices and productivities, which are relatively easy to quantify using Earth observation, have been widely adopted as indicators of land degradation, to improve degradation monitoring efficiency at large scales. Since land degradation ultimately leads to long-lasting and observable loss of vegetation cover and biomass productivity over time and space [1,2,4,5,9], so it can be detected by comparing actual vegetation levels with potential levels [5,7,9,26,27,28,29,30,31,32,33,34,35,36,37,38,39,40,41,42]. Among various vegetation indices and productivities, the normalized difference vegetation index (NDVI) [26,27,28,29,30,31] and net primary productivity (NPP) [32,33,34,35,36,37,38,39,40,41,42] have demonstrated their reliability in monitoring land degradation. However, the reduction of NDVI/NPP is related to many natural factors, such as precipitation and seasonal variation, and human activities, such as land use [5,9,32,37,38,42,43]. Additionally, degradation of valuable resources such as biodiversity or specific soil properties may not necessarily result in productivity loss in the short term [7]. Therefore, a reduction of NDVI or NPP does not definitely imply land degradation [5,9,29,38,42,43]; more fieldwork is needed to determine the specific causes of NDVI/NPP reduction [5,32,34,36,42,43]. Thus, land degradation monitoring, empirical or deterministic, requires more than vegetation measurements. Generally, multiple remote sensing index-based land degradation monitoring can be achieved through combining NDVI/NPP with rain use efficiency (RUE), maritime spatial data infrastructure (MSDI), land surface albedo and land surface temperature (LST) [3,7,9,29,30,44,45]; while these studies heavily rely on the statistics relation of NDVI/NPP with the other indicators, without considering the biological and physical basis for determining land degradation. That is to say, field verification of the biophysics of remote sensing indices is still needed [45]. In summary, developing a comprehensive method making full use of expert knowledge, remote sensing data and field survey data is of great significance for meeting the urgent need of land degradation monitoring.
This paper, therefore, aims to propose a practical method for comprehensive land degradation monitoring, hopes to take full advantages of remote sensing indices and field investigated information. In the following sections, we describe the methodological framework, using Ordos Plateau of China as the research area. The first part is about the basic ideas and framework of the research. Then comes the procedures of constructing the relationship between land degradation degrees and the remote sensing indices using small amount of samples. The third is the establishment of an integrated land degradation monitoring model combining NDVI and albedo with the support of an artificial neural network. Last, the reliability of the method and the dynamics of land degradation in the Ordos Plateau are analyzed.

2. Materials and Methods
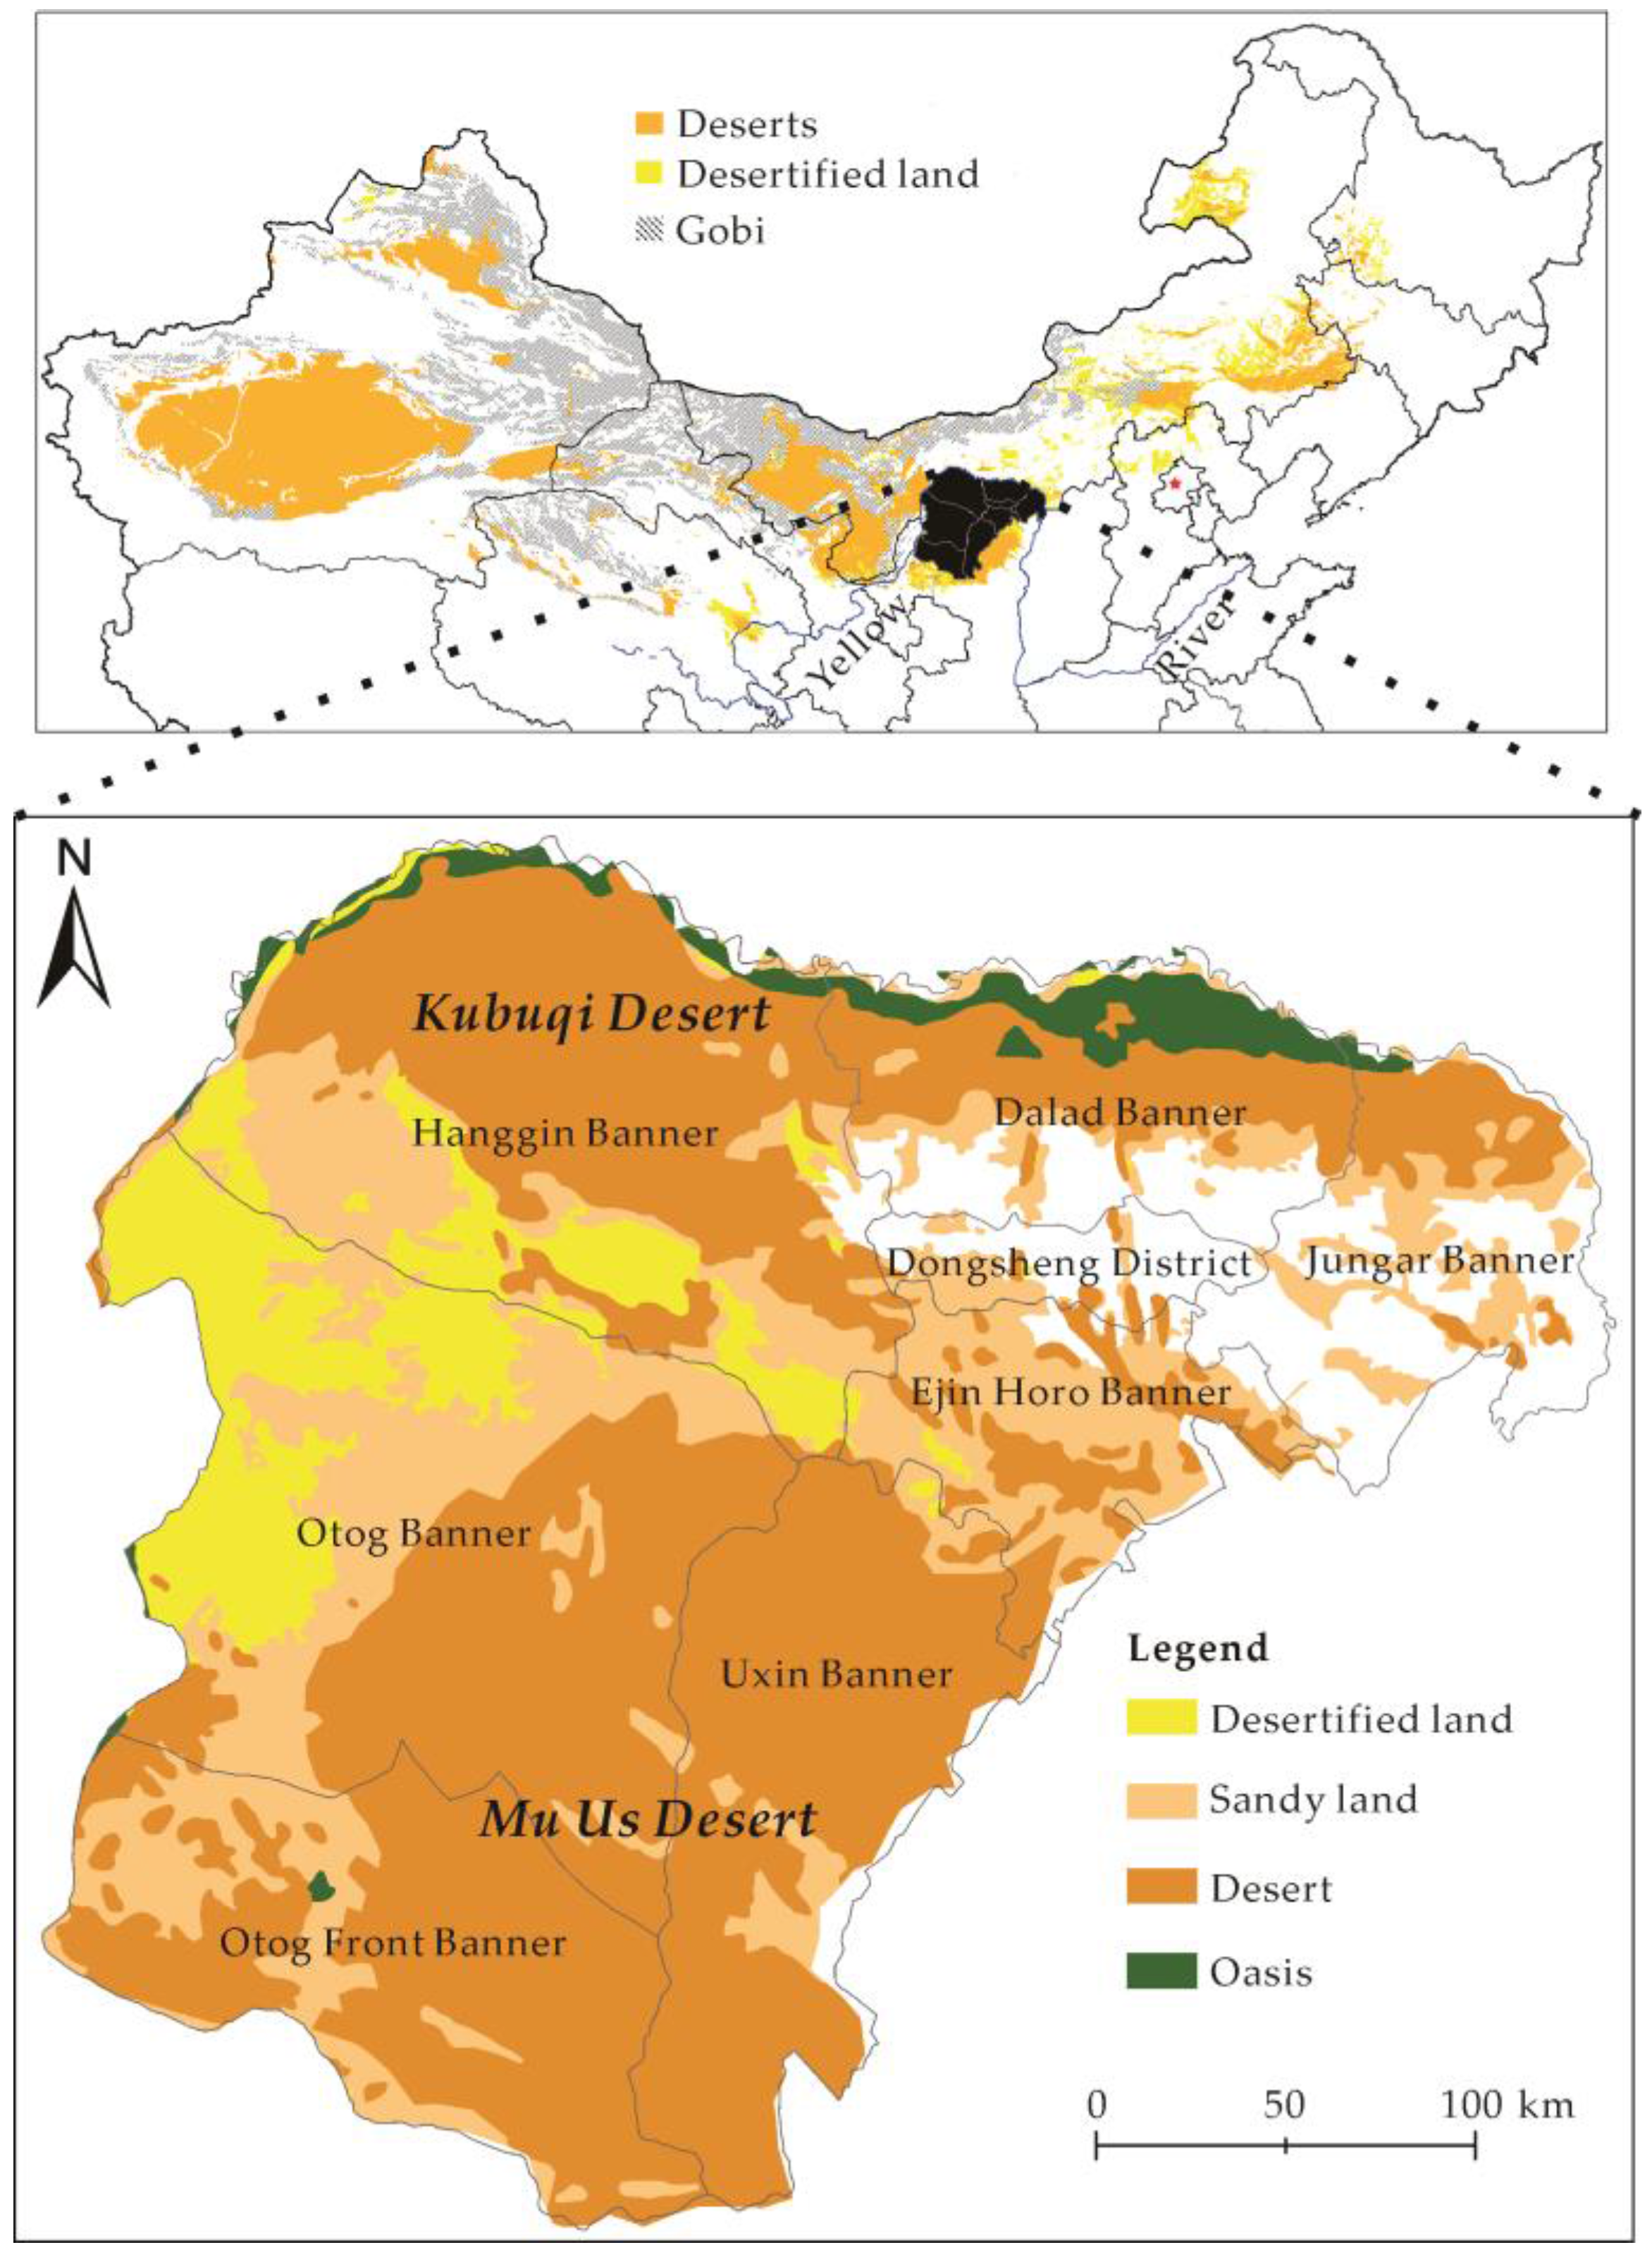
2.1. Study Area

The Ordos Plateau is located in the north central of China (Figure 1). It lies in a semiarid-arid farm pastoral region from 37°41′–40°51′N, 106°42′–111°31′E and has an elevation of 1100–1500 m. Three sides of the plateau are bounded by the Yellow River, and one side is bounded by the Great Wall. It borders Shanxi, Shaanxi and Ningxia in the southeast and west and faces Huhhot, the capital of Inner Mongolia, and Baotou City in the north across the Yellow River. The plateau is dominated by an extreme continental climate, with an average annual temperature of 6–8 °C and an average annual precipitation of 150–500 mm. The precipitation mainly occurs from July–September and diminishes from southeast to northwest. The average evapotranspiration is 2506.3 mm, approximately 7.2-times the precipitation. High winds strike the area frequently, with strong wind-sand activity and an average of 26 high wind days per year. Loose surface materials and rich sand sources cover the area, and sandstorms are prevalent [46].
The Ordos Plateau has been extensively studied in the research of land degradation, especially wind-induced desertification [16,21,27,44,46,47,48,49,50]. Research by Cui et al. showed that the total desertified area of the Kubuqi Desert on the Ordos Plateau decreased by 13.29% from 1989–2002, but the land desertification of the southeast area, which has a dense population, worsened by 2007 [20]. Runnström’s study suggested a reversal trend of land degradation [27]. Ma et al. pointed out that the forested area of the Ordos Plateau increased since 2000, with a reversal of land degradation [44]. However, Liu et al. noted that the degraded area in the west of the Ordos Plateau showed an average annual growth rate of 0.35% from 1989–2005, with severe and deteriorating trends [21]. In the above-mentioned research, non-uniform interpretation keys and inconsistent indexes led to different monitoring results in the same period, which shows that it is necessary to develop a land degradation monitoring method that is applicable to different areas and is highly efficient and precise.

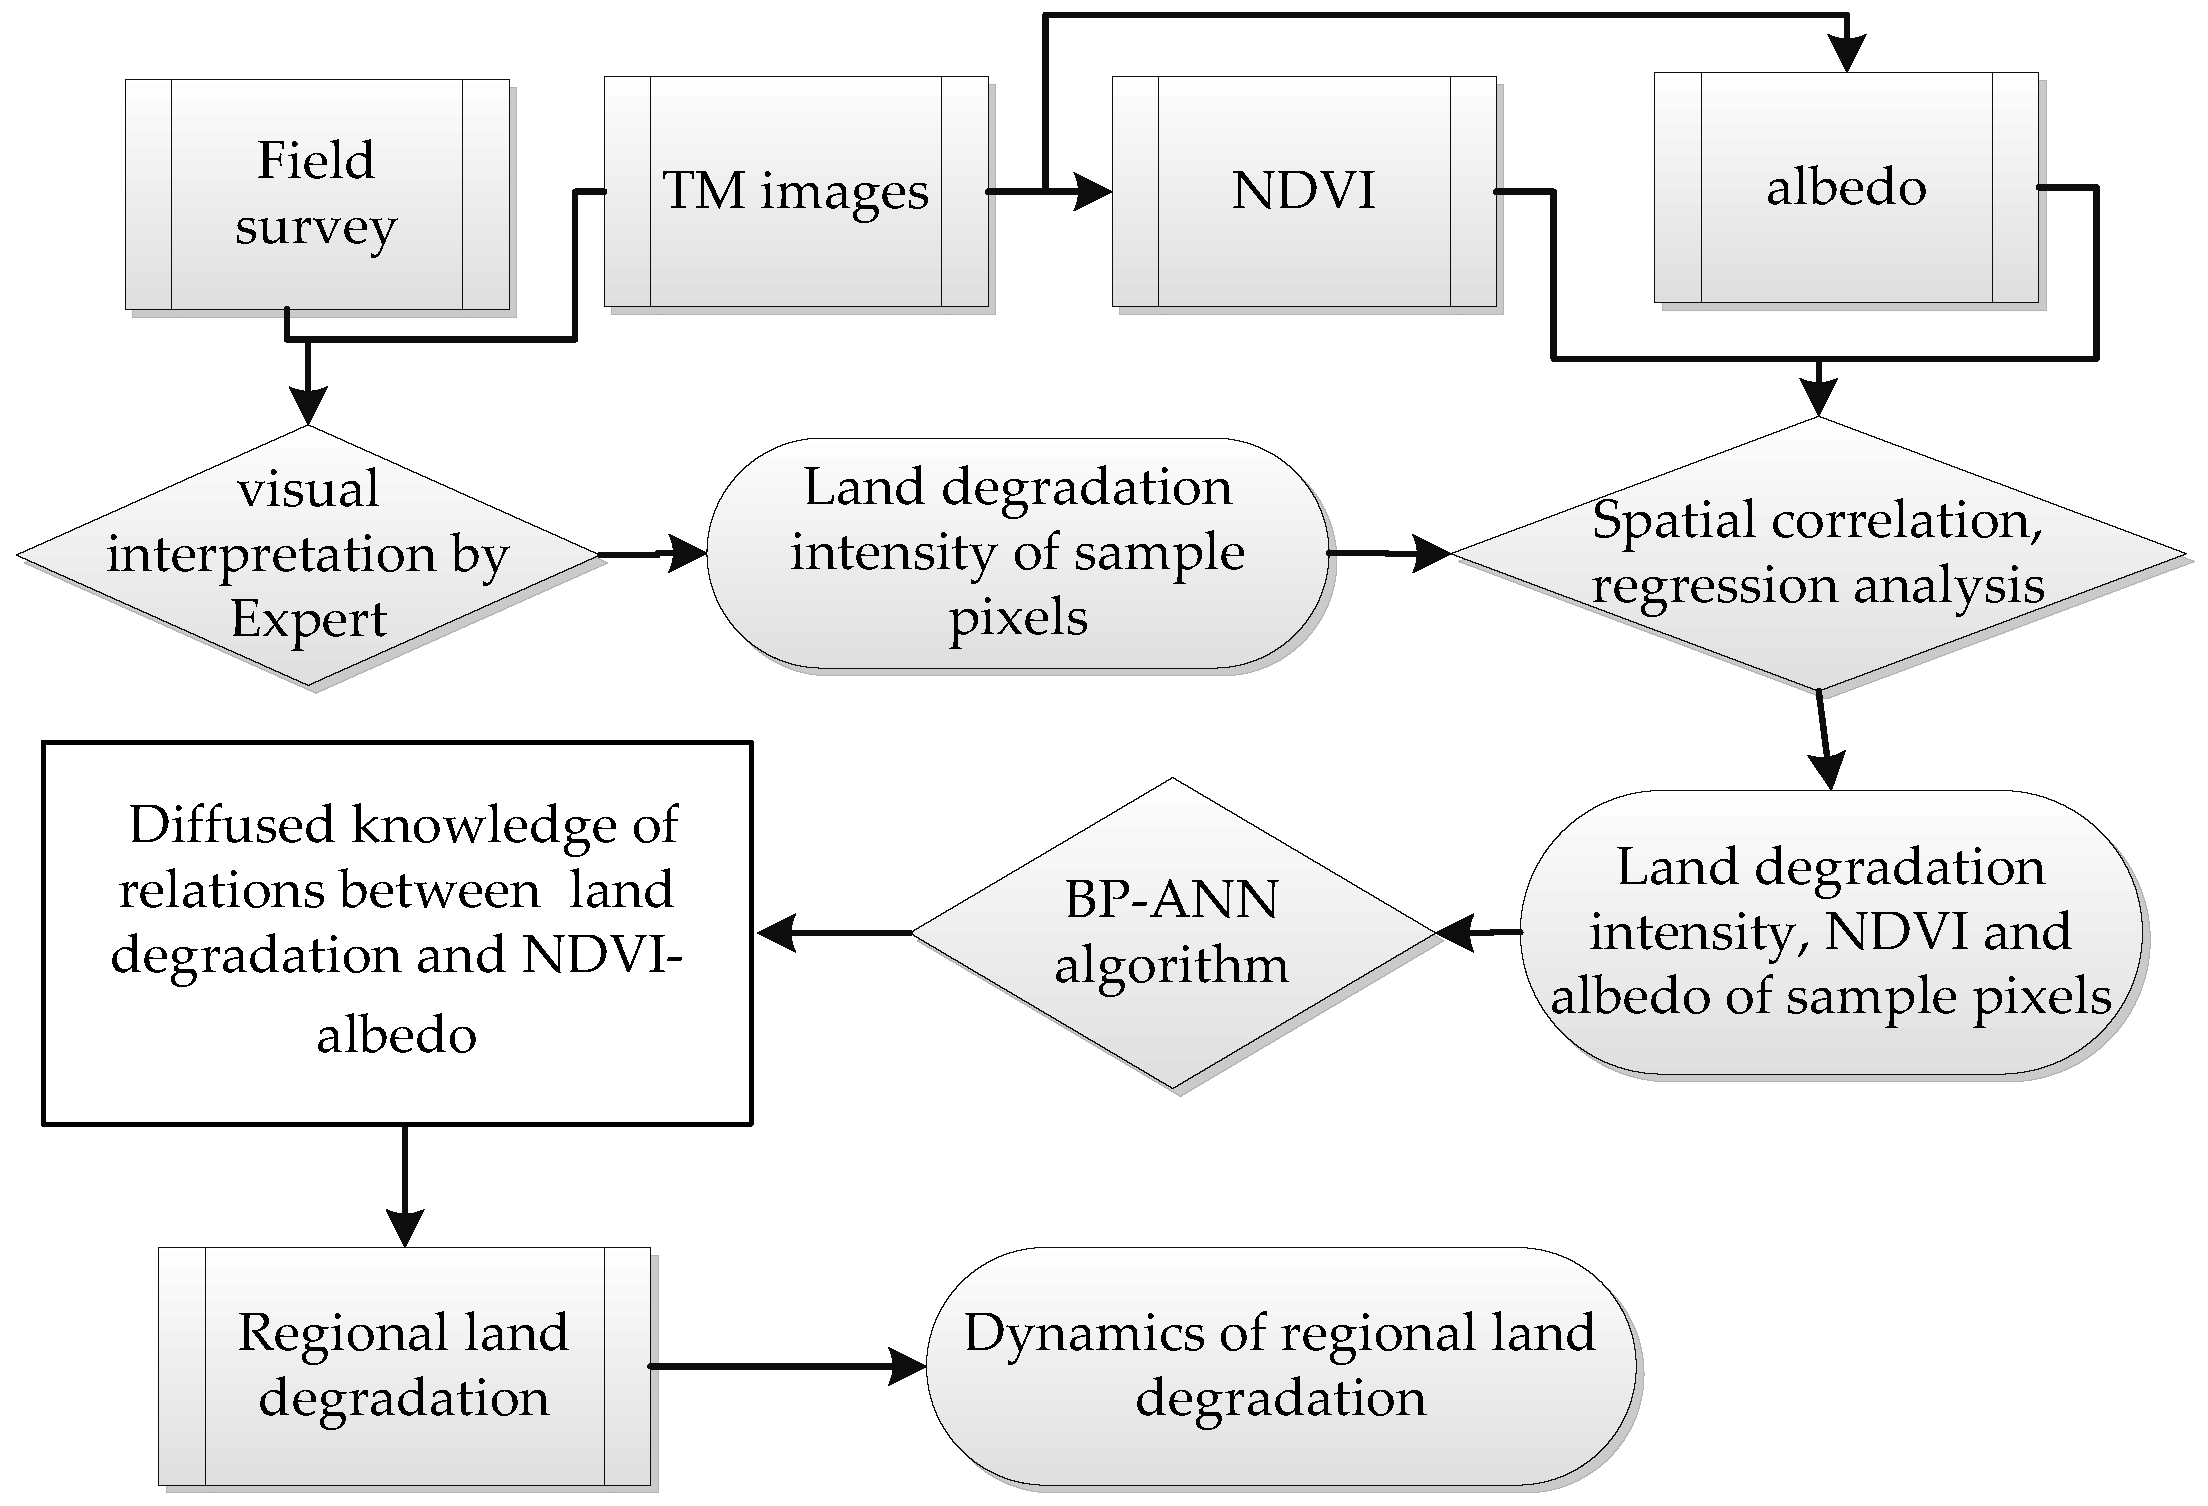
2.2. Research Framework

Land degradation for this paper follows the definition proposed by the United Nations Convention to Combat Desertification (UNCCD) as the reduction or loss, in arid, semi-arid and dry sub-humid areas, of the biological or economic productivity [1]. Since land degradation ultimately results in long-lasting and observable loss of vegetation cover and biomass productivity over time and space, this leads to NDVI decreases, and also albedo increases. Because NDVI represents the coverage of vegetation, while albedo represents such characteristics as surface soil moisture, surface roughness and texture, there is an obvious inverse, physical relationship between NDVI and albedo. Therefore, NDVI-albedo reflects the land surface conditions of land degradation of various degrees.
The basic idea of our proposed approach to detect and monitor land degradation is to obtain the relationships between land degradation intensity and the NDVI-albedo indicator for a certain study area directly from local experts and then apply these relationships to an evaluation of the land degradation at each location in the study area. For achieving high precision and high efficiency of land degradation detection, our proposed approach obeys the basic principles of using expert knowledge to construct the relationship between the NDVI-albedo and the land degradation and using as few training samples as possible to extract knowledge on such relations to reduce workload, but excavate the knowledge as much as possible for land degradation detection.
The proposed approach consists of three general steps (Figure 2): (1) expert(s) knowledge extraction by identifying land degradation and its intensity of sample areas with knowledgeable and experiential experts using visual interpretation of Landsat Thematic (TM) images, supported by a field survey (see Section 2.3.1); (2) establishment of a land degradation detecting model based on the relationships of land degradation degree and NDVI-albedo, by simulating the expert’s thinking logic and process using the back propagation artificial neural network (BP-ANN) (see Section 2.3.2); (3) land degradation prediction and its dynamic monitoring (see Section 2.3.3).

2.3. Method

2.3.1. Construction of Land Degradation Detecting Knowledge

NDVI and albedo were selected to develop the land degradation detection model. The NDVI is defined as [9,11]:
N D V I = N I R R N I R + R
where NIR and R are the near-infrared and infrared bands, respectively.
Albedo represents the reflection characteristics of the surface exposed to solar radiation. High temperature and decreasing precipitation in degraded areas result in reductions of vegetation, surface moisture and surface complexity. Therefore, the surfaces absorb little solar shortwave radiation, and the sensor receives high spectral radiances as albedo correspondingly increases [51]. Therefore, albedo is an important indicator of degraded land [52]. The formula proposed by Liang [53] was used to calculate albedo:
A l b e d o = 0.356 ρ T M 1 + 0.13 ρ T M 3 + 0.373 ρ T M 4 + 0.085 ρ T M 5 + 0.072 ρ T M 7 0.0018
where ρ T M 1 , ρ T M 3 , ρ T M 4 , ρ T M 5 and ρ T M 7 refer to the 1st, 3rd, 4th, 5th and 7th TM image bands, respectively.
The quality and sufficiency of knowledge, in terms of the relationships between land degradation intensity and predisposing factors, are essential to the success of land degradation mapping. For detecting land degradation using NDVI and albedo indices, we hypothesize that the local domain experts have sufficient knowledge and practical experiences to correctly identify land degradation on remote sensing images. Since the quality of the extracted knowledge depends heavily on the quality of the expert(s) [54,55], an expert should be, we emphasize, someone who has an extensive theoretical understanding, as well as field experience in land degradation studies. In this study, the experts are the co-authors of this paper, who have worked on land degradation in northern and western China for a long time [42,49,50,56,57,58,59,60,61,62]. Land degradation detecting knowledge from local domain experts can be constructed following two steps. (1) Sample pixels for extracting expert knowledge were randomly selected for each TM image. Then, each pixel was classified into land degradation degree using visual interpretation combined with knowledge and practical experiences. Correspondingly, the NDVI and albedo of each pixel were calculated. (2) Then there is the establishment of the land degradation index (LDI) based on the NDVI-albedo feature space.
The expert knowledge approach has its disadvantages of subjectivity and regional dependency. For minimizing such disadvantages, the repeated experiments and double blind test are introduced. That is, of the same selected sample pixels, their land degradation degrees are identified repeatedly by different authors independently, until stable recognition results can be obtained; then, a double-blind accuracy test between different authors is carried out; for those controversial samples, we determine their land degradation degree by consultation. Thus, a more stable and objective identification criteria of land degradation can be established through the above procedures. Finally, a summary of the domain knowledge, that is the relationship between land degradation degree and the predisposing factors in the study area, is shown in Table 1.
At present, there is no uniform standard for evaluating the land degradation intensity. Most of the existing standards are heavily related to the study area, the land degradation type and the remote sensing data used. Therefore, the above criteria have to a certain extent regional limitations. However, these criteria and their determining procedure are suitable for arid and semi-arid regions like the Ordos Plateau.
Then, the quantitative relationship between land degradation indicators of NDVI and albedo can be expressed using a linear equation:
A l b e d o = a N D V I + b
Lastly, LDI, which is the location of the vertical direction in the albedo-NDVI feature space, can be expressed by a simple binary linear polynomial expression [34]:
L D I = k N D V I A l b e d o
where k is the reciprocal of the absolute value of a, the slope of regression equation established by NDVI and albedo.
LDI reflects the conditions of both land cover and degraded land, and it has a clear biological and physical meaning. Therefore, degraded lands can be effectively identified using LDI. However, LDI was constructed based on only a few sample pixels, to improve the land degradation detection accuracy, the BP-ANN algorithm is further applied to train and imitate its relation of LDI with the land degradation degrees.

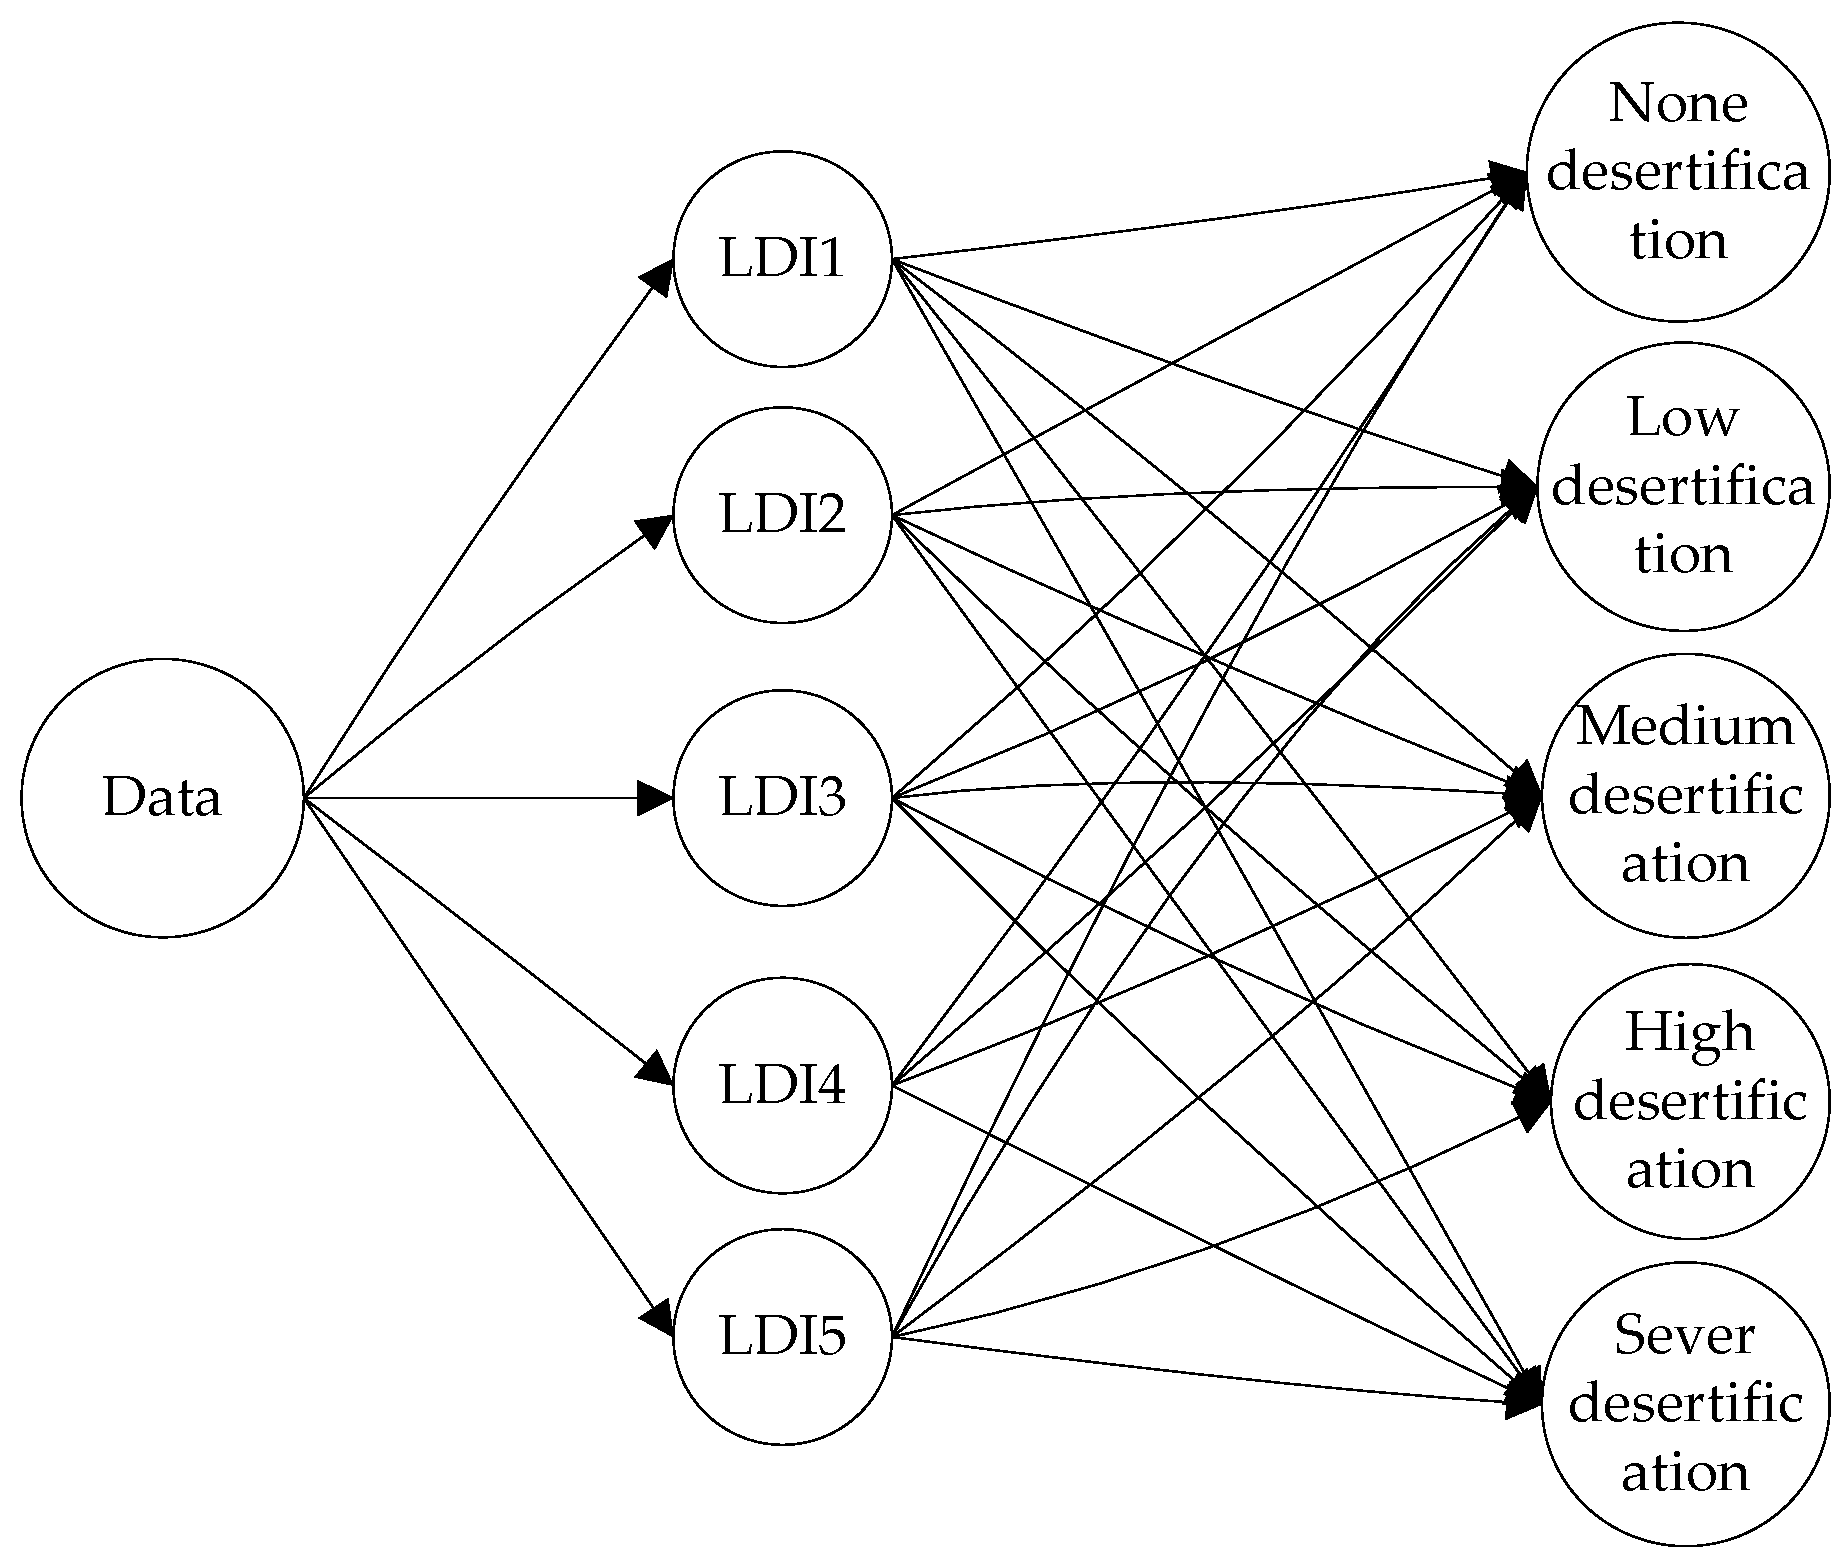
2.3.2. Establishment of Land Degradation Detecting Model Based on the BP-ANN Algorithm

Artificial neural networks (ANN) can achieve rapid and high-precision remote sensing image classification by imitating the visual activity and logical judgment of image analysis experts based on finite sample data [63,64,65]. We therefore adopted BP-ANN, an algorithm of ANN that adjusts and trains the weight and deviation of the network repeatedly via a back-propagation algorithm, to establish a training-based model that relates degradation degree with LDI. The neural network includes an input layer, output layer and hidden layer, and adjacent neurons are connected by a weight coefficient. The designed input layer in this paper has one node, while the hidden layer and output layer have five nodes (Figure 3).
When a pair of learning samples is provided for the network, each neuron acquires the input response of the network to generate a connection weight, modifies each connection weight from the output layer through the inter-layer in the direction of reducing the error between the expected output and actual output and returns to the input layer. This process is repeated and alternated until the overall error of the network converges to a given minimum value, when the learning process is concluded. In this research, the training samples are land degradation degrees and the corresponding LDI; the training was controlled at 2000 times, and the training error was controlled at 0.01. At last, the land degradation detection model, an exponential model, can be fitted out using output land degradation degree and corresponding LDI, as Equation (5),
Y = m e L D I + n
where Y is the land degradation degree of each pixel and m and n are fitting coefficients of the exponential model. Then, this model is scaled up to detect land degradation at the regional scale.

2.3.3. Land Degradation Monitoring Using Dynamic Analysis

A degradation dynamic (DD) index was adopted to reveal the land degradation change in a monitoring period. The formula is modified from Zhu and Li [66], which was developed to monitor land use change,
D D = 1 n Δ D i j 1 n Δ D i × 100 %
where DD is the comprehensive dynamic index of land degradation change, Di refers to the area of land degradation degree i at the monitoring start time and ∆Di−j refers to the area of land degradation degree i converting into other degrees from the start time to end time of monitoring.

2.4. Data Sources

The primary data were Landsat TM images at a resolution of 30 m (Scene Nos. 127/32, 127/33, 128/32, 128/33, 128/34, 129/32 and 129/33), which were obtained in the summers of 1990, 2000 and 2010. Image preprocessing included radiometric calibration, atmospheric correction, mosaicking and clipping. The FLAASH module was used for calibration with support of ENVI Version 5.3 (Exelis Visual Information Solutions, Inc., Broomfield, CO, USA). Image mosaicking was based on geographic coordinates, and the mosaics were clipped with the administrative boundary to produce the research area images. The WGS1984 projection was used for all images.
In addition, in total, 500 sample points were measured by field investigation in August 2011. For each sample point, a SpectroSense2 vegetation spectrometer was used to measure the NDVI, the vegetation coverage of the sample points were measured using the line transect method, and the land use type was recorded. These samples are used to verify the accuracy of land degradation detection.

3. Results

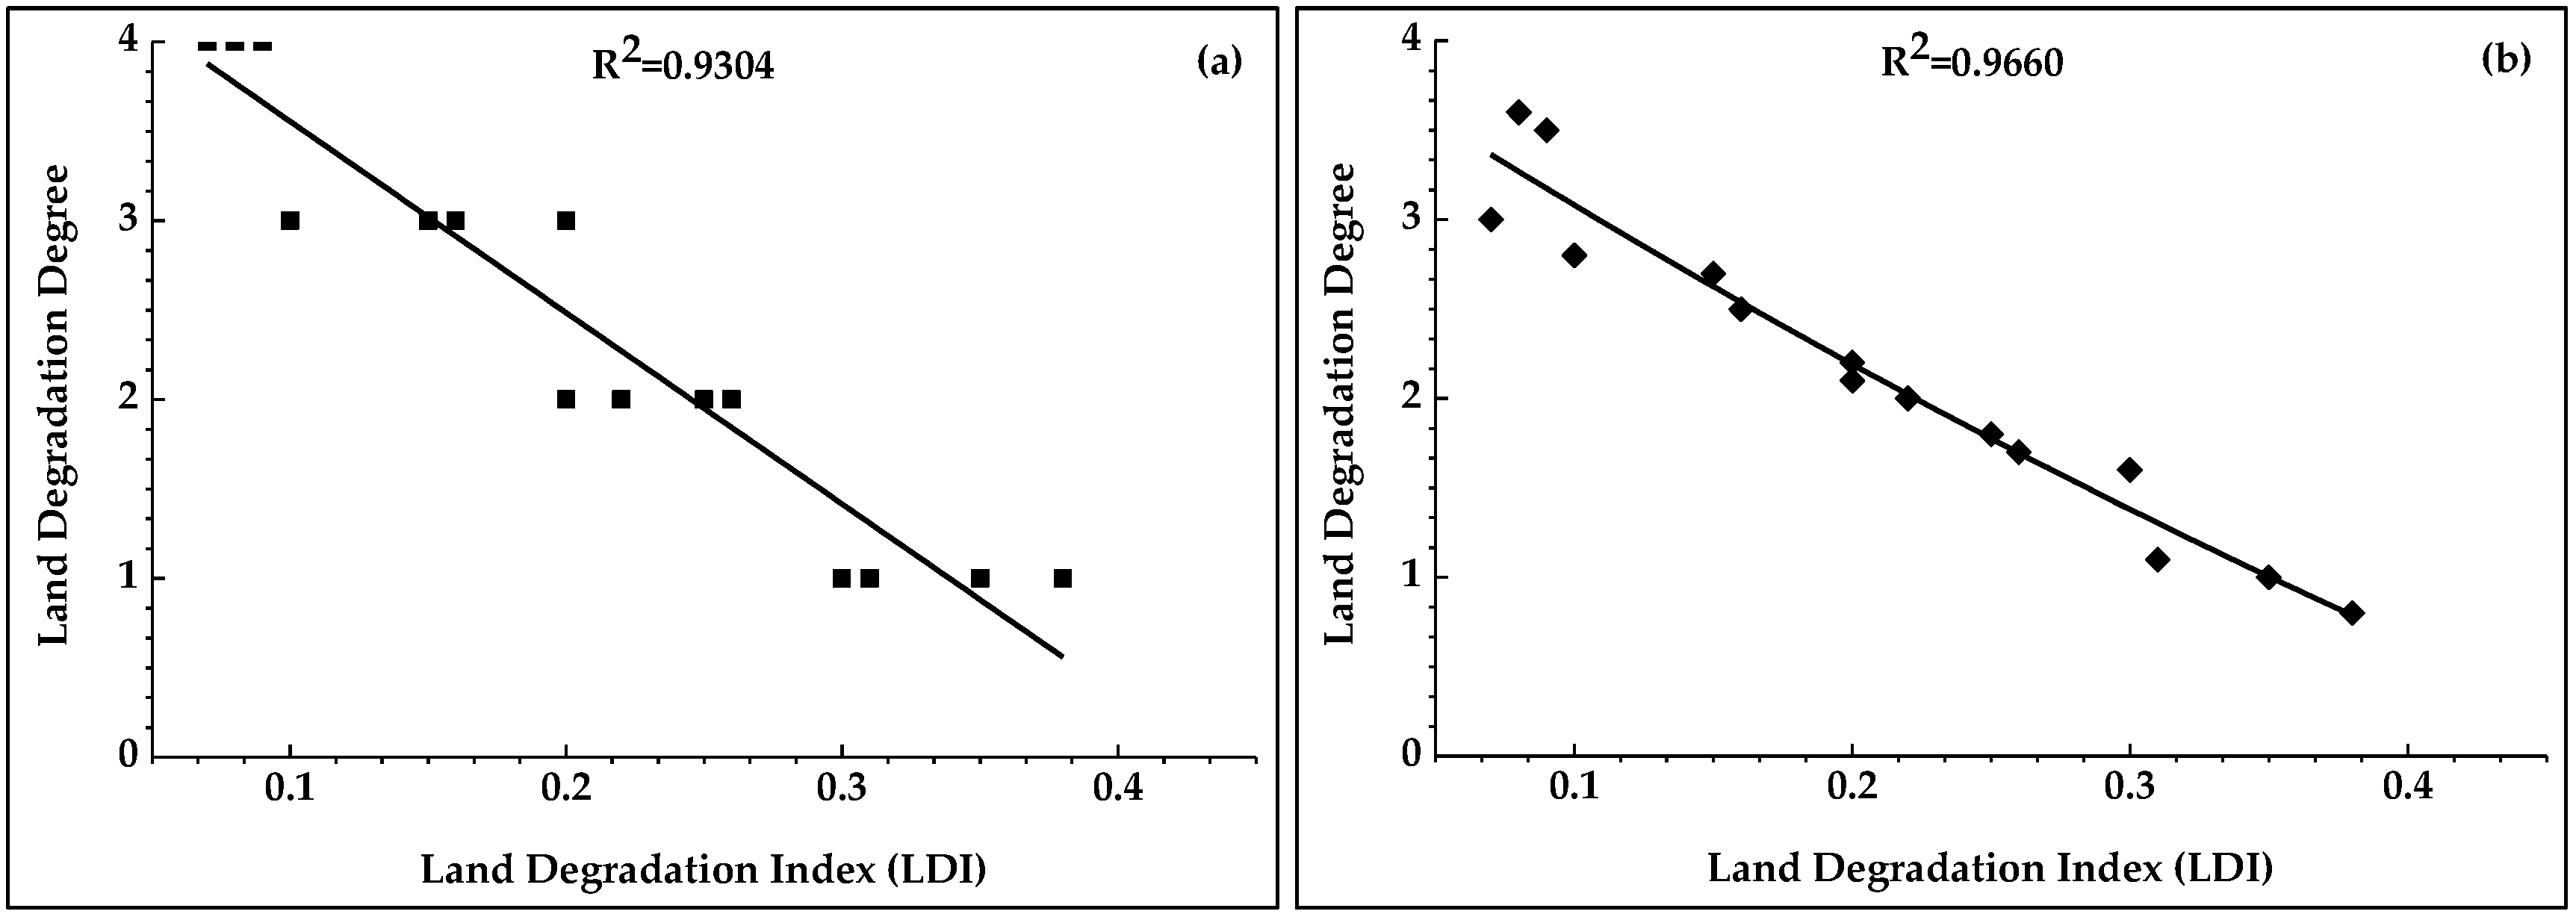
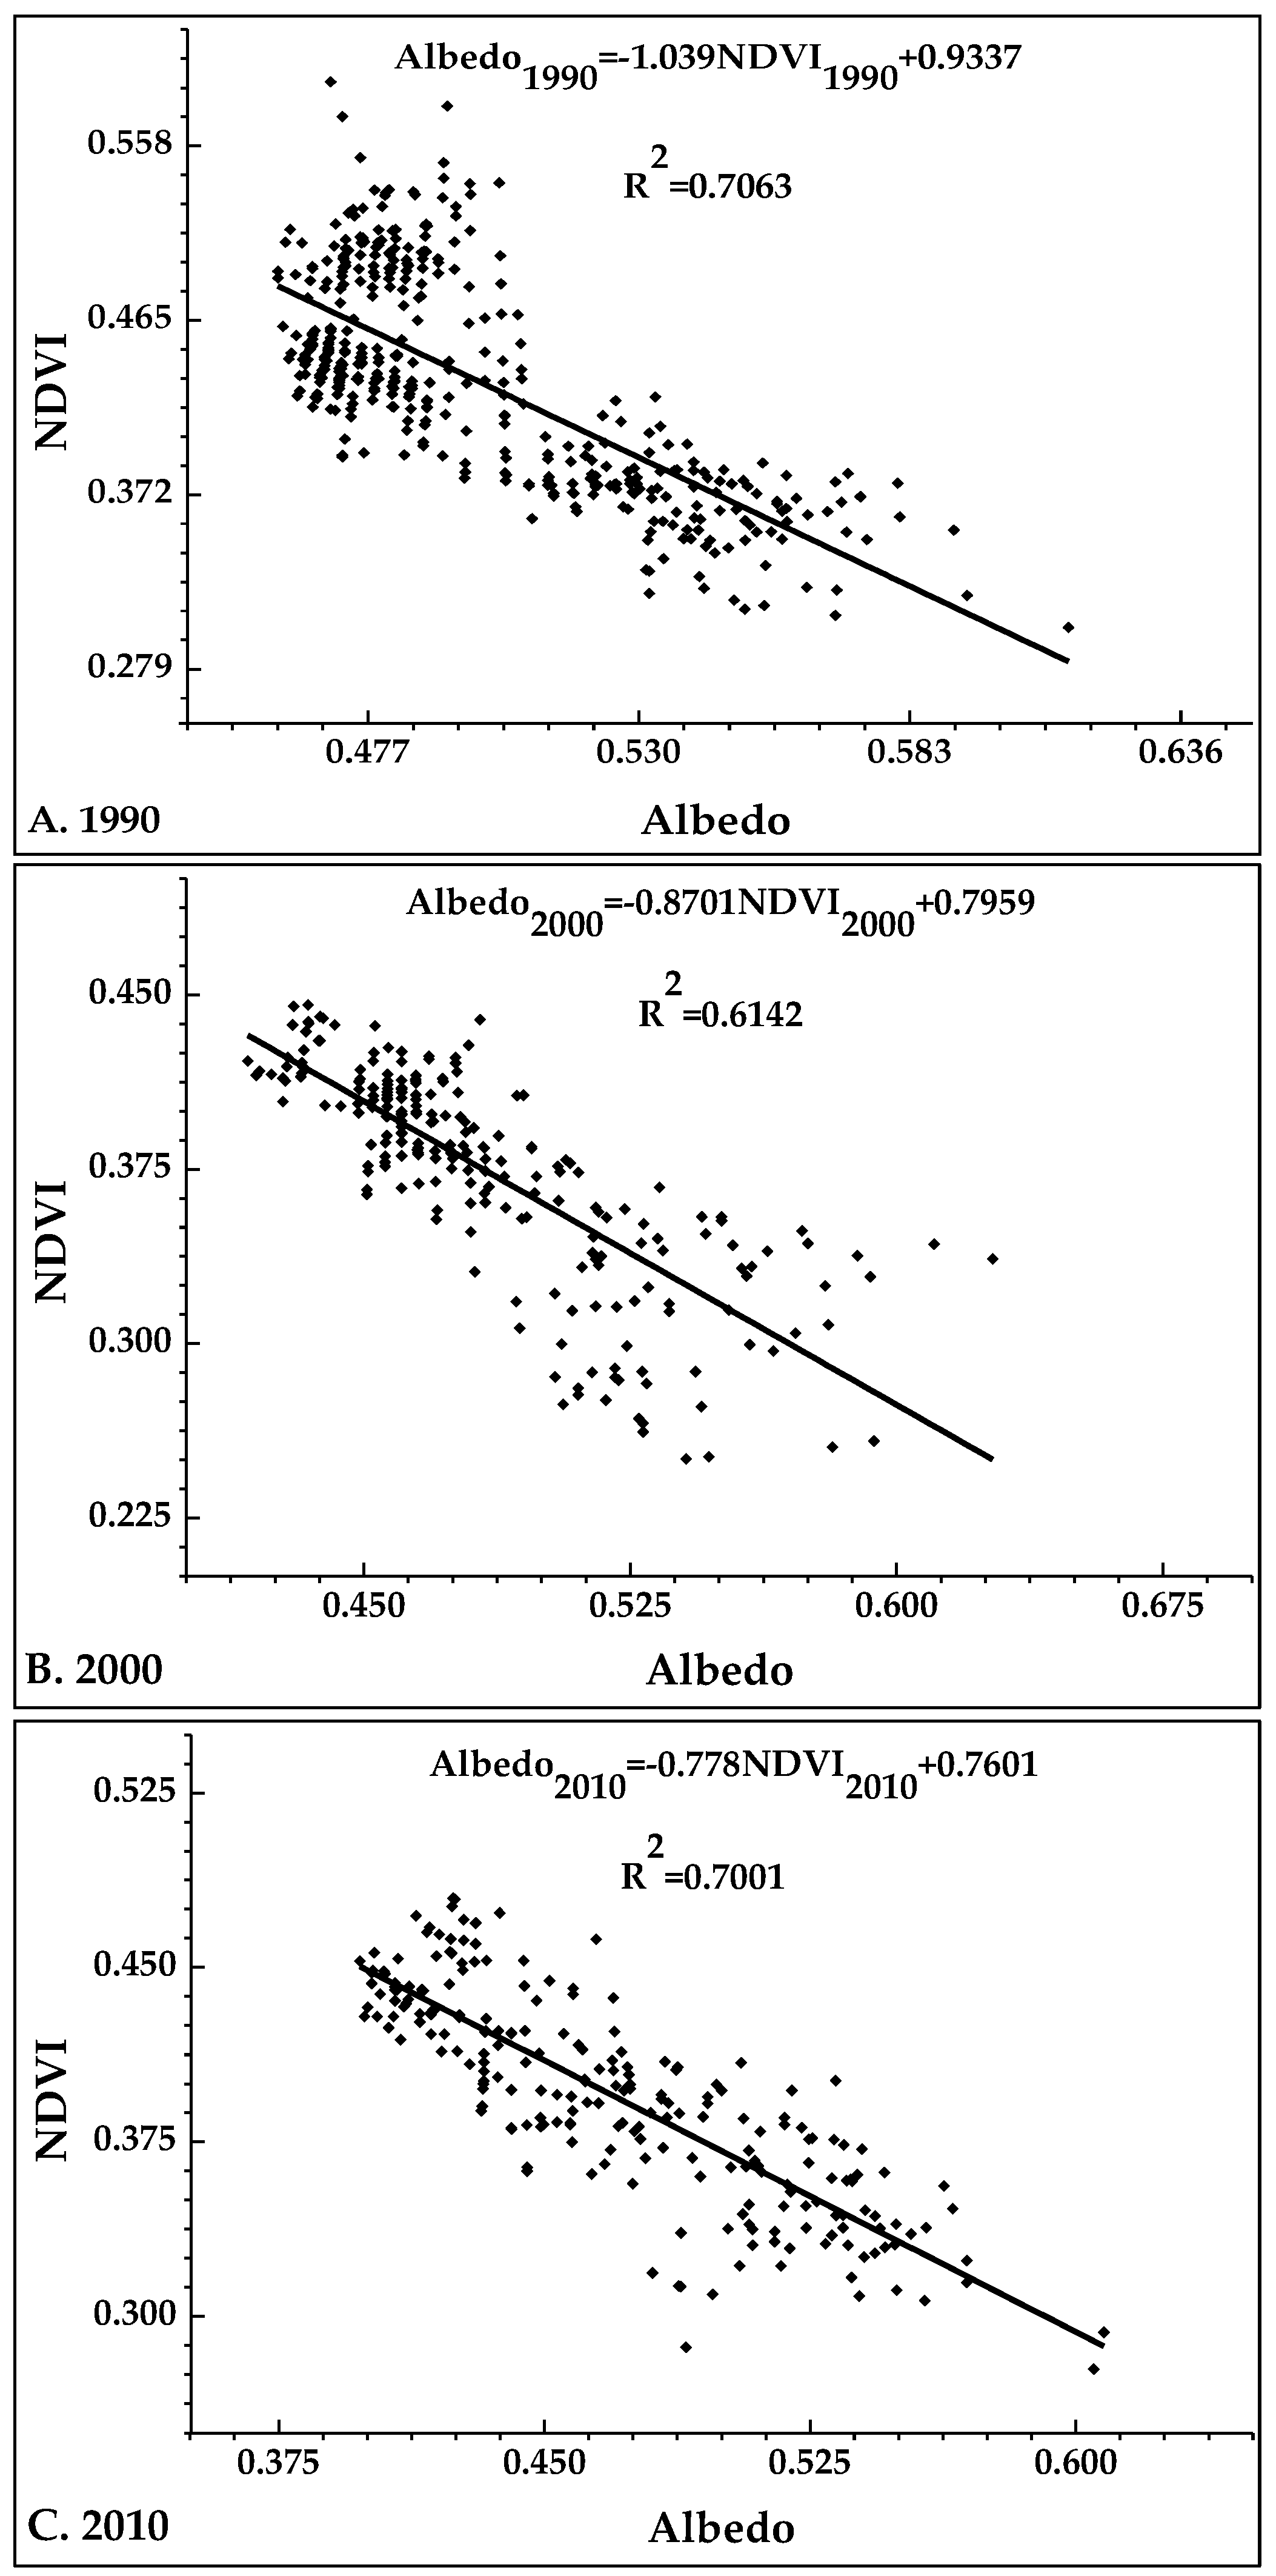
3.1. Modeling and Validation of Land Degradation Detection

Using TM images in the years of 1990, 2000 and 2010, visual interpretation was performed on each image with 500 sample pixels of various land degradation degrees and the NDVI and albedo extracted out correspondingly, so that a database for detecting land degradation was built. The linear relationship of NDVI and albedo of sample pixels was worked out (Figure 4). The equation of LDI was determined based on the relationship of NDVI and albedo (Equations (7)–(9)). The models for detecting land degradation (Equations (10)–(12)) were constructed, and their application results are shown in Figure 5.
D I 1990 = 0.9625 N D V I A l b e d o
D I 2000 = 1.1439 N D V I A l b e d o
D I 2010 = 1.2853 N D V I A l b e d o
Y 1990 = e 0.9625 N D V I A l b e d o
Y 2000 = e 1.1493 N D V I A l b e d o
Y 2010 = e 1.2953 N D V I A l b e d o
The land degradation degrees of 500 pixels total were determined, based on the NDVI threshold [18], vegetation coverage and land use/cover records by a field survey in 2011. These pixels are not the same as the sample pixels for constructing land degradation detection knowledge by experts. Most of the sample pixels, which are randomly selected without considering their accessibility, are far beyond the reach by car in the field. Since the field survey was conducted very close to the time of the TM image obtained in 2010, if the land degradation detection accuracy of 2010 is acceptable, then the reliability of the results and our proposed land degradation detection method will be approved. The error matrix and the accuracy of sample points are presented in Table 2.
Table 2 indicates that the probability of consistency between the land degradation degree of each sample and the corresponding predicted result is 91.2%. As observed from Table 2, the detection accuracy of high and severe land degradation sample points was much higher than low and no land degradation. This might be because the Ordos Plateau lies between a semi-arid and a semi-humid zone; the land capacity is much higher than the arid zone. Thus, many of the lands are cultivated and disturbed greatly because of a dense population [50,51,52,53], which may lead to some local non-degraded land being seriously destroyed in a very short term, where it is detected as lightly degraded land. On the other hand, some of the low degradation lands might have very high vegetation coverage, especially in summer when rainfall is rich, which makes it very difficult to distinguish them from none degraded lands. Therefore, these indicate that it might not be enough to use NDVI and albedo as indicators to detect land degradation. The other indicators, such as soil moisture and so on, should be taken into account.

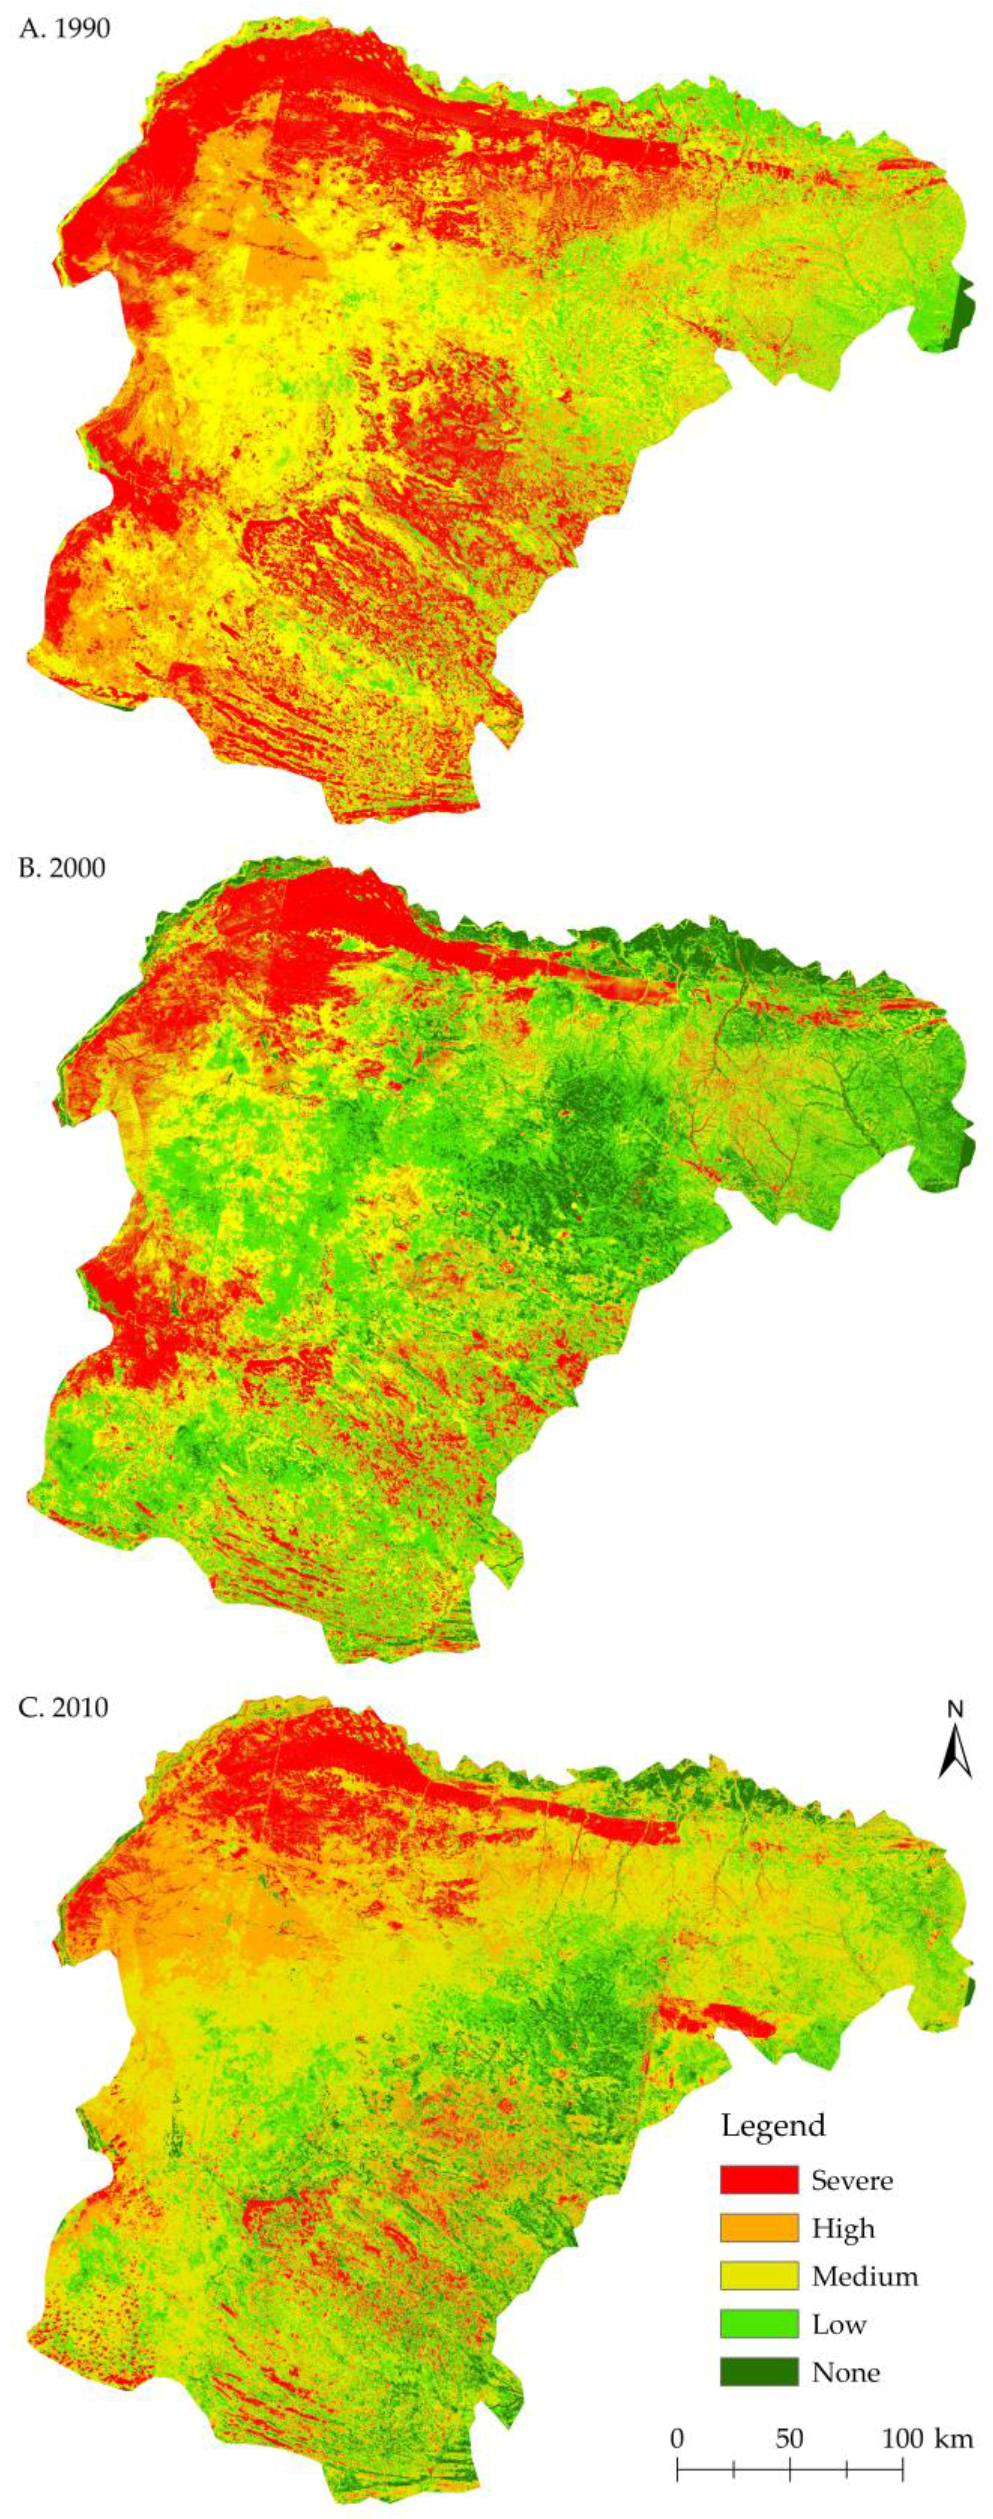
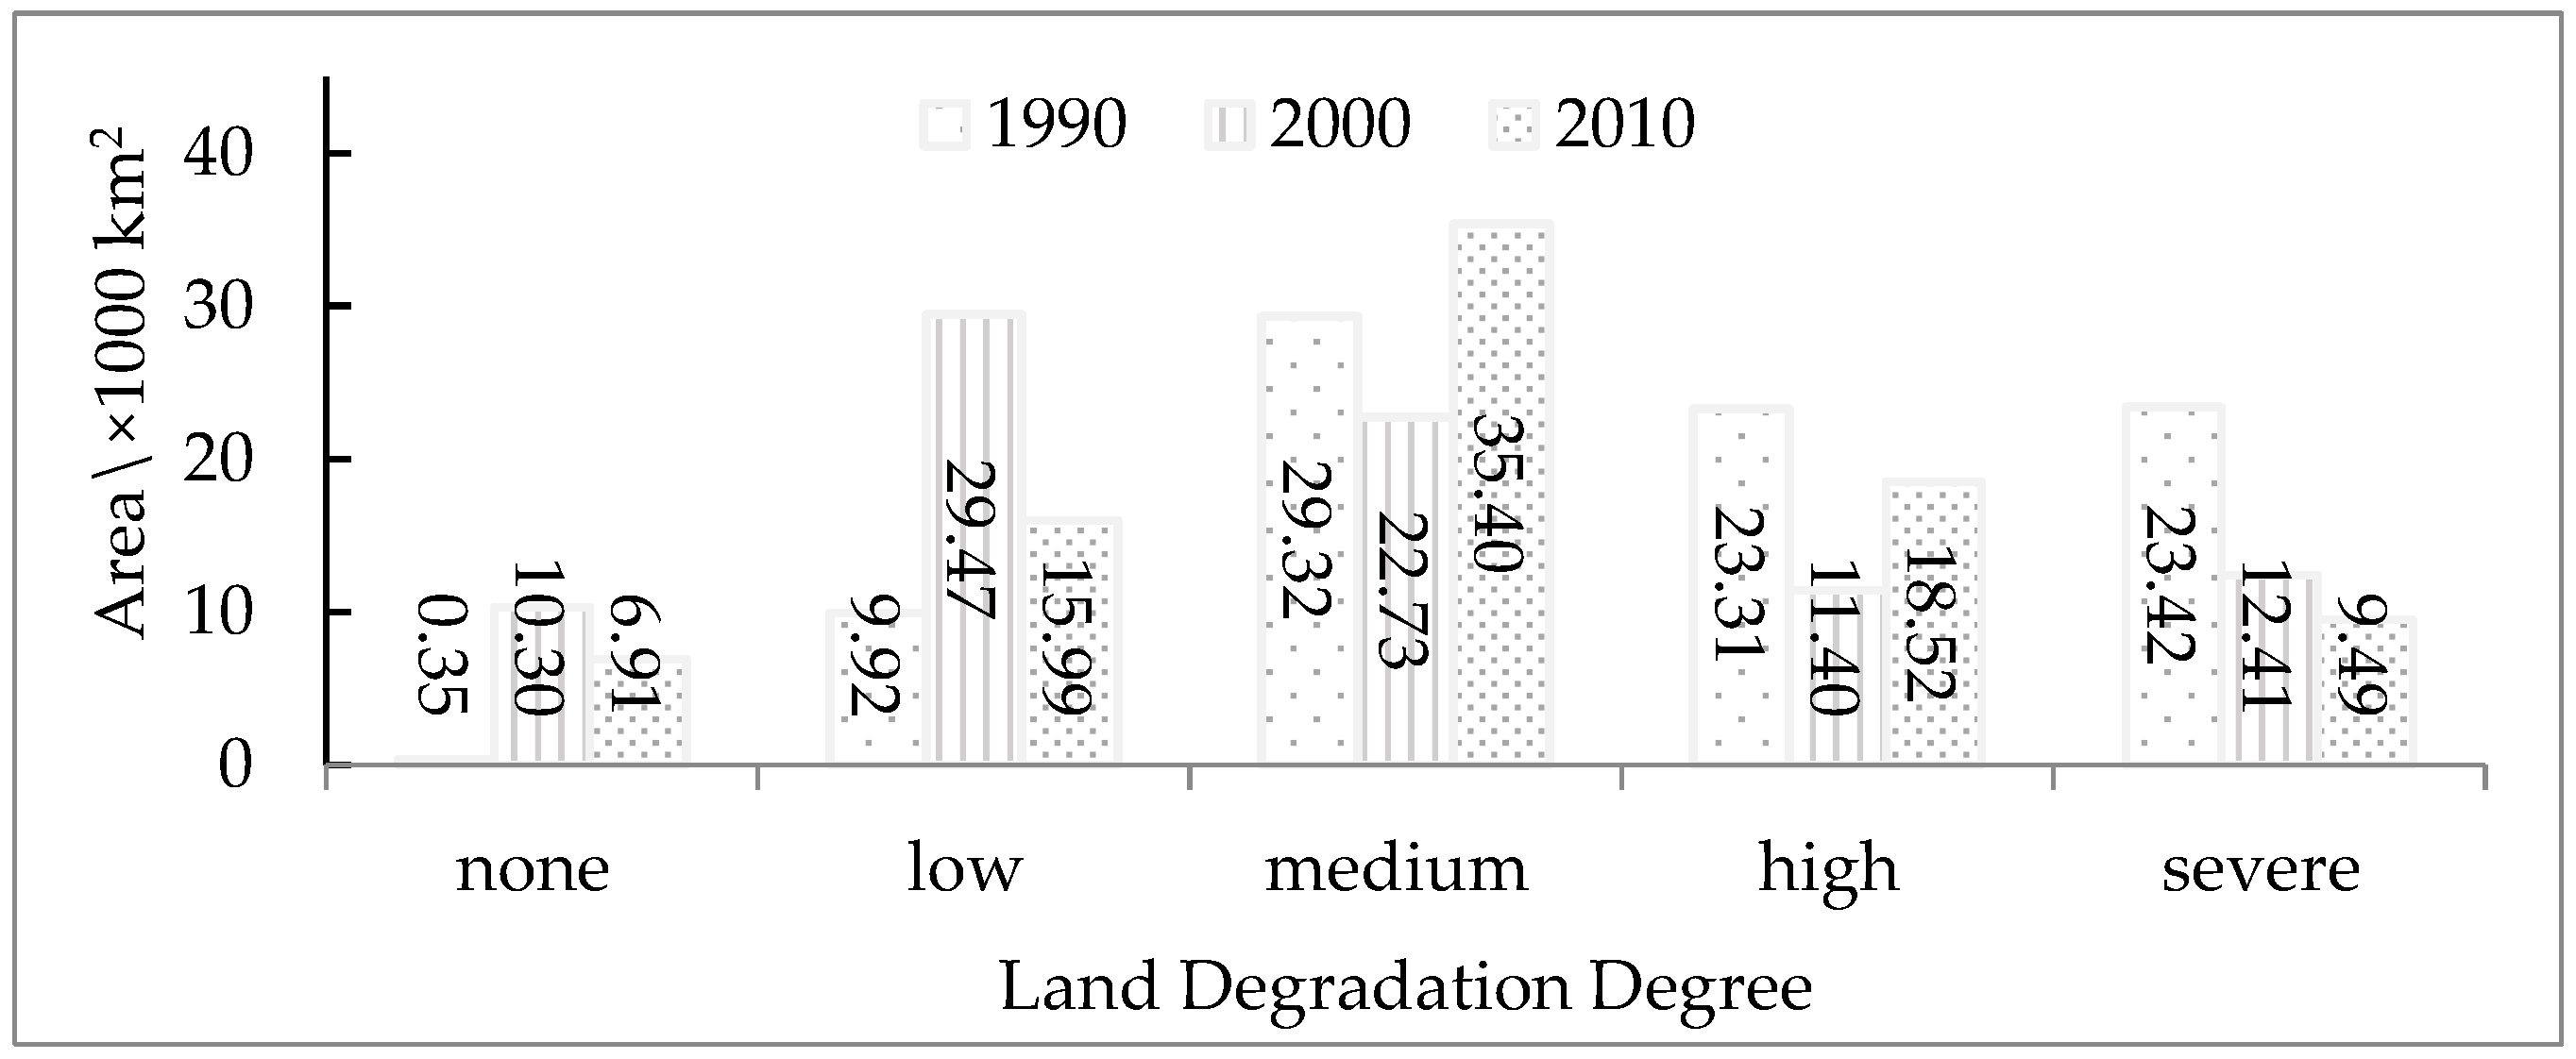
3.2. Temporal Variation of Land Degradation in the Ordos Plateau

Based on the results (Figure 5), the areas of different land degradation degrees in 1990, 2000 and 2010 are shown in Figure 6.
It shows that from 1990–2010, lands of high and severe land degradation degrees have reduced, while none, low and medium degrees have increased to some extent, which means the trend of degradation, is reversed in Ordos Plateau. During those twenty years, the area of sever land degradation was significantly and steadily reduced by 13,932.66 km2, with a decrease rate of 677 km2 annually. Additionally, the high land degradation areas also decreased 4791.04 km2. On the contrary, none and low degraded lands increased 6557.86 km2 and 6077.36 km2 by 2010, respectively. Therefore, the area ratios of land at various land degradation degrees have also changed greatly. In 1990, 2000 and 2010, the none, low, medium, high and severe degraded land account for 0.40%, 11.49%, 33.97%, 27.01%, 27.13%; 11.94%, 34.15%, 26.33%, 13.20%, 14.38% and 8.00%, 18.53%, 41.02%, 21.46%, 10.99%, respectively. Among different degrees, the medium land degradation almost always accounts for the largest proportion of the Ordos Plateau and increased by 7.05%.
The inter-annual change rate of various desertification degrees varies greatly between the periods of 1990–2000 and 2000–2010. Non-degraded land rapidly increased before 2000, but stabilized then, showing an inter-annual growth rate of 25.83% and 0.24%, in the two periods. The inter-annual growth rate of low degraded land was 12.19% from 1990–2000 and 9.51% from 2000–2010. The area of medium land degradation decreased from 1990 and 2000, with an inter-annual change rate of 1.75%, and then increased. The area of high degraded land had similar inter-annual rates of increase and decrease during 1990–2000 and 2000–2010 (approximately 4%). The area of severe degraded land decreased continuously, with inter-annual decrease rates of 4.25% and 4.17%, respectively. From 1990–2010, the inter-annual change rate of non-degraded land was highest, i.e., 13.37%. Low land degradation ranked second with a change rate of 6.67%. The area of medium, high and severe degraded lands decreased, with inter-annual change rates of 1.25%, 0.88% and 3.32%, respectively.
Further, areas vary greatly across different land degradation degrees in different banners from 1990–2010, as shown in Figure 7.
Non-degraded land area (Figure 7a) showed a steady growth trend in Otog Banner, Otog Front Banner, Jungar Banner, Ejin Horo Banner and Uxin Banner. While in Hanggin Banner, Dalad Banner and Dongsheng District, it showed the trend of firstly increasing and then decreasing, but a growth trend on the whole. Among them, Ejin Horo Banner, Otog Front Banner and Uxin Banner have the most rapid growth, respectively, increased by 34.4%, 34.04% and 18.62%. By 2010, banners that have relatively larger non-degraded land area are Ejin Horo Banner (46.66%), Uxin Banner (41.11%), Jungar Banner (28.17%) and District Dongsheng (22.12%). Although non-degraded land increased, the degraded lands are still the main landscape type in the Ordos Plateau.
The low land degradation area showed a stable growth trend in most banners, except Hanggin Banner and Ejin Horo Banner, which almost remained unchanged (Figure 7b). While, in Otog Banner, Otog Front Banner, Jungar Banner and Dongsheng District, it grew rapidly by 23.34%, 30.08%, 14.83% and 26.86%, respectively. By 2010, banners that have the largest low degraded land area are Dongsheng District (51.57%), Jungar Banner (44.75%), Otog Front Banner (40.56%) and Otog Banner (32.86%). These Banners are mainly distributed in the northeast and southwest of the Ordos Plateau.
Except Dalad Banner and Otog Banner, which increased by a small degree, the medium degraded land area has reduced in most banners (Figure 7c), and it was rapidly reduced in banners such as Ejin Horo Banner, Dongsheng District and Otog Front Banner by −31.76%, −21.46% and −17.18%, respectively. By 2010, Dalad Banner (32.82%), Otog Banner (30.14%), Hanggin Banner (26.13%) and Jungar Banner (23.06%) have relatively larger medium degraded land areas. The above banners are mainly distributed in the northern and western parts of the Ordos Plateau.
The high degraded land area showed a reduction trend except Hanggin Banner, which increased 10.08% (Figure 7d). Across banners, high degraded land in Otog Banner, Otog Front Banner and Dongsheng District reduced the most rapidly, respectively, reduced −24.62%, −13.95% and −11.91%. Banners that have a relatively larger high degraded land area are Hanggin Banner (35.15%), Otog Banner (17.93%), Uxin Banner (16.58%) and Dalad Banner (16.02%). In general, high degraded land is mainly distributed in the northern and the western parts of the Ordos Plateau.
The severe degraded land area showed a significant reduction trend, except Ejin Horo Banner, which increased 3.69% (Figure 7e). Among banners, severe degraded lands in Uxin Banner, Dalad Banner, Otog Front Banner and Hanggin Banner were most rapidly reduced, respectively, decreased by −27.43%, −20.06%, −17.37% and −15.13%. Banners that have relatively larger severe degraded land area are Hanggin Banner (21.16%), Ejin Horo Banner (7.01%) and Dalad Banner (6.39%). Generally, severe degraded land has greatly decreased and mainly is distributed in the northern and the western parts of the Ordos Plateau.
The above results indicate that land degradation in Ordos Plateau presented an overall reversal with a partial development trend in some parts. This might be related to a series of ongoing ecological restoration projects, which were established in 1990 and then on, including the “Three-north Shelterbelt Project”, “Natural Forest Resources Protection Project”, “Grain for Green Project” and “Sand Prevention Ecological Circle Project surrounding Beijing and Tianjin”. The effectiveness of such projects seems significant because the overall vegetation cover improved with returning farmland to forests and grasslands [67]. However, some areas are unsuitable for forests because of water shortage. As a result, high tree mortality and exacerbated ecological degradation occurred [68,69]. Yue et al. [62] pointed out that the long-term ecological effects of planting trees in arid and semi-arid areas need further observation. Further, most desert areas with vegetated dune systems in arid and semiarid northern China are used for farming or grazing [70]. Therefore, human activities could significantly affect the land cover and lead to the process of land degradation in the area [6,16,27,47,48,71,72,73].

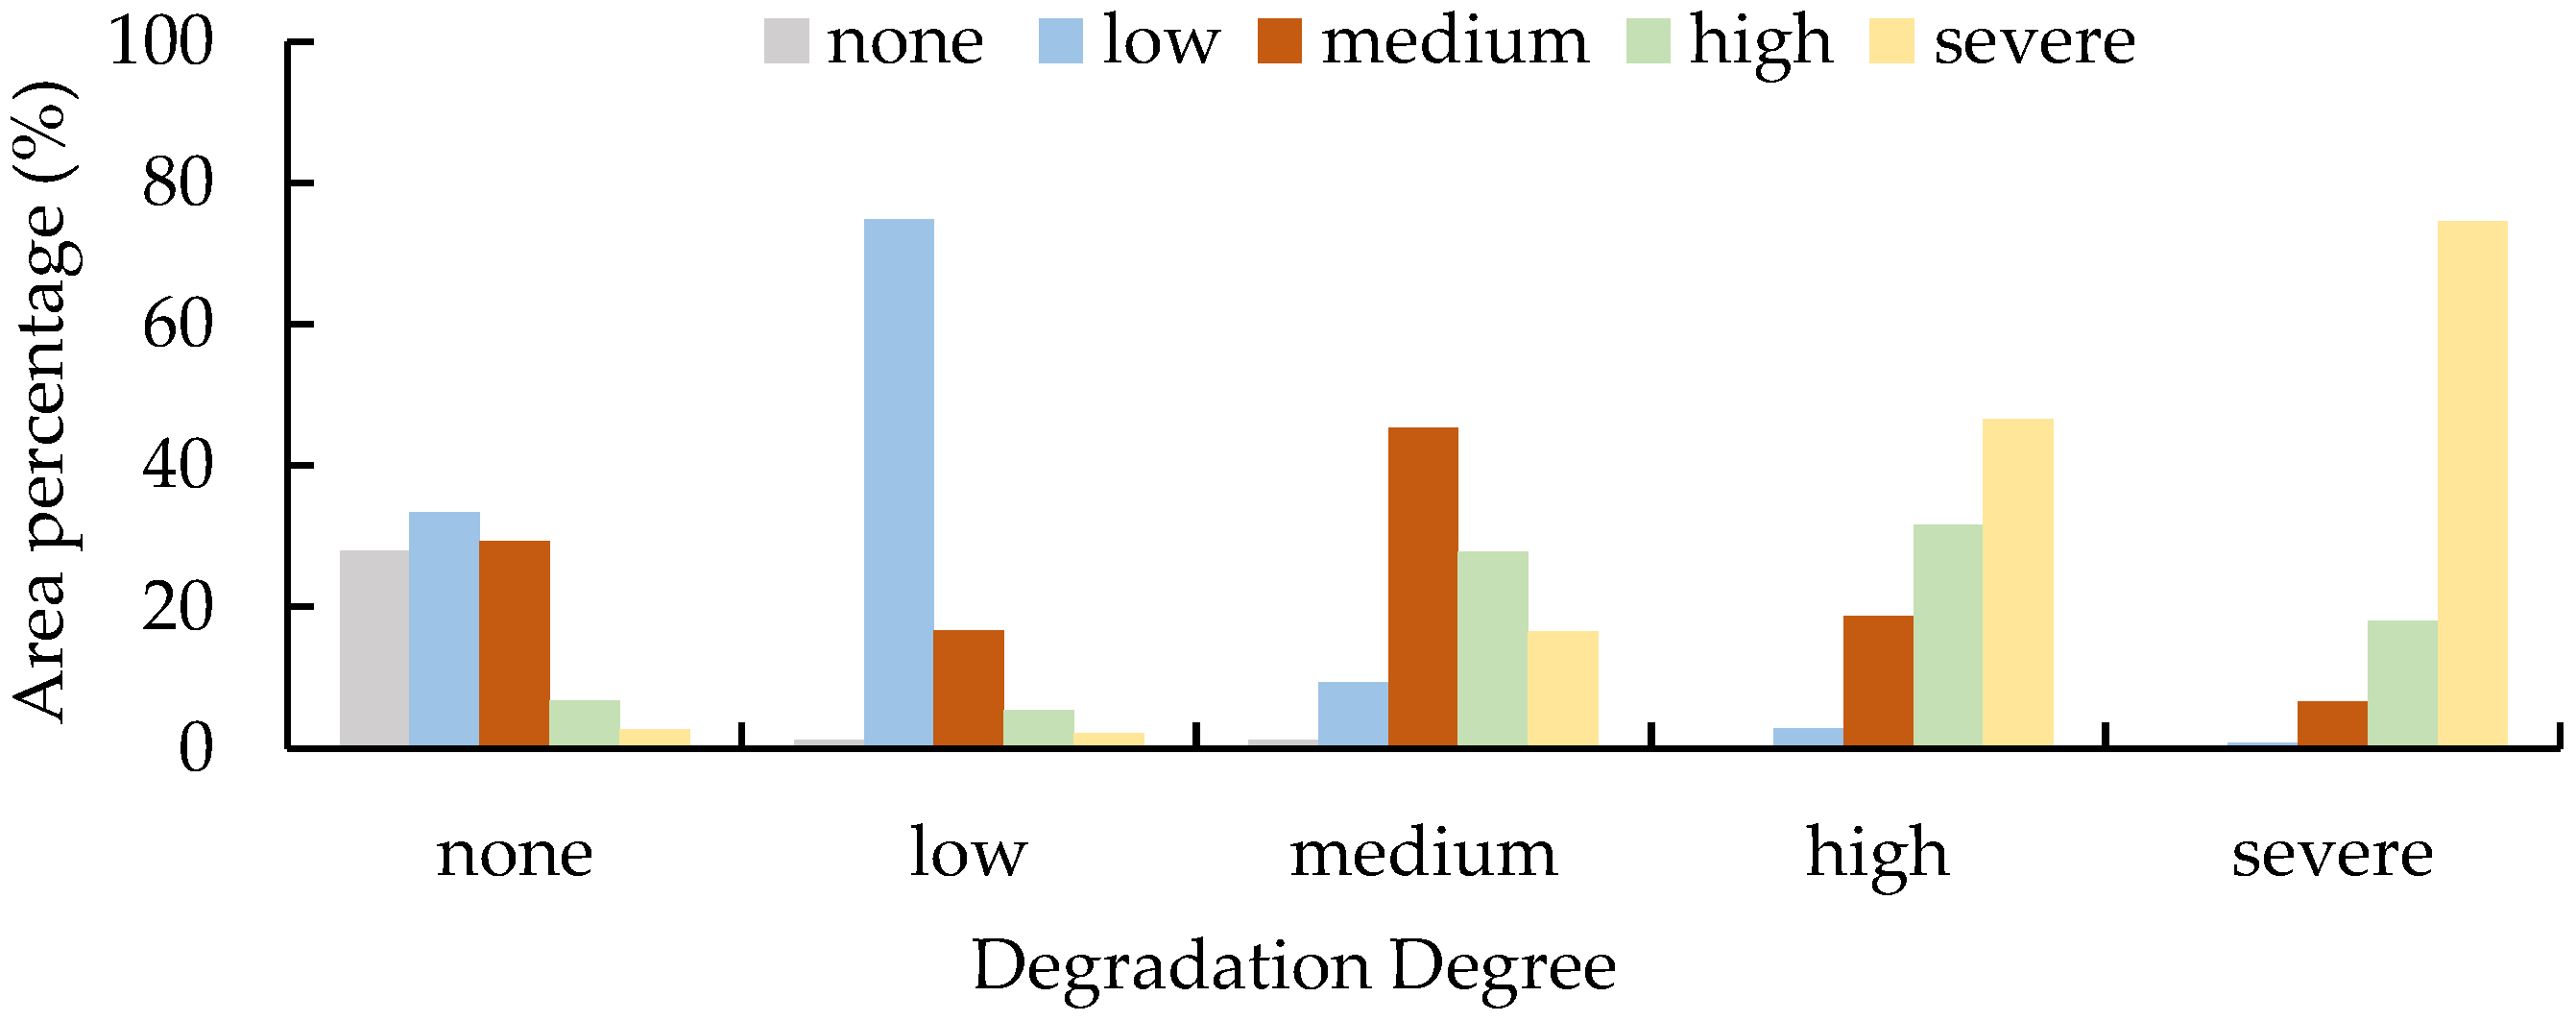
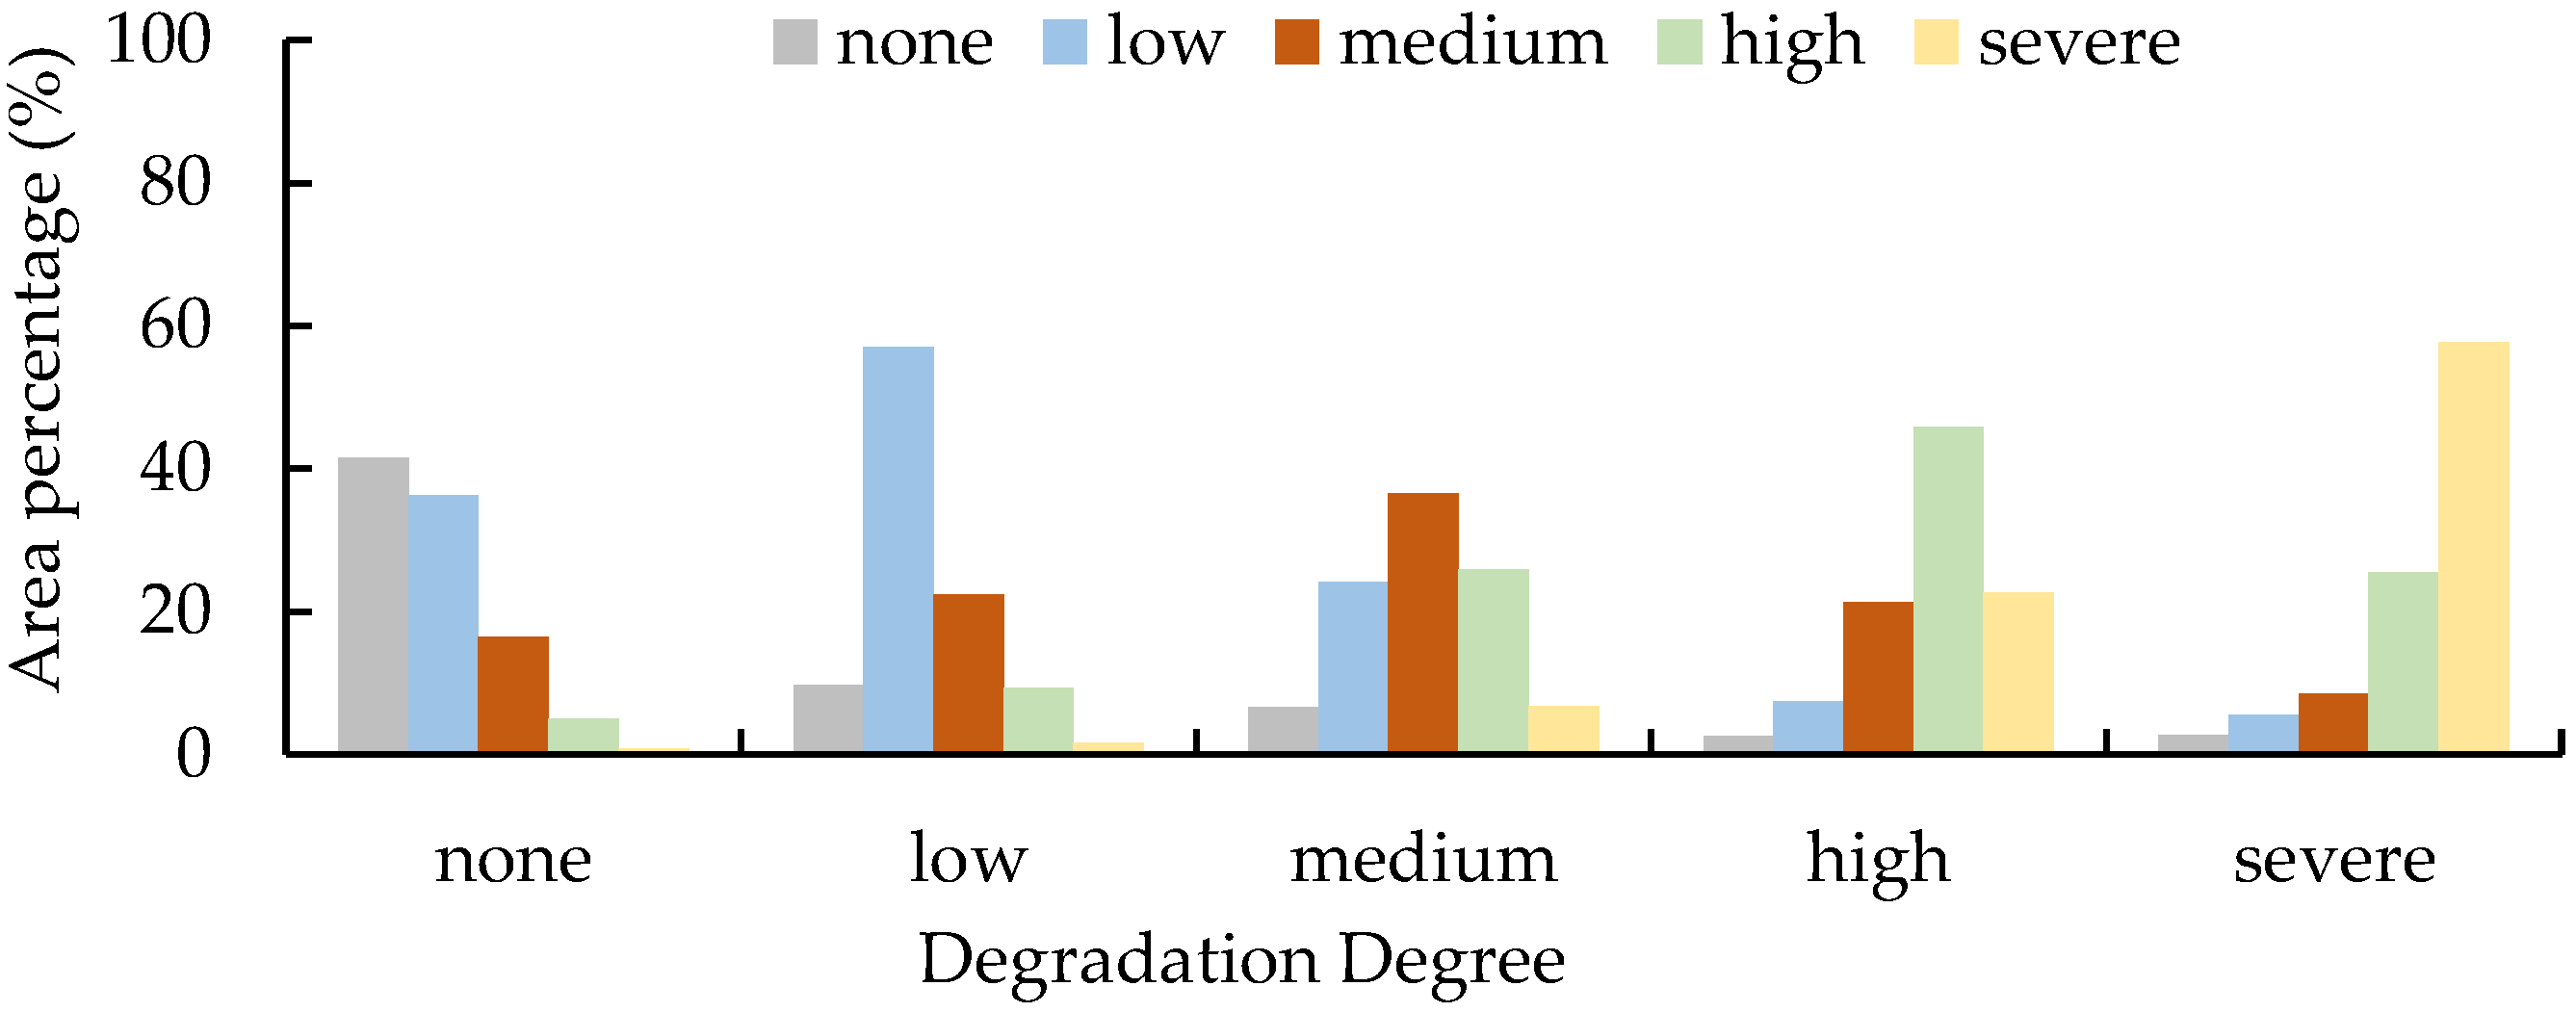
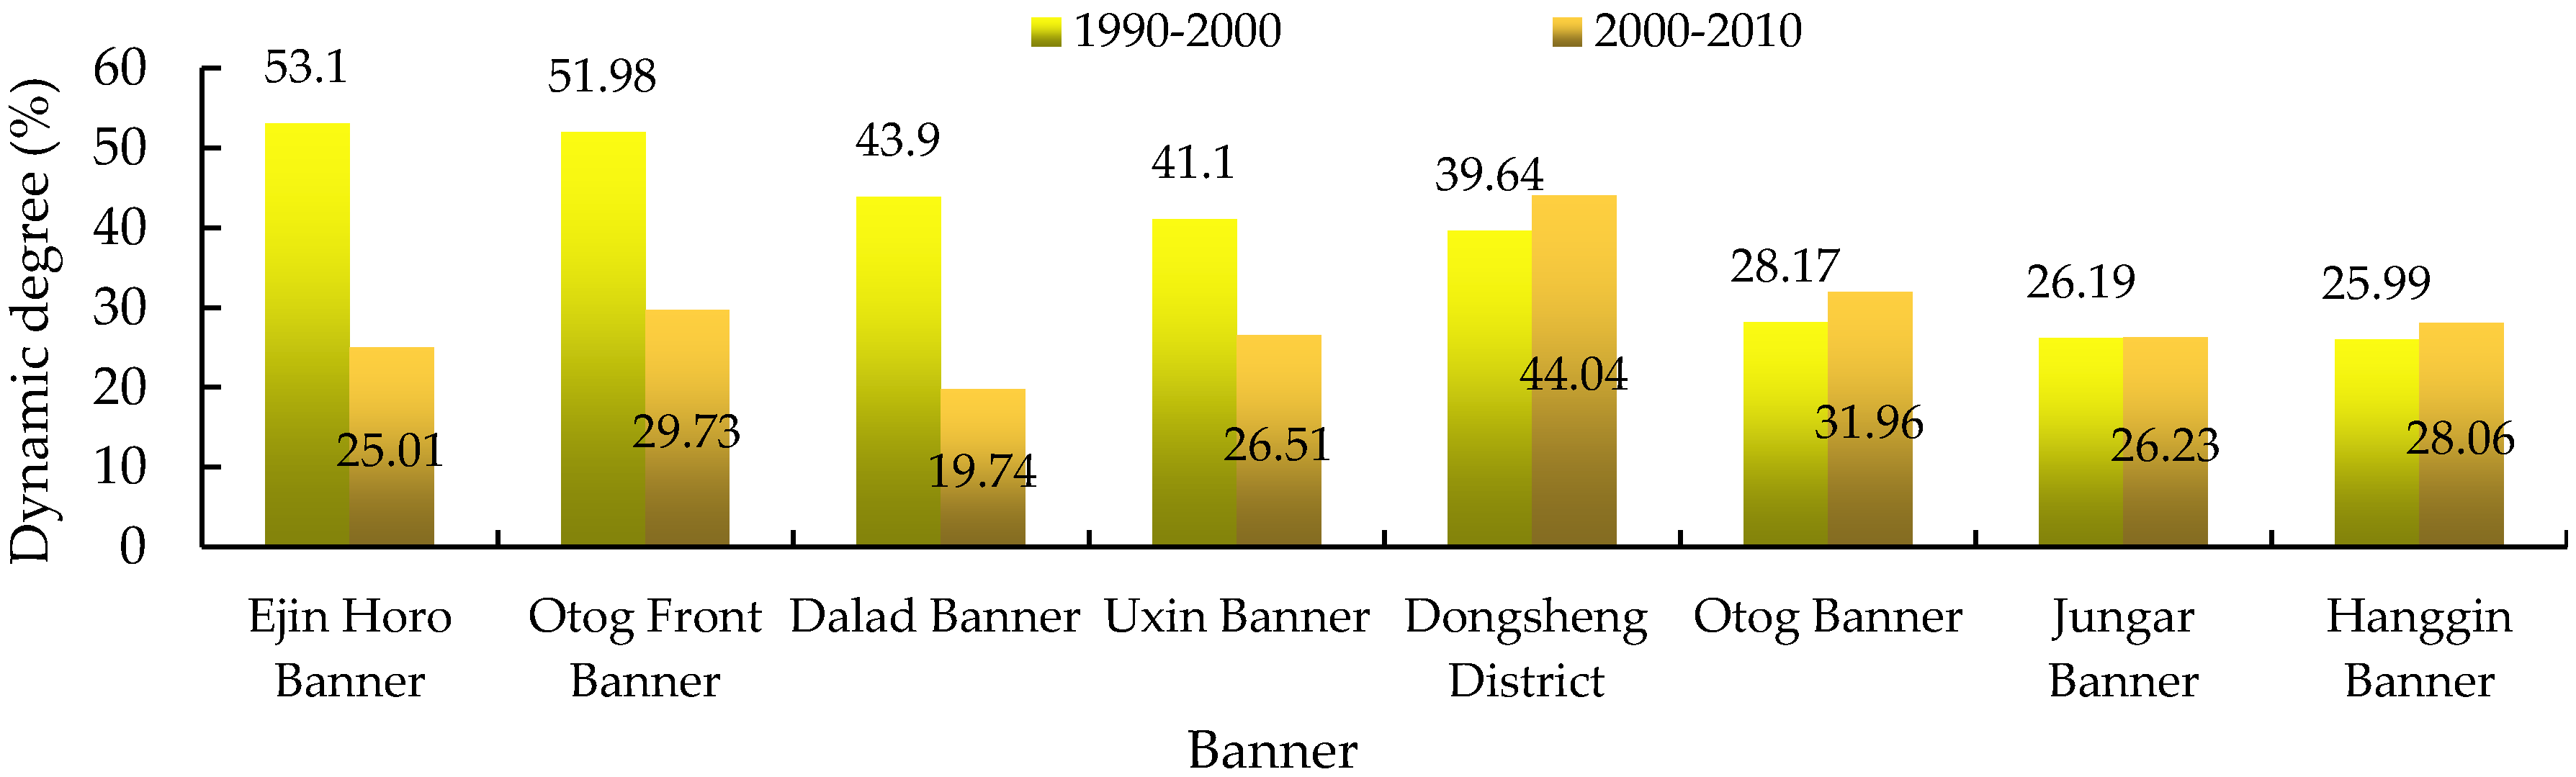
3.3. Inter-Annual Change of Land Degradation in the Ordos Plateau

From 1990–2000, inter-annual change directions of various land degradation degrees were figured out according to the area transfer matrix. It shows that low degraded land mainly converted to non-degraded land with a transfer-out rate of 6.73%; while medium degraded land mainly turned into none and low degraded lands, 11.84% and 39.22%, respectively. High degraded land mainly turned into low and medium degraded lands with transfer-out rates of 16.23% and 27.39%, respectively. Severe degraded land mostly turned into high and medium degraded lands with transfer-out rates of 40.33% and 17.63%. However, 17.70% of non-degraded area converted into low degraded land; 5.47% converted into medium degradation; 11.49% of medium degraded land converted into high degradation; and 9.67% of high degraded land transferred to severe degradation.
By 2000 (Figure 8), the transfer-in areas of non-degradation mainly involved low and medium degraded lands, 33.42% and 29.30%, respectively. The 16.67% of the low degraded area was primarily transferred from medium degradation. The transfer-in areas of medium degradation primarily came from high and partially from severe degraded lands (44.33% in total). High degraded land was mainly converted from severe degradation, which contributed 46.51%. There was 18.03% severe degraded land transferred from high degradation. The above results indicate the reverse trend of land degradation in the Ordos Plateau from 1990–2000. However, land degradation is still developing in some areas.
The transfer matrix of land degradation shows that, from 2000–2010, low degraded land mainly converted into none and medium degraded lands, 27.93% and 25.05%, respectively. While, medium degraded land mainly converted into low degradation, high degraded land mainly converted into medium and low land degradation. Severe land degradation mainly converted into high degraded land. Generally, high-grade degraded lands still mainly converted into low-grade ones.
By 2010 (Figure 9), non-degraded land was transferred mainly from low and medium degraded lands, 36.24% and 16.44%, respectively. Low degraded land was mainly transferred from medium and high degraded lands, 22.40% and 9.26%, respectively. Medium degraded land was converted mainly from high degraded land and partially from low degraded land. High degraded land was mainly attributed to the reversal of severe degraded land and aggravation of medium land degradation (22.73% and 21.34%, respectively). The transfer-in area of severe degraded land was small and was mainly contributed by the aggravation of high degraded land, showing that land degradation reversal and aggravation coexisted on the Ordos Plateau from 2000 and 2010, and the aggravation was higher than that of 1990–2000.

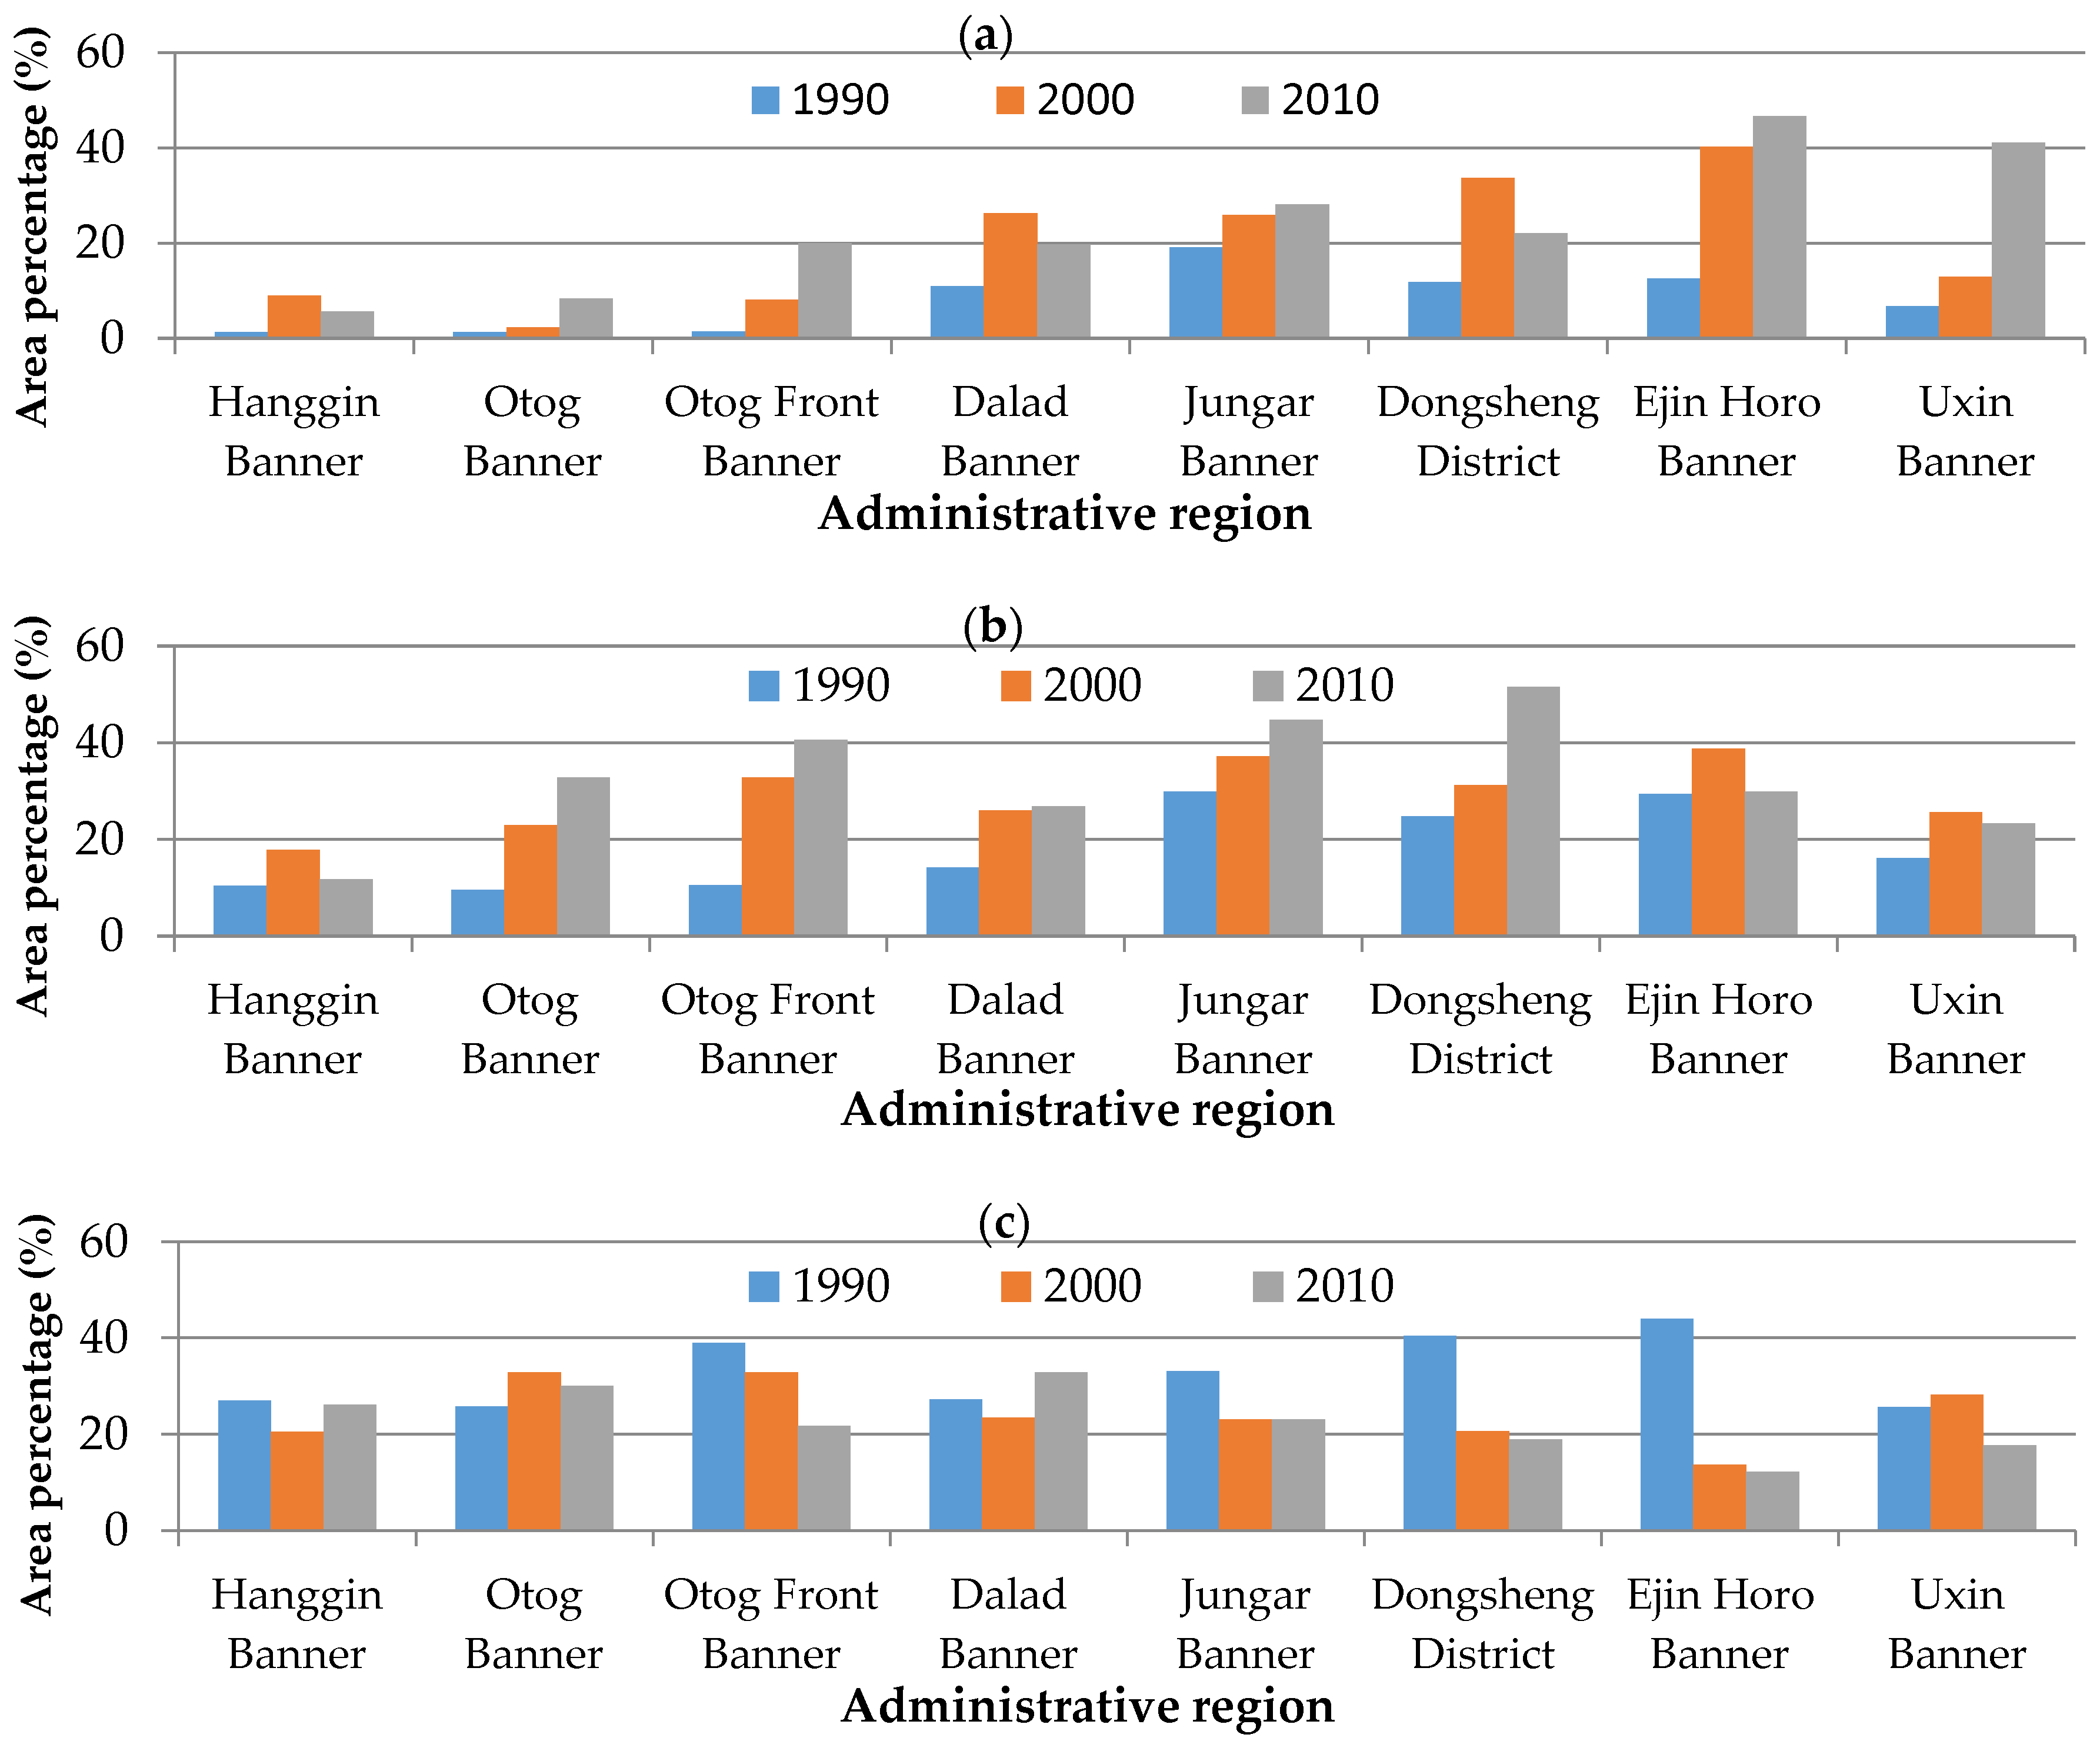
3.4. Spatial Change of Land Degradation in the Ordos Plateau

Land degradation changed dramatically and showed significant regional differences in the Ordos Plateau (Figure 10). From 1990–2000, banners with relatively high dynamic degree were mostly located in northeast regions of the Ordos Plateau, where there are dense populations and developed economies, and witnessed fast land degradation reversion. Among them, Ejin Horo Banner and Otog Front Banner ranked highest, over 50.00%. Dalad Banner, Uxin Banner and Dongsheng District ranked third, fourth and fifth and had a relatively high dynamic degree, about 40.00%. Otog Banner, Jungar Banner and Hanggin Banner had the lowest degrees, less than 30.00%.
The overall dynamic degree of land degradation in all banners of the Ordos Plateau declined from 2000–2010, compared to that of from 1990–2000. Especially Ejin Horo Banner, Otog Front Banner, Dalad Banner and Uxin Banner showed significant declining trends compared with those of 1990–2000. While the dynamic degree of land degradation in Jungar Banner and Hanggin Banner kept almost unchanged, Dongsheng District and Otog Banner slightly increased. Among banners, Dongsheng District and Otog Banner had a relatively high dynamic degree, but the highest less than that of 1990–2000. These results indicate that most of the banners have transferred from hot spots of land degradation to less changed regions.

4. Discussion

4.1. Indicators, Expert Knowledge and BP-ANN Algorithm for Monitoring Land Degradation

Besides NDVI, the other commonly-used vegetation indexes include soil adjusted vegetation index (SAVI) and ratio vegetation index (RVI). Although SAVI has the advantage of reducing the influence of soil on vegetation detection, its parameter setting is usually hard to satisfy in application [74]. RVI is very sensitive to vegetation cover when it is relatively high. However, its sensitivity decreases obviously when vegetation cover is less than 50.00%, thus inapplicable to detect land degradation with rare surface vegetation [75]. Compared to SAVI and RVI, NDVI has been proven to be reliable to detect the land degradation of arid and semiarid areas [26,28]. However, it cannot be ignored that the reduction of NDVI may not be caused by land degradation. Therefore it is very necessary to combine NDVI with other indices in land degradation monitoring [29]. Our results proved that NDVI and albedo are closely related to land degradation degrees. We therefore argue that NDVI and albedo are feasible indicators to detect land degradation. However, over-dependence on the spectral characteristic of remote sensing images, ignoring the recognition of expert knowledge in image interpretation and the lack of connection with land degradation features may easily lead to great error. This calls for an urgent need of combining expert knowledge and remote sensing indices together in land degradation detection.
Expert knowledge and the BP-ANN algorithm were therefore adopted in land degradation detection. By visually interpreting limited numbers of sampled pixels, expert knowledge was introduced to land degradation detection. The application of expert knowledge ensures not only the accuracy of the land degradation identification, but also avoids the big workload of field trips done by non-professional staff for obtaining land degradation information. Based on information provided by the expert, the relationship between land degradation indicators and land degradation degrees was then further explored by using the BP-ANN algorithm, which was applied to establish a fast and effective land degradation detection model. Since the BP-ANN algorithm has the advantages of self-learning, self-organization and self-adaption and has the ability to simulate the thinking process of the expert in land degradation identification, thus the accuracy and rationality of the relationship between the land degradation index and the land degradation degree can be greatly improved, even using very limited input information (Figure 11).
It shows that the original sample data failed to express the relationship between the LDI value and land degradation degree due to its dispersed distribution and contradictions (Figure 11a); while the BP-ANN algorithm greatly diffused the original samples by simulating the logic and process of expert thinking. Thus, it successfully filled the lost information of experts in identifying the degree of degraded land (Figure 11b). Therefore, a more precise land degradation detection model can be figured out ultimately.
However, just as we mentioned in Section 2.3.1, the expert knowledge approach has disadvantages of subjectivity and regional dependency. Although we applied the repeated experiments and double blind test to avoid the subjectivity, such a disadvantage cannot be completely eliminated. Additionally, there is no uniform standard for evaluating the land degradation intensity. Because land degradation is a gradual process of losing productivity, it is very hard to set a baseline to determine the intensity of degradation. Therefore, most indicators and their criteria used in previous studies are such diagnostic indices as NDVI and albedo under the recent situation, rather than based on the land degradation process. Therefore, our proposed approach and the criteria, as those of most previous studies, have a certain extent of limitation. However, this approach still has the potential to be applied to other regions by other experts. Further, the proposed method can be improved by introducing new indicators, such as human appropriation of the net primary productivity (HANPP) [42], which has the ability to reflect the change of ecosystem productivity caused by land degradation.

4.2. Land Degradation and Its Control in the Ordos Plateau

Land degradation in and around the Ordos Plateau heavily influences the severity and frequency of sand-dust storms [46], so its dynamics has long been studied, but there have been no consistent findings, e.g., Cui and Li [20] found that the total degraded areas of the Kubuqi Desert, a part of the Ordos Plateau, decreased by 13.29% from 1989–2002; and the forested area of the whole Ordos Plateau increased since 2000, with a reversal of land desertification [44], while Liu et al. [21] noted that the degraded area in the west of the Ordos Plateau showed an average annual growth rate of 0.35% from 1989–2005, with severe and deteriorating trends. These inconsistent results further illustrate the urgent need of enhancing the study on land degradation identification and monitoring in the Ordos Plateau.
Our results show that from 1990–2010, lands of high and severe degradation degrees have reduced, while none, low and medium degrees have increased to some extent, which means the trend of land degradation is reversed in the Ordos Plateau. According to meteorological records of the Ordos Plateau, the annual precipitation has been reduced by 100 mm in 10 years, and the annual average temperature tends to rise during 1990–2010. At the same time, the inter-annual climate fluctuations are not significant, so the effect on land degradation dynamics is very weak in such a short time period. However, a reverse trend observed though the climate trend in the Ordos Plateau is very conducive to the development of land degradation. This indicates that such human activities as “grain to green” and ecological construction might have strong effects on the development or reversal of land degradation.
Similar trends are also found in the Mu Us sand land [16] and the whole of northern China [22]. In the past decades, there has been little evidence for a significant shift in the seasonal distribution of precipitation in semi-arid northern China [16,22,70]. The mean annual precipitation fluctuated slowly, but without a significant decreasing or increasing tendency throughout the study period [16,22,23]. However, in contrast to annual precipitation, annual average temperature increased significantly [16,22,70]. Therefore, there is a significant warming and drying climate fluctuation, which favors land degradation development [16,22]. However, land degradation decreased, and this is widely regarded as the preliminary results of a series of undergoing national ecological restoration projects since the 1990s [19,22].
There are debates on the causes and driving forces of land degradation in the region [49,50,76]. For example, it was indicated that the land degradation expansion was dominated by human activities [23,40], whereas its reversion was dominated by climate change [40]. Although it is universally held that apart from such natural factors as climate change, human elements, like deforestation, irrational cultivation and overgrazing, are the chief culprits [16,49,50,71,77,78,79]. However, at different spatial and temporal scales, the relative role of climate factors and human activities on land degradation is very complicated; this requires a specific analysis of specific areas. However, it is evident that either in the development or reverse of land degradation, human activities’ role is always significant [79].
A feasible strategy for land degradation prevention and control is to implement environmentally-friendly land use optimization. To this end, some exploratory research has been proposed [49,50,56,57,58,59,60]. However, it should be highlighted that the goals of environmentally-friendly land use optimization should aim at the main negative factors affecting the land system, and the land use type and its quantity must meet the demand of population and be reconciled with natural conditions [50]. In particular, the land use pattern, which does not conform to the natural carrying capacity, may lead to the deterioration of land degradation. For example, since 2000, a recovery trend of the land degradation occurred mainly in the agro-pasture ecotone of northern China, benefitting from a series of ongoing ecological restoration projects, including the Three-North Forest Shelter Belt Project, Natural Forest Resources Protection Project, Grain for Green Project, Sand Prevention Ecological Circle Project surrounding Beijing and Tianjin [50,79]. However, high tree mortality and exacerbated ecological degradation are occurring in some areas, because there is insufficient precipitation to sustain trees in the long term [68,69]. Therefore, Yue et al. [62] argued that long-term ecological effects of planting trees in arid and semi-arid areas need further observation. It is suggested that this region should increase the shrub land and grassland instead of trees [60]. Therefore, we argue that special attention should be paid to these factors in the development of land use optimization strategies for land degradation prevention and control in the Ordos Plateau.

5. Conclusions

Land degradation detection and monitoring are of vital importance to provide scientific information for sustainable land utilization at local, regional and global scales. In this research, remote sensing indices, i.e., NDVI and albedo, expert knowledge and the BP-ANN algorithm were integrated to establish a land degradation monitoring approach. By applying this approach, a relatively high accuracy, 91.2%, of land degradation detection is achieved based on limited sample pixels, with greatly reduced workload. Such results demonstrate the reliability of valuable expert knowledge and the BP-ANN algorithm in land degradation detection. The proposed approach can potentially be applied to the other degraded areas.
The temporal-spatial evolution of land degradation in the Ordos Plateau from 1990–2010 was analyzed, and a reversal trend is observed. The inter-annual change direction and rate of various land degradation degrees varies greatly between the periods of 1990–2000 and 2000–2010. Land degradation reversal and aggravation coexisted on the Ordos Plateau during 1990–2000. Banners with relatively high land degradation dynamics were mostly located in the northeast regions of the Ordos Plateau. The overall dynamic degree of land degradation in all banners of the Ordos Plateau declined from 2000–2010, compared to that of from 1990–2000. This indicates that most of the banners have transferred from the hot spot of land degradation to less changed regions.
We suggest that land utilization optimization plays a key role in effective land degradation control. A feasible strategy for land degradation prevention and control is to implement environmentally-friendly land use optimization. At the same time, it should be highlighted that the goals of such strategies should aim at the main negative factors causing land degradation, and the land use type and its quantity must meet the demand of population and be reconciled with natural conditions.

Acknowledgments

This research is financially supported by the National Natural Science Foundation of China (No. 41271286), the National Key Research and Development Program of China (2016YFA0602402), the Natural Science Research Program of Jiangsu (No. 14KJA170001) and the Program of International S&T Cooperation, Ministry of Science and Technology of China (No. 2010DFB24140). The support received by A-xing Zhu through the Vilas Associate Award, the Hammel Faculty Fellow and the Manasse Chair Professorship from the University of Wisconsin-Madison and through the “One-Thousand Talents” Program of China is also greatly appreciated. Sincere thanks should also be given to the editor and two anonymous reviewers for their constructive comments and suggestions that greatly helped to improve the quality of this article.

Author Contributions

Yaojie Yue conceived of and designed the research. Min Li performed the data processes. Yaojie Yue wrote the paper. A-xing Zhu and Xinyue Ye revised the research design and extensively updated the paper. Rui Mao and Jinhong Wan edited the paper. Jin Dong gave excellent suggestions for improving the research. All authors read and approved the final manuscript.

Conflicts of Interest

The authors declare no conflict of interest.

References

  1. United Nations Convention to Combat Desertification. United Nations Convention to Combat Desertification in Countries Experiencing Serious Drought and/or Desertification, Particularly in Africa; United Nations Convention to Combat Desertification: Paris, France, 1994. [Google Scholar]
  2. Millennium Ecosystem Assessment (MA). Ecosystems and Human-Being: Desertification Synthesis; World Resources Institute: Washington, DC, USA, 2005. [Google Scholar]
  3. Vero’n, S.R.; Paruelo, J.M.; Oesterheld, M. Assessing desertification. J. Arid Environ. 2006, 4, 751–763. [Google Scholar] [CrossRef]
  4. Daily, G.C. Restoring Value to the World’s Degraded Lands. Science 1995, 269, 350–354. [Google Scholar] [CrossRef] [PubMed]
  5. Prince, S.; Becker-Reshef, I.; Rishmawi, K. Detection and mapping of long-term land degradation using local net production scaling: Application to Zimbabwe. Remote Sens. Environ. 2009, 113, 1046–1057. [Google Scholar] [CrossRef]
  6. D’Odorico, P.; Bhattachan, A.; Davis, K.F. Global desertification: Drivers and feedbacks. Adv. Water Resour. 2013, 51, 326–344. [Google Scholar] [CrossRef]
  7. Vogt, J.V.; Safriel, U.; von Maltitz, G.; Sokona, Y.; Zougmore, R.; Bastin, G.; Hill, J. Monitoring and Assessment of Land Degradation and Desertification: Towards New Conceptual and Integrated Approaches. Land Degrad. Dev. 2011, 22, 150–165. [Google Scholar] [CrossRef]
  8. Verstraete, M.M.; Scholes, R.J.; Smith, M.S. Climate and desertification: Looking at an old problem through new lenses. Front. Ecol. Environ. 2009, 7, 421–428. [Google Scholar] [CrossRef]
  9. Jong, R.D.; Bruin, S.D.; Dent, M.S.D. Quantitative mapping of global land degradation using earth observations. Int. J. Remote Sens. 2011, 32, 6823–6853. [Google Scholar] [CrossRef] [Green Version]
  10. Dawelbait, M.; Morari, F. Monitoring desertification in a Savannah region in Sudan using Landsat images and spectral mixture analysis. J. Arid Environ. 2012, 80, 45–55. [Google Scholar] [CrossRef]
  11. Dawelbait, M.; Morari, F. Limits and Potentialities of Studying Dryland Vegetation Using the Optical Remote Sensing. Ital. J. Agron 2008, 3, 97–106. [Google Scholar] [CrossRef]
  12. Smith, M.O.; Ustin, S.L.; Adams, J.B.; Gillespie, A.R. Vegetation in deserts: I. A regional measure of abundance from multispectral images. Remote Sens. Environ. 1990, 31, 1–26. [Google Scholar]
  13. Ringrose, S.; Matheson, W.; Tempest, F. The development and cause of range degradation in southeast Botswana using multi-temporal Landsat MSS imagery. Photogramm. Eng. Remote Sens. 1990, 9, 1253–1262. [Google Scholar]
  14. Roig, F.A.; Gonzalez-Loyarte, M.; Abraham, E.M.; Méndez, E.; Roig, V.G.; Martinez Carretero, E. Maps of desertification hazards of Central Western Argentina, (Mendoza Province). In World Atlas of Thematic Indicators of Desertification; Arnold, E., Ed.; United Nations Environment Programme: London, UK, 1991. [Google Scholar]
  15. Del Valle, H.F.; Elissalde, N.O.; Gagliardini, D.A.; Milovich, J. Status of desertification in the Patagonian region: Assessment and mapping from satellite imagery. Arid Soil Res. Rehabil. 1998, 12, 95–121. [Google Scholar]
  16. Wu, B.; Ci, L.J. Landscape change and desertification development in the Mu Us Sandland, Northern China. J. Arid Environ. 2002, 50, 429–444. [Google Scholar] [CrossRef]
  17. Li, F.; Zhang, B.; Su, W.; He, Y.F.; Wang, Z.M.; Song, K.S.; Li, D.W.; Li, Z.M. Sandy desertification change and its driving forces in western Jilin Province, North China. Environ. Monit. Assess. 2008, 136, 379–390. [Google Scholar]
  18. Zhang, Y.Z.; Chen, Z.Y.; Zhu, B.Q.; Luo, X.Y.; Guan, Y.N.; Guo, S.; Nie, Y. Land desertification monitoring and assessment in Yulin of Northwest China using remote sensing and geographic information systems (GIS). Environ. Monit. Assess. 2008, 147, 327–337. [Google Scholar] [CrossRef] [PubMed]
  19. Yan, C.Z.; Song, X.; Duan, H.C.; Li, S. Assessment of Aeolian desertification trends from 1975’s to 2005’s in the watershed of the Longyangxia Reservoir in the upper reaches of China’s Yellow River. Geomorphology 2009, 112, 205–211. [Google Scholar] [CrossRef]
  20. Cui, Y.; Li, R. Analysis on dynamic change of desertification of Kubuqi Desert. Sci. Soil Water Conserv. 2010, 4, 57–60. (In Chinese) [Google Scholar]
  21. Liu, Y.F.; Li, J.X.; Bao, Y.H. Dynamic analysis of desertification in the western of ordos plateau- the case of etoke banner. J. Inn. Mong. Agric. Univ. 2011, 4, 80–87. (In Chinese) [Google Scholar]
  22. Wang, T.; Song, X.; Yan, C.Z.; Li, S.; Xie, J.L. Remote Sensing Analysis on Aeolian Desertification Trends in Northern China during 1975–2010. J. Desert Res. 2011, 6, 1351–1356. (In Chinese) [Google Scholar]
  23. Xue, Z.J.; Qin, Z.D.; Li, H.J.; Ding, G.W.; Meng, X.W. Evaluation of Aeolian desertification from 1975 to 2010 and its causes in northwest Shanxi Province, China. Glob. Planet. Chang. 2013, 107, 102–108. [Google Scholar] [CrossRef]
  24. Wu, W. Method and Practice of Remote Sensing Monitoring on Desertification Development. Remote Sens. Technol. Appl. 1997, 4, 14–20. (In Chinese) [Google Scholar]
  25. Wu, J.; Peng, D.L. Advances in Researches on Desertification Evaluation Technology Based on Remote Sensing. World For. Res. 2009, 5, 34–39. (In Chinese) [Google Scholar]
  26. Lanfredi, M.; Lasaponara, R.; Simoniello, T.; Cuomo, V.; Macchiato, M. Multi-resolution spatial characterization of land degradation phenomena in southern Italy from 1985 to 1999 using NOAA-AVHRR NDVI data. Geophys. Res. Lett. 2003, 2, 1069. [Google Scholar] [CrossRef]
  27. Runnström, M.C. Rangeland development of the Mu Us sandy land in semiarid China: An analysis using Landsat and NOAA remote sensing data. Land Degrad. Dev. 2003, 14, 189–202. [Google Scholar] [CrossRef]
  28. Masellif, F.; Rembold, F. Integration of LAC and GAC NDVI data to improve vegetation monitoring in semi-arid environments. Int. J. Remote Sens. 2002, 12, 2475–2488. [Google Scholar] [CrossRef]
  29. Symeonakis, E.; Drake, N. Monitoring desertification and land degradation over sub-Saharan Africa. Int. J. Remote Sens. 2004, 3, 573–592. [Google Scholar] [CrossRef]
  30. Lambin, E.F.; Ehrlich, D. Land-cover changes in sub-saharan Africa (1982–1991): Application of a change index based on remotely sensed surface temperature and vegetation indices at a continental scale. Remote Sens. Environ. 1997, 61, 181–200. [Google Scholar] [CrossRef]
  31. Collado, A.; Chuvieco, E.; Camarasa, A. Satellite remote sensing analysis to monitor desertification processes in the crop-rangeland boundary of Argentina. J. Arid Environ. 2002, 52, 121–133. [Google Scholar] [CrossRef]
  32. Prince, S.; de Colstoun, E.; Kravitz, L. Evidence from rain-use efficiencies does not indicate extensive Sahelian desertification. Glob. Chang. Biol. 1998, 4, 359–374. [Google Scholar] [CrossRef]
  33. Haboudane, D.; Bonn, F.; Royer, A.; Sommer, S.; Mehl, W. Land degradation and erosion risk mapping by fusion of spectrally-based information and digital geomorphometric attributes. Int. J. Remote Sens. 2002, 23, 3795–3820. [Google Scholar] [CrossRef]
  34. Wessels, K.; Prince, S.; Frost, P.; van Zyl, D. Assessing the effects of human-induced land degradation in the former homelands of northern South Africa with a 1 km AVHRR NDVI time-series. Remote Sens. Environ. 2004, 91, 47–67. [Google Scholar] [CrossRef]
  35. Wessels, K.; Prince, S.; Malherbe, J.; Small, J.; Frost, P.; van Zyl, D. Can human-induced land degradation be distinguished from the effects of rainfall variability? A case study in South Africa. J. Arid Environ. 2007, 68, 271–297. [Google Scholar]
  36. Wessels, K.; Prince, S.; Reshef, I. Mapping land degradation by comparison of vegetation production to spatially derived estimates of potential production. J. Arid Environ. 2008, 72, 1940–1949. [Google Scholar] [CrossRef]
  37. Wessels, K.; van den Bergh, F.; Scholes, R. Limits to detectability of land degradation by trend analysis of vegetation index data. Remote Sens. Environ. 2012, 125, 10–22. [Google Scholar] [CrossRef]
  38. Zika, M.; Erb, K. The global loss of net primary production resulting from human-induced soil degradation in drylands. Ecol. Econ. 2009, 69, 310–318. [Google Scholar] [CrossRef]
  39. Evans, J.; Geerken, R. Discrimination between climate and human-induced dryland degradation. J. Arid Environ. 2004, 57, 535–554. [Google Scholar] [CrossRef]
  40. Zhou, W.; Gang, C.; Zhou, F.; Li, J.; Dong, X.; Zhao, C. Quantitative assessment of the individual contribution of climate and human factors to desertification in northwest China using net primary productivity as an indicator. Ecol. Indic. 2015, 48, 560–569. [Google Scholar] [CrossRef]
  41. Reynolds, J.; Stafford Smith, D. Global Desertification: Do Humans Cause Deserts? Dahlem University Press: Berlin, Germany, 2002. [Google Scholar]
  42. Lin, D.G.; Yu, H.; Lian, F.; Wang, J.A.; Zhu, A.X.; Yue, Y.J. Quantifying the hazardous impacts of human-induced land degradation on terrestrial ecosystems: A case study of karst areas of south China. Environ. Earth Sci. 2016, 75, 1127. [Google Scholar] [CrossRef]
  43. Haberl, H.; Erb, K.; Krausmann, F. Human Appropriation of Net Primary Production: Patterns, Trends, and Planetary Boundaries. Annu. Rev. Environ. Resour. 2014, 39, 363–391. [Google Scholar] [CrossRef]
  44. Ma, J.H.; Cai, D.H.; Xiao, T. Qualified evaluating on the remote sensing of desertification—A case study of the Erdos region. J. Lanzhou Univ. (Nat. Sci.) 2007, 4, 1–6. (In Chinese) [Google Scholar]
  45. Pan, J.H.; Liu, T.Y. Extracting desertification from Landsat TM imagery based on spectral mixture analysis and Albedo-Vegetation feature space. Nat. Hazards 2013, 2, 915–927. [Google Scholar] [CrossRef]
  46. Xu, J.X. Sand-dust storms in and around the Ordos Plateau of China as influenced by land use change and desertification. Catena 2006, 65, 279–284. [Google Scholar] [CrossRef]
  47. Wu, W. Study on processes of desertification in Mu Us Sandy Land for last 50 years, China. J. Desert Res. 2001, 21, 164–169. (In Chinese) [Google Scholar]
  48. Wu, B.; Ci, L.J. Causes and development stages of desertification in the Mu Us Sandland. Chin. Sci. Bull. 1998, 43, 2437–2440. (In Chinese) [Google Scholar]
  49. Yue, Y.; Shi, P.; Zou, X.; Ye, X.; Zhu, A.; Wang, J. The measurement of wind erosion through field survey and remote sensing: A case study of the Mu Us Desert, China. Nat. Hazards 2015, 76, 1497–1514. [Google Scholar]
  50. Yue, Y.; Ye, X.; Zou, X.; Wang, J.; Gao, L. Research on land use optimization for reducing wind erosion in sandy desertified area: A case study of Yuyang County in Mu Us Desert, China. Stoch. Environ. Res. Risk Assess. 2016, 1–17. [Google Scholar] [CrossRef]
  51. Robinove, C.J.; Chavez, P.S.; Gehring, D.; Holmgren, R. Arid Land Monitoring Using Landsat Albedo Difference Images. Remote Sens. Environ. 1981, 11, 133–156. [Google Scholar] [CrossRef]
  52. Lira, J. A Model of Desertification Process in a Semi-arid Environment Employing Multi-spectral Images. In Progress in Pattern Recognition, Image Analysis and Applications; Springer: Heidelberg, Germany, 2004. [Google Scholar]
  53. Liang, S.L. Narrowband to broadband conversions of land surface albedo I Algorithms. Remote Sens. Environ. 2000, 76, 213–238. [Google Scholar] [CrossRef]
  54. Zhu, A.X.; Wang, R.X.; Qiao, J.P.; Qin, C.Z.; Chen, Y.B.; Liu, J.; Du, F.; Lin, Y.; Zhu, T.X. An expert knowledge-based approach to landslide susceptibility mapping using GIS and fuzzy logic. Geomorphology 2014, 214, 128–138. [Google Scholar] [CrossRef]
  55. Zhu, A.X. A personal construct-based knowledge acquisition process for natural resource mapping. Int. J. Geogr. Inf. Sci. 1999, 13, 119–141. [Google Scholar] [CrossRef]
  56. Yue, Y.; Wang, J.; Lv, H.; Liu, J.; Wang, Z.; Li, L. Land Use Optimization at Ecological Security Level in Desert Regions–A case study of Horqin Sandy Land. In Progress in Safety Science and Technology Volume V (Part B); Li, S.C., Wang, Y.J., Huang, P., Eds.; Science Press: Beijing, China, 2005; pp. 2111–2116. [Google Scholar]
  57. Yue, Y.; Zhou, H.; Wang, J.; Shi, P.; Lv, H.; He, C.; Yan, P. Research on the land use structure of Asian desert regions at ecological security level. Adv. Earth Sci. 2006, 21, 131–137. (In Chinese) [Google Scholar]
  58. Yue, Y.; Wang, J.; Yi, X.; Shi, P.; Zou, X.; Zhang, F. Risk assessment of Aeolian sand disaster in cities in sandy area of northern China based on RS, GIS and models. J. Nat. Disasters 2008, 17, 15–20. (In Chinese) [Google Scholar]
  59. Yue, Y.; Wang, J.; Zou, X.; Shi, P. Assessment on the risk of Aeolian sand disasters around the lakes and reservoirs in sandy lands in north China and some security measures: A case study in a sandy land in Inner Mongolia. Arid Zone Res. 2008, 25, 574–582. (In Chinese) [Google Scholar]
  60. Yue, Y.; Wang, J. Land Use Change and Optimization in Desertified Area; Science Press: Beijing, China, 2011. [Google Scholar]
  61. Yi, X.; Yin, Y.; Yue, Y. Temporal and spatial changes of residential land in the Yuyang desert region of northern Shaanxi Province in recent 20 years. Front. Earth Sci. 2012, 6, 250–260. [Google Scholar] [CrossRef]
  62. Yue, Y.J.; Yan, W.N.; Wang, X.H.; Shen, Y.C.; Qiu, M.M.; Zhou, L.; Li, J. Impacts of the ecological restoration program on regional ecosystem services: A case of Yanchi County, Ningxia Autonomous Region. J. Arid Land Resour. Environ. 2014, 28, 60–67. (In Chinese) [Google Scholar]
  63. Benediktsson, J.A.; Swain, P.H.; Ersoy, O.K. Neural network approaches versus statistical methods in classification of Multisource remote sensing data. Trans. Geo-Sci. Remote Sens. 1990, 28, 540–552. [Google Scholar] [CrossRef]
  64. Qiao, P.L.; Zhang, J.X.; Lin, Z.J. An Artificial Neural Network Method for the Information of Desertification Extraction. J. Surv. Mapp. 2004, 1, 58–62. (In Chinese) [Google Scholar]
  65. Mamat, S.; Tashpolat, T.; Ding, J.L.; He, Q.S. Study on Extracting the Information about desertified Lands Based on Principal Component Fusion and BP Neural Network. Arid Zone Res. 2008, 5, 647–652. (In Chinese) [Google Scholar]
  66. Zhu, H.Y.; Li, X.B. Discussion on the Index method of regional land use change. Acta Geogr. Sin. 2003, 5, 643–650. (In Chinese) [Google Scholar]
  67. Zhang, G.; Dong, J.; Xiao, X.; Hu, Z.; Sheldon, S. Effectiveness of ecological restoration projects in Horqin Sandy Land, China based on SPOT-VGT NDVI data. Ecol. Eng. 2012, 38, 20–29. [Google Scholar] [CrossRef]
  68. Cao, S. Why large-scale afforestation efforts in China have failed to solve the desertification problem. Environ. Sci. Technol. 2008, 42, 1826–1831. [Google Scholar] [CrossRef] [PubMed]
  69. Wang, X.; Zhang, C.; Hasi, E.; Dong, Z. Has the Three Norths Forest Shelterbelt Program solved the desertification and dust storm problems in arid and semiarid China? J. Arid Environ. 2010, 74, 13–22. [Google Scholar] [CrossRef]
  70. Mason, J.A.; Swinehart, J.B.; Lu, H.Y.; Miao, X.D.; Cha, P.; Zhou, Y.L. Limited change in dune mobility in response to a large decrease in wind power in semi-arid northern China since the 1970s. Geomorphology 2008, 102, 351–363. [Google Scholar] [CrossRef]
  71. Chen, W.N.; Dong, G.R.; Dong, Z.B. Achievements and needs of studies on wind erosion in Northern China. Adv. Earth Sci. 1994, 9, 6–12. (In Chinese) [Google Scholar]
  72. Wang, T.; Zhu, Z.D. Some problems of desertification in northern China. Quat. Sci. 2001, 21, 56–65. (In Chinese) [Google Scholar]
  73. Zha, Y.; Liu, Y.S.; Deng, X.Z. A landscape approach to quantifying land cover changes in Yulin, Northwest China. Environ. Monit. Assess. 2008, 138, 139–147. [Google Scholar] [CrossRef] [PubMed]
  74. Huete, A.R. A soil-adjusted vegetation index (SAVI). Remote Sens. Environ. 1988, 25, 295–309. [Google Scholar] [CrossRef]
  75. Huete, A.R.; Hua, G.; Qi, J.; Chehbouni, A.; van Leeuwen, W.J.D. Normalization of multidirectional red and NIR reflectances with the SAVI. Remote Sens. Environ. 1992, 41, 143–154. [Google Scholar] [CrossRef]
  76. Wang, T. Study on Sandy Desertification in China-2.Contents of Desertification Research. J. Desert Res. 2003, 23, 477–482. (In Chinese) [Google Scholar]
  77. Wang, T.; Zhao, H. Fifty-year History of China Desert Science. J. Desert Res. 2005, 25, 145–165. [Google Scholar]
  78. United Nations Convention to Combat Desertification. Desertification-Coping with Today’s Global Challenges: In the Context of the Strategy of The United Nations Convention to Combat Desertification; High-Level Policy Dialogue: Bonn, Germany, 2008. [Google Scholar]
  79. Wang, T.; Sun, J.; Han, H.; Yan, C. The relative role of climate change and human activities in the desertification process in Yulin region of northwest China. Environ. Monit. Assess. 2011, 12, 7165–7173. [Google Scholar] [CrossRef] [PubMed]
Figure 1. Location and land cover of Ordos Plateau.
Sustainability 08 01174 g001
Figure 2. Research framework.
Sustainability 08 01174 g002
Figure 3. The arithmetic structure of a BP-ANN. LDI, land degradation index.
Sustainability 08 01174 g003
Figure 4. Liner relationship of NDVI and albedo in (A) 1990, (B) 2000 and (C) 2010 in Ordos Plateau.
Sustainability 08 01174 g004
Figure 5. Land degradation degree in (A) 1990, (B) 2000 and (C) 2010 in Ordos Plateau.
Sustainability 08 01174 g005
Figure 6. Areas of different land degradation degrees in the Ordos Plateau in 1990, 2000 and 2010.
Sustainability 08 01174 g006
Figure 7. Area ratio of different land degradation degrees in the Ordos Plateau in 1990, 2000 and 2010. (a) None; (b) low; (c) medium; (d) high; (e) severe.
Sustainability 08 01174 g007aSustainability 08 01174 g007b
Figure 8. Transfer-in area percentage of various degradation degrees by 2000.
Sustainability 08 01174 g008
Figure 9. Transfer-in area percentage of various land degradation degrees by 2010.
Sustainability 08 01174 g009
Figure 10. Comprehensive dynamic degree of land degradation in Ordos Plateau.
Sustainability 08 01174 g010
Figure 11. Relationship between land degradation index and land degradation degree in 2010 ((a) based on original expert knowledge; (b) based on diffused expert knowledge by BP-ANN).
Sustainability 08 01174 g011
Table 1. Knowledge and the key parameters for classifying land degradation (TM 4, 3 and 2 bands).
Degradation DegreeLand TypeVisual Interpretation KeysNDVI (−1–1)Albedo (0–1)
None degradationFixed sand dunes or oasis grassland, farmland, dry steppe or desert steppeDark green, green, bright green, dark red, red, light red; irregular block>0.3798<0.6614
Low degradationFixed sandy land and eroded farmland, vegetation cover > 60%Light red, or light red with red spots, irregular block0.3798–0.13850.6614–0.7522
Medium degradationSemi-fixed sandy land and bare gravel land, 30% < vegetation cover < 60%Light red, irregular block, uneven ground, with distributed sand dunes0.1385–0.01500.7522–0.8290
High degradationSemi-shifting sandy land, vegetation cover < 30%White and clear sand dune with dotted red, irregular block0.0150–−0.01500.8290–0.9154
Sever degradationShifting sandy land or Gobi, vegetation cover < 10%Distributed over a large area; uniform colors with very light blue-green or bright white; obvious sand dune and longitudinal dune; a crescent, lattice or wavy-shaped with a clear boundary<−0.0150>0.9154
Table 2. The error matrix and accuracy for land degradation detection.
Land Degradation DegreeNoneLowMediumHighSevereTotalProducer PrecisionUser Precision
None8840009288%95.65%
Low8883009988%88.89%
Medium46902210490%86.54%
High02595310595%90.48%
Server00239510095%95%
Total100100100100100500

