Article

Development of Social Intensity Database Using Asian International Input–Output Table for Social Life Cycle Assessment

1
National Metal and Materials Technology Center (MTEC), National Science and Technology Development Agency (NSTDA), Thailand Science Park, Pathum Thani 12120, Thailand
2
Faculty of Environmental Studies, Tokyo City University, Yokohama 224-8551, Japan
3
Institute of Industrial Science, The University of Tokyo, Tokyo 153-8505, Japan
4
The Petroleum and Petrochemical College, Chulalongkorn University, Patumwan, Bangkok 10330, Thailand
*
Author to whom correspondence should be addressed.
Sustainability 2016, 8(11), 1135; https://doi.org/10.3390/su8111135
Submission received: 5 July 2016 / Revised: 15 September 2016 / Accepted: 21 September 2016 / Published: 4 November 2016

Abstract

:
The social impacts of products and service life cycles are increasingly of interest among policy makers and stakeholders. Workers’ issues are considered to be a source of key inventory data to assess social impacts, and are crucial in moving towards social sustainability. There is a need to develop a social inventory database for evaluating social impacts of products and services. This study aimed at the development of a social intensity dataset using an input–output analysis framework. The 2005 Asian International input–output table is used in this work. Six social issues are considered: total employment, paid workers, vulnerable employment, wages, fatal, and non-fatal occupational injuries. To verify the acceptability of this study, an estimation of total social footprint deduced from final consumption rates was carried out. The social intensities associated with 10 countries and 76 economic sectors were constructed. The results show that the social intensities from cradle to gate the agricultural sector has the highest in terms of total employment and vulnerable employment. Meanwhile, the mining sector in China has a higher non-fatal and fatal occupational injuries than the agriculture sector, secondary sector, and tertiary sector. The public administration sector and the education and research sector had a higher wages intensity than any other sectors due to these sectors being labor intensive and having higher wages. The social intensity in terms of total employment, paid workers, vulnerable employment, non-fatal injuries, and fatal accident cases in the developing countries was higher than the developed countries whereas wages intensity in developing countries was lower than that of developed countries. The social footprints resulting from the final consumption of each country show that the social footprints had transferred from the developing countries to the developed countries. Exports from China to the USA, Japan, South Korea, Taiwan, and Singapore have a significant social impact in these countries.

1. Introduction

Life Cycle Assessment (LCA) is a helpful tool for evaluating and quantifying the environmental consequences relevant to a product, process, or service from the cradle to the grave in a systematic approach (ISO, 2006) [1]. In addition, the social dimension can be included in the LCA method to evaluate the social impacts of a product, the so-called social LCA (S-LCA). The results of an S-LCA is provide information on social performance to be communicated with stakeholders. The Products S-LCA Guidelines of UNEP/SETAC is a popular manual for many S-LCA studies around the world [2]. Almost all social issues addressed in the S-LCA case studies evaluated social impact in terms of a qualitative and semi-quantitative approach. In this regard, there is a lack of quantitative inventory data for many social indicators.
The S-LCA guidelines of UNEP/SETAC proposed social indicators in terms of quantitative, qualitative and semi-quantitative factors. The social inventory issues in this guideline consist of five stakeholder groups: workers, local communities, consumers, society, and value chain actors [2]. There have been many S-LCA studies around the world and many social issues evaluated based on the International Labour Organization’s (ILO) perspective. There are many S-LCA frameworks that have been proposed. Dreyer et al. [3] offered the S-LCA framework by focusing on international criteria and company relevance. Hutchins et al. [4] proposed a framework for characterizing and identifying key characteristics of the social impacts of products or processes using a process-based LCA approach. The development and application of the social hotspots database (SHDB) were demonstrated by Benoit-Norris et al. [5]. This SHDB was developed by following the S-LCA Guidelines of UNEP/SETAC. Information on the social indicators of 191 countries with multiple sectors is presented in the SHDB. The data were collected from over 200 data sources, mostly international organizations’ databases.
There are many S-LCA studies using an input–output analysis (IOA) framework. However, connecting social issues with the input–output database using satellite accounts is insufficient. Social impacts such as employment, working hours, labor conditions, or occupational health can be assessed using the IOA method. Almost all case studies are focused on only an employment issue (Garrett-Peltier [6]; Martinez et al. [7]; Chen et al. [8]; Tang et al. [9]; Lee and Yoo [10]; Ferrao et al. [11]; McBain and Alsamawi [12] Malik et al. [13]; Yang et al. [14]). The case studies conducted by Kucukvar et al. [15] are interested in income and work-related injuries, and Alsamawi et al. [16] focused on the employment and income footprint. Chang [17] evaluated the social impacts in terms of the accidents, fatalities, employment, research and development personnel, science and technology (ST) personnel, and funding for ST activities of a construction project. Onat et al. [18] assessed the social impacts on income, government tax, and injuries of the building sector. Simas et al. [19] assessed social impacts in term of bad labor footprints consisting of indices such as negative impacts on occupational health, vulnerable employment, gender inequality, unskilled workers, child labor, and forced labor. Whereas, Gómez-Paredes et al. [20] focused on six labor issues including collective bargaining, child labor, forced labor, gender inequality, hazardous work, and social security. Papong et al. [21] established the social inventory dataset of Thailand using an IOA approach, in which social issues covered the total employment, female employment, worked hours, wages and salaries, fatal, and non-fatal injuries.
This study aimed to establish a social intensity database using the IOA framework, covering 10 Asian countries, for the year 2005. The IOA framework is an analytical tool for evaluating impacts along with the production chains of economic systems referred to as “footprints”. This framework can be estimated through an environmentally extended IOA. The Asian International Input–Output (AIIO) database was used as the basis for this study. The social satellite accounts were developed using data on total employment, paid workers, vulnerable employment, wages, and fatal and non-fatal injuries to construct the social inventory dataset. Using the Leontief Inverse Matrix to calculate the AIIO table with associated satellite accounts, the resulting data shows the social intensities for 10 countries covering the output of 760 economic sectors. By multiplying this with the final consumption of each country, the result shows the social footprints require from domestic products and services and that imported from overseas, to fulfil the final demand of each country.

2. Materials and Methods

This section describes the methods applied in the study. We calculated the social inventory database in terms of social intensities associated with final consumption. We used a consumption-based approach to estimate the social footprint, and different indicators of social intensities were compared to detail the overall impact of the consumed products.

2.1. Social Footprint Indicators

2.1.1. Total Employment

Total employment in this study covers all status groups, which consists of salaried employees, paid family workers, employers, the self-employed, members of cooperatives, unpaid family workers and workers not classifiable [22]. There are no differences between persons who worked full-time and part-time. The unit of measurement is the number of persons in employment.

2.1.2. Paid Worker

A paid worker is a person who works for a public or private employer and receives compensation in wages, commission, tips, piece-rates or pay in kind. This comprises full-time workers, part-time workers, home-based workers, fixed-term workers, seasonal workers, and employees on probationary and trial periods [22]. The measured unit is the number of persons in total labor with employee status.

2.1.3. Vulnerable Employment

Workers considered as in vulnerable employment are defined as the sum of the employment status groups of self-employed and unpaid family workers. This worker group has no formal employment agreement [23]. Therefore, they are likely to lack decent working conditions. This may include the following: workers not covered by social security and labor regulations; labor without contribution to and advantages from retirement schemes; workers with no constancy and security of work, etc. In developed countries, vulnerable employment contributes to 10% of the total workforce, whereas in the developing countries they account for nearly three-quarters of total workers [24]. The measured unit is the number of persons in total labor without employee status.

2.1.4. Wages

Wages refer to the amount of money agreed between an employer and an employee to be paid in return for work done under a contract of employment for normal working periods (such as hourly, daily, weekly, monthly or other period of time basis), or on the basis of piecework done during the normal working time of a working day. It also includes money to be paid by an employer to an employee on holiday and on leave during which the employee does not work but is entitled to the money under the labor regulation [22]. Employees are classified as long-term workers, temporary workers, executives and hired laborers in the agricultural sector, but excluded family workers. The measured unit is the amount of money (USD) that the employer paid to the employee.

2.1.5. Fatal Occupational Injury

The fatal occupational injury is injuries that led to death within a year of the day of the occupational accident. The occupational accident is an unexpected and unplanned event, including acts of violence, occurring out of or relation to work which effects one or more workers suffering a personal injury, disease or death [22]. The indicator used to evaluate the fatal occupational injury is the number of cases of death caused by the occupational accidents during one year.

2.1.6. Non-Fatal Occupational Injuries

Non-fatal occupational injuries are cases of occupational injury where the injured workers are unable to work temporarily or permanently after that. Cases of temporary disability are cases of occupational injury where the workers injured were incapable of working after the accident, but assumed normal duties of work within one year from the day of the accident [22]. The indicator used to evaluate the non-fatal occupational injury is the number of cases of injury caused by the occupational accidents during one year.

2.2. Input–Output Model

The economic input–output model was developed by Leontief [25] and is generally used as a quantitative model for analysis of the national and regional economic impact. The input–output analysis (IOA) can analyze flows of products and services between economic sectors and final demand. Social and environmental footprints embodied in products and services can be calculated using the IOA framework by applying a socially and environmentally extended input–output table for evaluating the impacts of each economic sector. The strength of the IOA model is having a comprehensive system boundary, consistent results, and cost and time savings [26]. However, the limitations of IOA are that it provides only a rough analysis for specific products, and is highly dependent on information availability. The social footprints of intra-trade and inter-trade were calculated using the Asian International Input-Output (AIIO) model. The model overviews the 2005 Asian economy and consists of 76 industrial sectors traded within and among 10 countries [26]. In this study, we divided Asian countries into three categories: (1) developed countries (the US and Japan); (2) richest Asian countries (South Korea, Taiwan, and Singapore); and (3) developing countries (China, Malaysia, Thailand, Indonesia, and Philippines).
This study uses the 2005 AIIO table for evaluating the social inventory database that consists of 76 economic sectors and 10 countries. The social issues in this analysis include the total employment, paid workers, vulnerable employment, wages, and fatal and non-fatal occupational injuries. Definitions of the economic sectors for the AIIO table are shown in Table A1, in the Appendix. This study divided the economic sectors into three categories: primary sector (IO code 01–11), secondary sector (IO code 12–64), and tertiary sector (IO code 65–76). The primary sector is the sector of an economy making direct use of natural resources; this consists of agriculture, forestry, fishing and mining. The secondary sector is the economic sectors that manufactures finished products as well as construction. The tertiary sector, also known as the service industry, includes information technology, education, and financial services.
The AIIO tables consist of 10 countries in the Asia-Pacific region: Japan (J), the US (U) and eight Asian countries China (C), South Korea (K), Taiwan (N), Singapore (S), Thailand (T), Malaysia (M), Indonesia (I), and Philippines (P). Based on this data, the input–output coefficient matrix is then illustrated as Equation (1).
A = ( X i j α β X j β ) = [ A I I A I M A I J A I U A M I A M M A M J A M U A J I A J M A J J A J U A U I A U M A U J A U U ]
where α is a supplying country code of goods and services; β is a demanding country code of goods and services; i is industry i of country α ; j of country β , and X i j α β is an element of the intermediate matrix; X j β is an element of the gross output vector.
Let F i k α β be a category k final demand of the country/region β for the product i of country/region α. Like the same feature as in the intermediate matrices on the above, the final demand matrix in the AIIO tables is explained as per Equation (2).
F = ( F i k α β ) = [ F I I F I M F I J F I U F M I F M M F M J F M U F J I F J M F J J F J U F U I F U M F U J F U U ]
It is then understood that the direct and indirect impacts of final consumption of country β on output, X F β , can be determined by Equation (3).
X F β = ( I A ) 1 F β
where (IA)–1 is the Leontief inverse matrix that represents the total effect of both direct and direct inputs to fulfill one unit of final consumption in monetary value; I is the identity matrix.
Let L as the total social inputs required to satisfy the final consumption, or the social footprint. The social extensions are total employment, paid workers, vulnerable employment, wages, fatal accidents and non-fatal occupational injuries, for economic sectors as calculated in social footprints. We can extend the IO relationship derived Equation (3) as:
L β = l β X F β = l β ( I A ) 1 F β
where L β is the direct and indirect social vector or social footprint vector of country β, l β is the diagonal matrix of social coefficient of country β.

2.3. Data Sources and Data Processing

This study established the social intensity database using the 2005 AIIO table. The social intensity developed in this study consisted of total employment, paid workers, vulnerable employment, wages, and fatal and non-fatal occupational injuries. The definition of the social indicators in this study is presented in Section 2.1.
The statistical data for the total employment, paid workers, and vulnerable employment of 10 Asian countries and 76 economic sectors in 2005 was obtained from IDE-JETRO [27]. The IDE-JETRO [27] provide the 76 economic sectors data on all employment statuses for each country in the study. We assumed the vulnerable employment pertains to most workers who come under the employment status groups of self-employed and unpaid family workers. In a similar way, the wages intensity of each economic sector of 10 Asian countries in 2005 was calculated using the data from the AIIO table [28].
The statistical data for the non-fatal and fatal occupational injuries of each country were obtained from both national and International Labour Organization (ILO) databases. These databases included only formal workers or permanent workers as defined under the social security law of each country and was based on data in 2005 in accordance with the 2005 AIIO table. The labor that worked in the informal market was excluded in the occupational injuries statistics.
The fatal and non-fatal occupational accident information of both national and ILO data sources covers only wage employees. For the US, the number of fatal and non-fatal accidents was taken from the webpage of the Bureau of Labor Statistics, U.S. Department of Labor [29,30]. Currently, the US statistical data cover also self-employed persons and farmers. It is seen that approximately 97.75% of all fatal accidents are covered in the US statistics. The total fatal accidents for the US were corrected using this ratio (100%/97.75% = 1.02) whereas non-fatal accidents were corrected using this ratio (100%/83.18% = 1.20). The statistical data of Japan and Taiwan were gathered from the ILO [31]. It is found that around 82.91% of all fatal accidents in Japan is covered in the ILO databases. The total fatal and non-fatal accidents for Japan were corrected using this ratio (100%/82.91% = 1.21). Meanwhile, for Taiwan, the total fatal and non-fatal accidents were adjusted using the ratio of (100%/73.32% = 1.36). These data for Thailand were obtained from Thailand’s Social Security Office (SSO) [32]. It is found that only 23.23% of all fatal accidents in Thailand are covered in the SSO databases. The total fatal and non-fatal accidents for Thailand were adjusted using the ratio of (100%/23.23% = 4.30). South Korean data were gathered from ILO [31] and Korea Ministry of Employment and Labor [33]. The total fatal and non-fatal accidents for Korea were adjusted using this ratio (100%/70.34% = 1.42). For Singapore, the data were gathered from the workplace injuries statistics database of the Occupational Safety and Health Division, Singapore Ministry of Manpower [34]. The total fatal and non-fatal accidents for Singapore were adjusted using the ratio of (100%/95.22% = 1.05). The fatal occupational injuries data of Malaysia were obtained from Abas et al. [35], whereas non-fatal occupational injuries were obtained from Abas et al. [36]. It is showed that around 75.49% of all fatal and non-fatal accidents in Malaysia are covered in these previous studies. The total fatal and non-fatal accidents for Malaysia were corrected using this ratio (100%/75.49% = 1.55).
Occupational injuries data from ILO consist of 14 economic sectors, whereas national statistical data of each country cover 30–50 industry sectors, which provides better information on economic sector than the data from ILO. The fatal and non-fatal injuries inputs were distributed across a wide variety of economic sectors and allocated to each industry in the AIIO according to the proportion of workers with injuries per economic sector. The separation was calculated based on the assumption that, for the major economic sector, the proportion of workers with injuries would be same as for specific economic sectors under major sector.
For the Philippines, we estimated the fatal and non-fatal occupational injuries using the average incidence rate and fatality rate from the Philippines Bureau of Labor and Employment Statistics in 2003 and 2007 [37]. We calculated based on the assumption that the proportion of workers involved in an accident in each economic sector was steady on the whole. In addition, we found that only 5.70% of all fatal and non-fatal accidents in Philippines is covered in these databases. The total fatal and non-fatal accidents for Philippines were adjusted using the ratio of (100%/5.70% = 17.54). In China, we used the fatality rate per economic sector from the national profile report on occupational safety and health in 2005 to estimate the fatal workplace accident cases [38] and worked under the same assumption of the Philippines. For the non-fatal occupational injuries, we estimated the total non-fatal cases from the statistical data on non-fatal work injuries of the National Bureau of Statistics of China [39] and allocated them to each economic sector based on the fatal accident cases of China [38]. We found that only 14.31% of all fatal and non-fatal accidents in China are covered in these data sources. The total fatal and non-fatal accidents for China were corrected using the ratio of (100%/14.31% = 6.99). For Indonesia, the total number of fatal and non-fatal workplace injuries in 2005 was obtained from Irfani [40]. We distributed the data on fatal and non-fatal cases across each economic sector based on the assumption that the proportion of workers with fatal and non-fatal injuries of each economic sector in 2005 would be same as the statistical data on injuries in each economic activity in 1997 in Indonesia [41]. We allocated the fatal and non-fatal injuries overall into each sector under the same assumption used for the Philippines. In addition, we found that only 13.92% of all fatal and non-fatal accidents in Indonesia are covered in these data sources. The total fatal and non-fatal accidents for Indonesia were corrected using the ratio of (100%/13.92% = 7.18).

3. Results

3.1. Total Employment

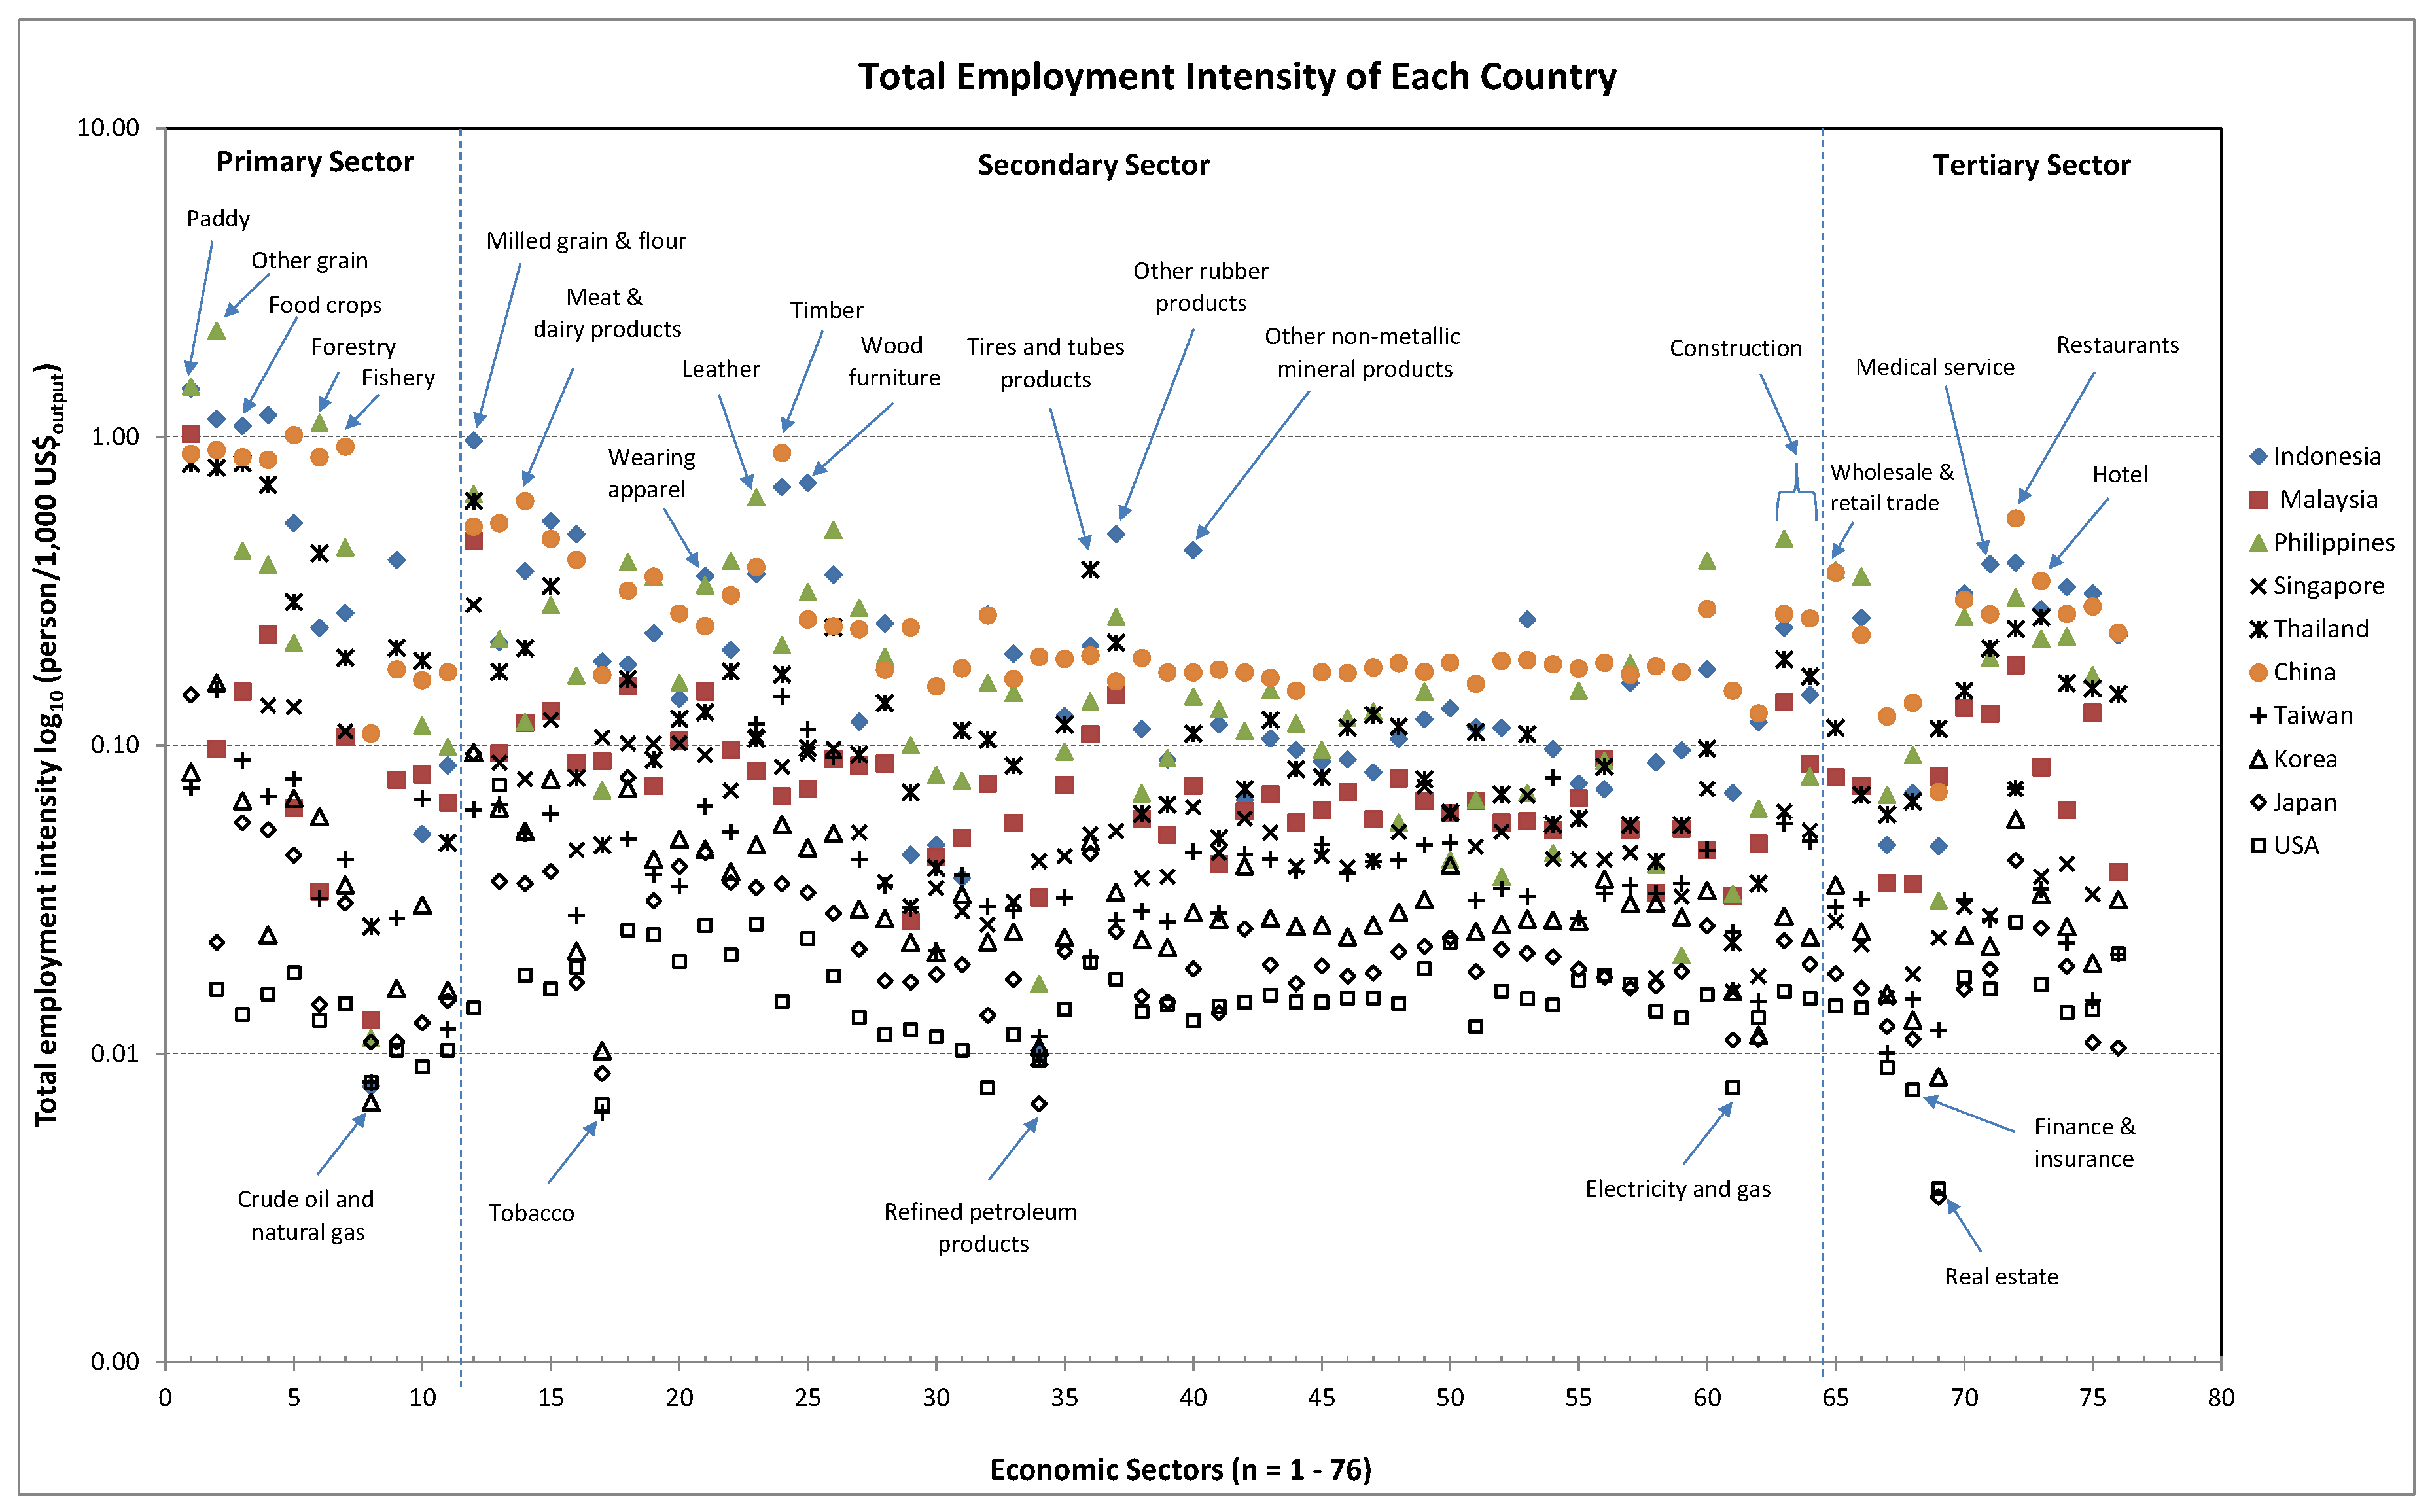
3.1.1. Total Employment Intensity

Total employment intensity, measured by labor inputs in terms of person-year per 1000 US$ output for 10 countries with 76 industrial sectors is shown in Figure 1. The result shows that this is one magnitude higher in the developing countries than in the developed countries (Japan and USA). Particularly, labor input was of the same magnitude in agricultural sectors. For example, in Thailand, the employment intensity is approximately 5–34 times greater than that in Japan and is about 13–60 times greater than that in the USA. In China, the employment intensity of agriculture sectors is 6–58 times higher than that in Japan and is approximately 50–65 times higher than that in the USA. Generally, the employment intensity in agricultural crops (IO code 1–4), livestock (IO code 5), forestry (IO code 6), and fishery (IO code 7) sectors are higher than other sectors, especially in developing countries. Due to agriculture in developing countries being so labor intensive, the agricultural sector has the highest employment intensity. The next was the tertiary sector and secondary sector, respectively. The employment intensity deduced in this study demonstrated similar trends to the results obtained by Papong et al. [21]. Top-ranking employment intensity is common in developing countries including China, Indonesia, Philippines, Thailand, and Malaysia. Whereas, bottom-ranking employment intensity is more common in developed countries and higher income countries (USA, Japan, Korea, Taiwan, and Singapore, respectively).
When considering the primary sector (IO code 1–11), the employment intensity in terms of (person/1000 US$ output) of the paddy sector is highest in Indonesia (1.42), Philippines (1.39), and Malaysia (1.00). The other grain sectors are highest in Philippines (2.13), Indonesia (1.14), and China (0.90). The food crop sector is highest in Indonesia (1.08), China (0.85), and Thailand (0.80). Meanwhile, the crude oil and natural gas sector is lowest in all countries. When considering the employment intensity of the secondary sector (IO code 12–64), the results showed that the milled grain and flour sector is superb in almost all countries except China, Taiwan, and the USA. The timber sector is highest in China (0.88) and Indonesia (0.67), whereas in the USA the lowest can be found in the tobacco sector (0.007). The top-ranking employment intensity of Indonesia is in the milled grain and flour (0.98), wooden furniture (0.70), timber (0.67), other food products (0.53), and other rubber products sectors (0.49), respectively. In Malaysia, the top five employment intensities can be found in milled grain and flour (0.47), spinning (0.15), clothing apparel (0.15), other rubber products (0.15), and the building construction sectors (0.13), respectively. Top-ranking intensities in the Philippines are milled grain and flour (0.63), leather and leather products (0.61), other wooden products (0.48), and the building construction sector (0.43), respectively. The top five employment intensities of Thailand are milled grain and flour (0.59), tires and tubes (0.37), other food products (0.33), other wooden products (0.24), and other rubber products (0.21), respectively. Top-ranking intensities in China are in timber (0.88), meat and dairy products (0.62), fish products (0.53), milled grain and flour (0.51), and other food products (0.47), respectively. It was shown that the majority of these sectors are part of the supply chain. The tobacco sector has the lowest employment intensity in the USA, Japan, South Korea, and Taiwan. The bottom-ranking employment intensities in the USA are found in tobacco (0.007), electricity and gas (0.008), drugs and medicine (0.008) and the refined petroleum sectors (0.010), respectively. In Japan, the bottom-ranking intensities are in tobacco (0.009), water supply (0.012), and electricity and gas sectors (0.013). In South Korea and Taiwan, the bottom-ranking intensity sectors are in tobacco, water supply, and refined petroleum. While, the bottom-ranking sectors of Singapore are the other transport equipment, water supply, and electricity and gas sectors. For the tertiary sector (IO code 65–76), the results show that the restaurants sector has the highest employment intensity in almost all countries except the Philippines (highest in the wholesale and retail trade sector) and Thailand (highest in the hotel sector). While, the real estate sector has the lowest intensity in Japan (0.003), USA (0.004), South Korea (0.009), Taiwan (0.012), and Singapore (0.026). The finance and insurance sector is the lowest in USA (0.008), Japan (0.011), and Korea (0.013).

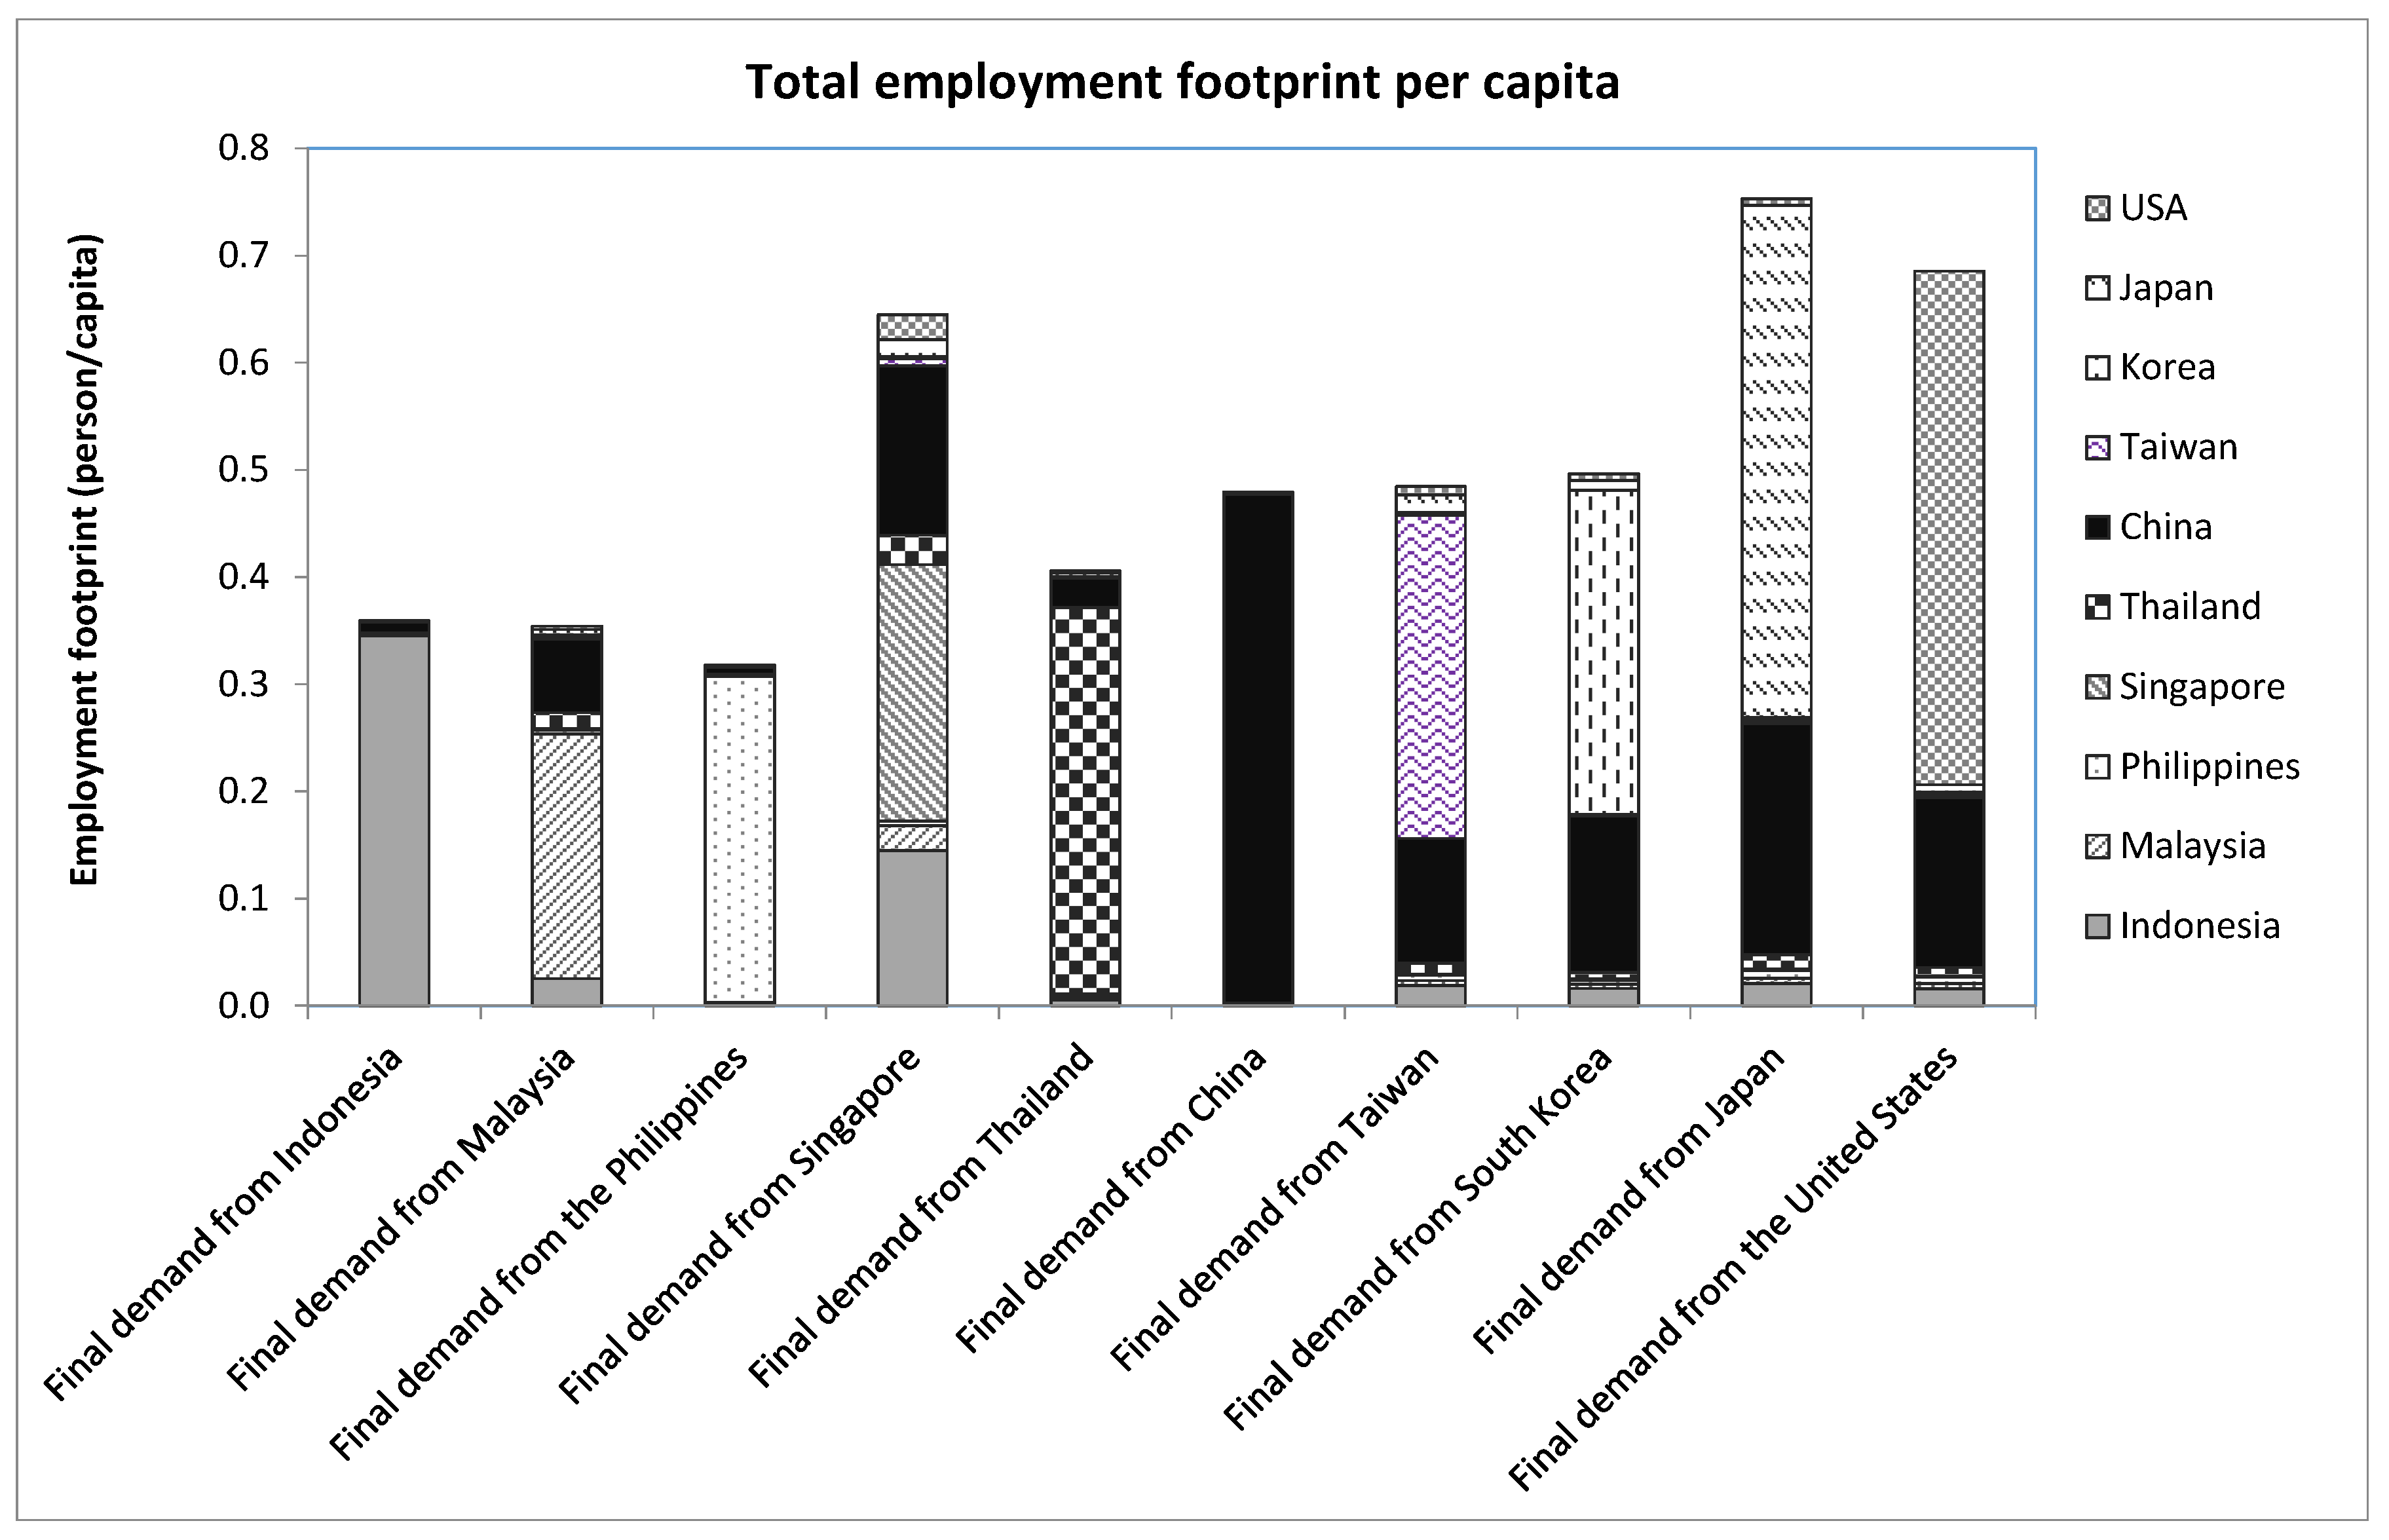
3.1.2. Employment Footprint per Capita
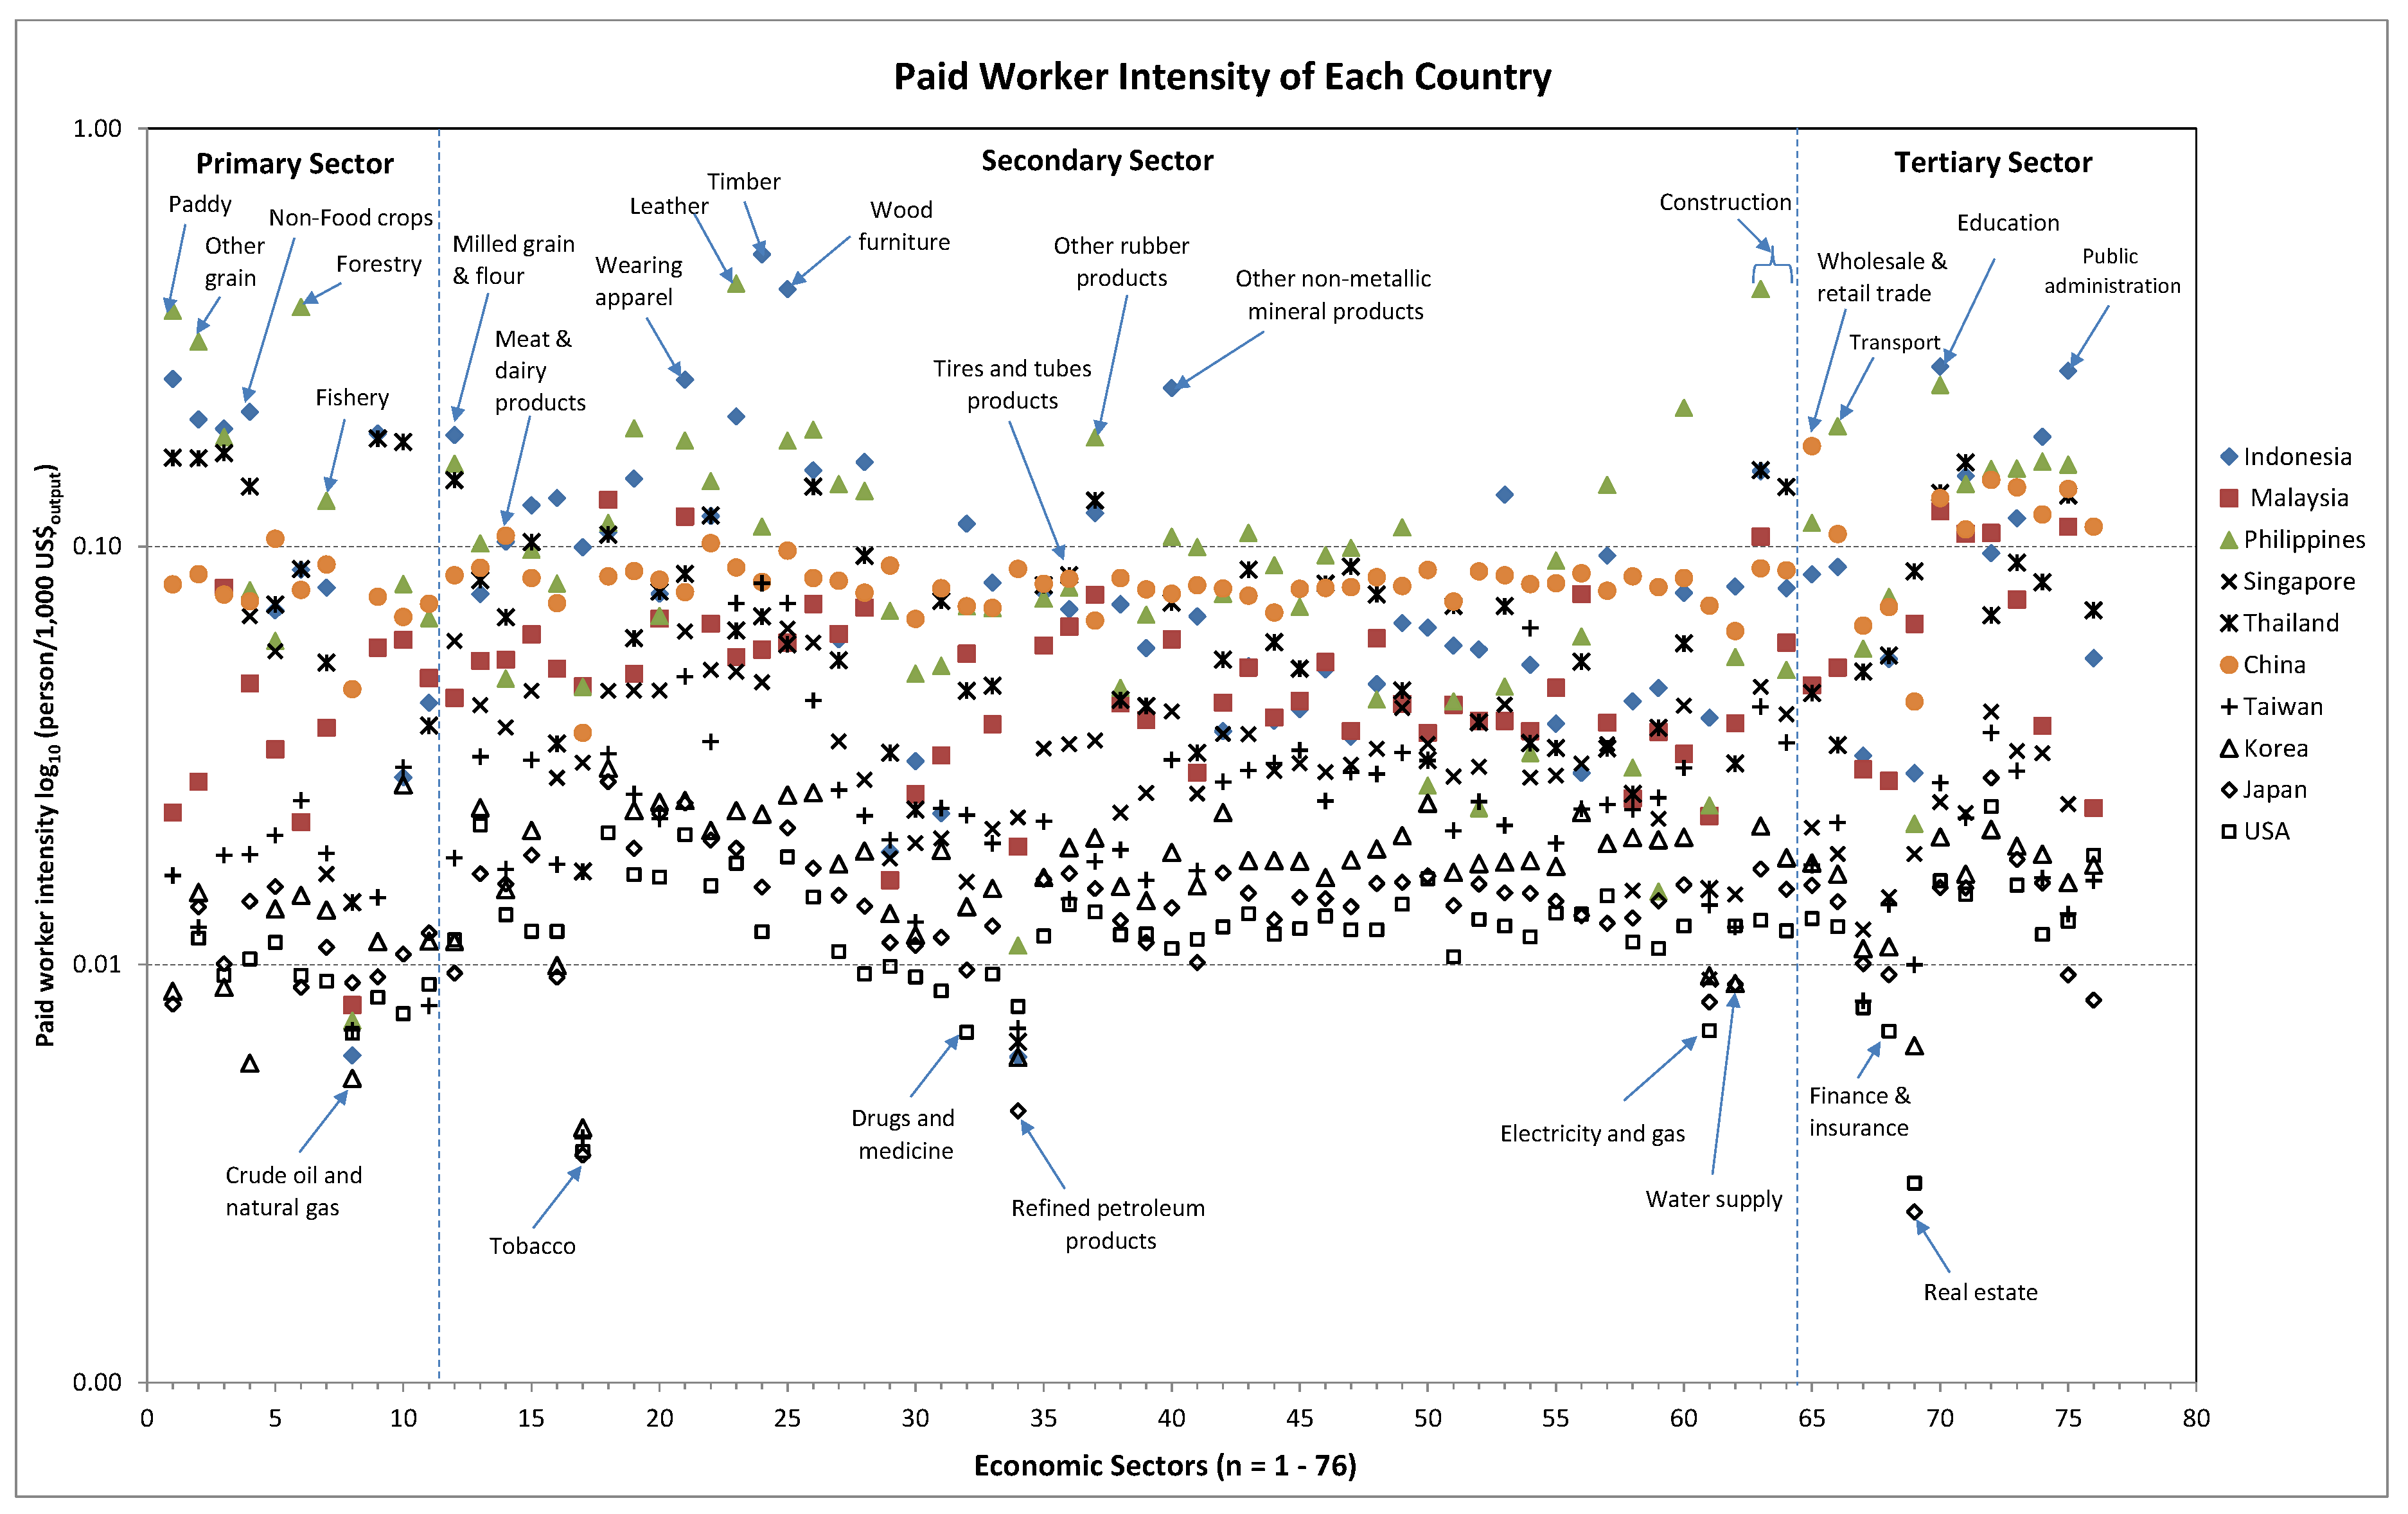
Figure 2 offers a breakdown of the share of the total employment footprint from final demand per capita for each country. These are presented for imported products and goods produced domestically. The share of employment footprint is usually highest for domestic production in China, Thailand, Malaysia, Indonesia, and the Philippines, while China is always highest for imports into the USA, Japan, Singapore, Korea, and Taiwan. The developed countries (USA and Japan) dominate the top-ranking master country positions, whereas the richest Asian countries (South Korea, Taiwan, and Singapore) dominate the medium-ranking master countries. To satisfy consumption, each American requires seven-tenths of one worker to sustain their lifestyle. This consists of domestic workers (70%) and foreign workers (30%). In total, 77% of the imports’ workforce is from China. Each Japanese citizen needs eight-tenths of one worker to preserve their standard of living, which comes from the domestic (63%) and foreign workforce (37%). The imported workforce from China was estimated at 78% of total imports. Each person in Singapore needs six-tenths of one worker to maintain their lifestyle, which comes from the domestic workforce (37%) and foreign workforce (63%). The imported workforce from China and Indonesia was estimated at 39% and 36% of total imports, respectively. Meanwhile, each person in South Korea, Taiwan, and China require half of one full-time worker to sustain their lifestyles. Sixty percent of workers in South Korea and Taiwan can support their final consumption, whereas 99% of the workers in China can support their consumption. Each Thai person needs only four tenths of one full-time worker to sustain their lifestyle, consisting of domestic workers (89%) and foreign workers (11%). While, each one in Indonesia, Malaysia, and the Philippines needs only one-third of one full-time worker to support their final consumption. Based on these results, it shows that the Chinese worker is largely engaged in exports, but their exports do not generate jobs in other countries.

3.2. Paid Worker

3.2.1. Paid Worker Intensity

Paid worker intensity is measured through employee input in terms of person-year per 1000 US$ output of 10 countries within 76 industrial sectors is presented in Figure 3. For middle-income countries (Thailand, Indonesia, and the Philippines, except China and Malaysia), the paid worker intensity in the agricultural crops sectors is higher than for other sectors. Agriculture cultivation in a developing country is labor intensive and of low economic value, whereas, in high-income countries (USA, Japan, Korea, Singapore, and Taiwan), the tertiary sector has a higher paid worker intensity than in the secondary and primary sectors, respectively. Top-ranking paid worker intensity in developing countries include the Philippines, Indonesia, China, Thailand, and Malaysia, respectively. Whereas, bottom-ranking paid worker intensity occurs in the high-income countries (USA, Japan, Korea, Taiwan, and Singapore, respectively).
When considering the primary sector (IO code 1–11), the paid employment intensity of the forestry (0.37), paddy (0.35), and other grain (0.30) sector is highest in the Philippines, whereas in Indonesia the highest is in the paddy (0.25), non-food crops (0.21), and other grain (0.20) sectors, respectively. For the livestock sector (IO code 5), paid worker intensity is highest in China (0.10) and Thailand (0.07), while the paid worker intensity of the iron mining sectors (IO code 9) is highest in Indonesia (0.185), and Thailand (0.176). The lowest paid employment intensity can be found in the crude oil and natural gas sectors (IO code 8) in all countries.
When considering the paid employment intensity of the secondary sector (IO code 12–64), the results showed that the timber sector (0.49) is the highest in Indonesia, whereas in the Philippines, it can be found in the leather products sector (0.40). The milled grain and flour sector is the highest in Indonesia (0.19), the Philippines (0.15), and Thailand (0.14), whereas the meat and dairy products sector it is the highest in China (0.11), Indonesia (0.10), and Thailand (0.07). Top-ranking paid employment intensity of Indonesia can be found in the timber (0.49), wooden furniture (0.41), wearing apparel (0.24), other non-metallic mineral products (0.23), and leather products (0.20) sectors, respectively. In Malaysia, the top three paid worker intensity sectors are the spinning (IO code 18), wearing apparel (IO code 21), and the building construction (IO code 63) sectors, respectively. Top-ranking intensities in the Philippines can be found in the leather and leather products (0.40), building construction (0.38), and other rubber products (0.17) sectors, respectively. The top three paid employment intensities in Thailand can be found in the building construction (0.14), milled grain and flour (0.14), and other rubber products (0.13) sectors, respectively. The top-ranking paid worker intensity in China is in the meat products and dairy products (0.11), wearing apparel (0.10), wooden furniture (0.10), and leather products (0.09) sectors, respectively. The majority of these sectors employ paid workers in the supply chain. While, the paid worker intensity for the tobacco sector is the lowest in USA, Japan, South Korea, and Taiwan. The bottom-ranked paid employment intensity of USA is the tobacco (0.004), electricity and gas (0.007), drugs and medicine (0.007), and refined petroleum (0.008) sectors, respectively. In Japan, the bottom-ranking intensities are found in the tobacco (0.004), refined petroleum (0.009), water supply (0.009), and electricity and gas (0.009) sectors. The bottom-ranked paid worker intensities in South Korea are in the tobacco (0.004), water supply (0.009), refined petroleum (0.011), and electricity and gas (0.012) sectors. The bottom-ranking intensities of Taiwan are in the tobacco (0.004), refined petroleum (0.012), and water supply (0.013) sectors, whereas for Singapore it is the electricity and gas (0.011) and water supply (0.015) sectors, respectively.
For the tertiary sector (IO code 65–76), the results showed that the education and research sector has the highest paid employment intensity in Indonesia (0.26), the Philippines (0.24), Thailand (0.13) and China (0.13) whereas the transport sector has the highest intensity in the Philippines (0.18), China (0.11) and Indonesia (0.09). The paid employment intensity of China is the highest in the wholesale and retail trade sector (0.17). While, the real estate sector has the lowest intensity in Japan (0.0026), USA (0.0030), and South Korea (0.0065). The finance and insurance sector is the lowest in USA (0.007), Japan (0.010), Korea (0.011), Taiwan (0.014), and Singapore (0.016).

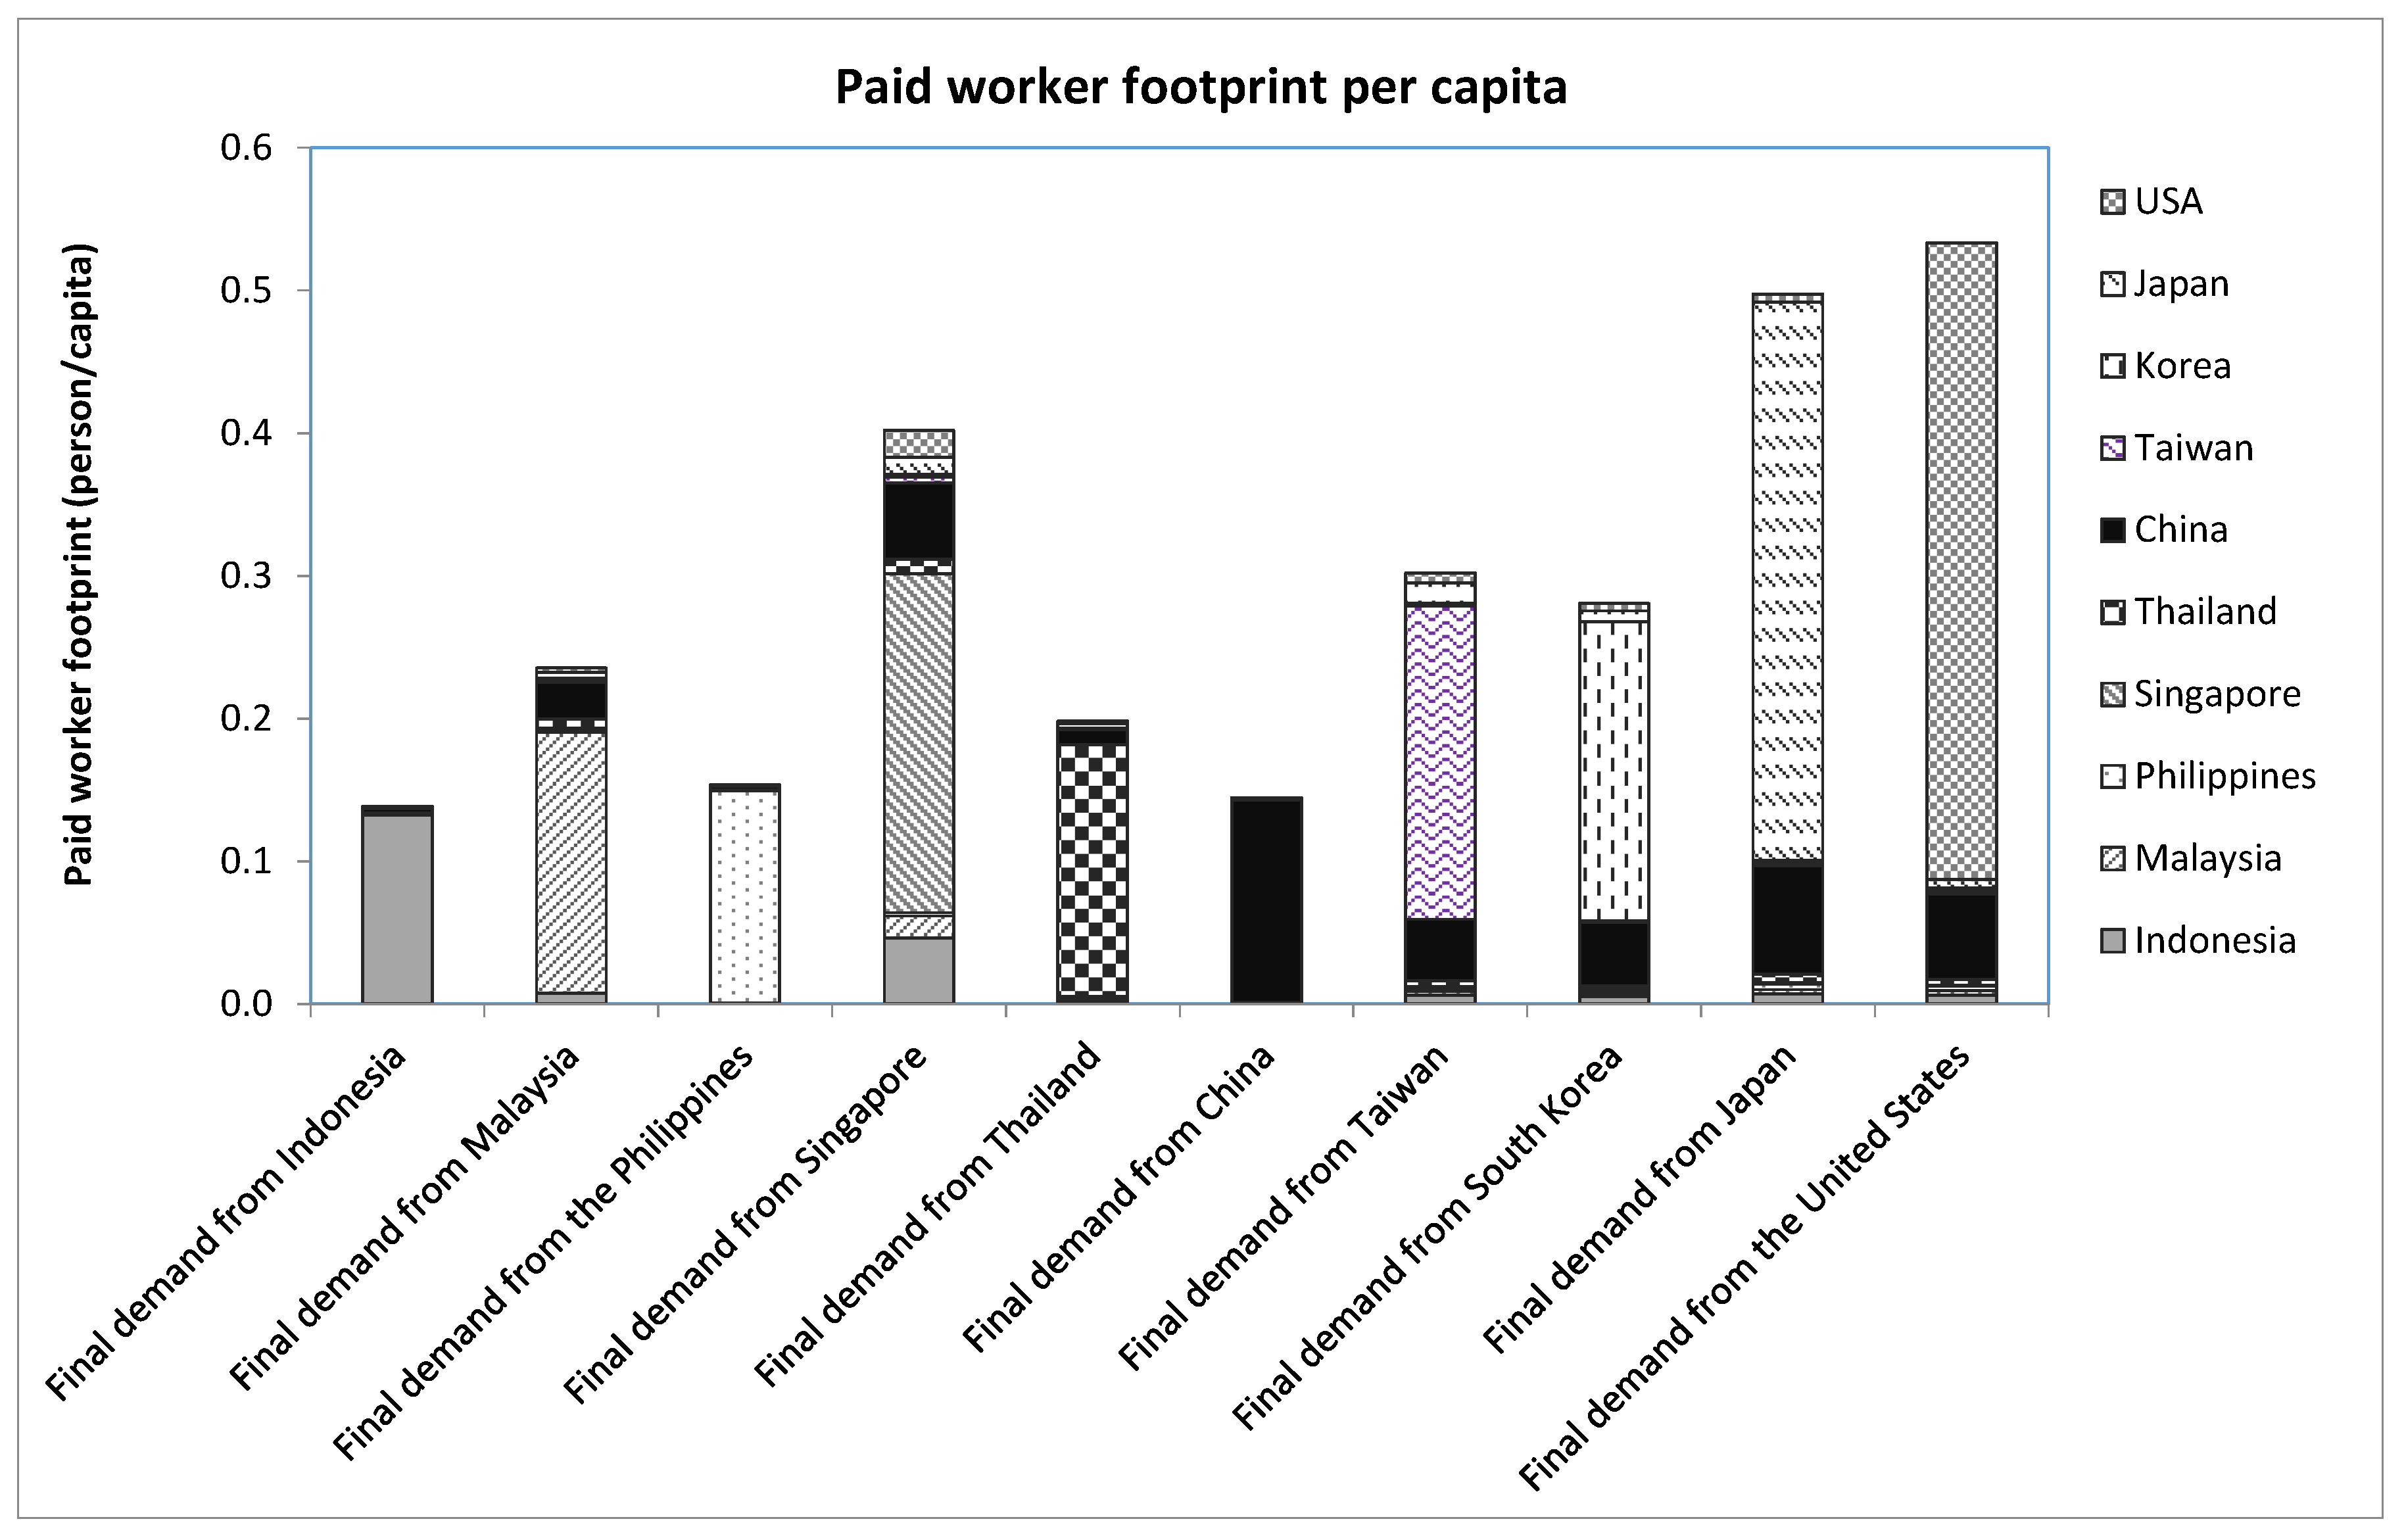
3.2.2. Paid Worker Footprint per Capita

Figure 4 provides a breakdown of the share of the paid employment footprint from final demand per capita for each country. This demonstrates the extent of paid workers involved in the production of imported goods and products manufactured domestically in each country. The share of paid workers in the footprint is usually dominated by domestic production in all countries. However, China always has the highest share of imports into USA, Japan, Singapore, South Korea, and Taiwan.
To satisfy its level of consumption, each person in the USA and Japan need a half of one full-time worker to maintain their living, which comprises of domestic paid workers (80%) and overseas workers (20%). However, 70% of the paid workers of imported products are from China. Each person in Singapore needs four-tenths of one full-time worker to support their lifestyle, which comes from domestic paid workers (56%) and overseas paid workers (44%). The imports from China and Indonesia were estimated at 30% and 31% of total imports, respectively. While, each person in South Korea and Taiwan requires three-tenths of one full-time worker to sustain their lifestyle. Seventy percent of paid workers in South Korea and Taiwan can support their final consumption. Each person in Thailand and Malaysia needs only two-tenths of one full-time worker to maintain their lifestyle, whereby 89% and 76% of this share are domestic paid workers for Thailand and Malaysia, respectively. Whereas, each person in China, Indonesia, and the Philippines requires only one-tenth of one full-time worker to support their final consumption.

3.3. Vulnerable Employment

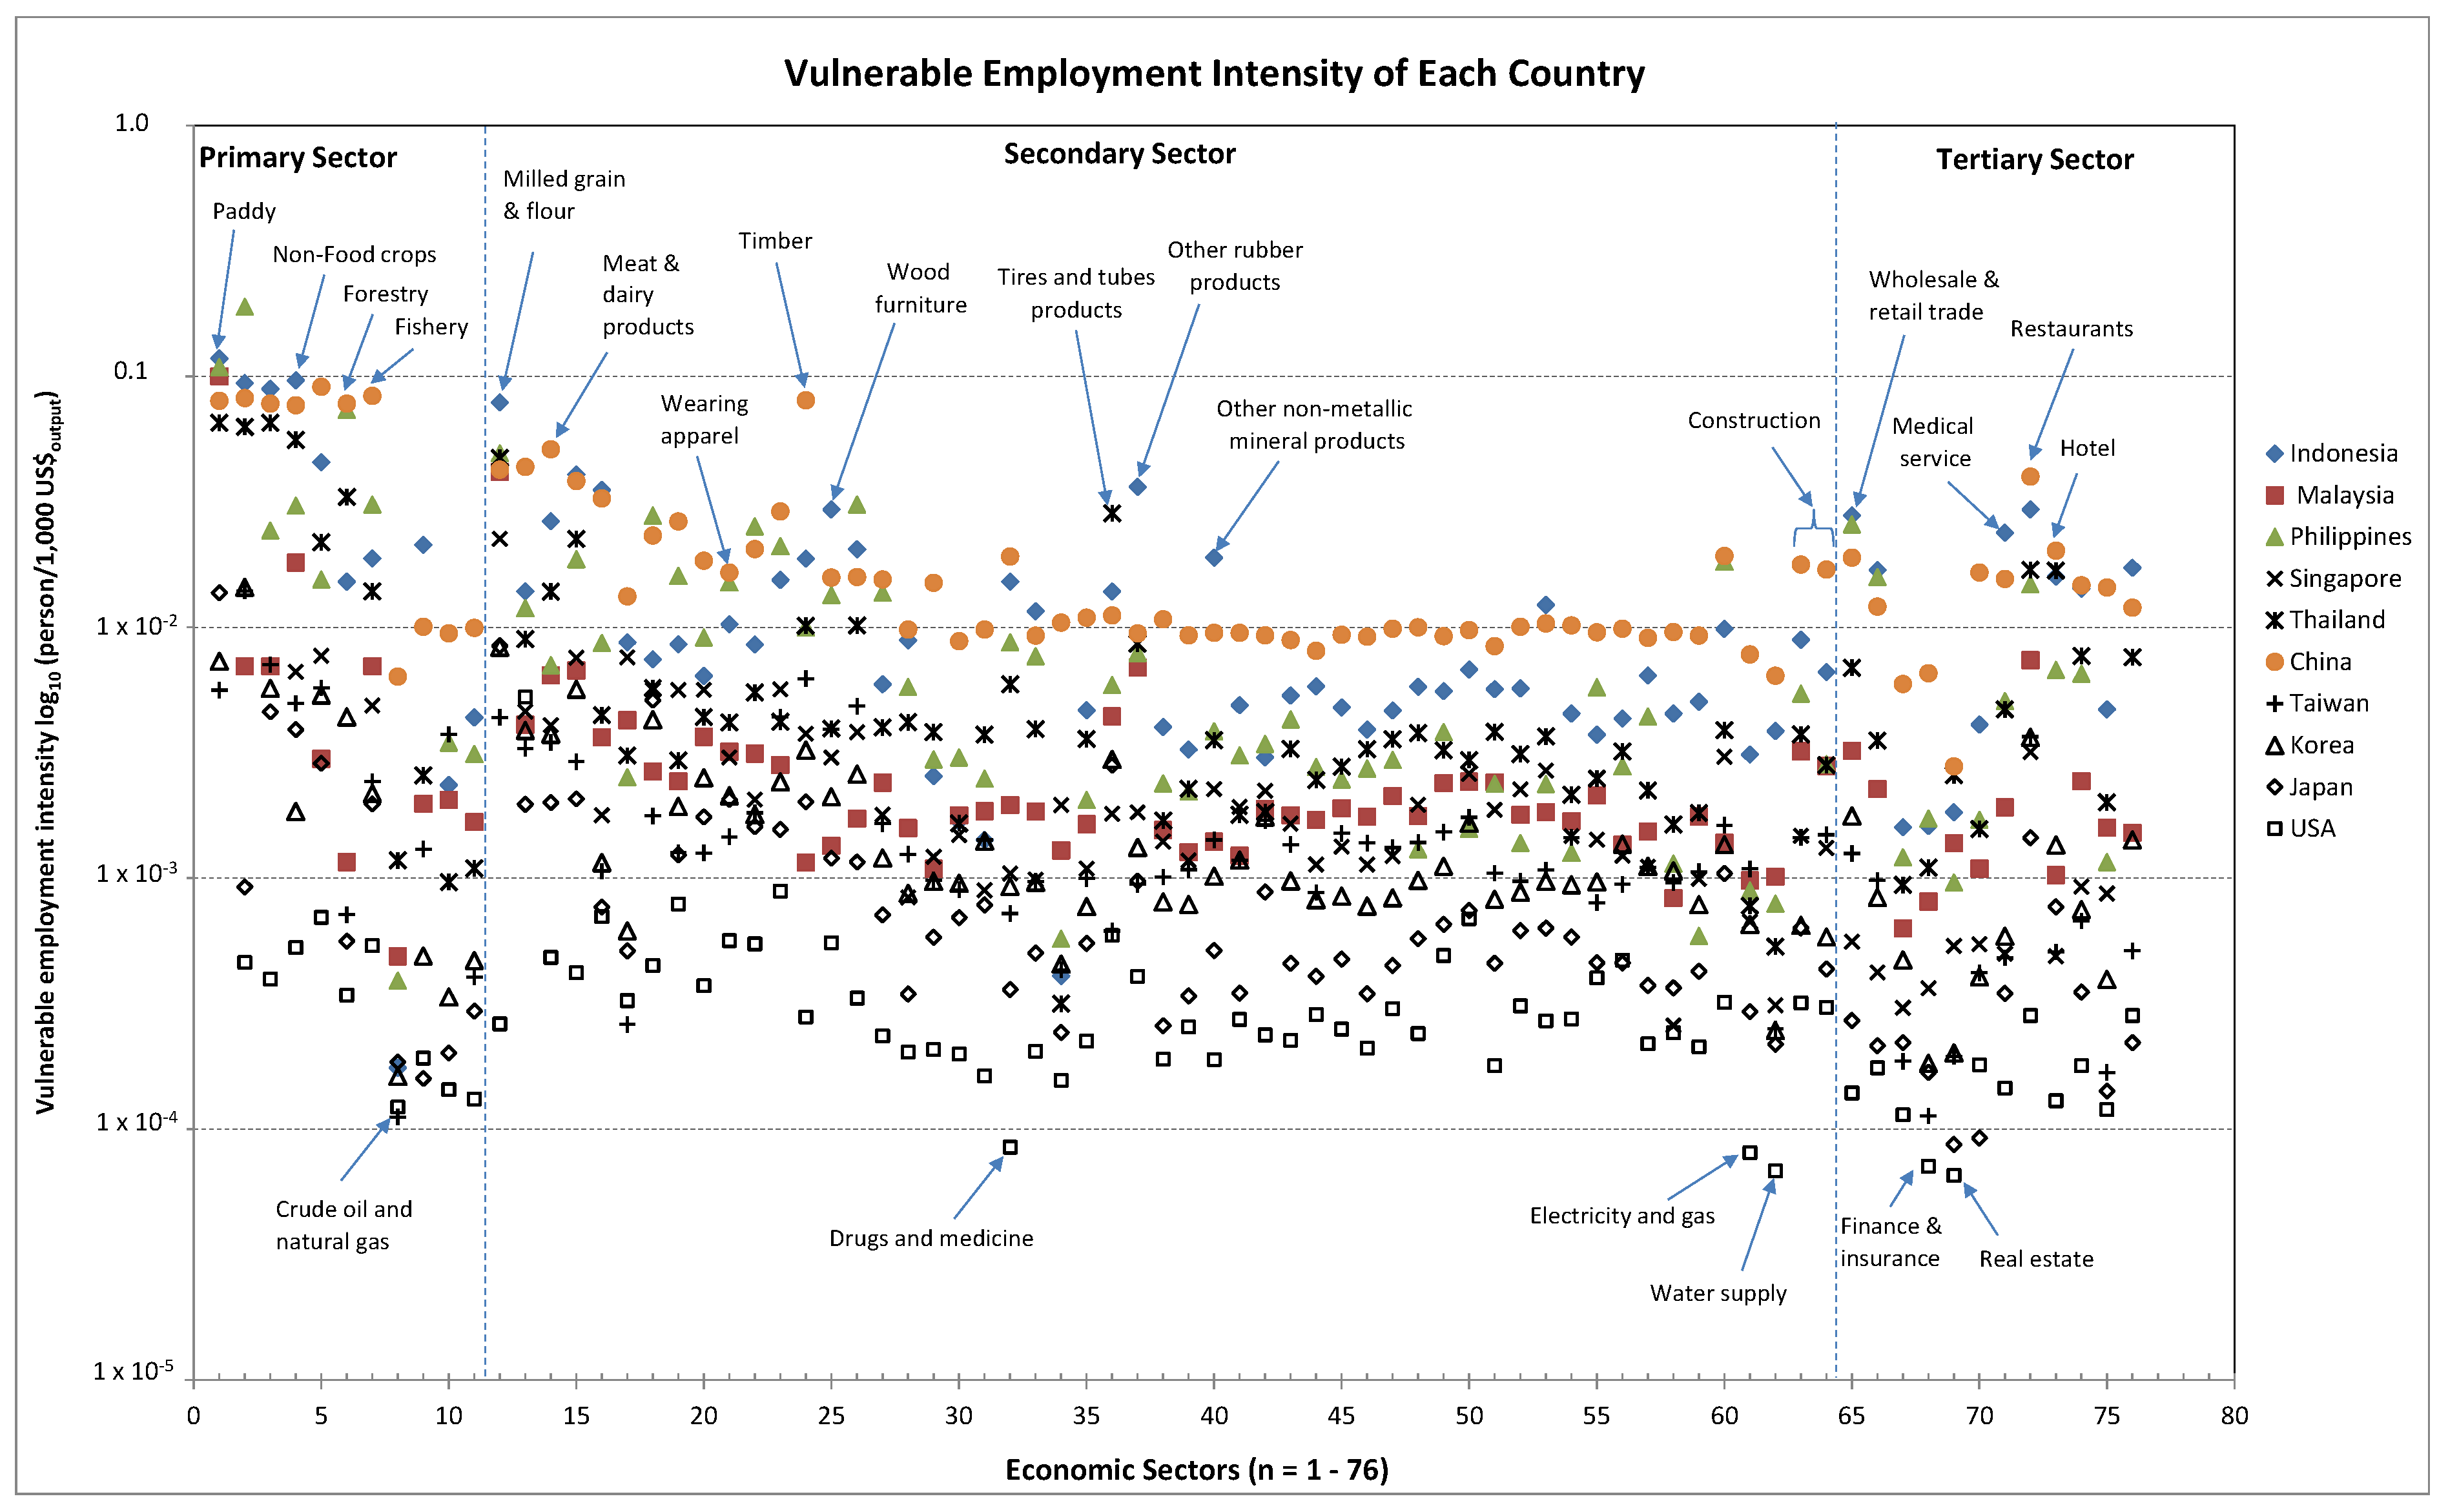
3.3.1. Vulnerable Employment Intensity

Vulnerable employment is calculated as the sum of own-account workers and unpaid family workers. Many vulnerable workers suffer because they do not legally count as employees and are therefore without social security. Vulnerable employment intensity is expressed in terms of person-year per 1000 US$ output of 10 countries with 76 industrial sectors, and is shown in Figure 5. Vulnerable employment intensity is measured based on economic production and consumption. This is particularly high for China, Indonesia, the Philippines, and Thailand, due to their high levels of informal labor, especially in the agriculture sector. Developed countries (USA and Japan) have very low levels of vulnerable employment intensity, whereas, medium level vulnerable employment intensity is found in Malaysia, Singapore, Taiwan, and South Korea, respectively.
When considering the primary sector (IO code 1–11), the vulnerable employment intensity of developing countries is the highest in the paddy sector of Indonesia (1.17), the Philippines (1.04) and Malaysia (0.97), whereas, the non-food crops sector has the highest intensity in Indonesia (0.96), China (0.76), and Thailand (0.55). While, the vulnerable worker intensity of the forestry sector is the highest in China (0.77), the Philippines (0.73), and Thailand (0.33). The lowest vulnerable employment intensity can be found in the crude oil and natural gas sector in almost all countries. However, the vulnerable worker intensity of developed countries (USA and Japan) and the richest Asian countries (Singapore, Taiwan, and South Korea) is lower than that of developing countries.
When considering the vulnerable employment intensity of the secondary sector (IO code 12–64), the results showed that the milled grain and flour sector has the highest intensity of vulnerable workers in most countries except China (highest in the timber sector), Taiwan (highest in the timber sector), and USA (fish products sector, IO code 13). The top three vulnerable employment intensities of Indonesia can be found in the milled grain and flour (0.79), other rubber products (0.37), and wooden furniture (0.29) sectors, respectively. For Malaysia, the top-ranked vulnerable worker intensities are in the milled grain and flour (0.43), other rubber products (0.07), and meat products and dairy products (0.07) sectors, respectively. Top-ranking vulnerable worker intensities of the Philippines can be found in the milled grain and flour (IO code 12), other wooden products (IO code 26), spinning (IO code 18), other made-up textile products (IO code 22), and leather products sectors (IO code 23), respectively. In Thailand, the top five vulnerable employment intensities are in the milled grain and flour (0.45), tires and tubes (0.23), other food products (0.23), meat and dairy products (0.14), and timber sectors (0.11), respectively. Top-ranking vulnerable worker intensities in China are found in the timber (0.80), meat and dairy products (0.51), fish products (0.43), and milled grain and flour (0.43) sectors, respectively. It was shown that the majority of these sectors are made up of vulnerable workers in their supply chains. However, the vulnerable worker intensity of the USA is the lowest, followed by Japan and South Korea.
For the tertiary sector (IO code 65–76), the results showed that the restaurant sector has the highest vulnerable employment intensity in almost all countries except for the Philippines (highest in the wholesale and retail trade sector). While, the real estate sector had the lowest vulnerable worker intensity in USA, Japan, South Korea, and Taiwan.

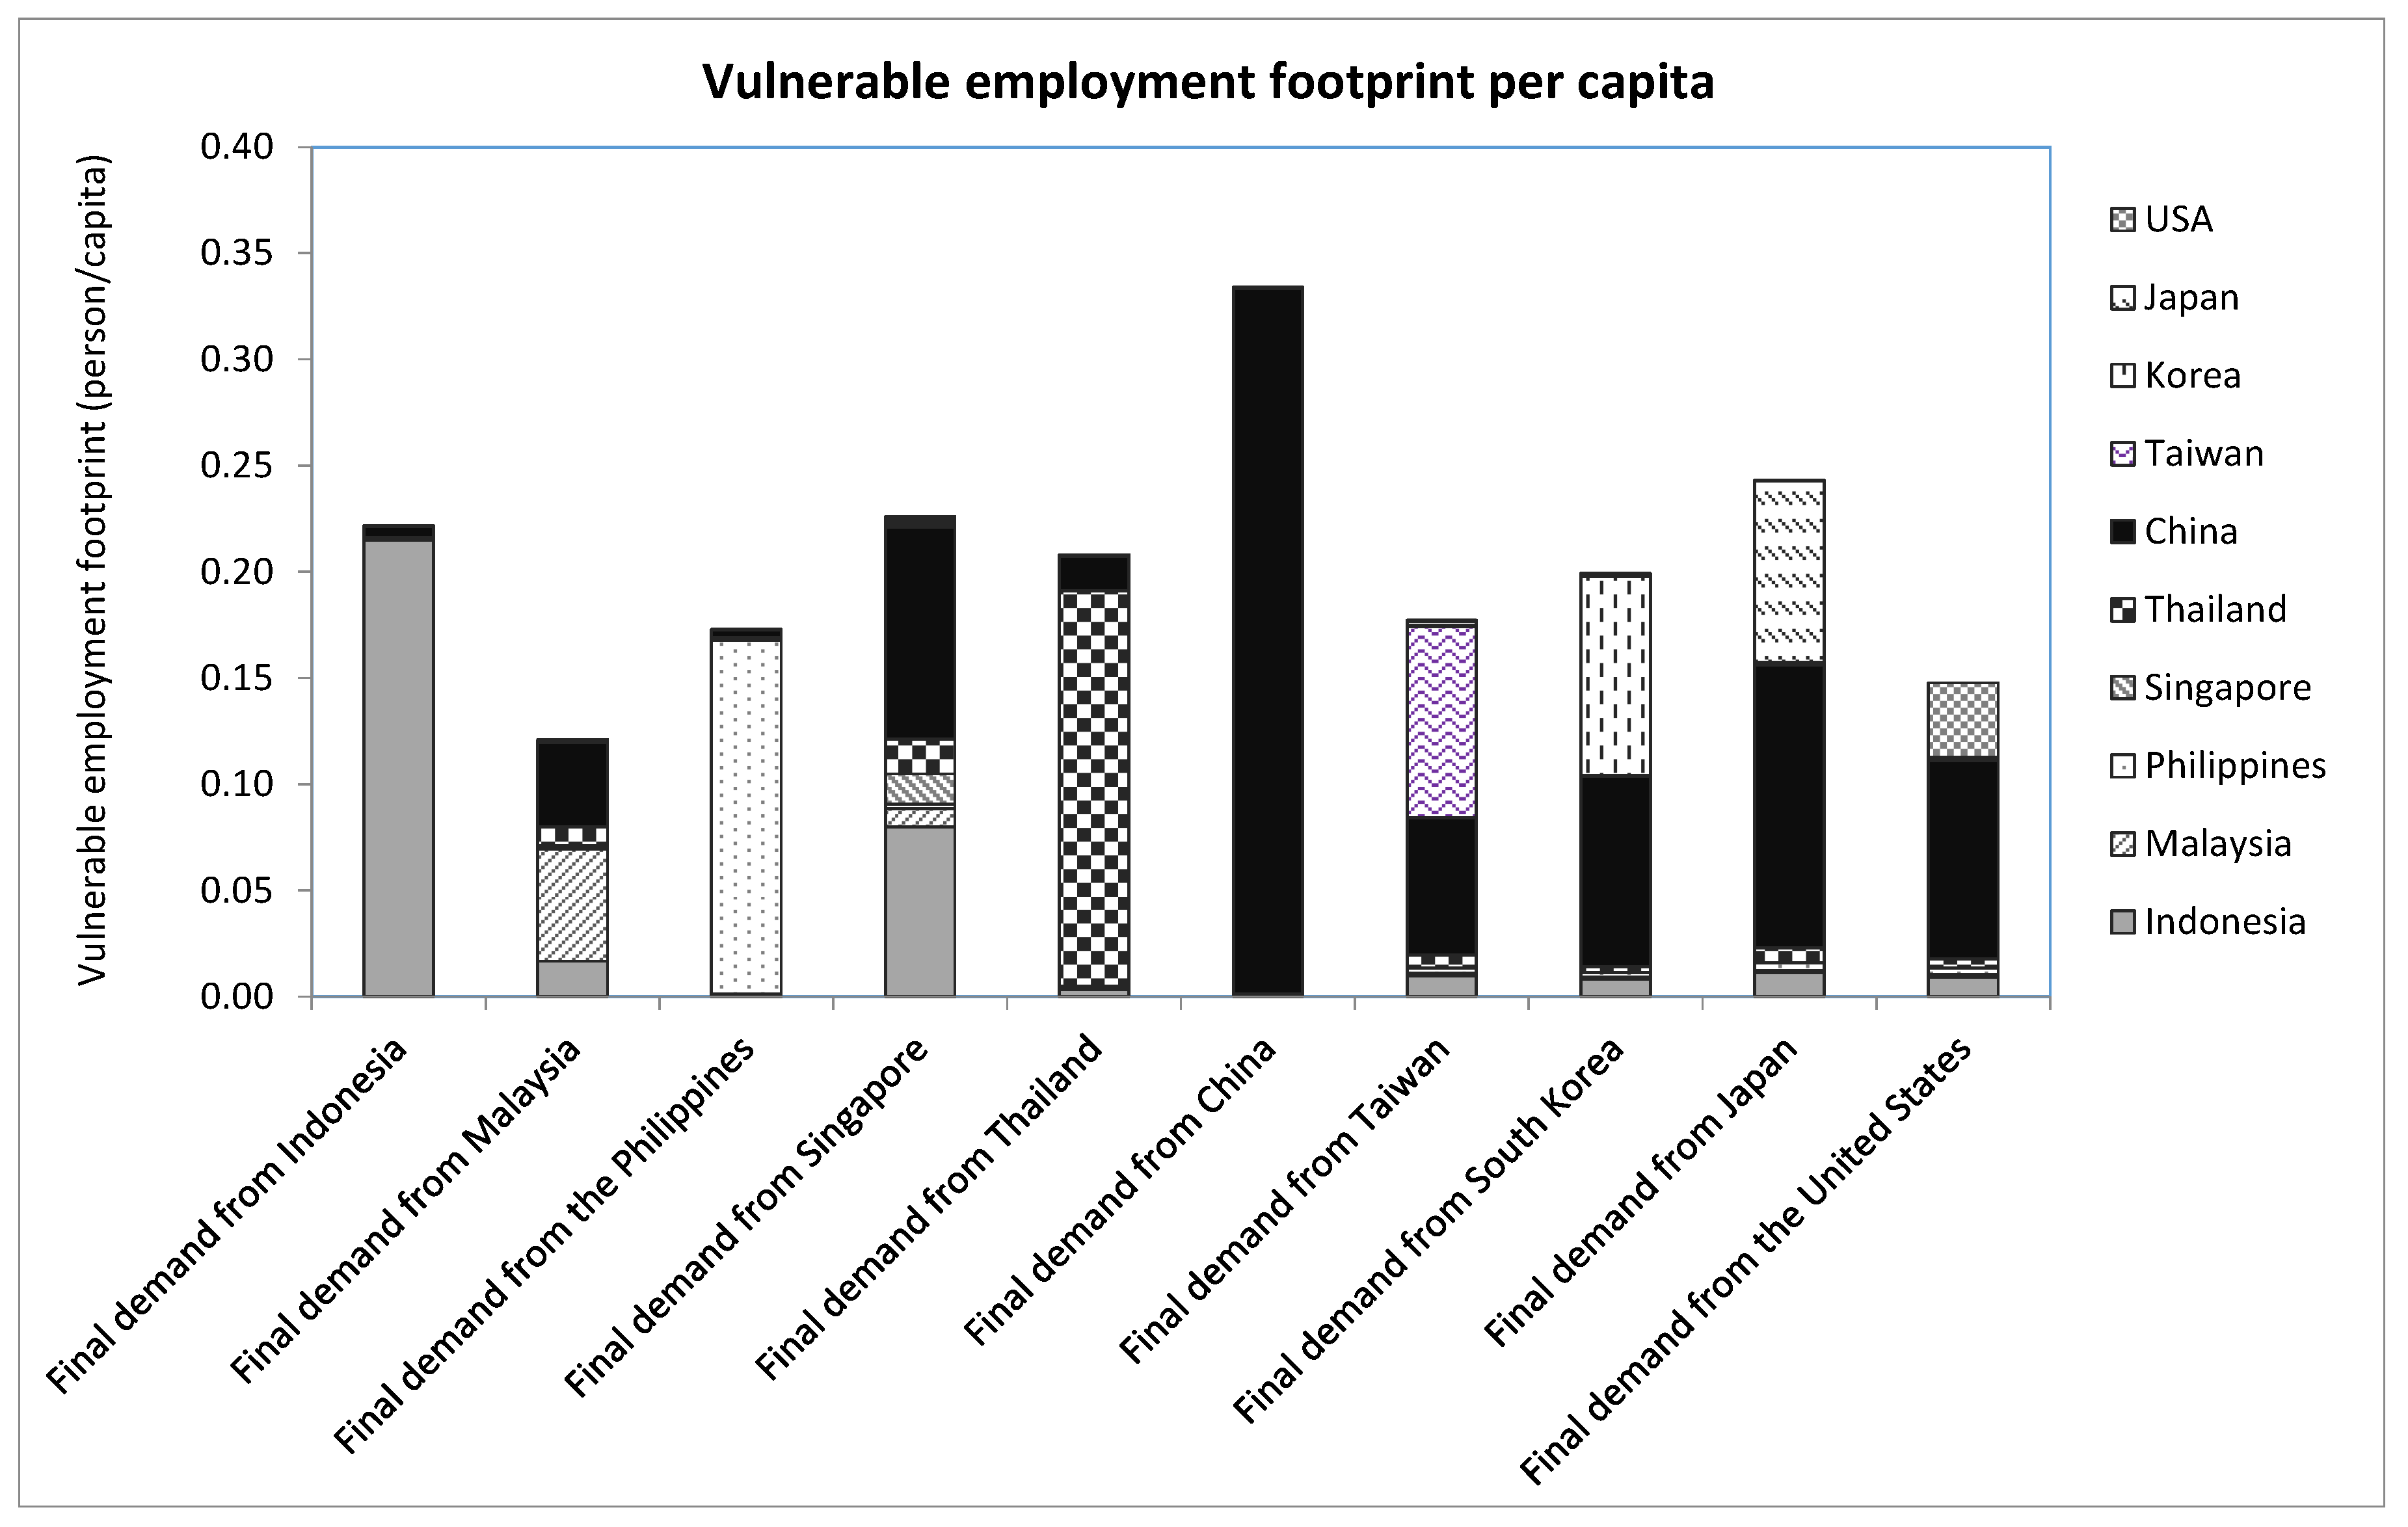
3.3.2. Vulnerable Employment Footprint per Capita

Figure 6 shows the results of the vulnerable employment footprint per capita of 10 countries. The results show that the USA, Japan, Korea, Taiwan, Singapore, and Malaysia have lower vulnerable employment footprints in domestically-traded goods than that of imports to those countries. While, Indonesia, the Philippines, China, and Thailand present the highest vulnerable employment footprint in domestically-traded goods.
The vulnerable employment footprints are associated with intra-country trade and, as a result, the majority of vulnerable employment footprints is associated with exchanges of goods and services from the developing countries to developed countries; imports from China to USA and Japan correspond to more than half of all vulnerable employment in inter-country trade. These trades are also responsible for over 63% and 55% of vulnerable employment, respectively. While, imports from Thailand, Indonesia, and the Philippines to these developed countries, however, account for only 1%–6% of total vulnerable employment in inter-country trade. Imports from China to Korea, Singapore, Taiwan, and Malaysia correspond to 45%, 44%, 36%, and 33% of all vulnerable employment embodied in inter-country trade, respectively.

3.4. Wages

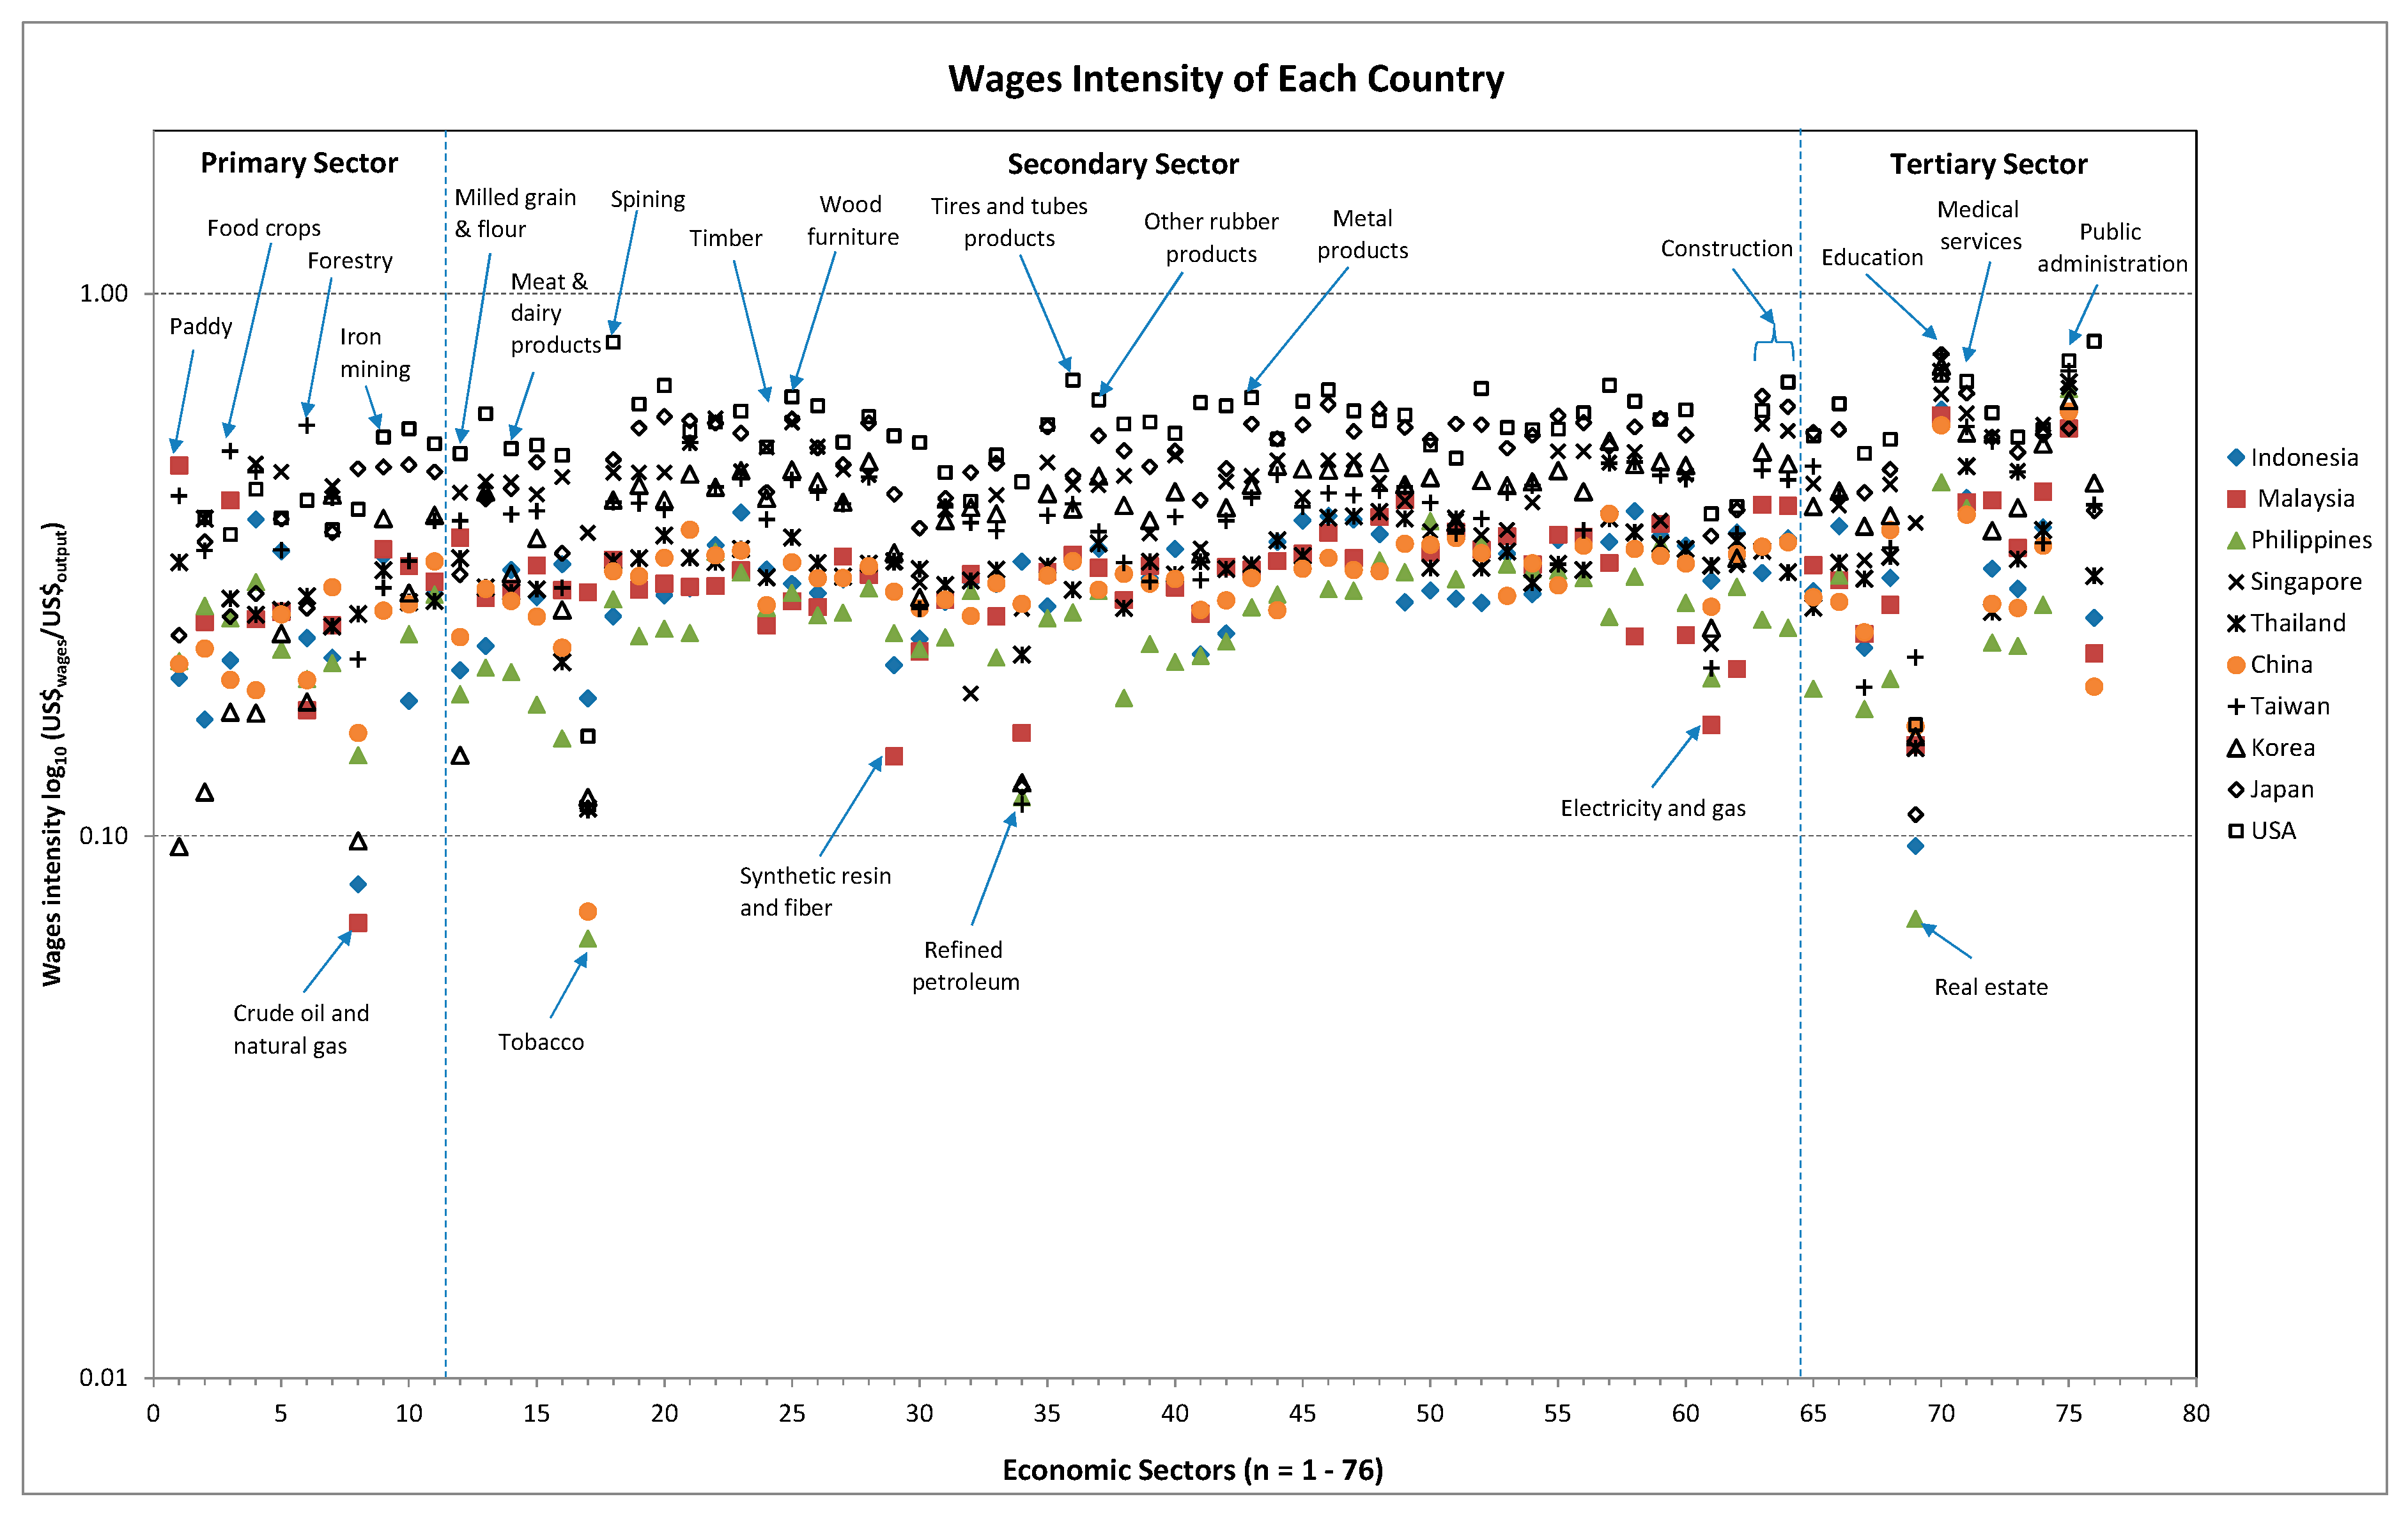
3.4.1. Wages Intensity

The IO table provides information on the average compensation paid to employees. The average wages of employees are different in each economic sector. Wages are a part of the production costs of each industrial sector. Thus, if a component of the production of any sector is used as an input for the production of other sectors, its increases wages affecting the production costs in other sectors as well.
The wages intensity measured in terms of one US$ wage per one US$ output of 10 countries with 76 economic sectors is given in Figure 7. The developed countries (USA and Japan) have a greater wage intensity than that of emerging and developing countries (Indonesia, the Philippines, Thailand, China, and Malaysia) in almost all economic sectors. The higher wages intensity in the developed countries was due to those countries with higher wages rates. While, the richest Asian countries (South Korea, Taiwan, and Singapore) have higher wages intensities than developing countries but lower wage intensities than the developed countries. When comparing each economic sector, the results show that the education and research sector in all countries has the greatest wages intensity, followed by public administration and the medical and health service sectors, respectively.

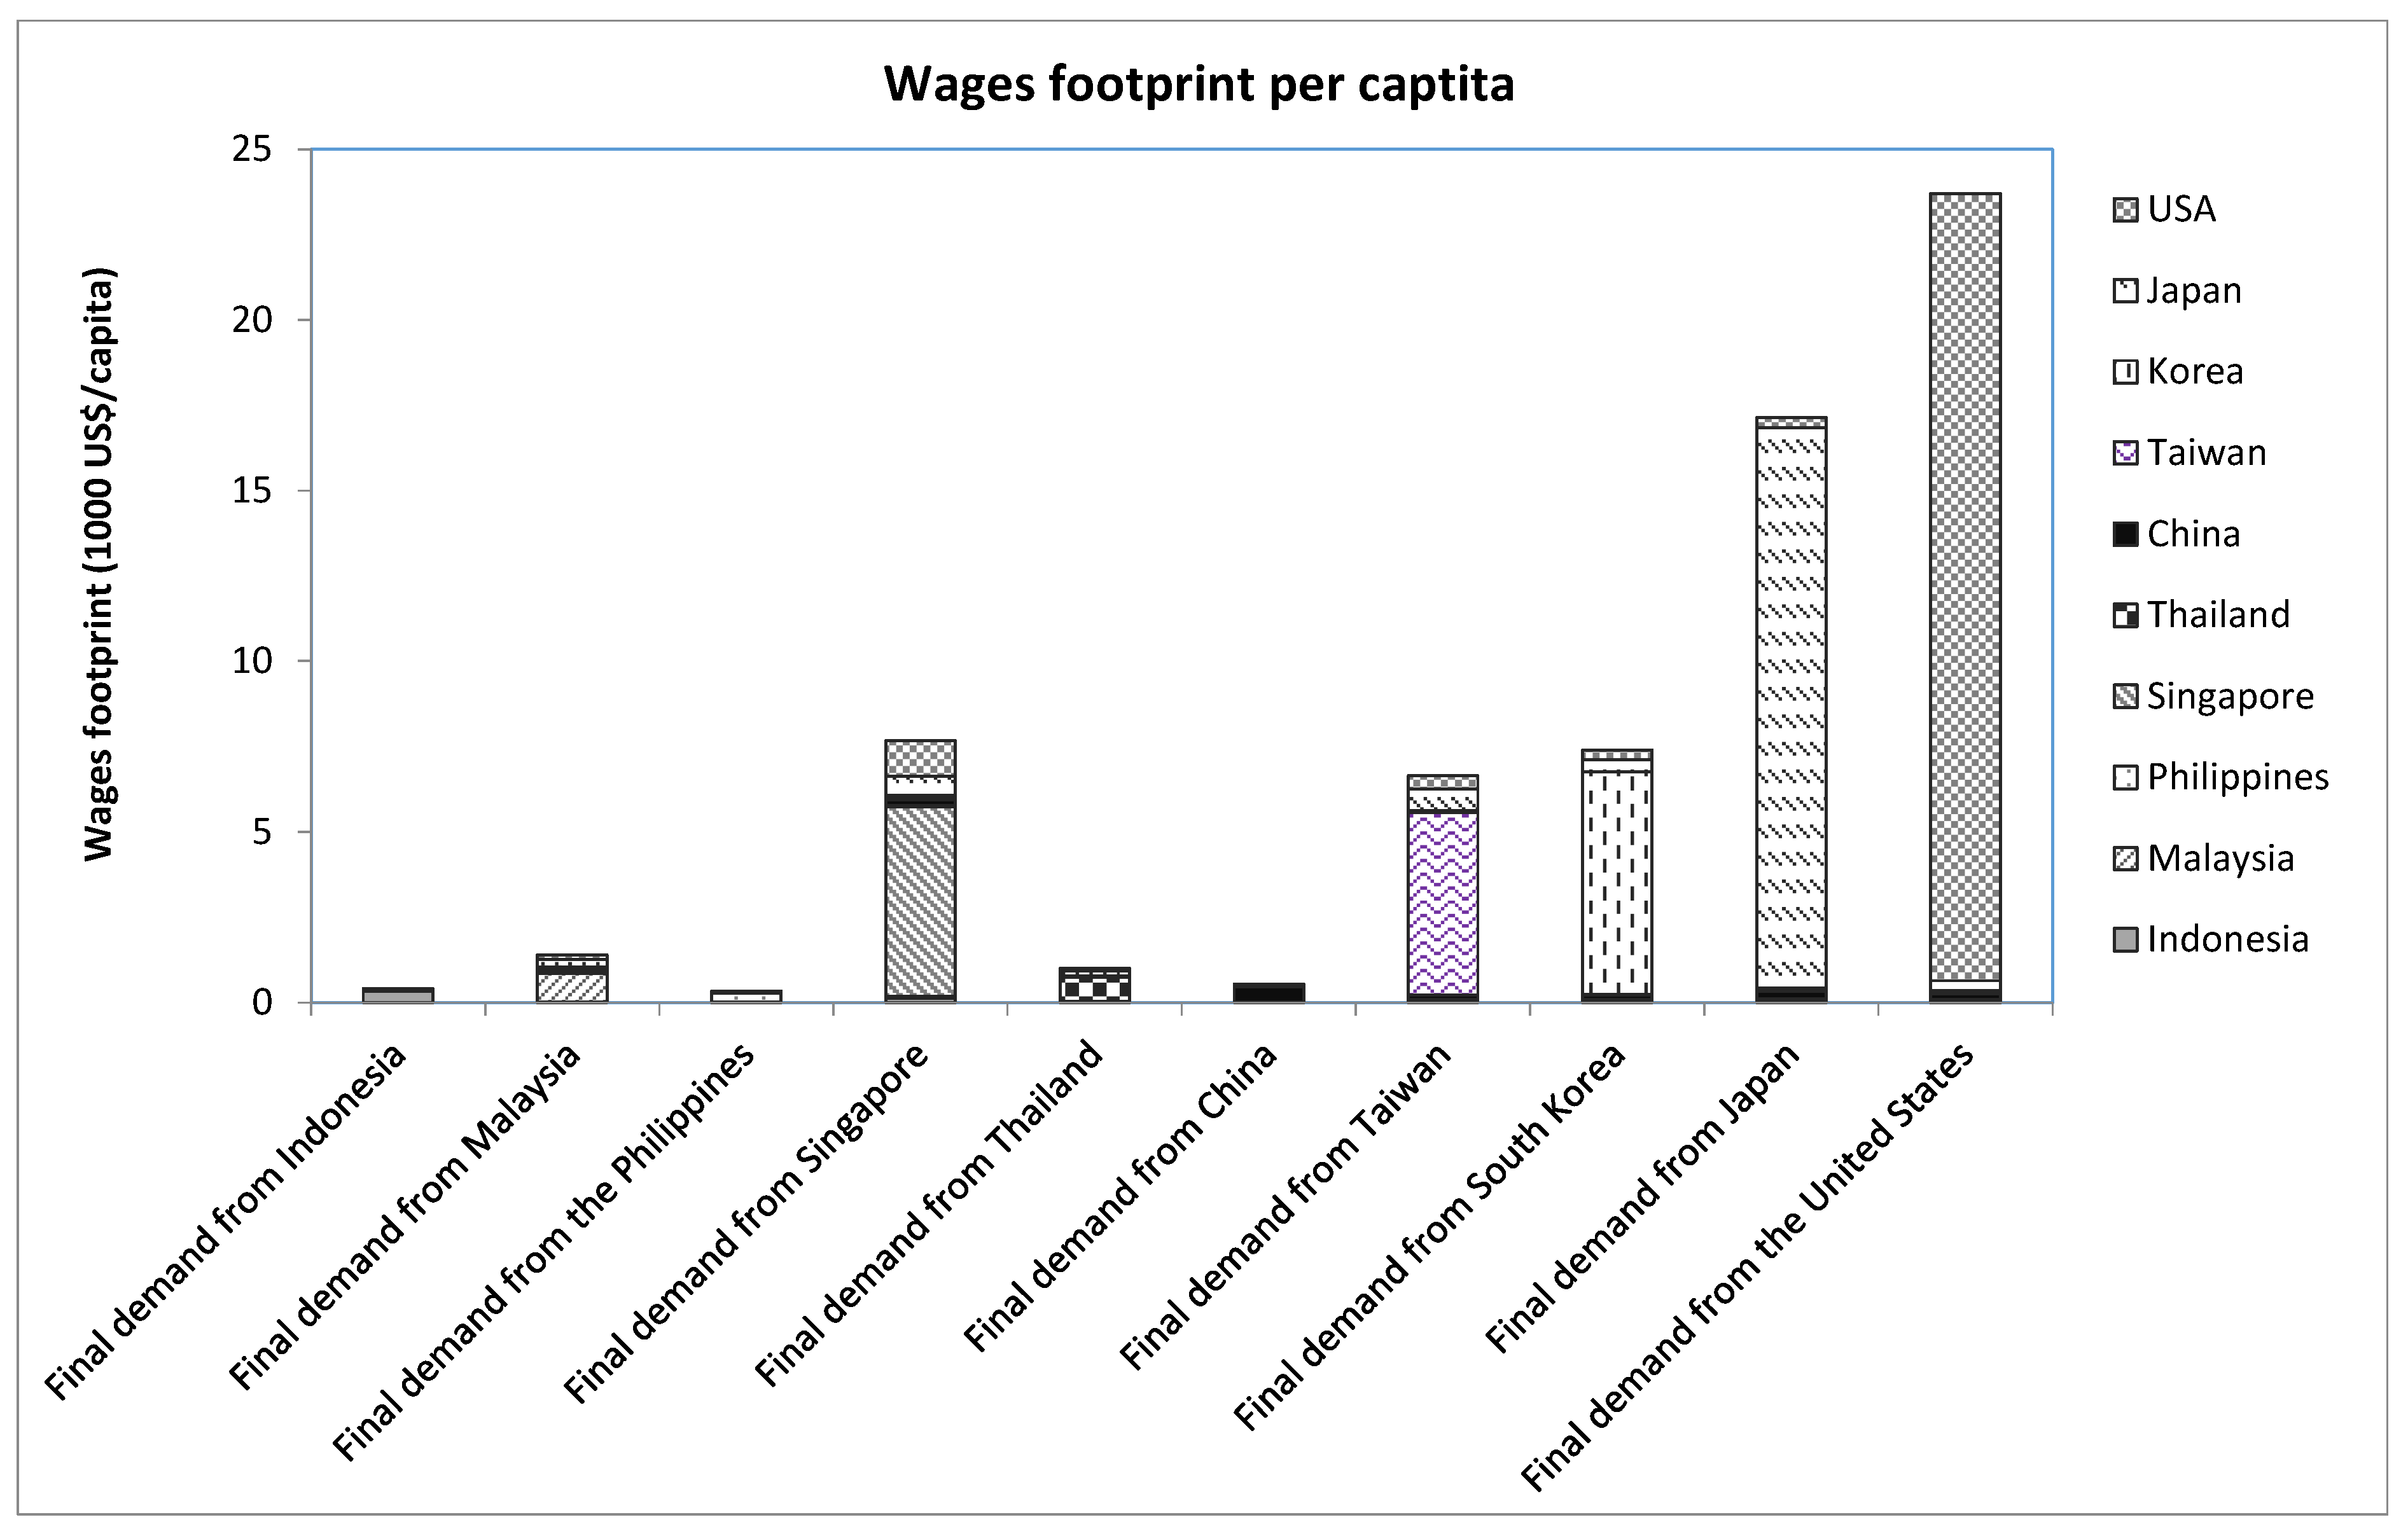
3.4.2. Wages Footprint per Capita

Figure 8 presents the results of the wages footprint per capita based on the final consumption of 10 Asian countries. The result showed that the USA has the highest wage footprint per capita, followed by Japan, Singapore, South Korea, and Taiwan. On the other hand, the Philippines has the lowest wage footprint per capita, followed by Indonesia, China, Thailand, and Malaysia. If we consider the case of Thailand, the wages footprint is approximately 1003 US Dollar per person, whereas USA’s and Japan’s generated wages footprints are estimated at about 23.6 and 17.1 times that of Thai people, respectively.
The domestic and overseas workers can be seen to support domestic consumption and standards of living. Lower paid workers produce goods and services throughout supply chains for more wealthy countries. China is a major exporter of labor to the USA. Based on a wage rate in 2005 of China of about US $2200/person/year [42,43], it takes approximately 1 million full-time equivalent (FTE) workers to generate US $2200 million of income. When comparing Japan as an exporter of labor to the USA, the same number of employees generated an income of US $35000 million (a wage rate of Japan about US $35,000/person/year) [44,45]. Thus, Japanese employees generated an income estimated at 16 times of Chinese employees.

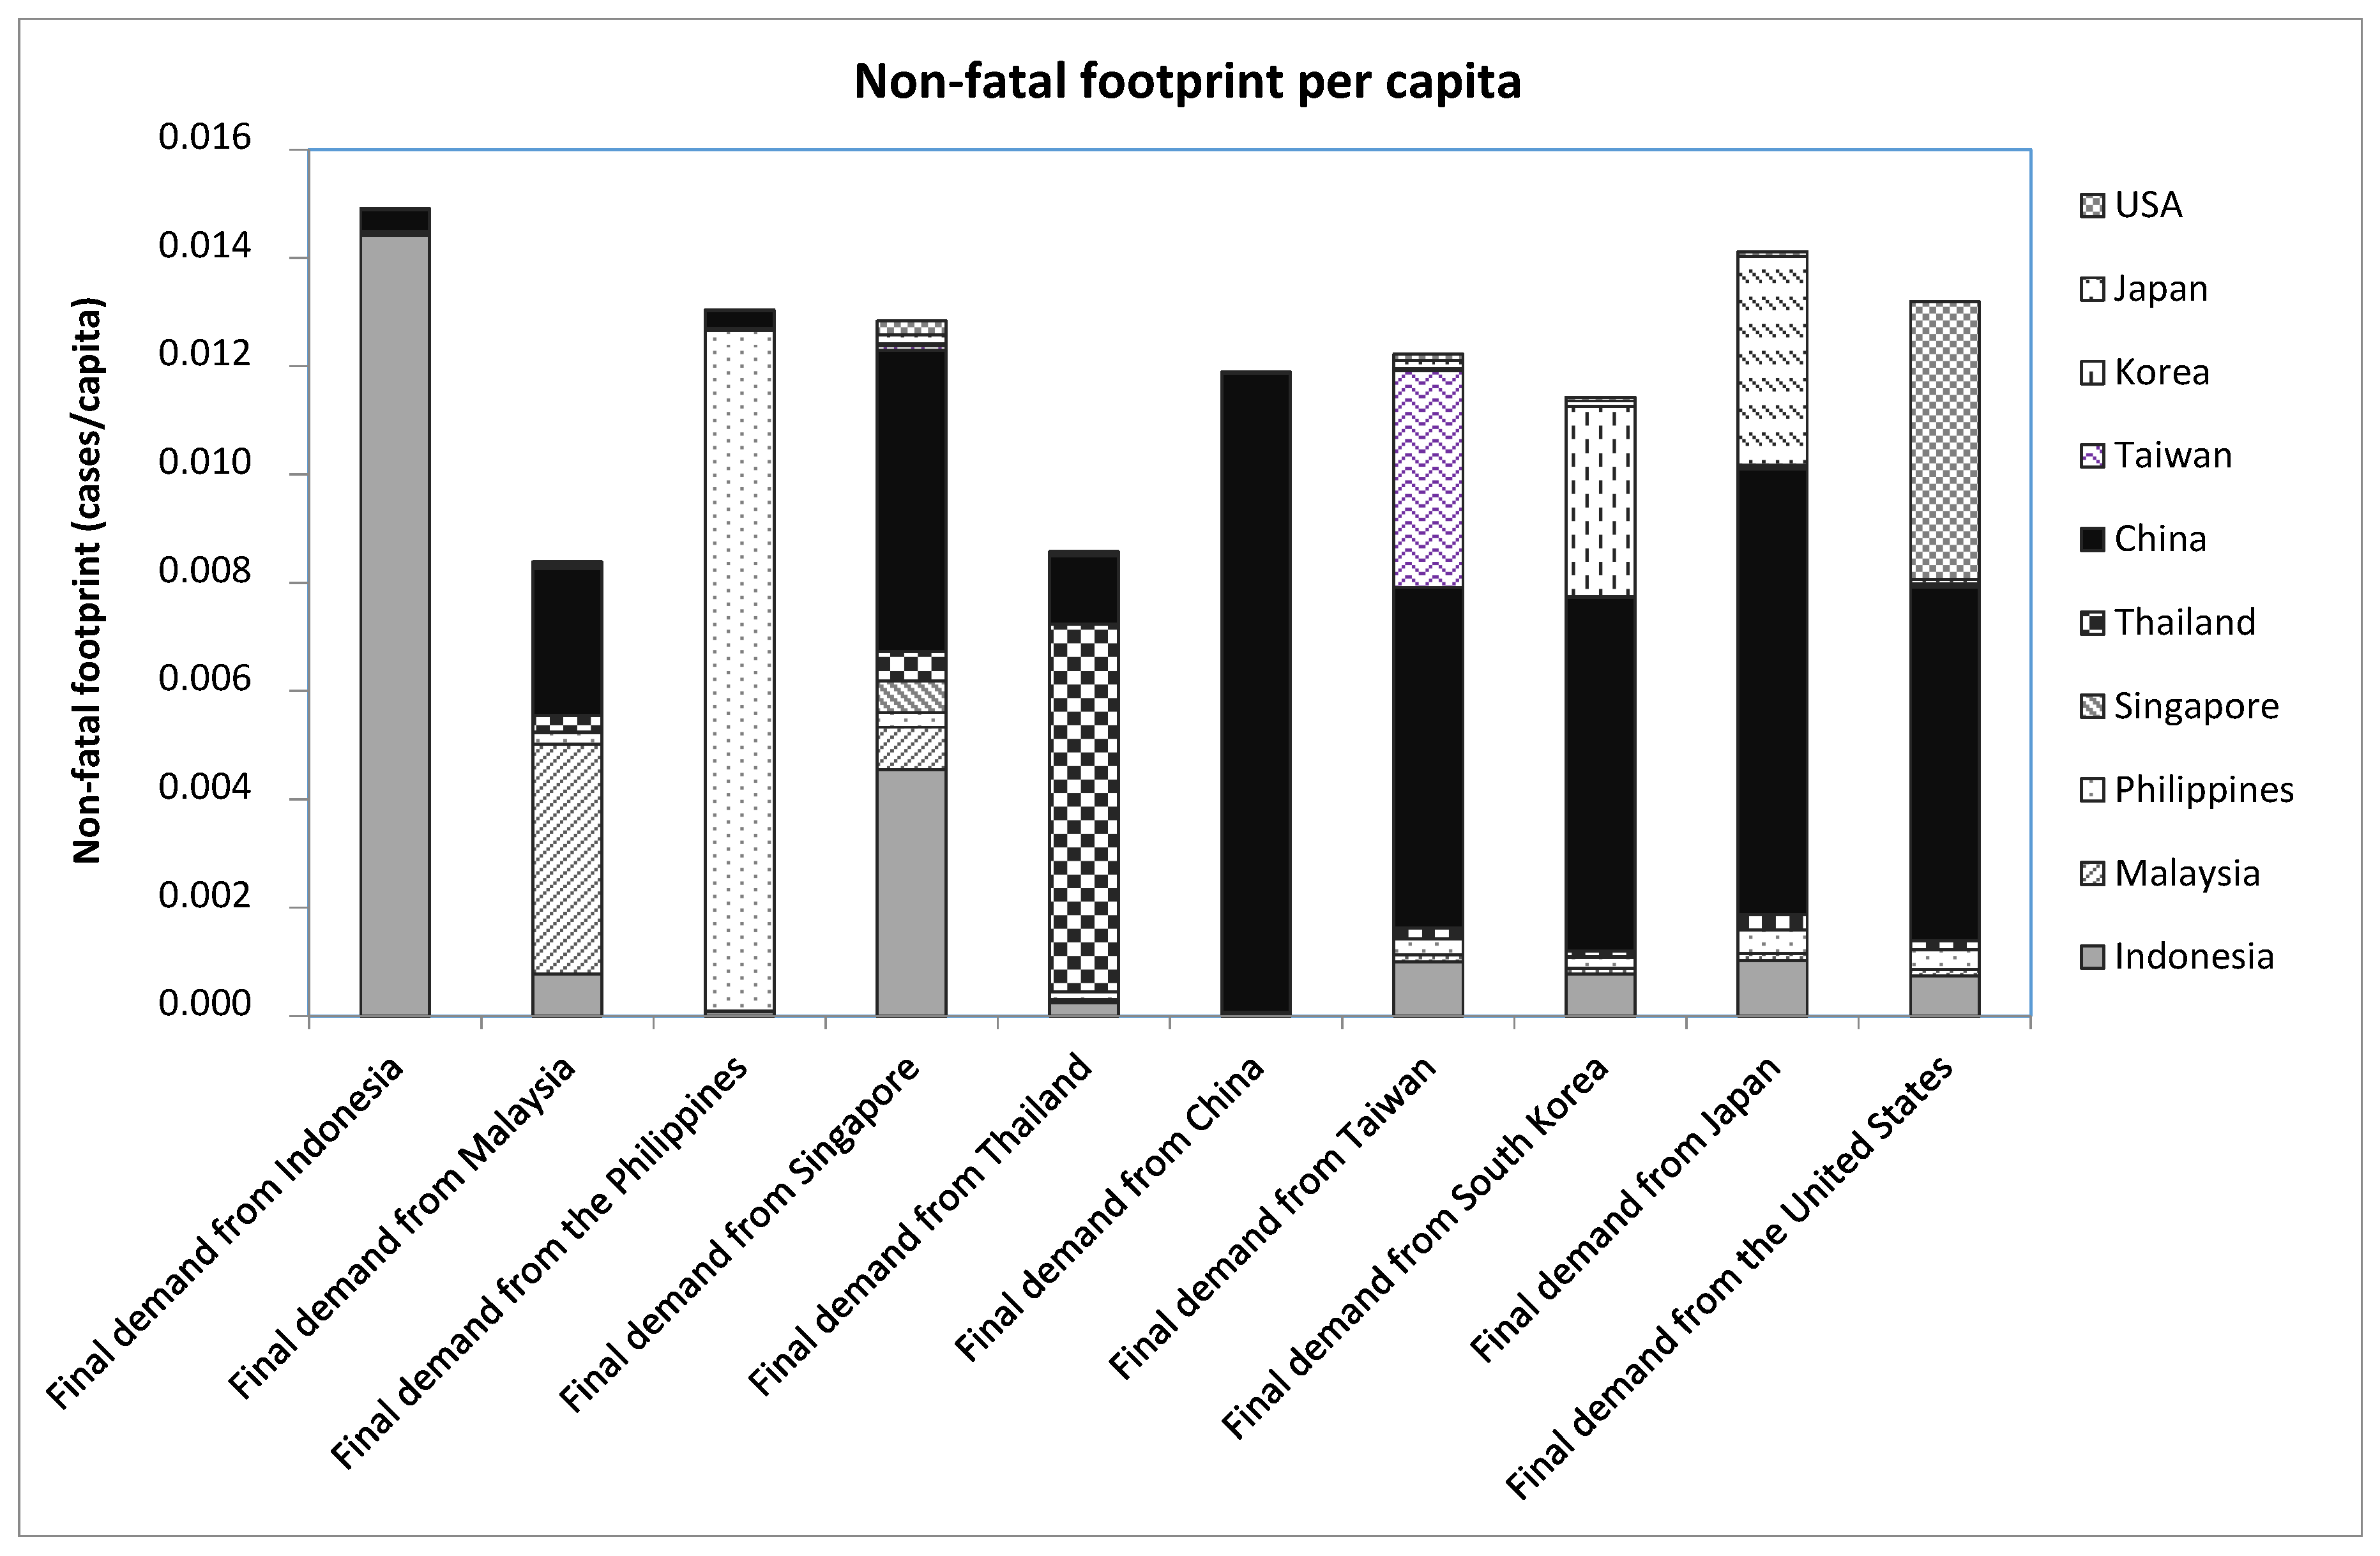
3.5. Non-Fatal Occupational Injury

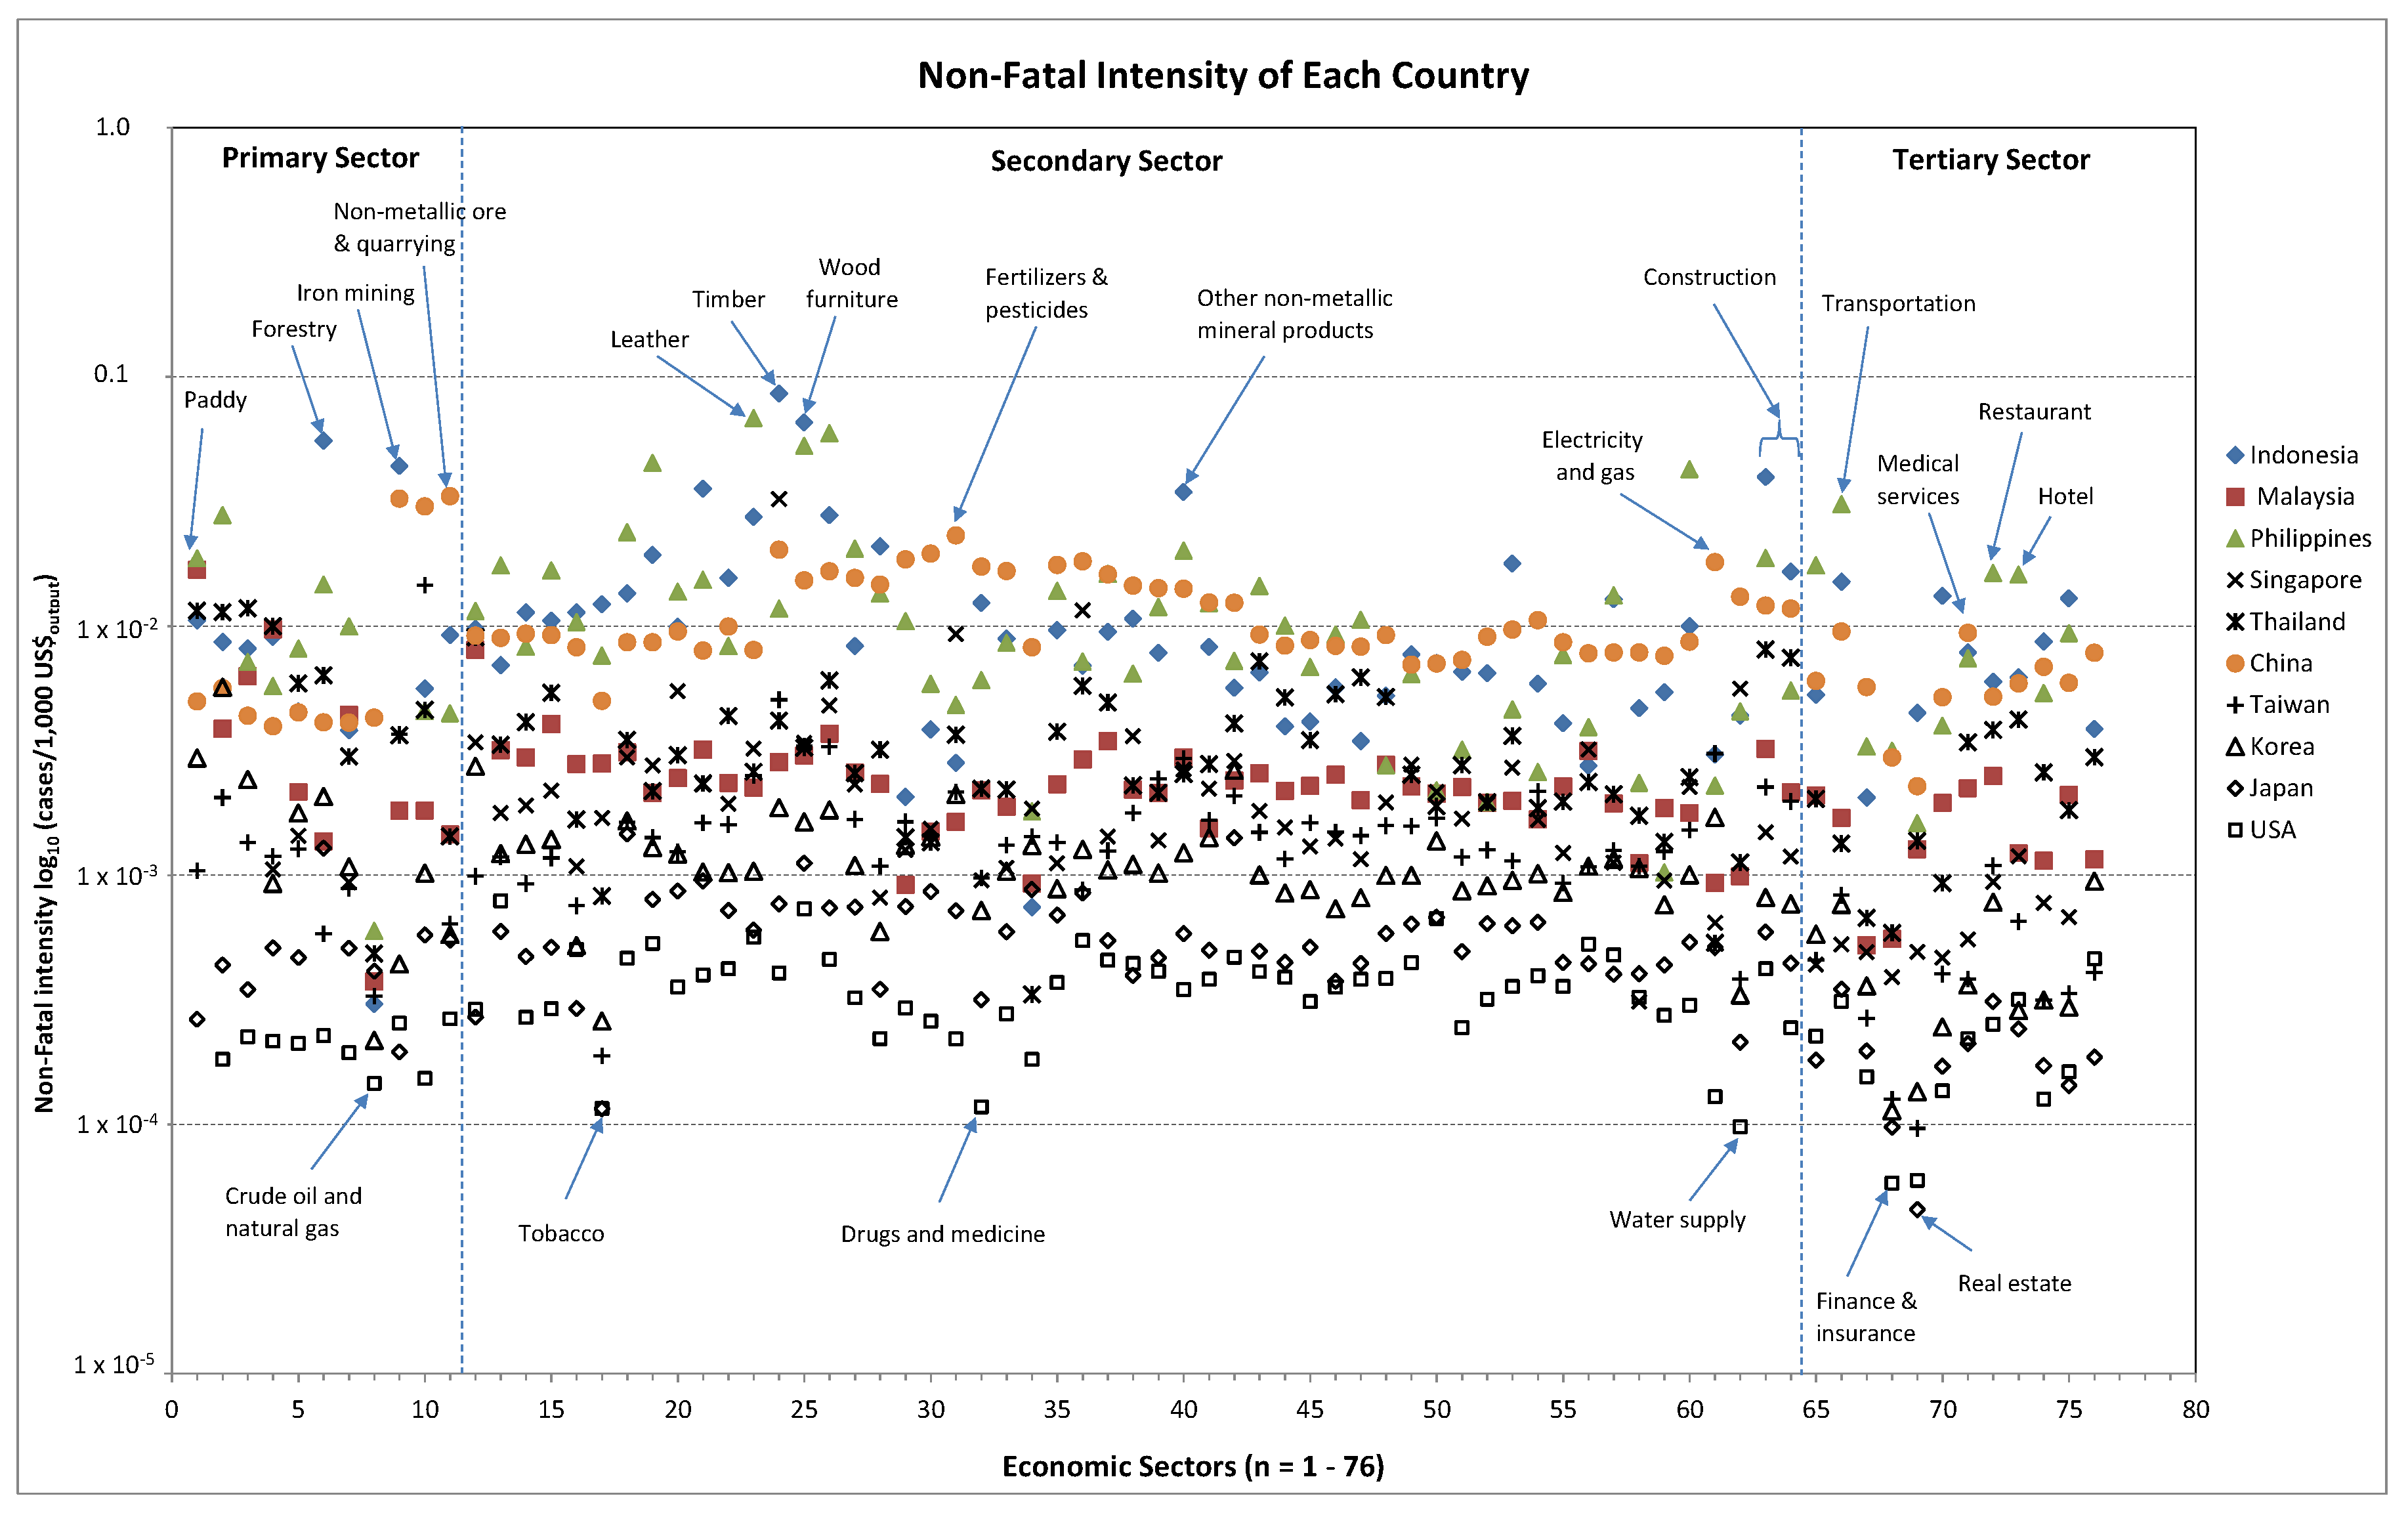
3.5.1. Non-Fatal Occupational Injury Intensity

Figure 9 presents the non-fatal occupational injury intensity of 10 countries with 76 industrial sectors based on the AIIO table of 2005. When considering the primary sector, the results show that the non-fatal occupational injury intensity of the forestry and iron mining sectors in Indonesia and the non-metallic ore and quarrying, other metallic mining, and iron mining sectors in China are the highest when comparing them with other sectors. With the coal mining sector in China having the highest risk rating in the world, the non-metallic ore and quarrying sector has the highest non-fatal intensity. In addition, the forestry sector in Indonesia also has a highest risk rating. The top five non-fatal occupational injury intensities can be found in China, Philippines, Indonesia, Thailand, and Malaysia, respectively. On the other hand, the bottom-ranked intensities are USA, Japan, South Korea, Taiwan, and Singapore.
Generally, agriculture in the developing countries has a high rate of employment and non-fatal injuries but low income intensity. In addition, the agriculture in developing countries is dominated by small-holder farming [46]. On the other hand, in developed countries, agriculture is usually performed on an industrial scale. In the developing countries, the mining sector similarly features high employment and non-fatal injury intensities, but mining in developed countries has a higher rate of injuries and low levels of employment [46]. Also, the non-fatal injuries intensity of the secondary sector and tertiary sector in developing countries is higher than that of developed countries. The non-fatal intensity established in our study was shown to have similar trends to the results obtained by Simas et al. [19].

3.5.2. Non-Fatal Occupational Injuries Footprint per Capita

Figure 10 shows the results of the non-fatal occupational injuries footprint per capita, based on the final demand of each country. The results showed that Indonesia has the highest non-fatal footprint per capita (1.49 × 10⁻² case), followed by Japan (1.41 × 10⁻² case), USA (1.32 × 10⁻² case), the Philippines (1.30 × 10⁻² case), Singapore (1.28 × 10⁻² case), Taiwan (1.22 × 10⁻² case), China (1.19 × 10⁻² case), and Korea (1.14 × 10⁻² case). On the other hand, Malaysia has the lowest non-fatal footprint per capita (8.39 × 10⁻³ case), followed by Thailand (8.57 × 10⁻³ case). If we consider the case of Thailand, the non-fatal footprint is about 8.57 × 10⁻³ cases per capita, whereas, in the USA and Japan, the non-fatal footprint is estimated at about 1.54 and 1.65 times that of the Thai people, respectively.
The non-fatal footprints are associated with intra-country and inter-country trading. The majority of non-fatal footprints is associated with importing goods from the developing countries to the developed countries; imports from China to Japan, South Korea, Taiwan, USA, Singapore, and Malaysia correspond to 58%, 57%, 51%, 49%, 43% and 32% of total non-fatal embodied in trade, respectively. While, imports from China to Thailand, Indonesia, and the Philippines correspond to 15%, 3%, and 2% of total non-fatal incidents, respectively.

3.6. Fatal Occupational Injury

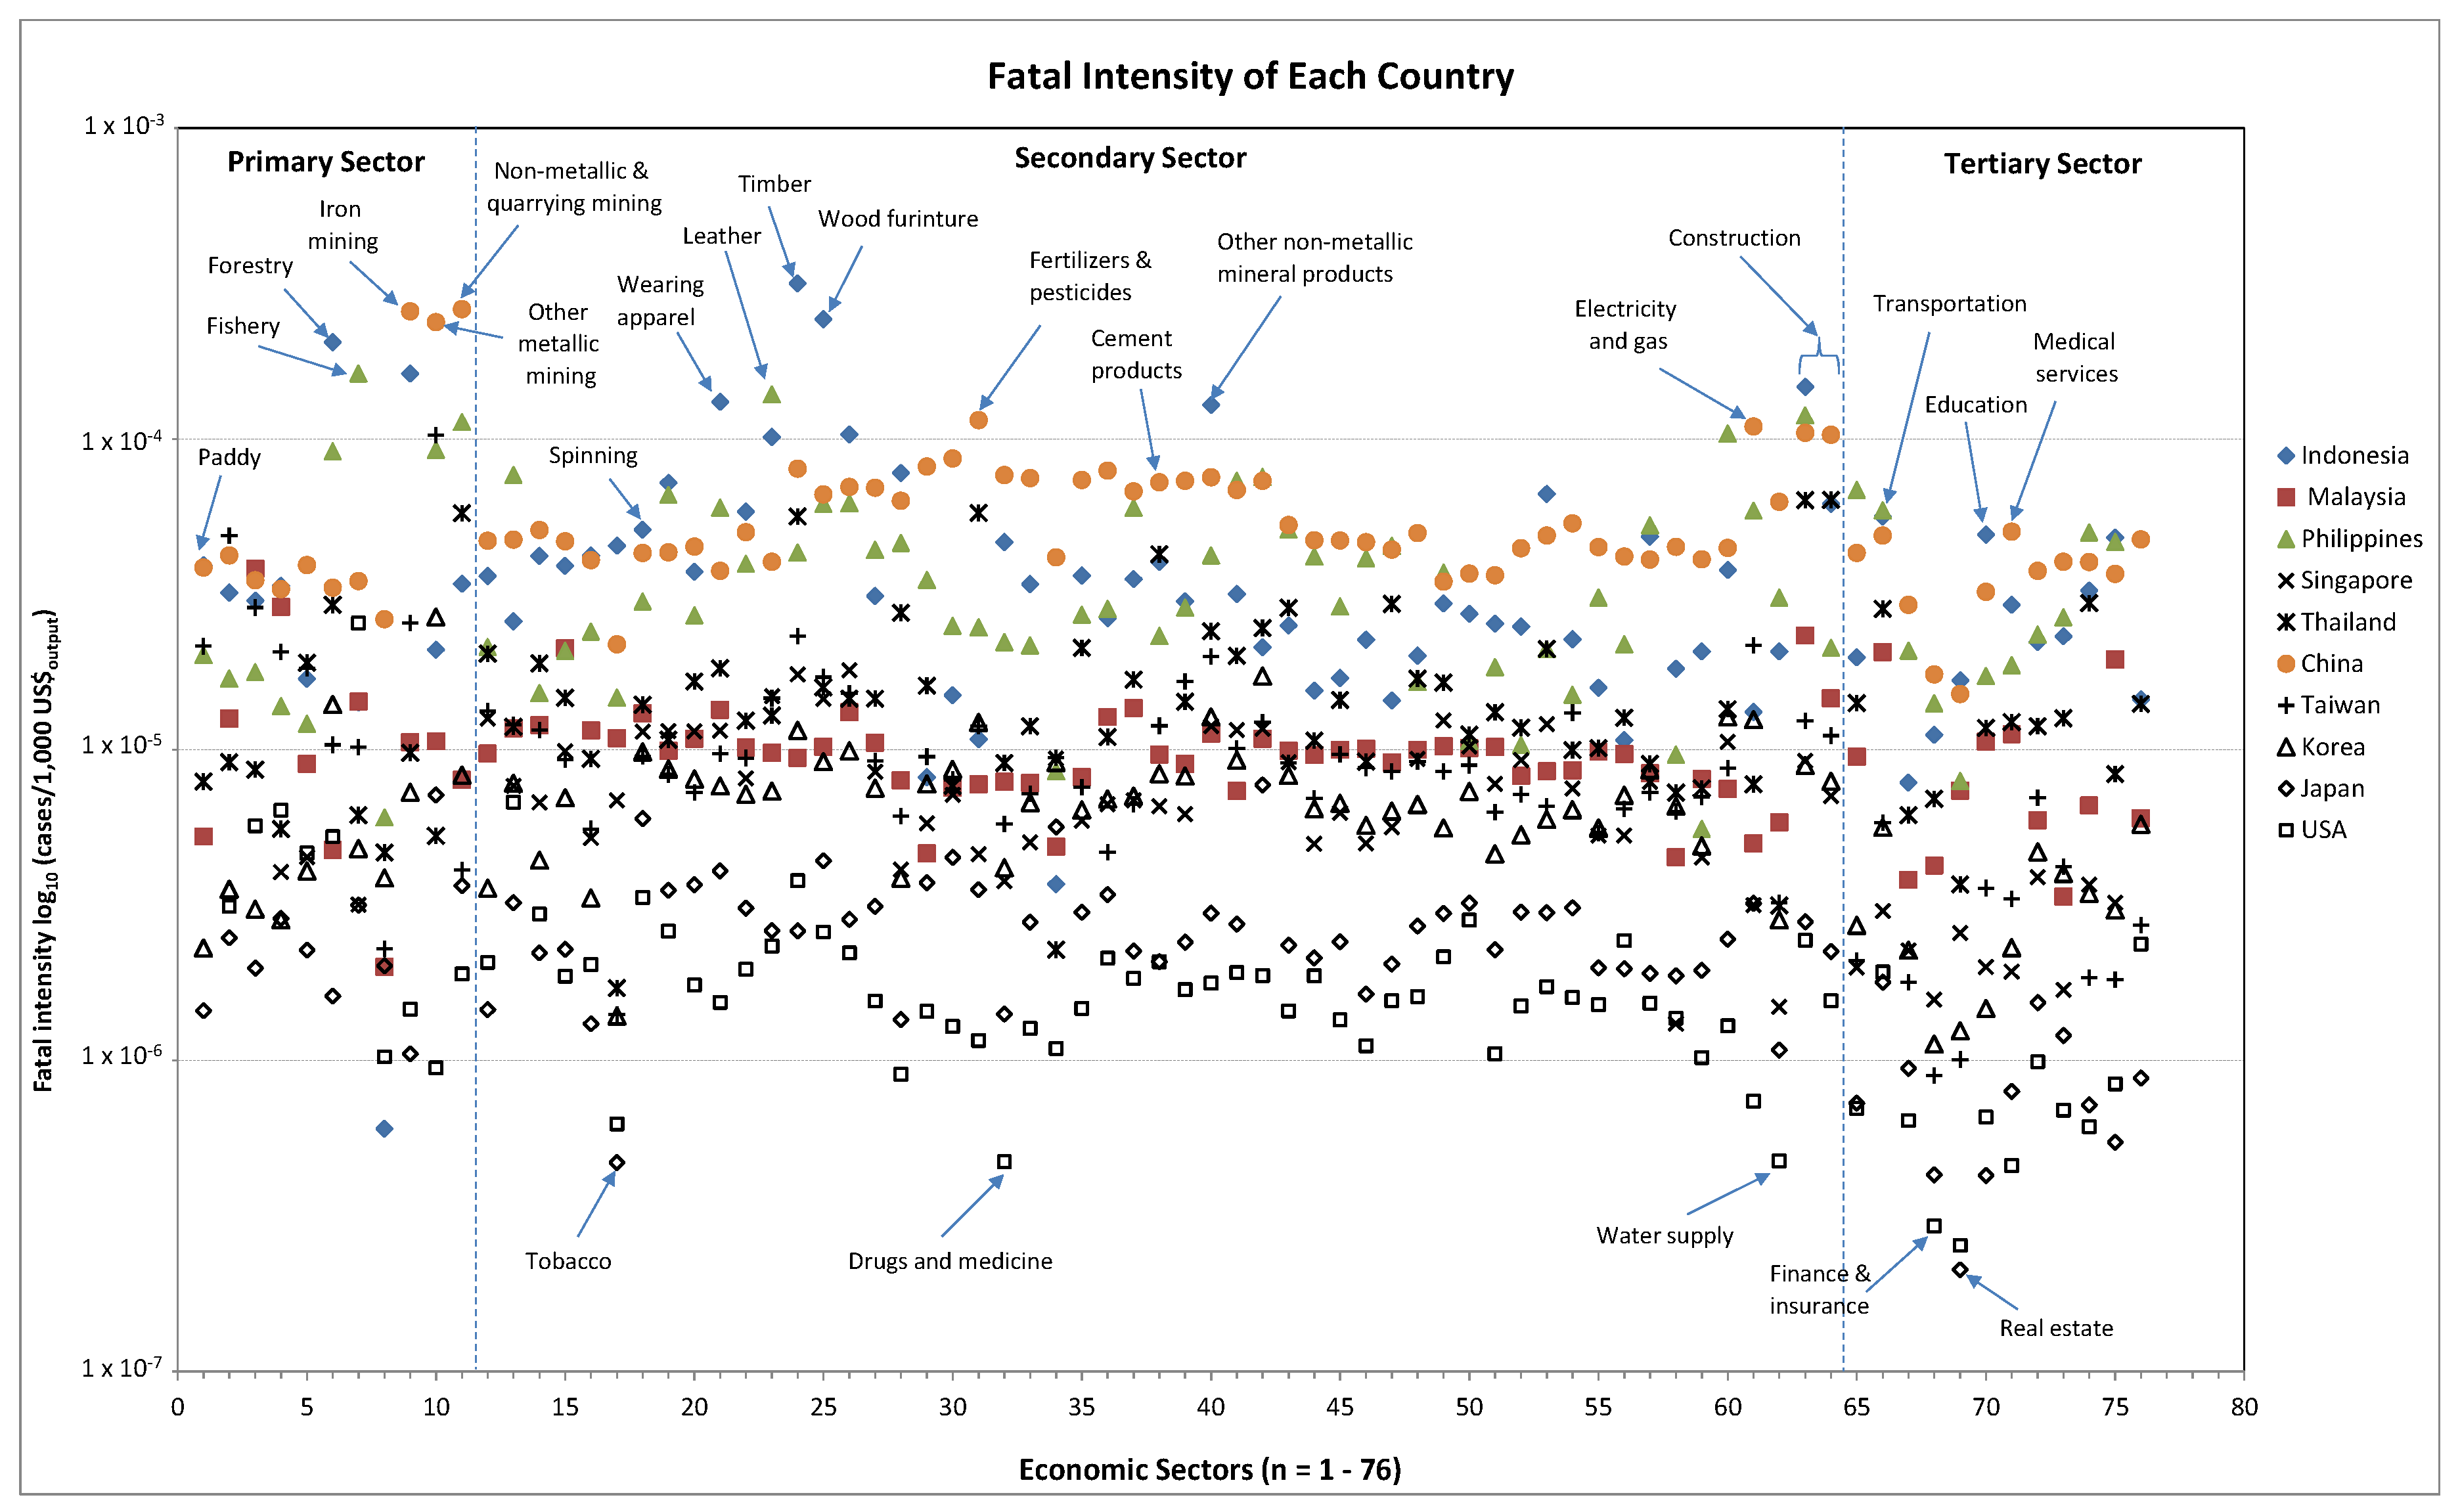
3.6.1. Fatal Occupational Injury Intensity

The fatal occupational injury intensity, expressed in terms of cases per 1000 US$ output of 10 countries with 76 industrial sectors, is presented in Figure 11. The fatal intensity is the highest in the developing countries as follows: China, Indonesia, Philippines, Thailand, and Malaysia, respectively. On the other hand, the developed countries (USA and Japan) had lower fatal intensities than that of the developing countries. Whereas, countries with a medium fatal intensity are Singapore, Taiwan, and South Korea. The fatal occupational injury intensity obtained in our study demonstrated similar trends to the results obtained by Simas et al. [19].
When considering the primary sector (IO code 1–11), the fatal intensity of the mining sector is higher than other sectors in almost all countries, especially in the developing countries. The mining sector in China has the highest fatal intensity compared to other countries and other primary sectors. While the lowest fatal intensity is the crude oil and natural gas sector in almost all countries. In the case of Thailand, the fatal intensity is the highest in the non-metallic ore and quarrying sector (5.77 × 10⁻⁵ case/1000 US$), followed by the forestry sector (2.93 × 10⁻⁵ case/1000 US$) and the livestock sector (1.90 × 10⁻⁵ case/1000 US$). In addition, the agricultural sector (including forestry and fishery) is one of the three most hazardous areas to work along with mining and construction [46]. The intensive use of machinery and agrochemicals boosts the risks. Comparing the health and safety levels in agricultural work between countries is difficult; therefore, the absolute number of workplace accidents in agriculture is misleading as there are many factors related to accidents, especially in relation to the measure of exposure, such as working hours or the number of workers. The official data on the incidence of workplace accidents are imprecise and tend to underestimate actual rates in agriculture, particularly in developing countries as the agricultural sector in developing countries is dominated by small scale farming.
When considering the fatal intensity of the secondary sector (IO code 12–64), the results showed that China has a higher fatal intensity than other countries in almost all sectors. The top five fatal intensities in China are chemical fertilizers and pesticides (1.15 × 10⁻⁴ case/1000 US$), Electricity and gas (1.10 × 10⁻⁴ case/1000 US$), building construction (1.05 × 10⁻⁴ case/1000 US$), other construction (1.03 × 10⁻⁴ case/1000 US$), and the basic chemicals sector (8.65 × 10⁻⁵ case/1000 US$), respectively. For Malaysia, the top-ranked fatal workplace intensities are building construction (2.33 × 10⁻⁵ case/1000 US$), other food products (2.12 × 10⁻⁵ case/1000 US$), other construction (1.46 × 10⁻⁵ case/1000 US$), wearing apparel (1.35 × 10⁻⁵ case/1000 US$), and spinning sector (1.31 × 10⁻⁵ case/1000 US$), respectively. For the Philippines, these are the leather products (1.39 × 10⁻⁴ case/1000 US$), building construction (1.19 × 10⁻⁴ case/1000 US$), and other manufacturing products (1.04 × 10⁻⁴ case/1000 US$), respectively. In Thailand, the top five fatal intensities are in the other construction (6.35 × 10⁻⁵ case/1000 US$), building construction (6.34 × 10⁻⁵ case/1000 US$), chemical fertilizers and pesticides (5.78 × 10⁻⁵ case/1000 US$), timber (5.63 × 10⁻⁵ case/1000 US$), and cement and cement products sectors (4.25 × 10⁻⁵ case/1000 US$), respectively. For the majority of these sectors, fatal workplace accidents may be traced back to the supply chain. While, the fatal intensity of the USA is low in comparison with other countries, followed by Japan.
For the tertiary sector (IO code 65–76), the general understanding is that the workers in these sectors are at low risk of occupational injury and death. However, these workers are involved in a wide range of working activities and are exposed to a variety of risks. Occupational fatalities with the highest intensity were found in the transportation sector in almost all countries. The top-ranked fatal intensity of the transportation sector is the Philippines (5.89 × 10⁻⁵ case/1000 US$), Indonesia (5.63 × 10⁻⁵ case/1000 US$), China (4.89 × 10⁻⁵ case/1000 US$), Thailand (2.83 × 10⁻⁵ case/1000 US$), and Malaysia (2.06 × 10⁻⁵ case/1000 US$), respectively. These values are about 10–30 times higher than that of developed countries and the richest Asian countries.

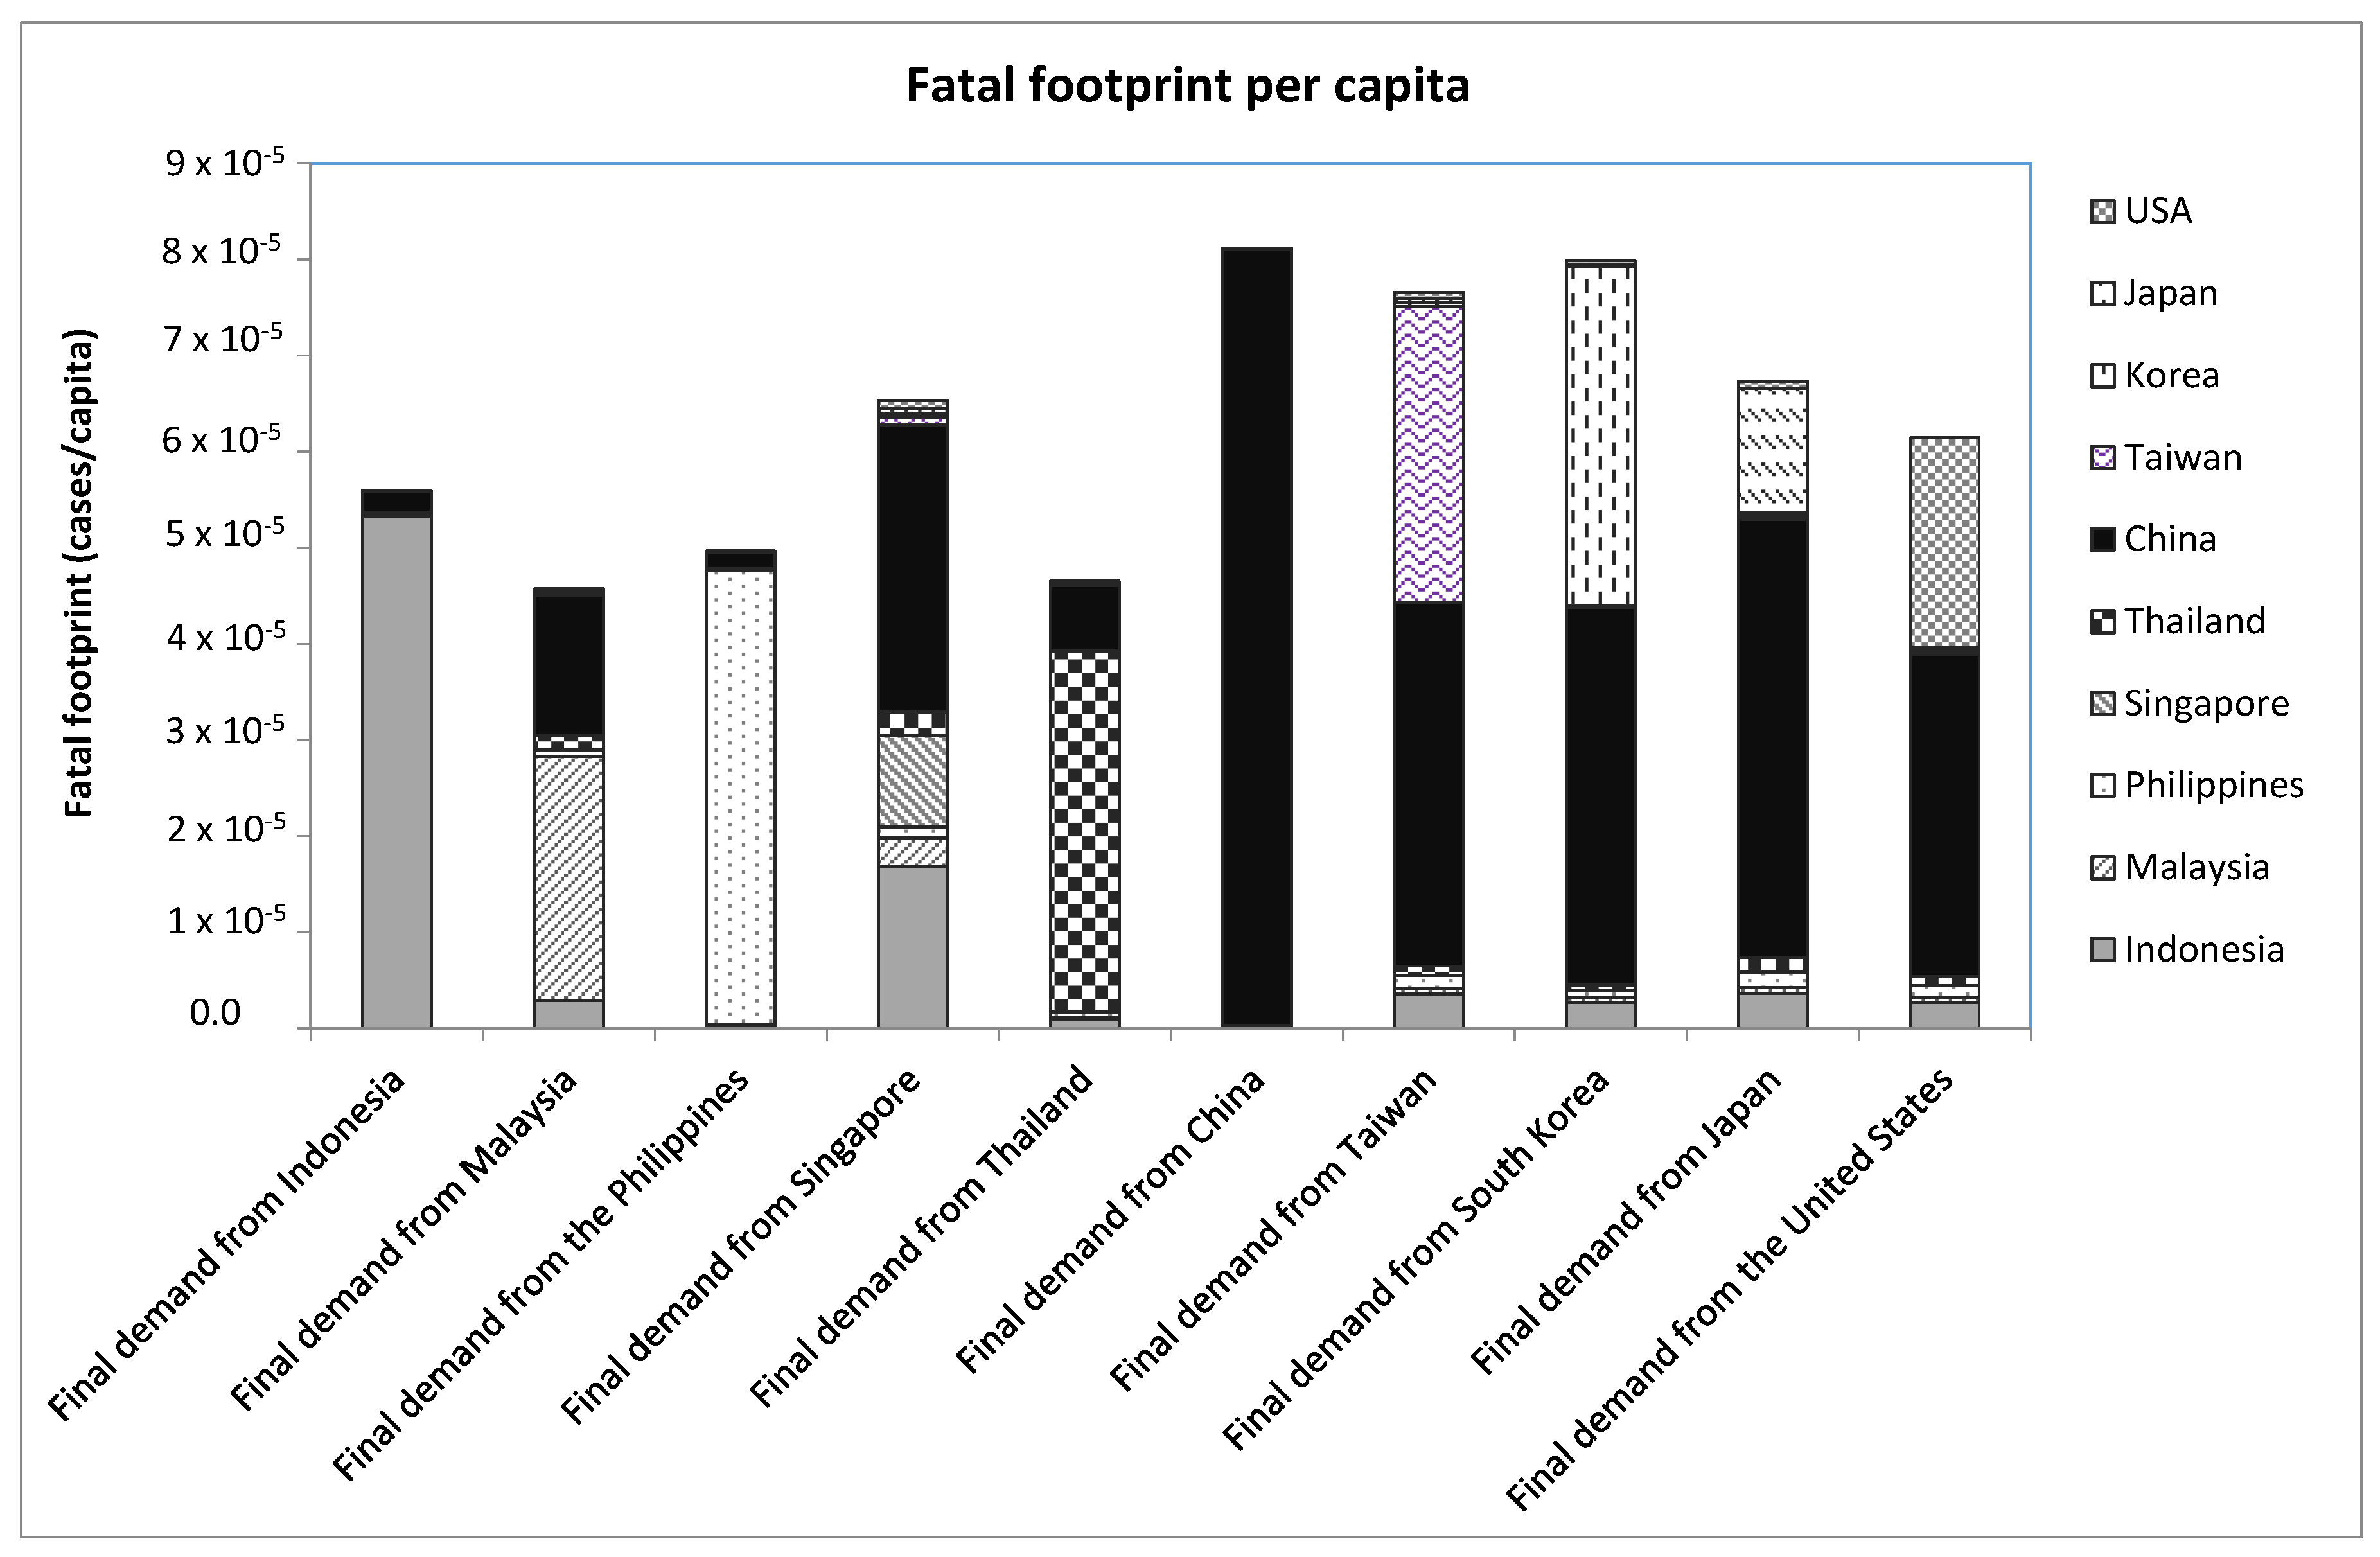
3.6.2. Fatal Occupational Injury Footprint per Capita

The results of the fatal occupational injury footprint per capita is based on final consumption of 10 countries and are presented in Figure 12. The results show that China has the highest fatal footprint per capita (8.11 × 10⁻⁵ case), followed by South Korea (7.99 × 10⁻⁵ case), Taiwan (7.66 × 10⁻⁵ case), Japan (6.73 × 10⁻⁵ case), Singapore (6.53 × 10⁻⁵ case), and USA (6.14 × 10⁻⁵ case). On the other hand, Malaysia has the lowest fatal footprint per capita (4.57 × 10⁻⁵ case), followed by Thailand (4.65 × 10⁻⁵ case), the Philippines (4.96 × 10⁻⁵ case), and Indonesia (5.60 × 10⁻⁵ case). If we consider the case of Thailand, the fatal footprint is approximately 4.65 × 10⁻⁵ cases per capita, whereas the USA and Japan had a fatal footprint estimated of 1.32 and 1.45 times that of Thai people, respectively.
The fatal footprint is associated with intra-country and inter-country trade. The majority of fatal footprints is associated with exchanges of goods and services from the developing countries to the developed countries; exchanges from China to Japan, USA, South Korea, Taiwan, and Singapore correspond for 68%, 54%, 49%, 49% and 46% of total fatality embodied in trade, respectively. While, exchanges from China to Malaysia, Thailand, Indonesia, and Philippines correspond to 32%, 15%, 4%, and 3% of total fatality embodied in trade, respectively. China is obviously the world’s largest exporter, being the primary exporter to the other nine countries.

4. Discussion

Labor intensity of each industrial sector was calculated by the ratio of employment to the monetary output of that sector. When comparing the capital-intensive and labor-intensive industries, the labor intensity of labor-intensive industries will use many more workers than those capital-intensive industries producing the same value of output. Based on the total employment, paid workers, and vulnerable employment intensity, the developing countries are labor intensive while the developed countries are capital-intensive. In addition, we found that the agricultural, textiles and garment, wood products, construction, wholesale and retail trade, hotel, and restaurant sectors are labor intensive when comparing them with other economic sectors. Our results are similar to previous studies [6,19,20,21,46].
Generally, more advanced technology implies higher wages and safety, but lower labor inputs. However, it is guessed that the manufacturing in developed countries, such as the USA and Japan, requires less labor input with high wages and greater safety than in developing countries such as China, Indonesia, Philippines, etc. On the other hand, people in developed countries normally consume more resources and produce a greater footprint than those in developing countries. The results of our study proved this. In the case of China, in the primary sector, China needs about 13–65 times more labor than the USA to produce the same value of exports. For the secondary sector, China requires about 6–60 times more labor than the USA to produce the same value. While, in the tertiary sector, China needs about 11–25 times more labor than the USA to produce the same value. Based on final demand of China’s consumption, the employment per capita of Chinese people is less than that of the American people. In the case of Thailand, in the primary sector, Thailand requires approximately 3–60 times more labor than in the USA to produce the same value of exports, whereas, in the secondary sector, Thailand requires approximately 2–42 times more labor than the USA to produce the same value. While, in the tertiary sector, Thailand requires approximately 5–30 times more labor than in the USA to produce the same value. When comparing the footprint of total employment and vulnerable employment per capita between the developed countries and developing countries, the results showed that both footprints in the developed countries were higher than that of the developing countries. Our results are similar to previous studies [19]. In addition, this study’s results showed that more than 16% of the employed workers in 10 countries for consumption in a country other than their own. China is obviously the world’s greatest exporter, being the major exporter to six of the nine countries. We can find that the total income received by Chinese workers is very high when compared with workers in the Philippines or Indonesia.
Normally, the agricultural sector in the developing countries is of a higher intensity in total employment, vulnerable employment, fatalities, and non-fatal injuries, yet low in wages. Agriculture in the developing countries occurs in a small scale, while in the developed countries it is usually performed on an industrial scale. This result is similar to the previous study conducted by Papong et al. [21]. A particular attribute of the agricultural sector is the lack of a clear-cut division between different groups of workers. For example, during harvesting periods, many smallholder farmers in developing countries supplement their income by working on large commercial farms. Working conditions and labor relations of permanent and temporary workers are very different. Permanent workers receive job security, higher wages, and health and work benefits. However, work in agriculture is mostly carried out by daily laborers, seasonal laborers and temporary workers who are low-skilled and perform under poor working conditions. Normally, this labor relates to family workers. There are inequalities in the economic development of different countries; for example, a developing country is characterized by low-skilled farming which takes up a large proportion of labor in rural areas. Whilst in developed countries, skilled farmers use highly mechanized processes and, therefore, achieve higher productivity by using a few workers.
The mining sector in the developing countries is characterized likewise by high employment, fatal, and non-fatal injuries intensities. While, in developed countries, mining is indicated by high fatal, high non-fatal injuries and high wage intensities but low employment. The secondary and tertiary sectors in the developing countries showed similarities in high employment, fatal, and non-fatal injuries intensities but low intensity in income. While, in developed countries, these sectors are defined by low employment, fatal, non-fatal injuries but high wages.

4.1. Policy Implications

The developing countries such as China, Indonesia, etc., normally have lower regulations on labor, health, and safety than developed countries. The shift of manufacturing being centered in developed to developing countries has partially contributed to this. Clearly, the developed countries have gained from the trade with developing countries in terms of reducing their resource consumption, worker consumption, and rate of fatal and non-fatal injuries, while products are cheap. Because of this, vulnerable employment, fatal and non-fatal injuries intensities in the developing countries are higher than those in the developed countries. While, paid worker and labor income intensities in the developed countries are higher than those in the developing countries. All countries might reconsider the trade-offs they are making if using the information on embodied social impacts of trade when conducting negotiations. In addition, this study of labor embodied in trade is also helpful for domestic policy-making, particularly in the developing countries. This study obviously shows that labor input and occupational health impacts in the developing countries are concentrated in manufacturing and not domestic consumption. Thus, worker consumption and occupational health and safety impacts in the manufacturing phase are crucial for improving standards in developing countries.

4.2. Uncertainties and Limitations

The normal uncertainties of the IOA method include aggregation, time delays, hypothesis of the linear inter-sector relationships, and homogeneity of products. Even though uncertainty analysis from these viewpoints is carefully done first because of the lack of data within input–output tables, in this study, the uncertainties will focus on the variation between the 10 countries, trade data, and the estimation of labor, fatal and non-fatal injuries consumption. The 10 countries are different in terms of various variables, such as population number, development stage, and policies and regulations, which significantly affect the occupational health impacts embodied in trade. For example, the large population of China affects the higher labor intensity of the economic sector in China. In addition, policies and regulations on employment and occupational health and safety in the developing countries and developed countries are significantly different. Uncertainties also come from a lack of statistical data for some countries. In particular, using the official data on fatal and non-fatal injuries reported by national and international organizations can change the results on fatal and non-fatal injuries embodied in trade. It is estimated that 50% of the labor force in the developing countries work in the informal market [47]. This study has estimated the data of non-fatal and fatal injuries from the informal market by adjusting the national statistics of each country.

5. Conclusions

This study calculates the social intensity and social footprints associated with the economic sectors of 10 countries and identifies key sectors and important labor issues in Asian countries using the Asian international input–output table. The results show that the labor intensity in terms of total employment, paid workers, vulnerable employment, non-fatal injuries, and fatal accident cases in the developing countries was higher than developed countries, whereas wages intensity in developing countries was lower than that of developed countries. The social footprints are associated with intra-country trade and inter-country trade. The majority of the footprint calculated from total employment, paid workers, vulnerable employment, non-fatal injuries, and fatal cases was associated with exchange of goods and services from the developing countries to developed countries; flows from China to USA, Japan, South Korea, Taiwan, and Singapore have a significant effect on the social impacts embodied in these countries. This study provides information that can assist consumers, producers, and stakeholders to identify social issues of responsibility and encourage better practices across the supply chain. Although the IOA showed in this work is simple to use, some limitations should be considered. Some debatable issues include calculations based on the linear inter-industry interactions, the estimations of the intensities of the 10 countries, data availability, and data quality.

Acknowledgments

This research was supported by the Japan Society for the Promotion of Science (JSPS) under JSPS RONPAKU (Dissertation PhD) Program, Tokyo City University (TCU), National Research Council of Thailand (NRCT), and National Metal and Materials Technology Center (MTEC). The authors would like to thank all contributors for the data used in this study.

Author Contributions

The text of this manuscript was written by Seksan Papong, with contributions by Norihiro Itsubo, Yuya Ono, and Pomthong Malakul. Data collection and data analysis was performed by Seksan Papong. The research was supervised by Norihiro Itsubo and Pomthong Malakul. All authors proofread and approved the final manuscript.

Conflicts of Interest

The authors declare no conflict of interest.

Appendix A

Table A1. Definition of economic sectors based on the 2005 Asian International input–output table (76 sectors).
IO CodeEconomic Sector
Primary sector
1Paddy
2Other grain
3Food crops
4Non-food crops
5Livestock and poultry
6Forestry
7Fishery
8Crude petroleum and natural gas
9Iron ore
10Other metallic ore
11Non-metallic ore and quarrying
Secondary sector
12Milled grain and flour
13Fish products
14Slaughtering, meat products and dairy products
15Other food products
16Beverage
17Tobacco
18Spinning
19Weaving and dyeing
20Knitting
21Wearing apparel
22Other made-up textile products
23Leather and leather products
24Timber
25Wooden furniture
26Other wooden products
27Pulp and paper
28Printing and publishing
29Synthetic resins and fiber
30Basic industrial chemicals
31Chemical fertilizers and pesticides
32Drugs and medicine
33Other chemical products
34Refined petroleum and its products
35Plastic products
36Tires and tubes
37Other rubber products
38Cement and cement products
39Glass and glass products
40Other non-metallic mineral products
41Iron and steel
42Non-ferrous metal
43Metal products
44Boilers, Engines and turbines
45General machinery
46Metal working machinery
47Specialized machinery
48Heavy Electrical equipment
49Television sets, radios, audios and communication equipment
50Electronic computing equipment
51Semiconductors and integrated circuits
52Other electronics and electronic products
53Household electrical equipment
54Lighting fixtures, batteries, wiring and others
55Motor vehicles
56Motor cycles
57Shipbuilding
58Other transport equipment
59Precision machines
60Other manufacturing products
61Electricity and gas
62Water supply
63Building construction
64Other construction
Tertiary sector
65Wholesale and retail trade
66Transportation
67Telephone and telecommunication
68Finance and insurance
69Real estate
70Education and research
71Medical and health service
72Restaurants
73Hotel
74Other services
75Public administration
76Unclassified

References

  1. International Organization for Standardization (ISO). ISO 14040: Environmental Management—Life Cycle Assessment—Principals and Framework; ISO: Geneva, Switzerland, 2006. [Google Scholar]
  2. United Nations Environment Programme (UNEP). Guidelines for Social Life Cycle Assessment of Products; UNEP: Gent, Belgium, 2009; Available online: http://www.unep.fr/shared/publications/pdf/DTIx1164xPA-guidelines_sLCA.pdf (accessed on 1 May 2015).
  3. Dreyer, L.C. Inclusion of Social Aspects in Life Cycle Assessment of Products-Development of a Methodology for Social Life Cycle Assessment. Ph.D. Thesis, Technical University of Denmark, Kongens Lyngby, Denmark, April 2009. [Google Scholar]
  4. Hutchins, M.J.; Robinson, S.L.; Dornfeld, D. Understanding Life Cycle Social Impacts in Manufacturing: A Processed-Based Approach. J. Manuf. Syst. 2013, 32, 536–542. [Google Scholar] [CrossRef]
  5. Benoit-Norris, C.; Cavan, D.A.; Norris, G. Identifying Social Impacts in Product Supply Chains: Overview and Application of the Social Hotspot Database. Sustainability 2012, 4, 1946–1965. [Google Scholar] [CrossRef]
  6. Garrett-Peltier, H. The Employment Impacts of Economy-Wide Investments in Renewable Energy and Energy Efficiency. Ph.D. Thesis, University of Massachusetts Amherst, Amherst, MA, USA, September 2010. [Google Scholar]
  7. Martínez, S.H.; van Eijck, J.; da Cunha, M.P.; Guilhoto, J.; Walter, A.; Faaij, A. Analysis of Socio-Economic Impacts of Sustainable Sugarcane–Ethanol Production by Means of Inter-Regional Input–Output Analysis: Demonstrated for Northeast Brazil. Renew. Sustain. Energy Rev. 2013, 28, 290–316. [Google Scholar] [CrossRef]
  8. Chen, T.P.; Chang, T.; Chiau, W.; Shih, Y. Social Economic Assessment of Coastal Area Industrial Development: An Application of Input-Output Model to Oyster Farming in Taiwan. Ocean Coast. Manag. 2013, 73, 153–159. [Google Scholar] [CrossRef]
  9. Tang, X.; Zhang, B.; Wei, X. Employment Impacts of Petroleum Industry in China: An Input-Output Analysis. Int. J. Glob. Energ. Issues 2013, 36, 116–129. [Google Scholar] [CrossRef]
  10. Lee, M.K.; Yoo, S.H. The Role of the Capture Fisheries and Aquaculture Sectors in the Korean National Economy: An Input–Output Analysis. Mar. Policy 2014, 44, 448–456. [Google Scholar] [CrossRef]
  11. Ferrão, P.; Ribeiro, P.; Rodrigues, J.; Marquesa, A.; Preto, M.; Amaral, M.; Domingosa, T.; Lopes, A.; Costa, I. Environmental, Economic and Social Costs and Benefits of a Packaging Waste Management System: A Portuguese Case Study. Resour. Conserv. Recycl. 2014, 85, 67–78. [Google Scholar] [CrossRef]
  12. McBain, D.; Alsamawi, A. Quantitative Accounting for Social Economic Indicators. Natural Resour. Forum 2014, 38, 193–202. [Google Scholar] [CrossRef]
  13. Malik, A.; Lenzen, M.; Geschke, A. Triple Bottom Line Study of a Lignocellulosic Biofuel Industry. GCB Bioenergy 2015, 8, 96–110. [Google Scholar] [CrossRef]
  14. Yang, Y.; Zhang, B.; Cheng, J.; Pu, S. Socio-Economic Impacts of Algae-Derived Biodiesel Industrial Development in China: An Input–Output Analysis. Algal Res. 2015, 9, 74–81. [Google Scholar] [CrossRef]
  15. Kucukvar, M.; Egilmez, G.; Tatari, O. Sustainability Assessment of U.S. Final Consumption and Investments: Triple-Bottom-Line Input–Output Analysis. J. Clean. Prod. 2014, 81, 234–243. [Google Scholar] [CrossRef]
  16. Alsamawi, A.; Murray, J.; Lenzen, M. The Employment Footprints of Nations. J. Ind. Ecol. 2014, 18, 59–70. [Google Scholar] [CrossRef]
  17. Chang, Y.; Ries, R.J.; Wang, Y. The Quantification of the Embodied Impacts of Construction Projects on Energy, Environment, and Society Based on I–O Lca. Energy Policy 2011, 39, 6321–6330. [Google Scholar] [CrossRef]
  18. Onat, N.C.; Kucukvar, M.; Tatari, O. Integrating Triple Bottom Line Input-Output Analysis into Life Cycle Sustainability Assessment Framework: The Case for Us Buildings. Int. J. Life Cycle Assess. 2014, 19, 1488–1505. [Google Scholar] [CrossRef]
  19. Simas, M.S.; Golsteijn, L.; Huijbregts, M.A.J.; Wood, R.; Hertwich, E.G. The “Bad Labor” Footprint: Quantifying the Social Impacts of Globalization. Sustainability 2014, 6, 7514–7540. [Google Scholar] [CrossRef] [Green Version]
  20. Gómez-Paredes, J.; Yamasue, E.; Okumura, H.; Ishihara, K.N. The Labour Footprint: A Framework to Assess Labour in a Complex Economy. Econ. Syst. Res. 2015, 27, 1–25. [Google Scholar] [CrossRef]
  21. Papong, S.; Itsubo, N.; Malakul, P.; Shukuya, M. Development of the Social Inventory Database in Thailand Using Input–Output Analysis. Sustainability 2015, 7, 7684–7713. [Google Scholar] [CrossRef]
  22. International Labour Organization (ILO). Employment Definition; ILO: Geneva, Switzerland, 2015; Available online: http://laborsta.ilo.org/definition_E.html (accessed on 1 February 2016).
  23. International Labour Organization’s (ILO). Guide to the New Millennium Development Goals Employment Indicators; ILO: Geneva, Switzerland, 2009; Available online: http://www.ilo.org/public/english/employment/download/mdg_en.pdf (accessed on 1 February 2016).
  24. International Labour Organization (ILO). Global Employment Trends 2014: Risk of a Jobless Recovery? ILO: Geneva, Switzerland, 2014. [Google Scholar]
  25. Leontief, W.W. Input–Output Economics, 2nd ed.; Oxford University Press: New York, NY, USA, 1986. [Google Scholar]
  26. Miller, R.E.; Blair, P.D. Input–Output Analysis: Foundations and Extensions; Cambridge University Press: New York, NY, USA, 2009. [Google Scholar]
  27. Institute of Developing Economies, Japan External Trade Organization (IDE-JETRO). Asian International Input-Output Table 2005–Employment Matrix; IDE Statistical Data Series No. 98; IDE-JETRO: Tokyo, Japan, 2013.
  28. Institute of Developing Economies, Japan External Trade Organization (IDE-JETRO). Asian International Input-Output Table 2005–Excel Table; IDE-JETRO: Tokyo, Japan, 2013. Available online: http://www.ide.go.jp/English/Data/Io/ (accessed on 1 December 2014).
  29. U.S. Bureau of Labor Statistics. Occupational Injuries and Illnesses: Counts, Rates, and Characteristics, 2005; U.S. Department of Labor: Washington, DC, USA, 2007. Available online: http://www.bls.gov/iif/oshbulletin2005.htm (accessed on 1 October 2015).
  30. U.S. Bureau of Labor Statistics. Fatal Occupational Injuries to Private Sector Wage and Salary Workers, Government Workers, and Self-Employed Workers by Industry, All United States, 2005; U.S. Department of Labor: Washington, DC, USA, 2007. Available online: http://www.bls.gov/iif/oshwc/cfoi/cftb0207.pdf (accessed on 1 October 2015).
  31. International Labour Organization (ILO). Occupational Injuries (Selected Countries for Japan, Taiwan and South Korea); ILO: Geneva, Switzerland, 2014; Available online: http://laborsta.ilo.org/ (accessed on 1 October 2015).
  32. Thailand’s Social Security Office (SSO). Occupational Accidents and Fatality Cases; Ministry of Labour: Bangkok, Thailand, 2006.
  33. Korea Ministry of Employment and Labor (KMOEL). Summary of Occupational Accidents by Industry (Divisions) in 2005; KMOEL: Sejong, South Korea, 2014. Available online: http://kosis.kr/eng/ (accessed on 1 November 2015).
  34. Singapore Ministry of Manpower. Workplace Injuries and Occupational Diseases 2006; Singapore Ministry of Manpower: Singapore, 2015. Available online: http://www.mom.gov.sg/workplace-safety-and-health/wsh-reports-and-statistics (accessed on 1 November 2015).
  35. Abas, A.L.; Said, R.B.M.; Mohammed, M.A.B.A.; Sathiakumar, N. Fatal Occupational Injuries among Non-governmental Employees in Malaysia. Int. J. Occup. Environ. Health. 2013, 56, 65–76. [Google Scholar] [CrossRef] [PubMed]
  36. Abas, A.L.; Said, R.B.M.; Mohammed, M.A.B.A.; Sathiakumar, N. Non-fatal Occupational Injuries among Non-governmental Employees in Malaysia. Int. J. Occup. Environ. Health. 2011, 17, 38–48. [Google Scholar] [CrossRef] [PubMed]
  37. Philippine Statistics Authority. Incidence Rates of Cases of Occupational Injuries with Lost Workdays by Major and Minor Industry Group and Incapacity for Work, Philippines: 2003–2007; Philippine Statistics Authority: Manila, Philippines, 2015. Available online: http://labstat.psa.gov.ph/ (accessed on 1 November 2015).
  38. International Labour Organization (ILO). National Profile Report on Occupational Safety and Health in China; ILO Office for China and Mongolia: Beijing, China, 2012. [Google Scholar]
  39. National Bureau of Statistics of China. China Statistical Yearbook 2006: Basic Statistics on Social Insurance (2005); National Bureau of Statistics of China: Beijing, China, 2015. Available online: http://www.stats.gov.cn/tjsj/ndsj/2006/indexeh.htm (accessed on 1 October 2015).
  40. Irfani, T.H. The Prevalence of Occupational Injuries and Illnesses in ASEAN: Comparison between Indonesia and Thailand. Public Health Indonesia. 2015, 1, 19–29. [Google Scholar]
  41. International Labour Organization (ILO). Occupational Injuries-8a Cases of Injury with Lost Workdays, by Economic Activity in 1997 of Indonesia; ILO: Geneva, Switzerland, 2014; Available online: http://laborsta.ilo.org/STP/guest (accessed on 1 October 2015).
  42. National Bureau of Statistics of China. China Statistical Yearbook 2006: Average Wage of Staff and Workers by Sector in Detail (2005); National Bureau of Statistics of China: Beijing, China, 2015. Available online: http://www.stats.gov.cn/tjsj/ndsj/2006/indexeh.htm (accessed on 1 October 2015).
  43. Kuwamori, H.; Uchida, Y.; Tamamura, C. Compilation of the 2005 Asian International Input-Output Table. Available online: https://jgea.org/resources/download/6580.pdf (accessed on 1 October 2015).
  44. International Labour Organization (ILO). Wages by Economic Activity of Japan in 2005; International Labour Organization’s (ILO): Geneva, Switzerland, 2014; Available online: http://laborsta.ilo.org/STP/guest (accessed on 1 October 2015).
  45. Xu, M.; Williams, E.; Allenby, B. Assessing Environmental Impacts Embodied in Manufacturing and Labor Input for China–U.S. Trade. Environ. Sci. Technol. 2010, 44, 567–573. [Google Scholar] [CrossRef] [PubMed]
  46. U.S. Bureau of Labor Statistics. Case and Demographic Characteristics for Work-related Injuries and Illnesses Involving Days Away From Work; U.S. Department of Labor: Washington, DC, USA, 2006. Available online: http://www.bls.gov/iif/oshcdnew2006.htm#06Supplemental_Tables (accessed on 1 February 2016).
  47. Bacchetta, M.; Ernst, E.; Bustamante, J.P. Globalization and Informal Jobs in Developing Countries; International Labour Office (ILO) and World Trade Organization (WTO): Geneva, Switzerland, 2009. [Google Scholar]
Figure 1. Comparison the total employment intensity from cradle to gate of 10 countries by economic sector.
Sustainability 08 01135 g001
Figure 2. Comparison the total employment footprint per capita for each country.
Sustainability 08 01135 g002
Figure 3. Comparison the paid worker intensity from cradle to gate of 10 countries by economic sector.
Sustainability 08 01135 g003
Figure 4. Comparison the paid worker footprint per capita for each country.
Sustainability 08 01135 g004
Figure 5. Comparison the vulnerable employment intensity from cradle to gate of 10 countriesby economic sector.
Sustainability 08 01135 g005
Figure 6. Comparison the vulnerable employment footprint per capita for each country.
Sustainability 08 01135 g006
Figure 7. Comparison the wages intensity from cradle to gate of 10 countries by economic sector.
Sustainability 08 01135 g007
Figure 8. Comparison the wages footprint per capita for each country.
Sustainability 08 01135 g008
Figure 9. Comparison the non-fatal occupational intensity from cradle to gate of 10 countries by economic sector.
Sustainability 08 01135 g009
Figure 10. Comparison the non-fatal occupational injuries footprint per capita for each country.
Sustainability 08 01135 g010
Figure 11. Comparison the fatal occupational intensity from cradle to gate of 10 countries by economic sector.
Sustainability 08 01135 g011
Figure 12. Comparison the fatal occupational injuries footprint per capita for each country.
Sustainability 08 01135 g012

