Article

A Social-Ecological Resilience Assessment and Governance Guide for Urbanization Processes in East China

1
State Key Laboratory of Pollution Control and Resources Reuse, School of the Environment, Nanjing University, Nanjing 210023 China
2
Key Laboratory of Coastal and Wetland Ecosystems (Ministry of Education), College of the Environment & Ecology, Xiamen University, Xiamen 361102, China
*
Author to whom correspondence should be addressed.
Sustainability 2016, 8(11), 1101; https://doi.org/10.3390/su8111101
Submission received: 14 July 2016 / Revised: 30 September 2016 / Accepted: 21 October 2016 / Published: 28 October 2016

Abstract

:
This article presents a social-ecological resilience assessment and attempts to explicitly examine the impacts of urbanization on resilience, with a view to explore how to strengthen social-ecological governance of the resilience of urban ecosystems. We use a combined Grey-Fuzzy evaluation model to discuss a case study of the Su-Xi-Chang city cluster, a metropolitan area in East China, in which total social-ecological resilience scores generally exhibited an upward trend, from 0.548 in 2001 to 0.760 in 2013. In the same period, resilience increased in relation to deterioration of environmental quality, pollution discharge, and landscape and ecological governance change, but decreased in relation to social-economic development. Besides, different contributions of indicators to their related resilience values reveal the heterogeneity of the resilience in terms of various disturbances. In addition, several scenarios are posited in an attempt to detect the relationship between social-ecological resilience and urbanization with the goal of improving urban governance. The results suggested that rapid urbanization under rigid and vertically organized forms of governance would cause the social-ecological system to lose resilience, or even to bring it near collapse. When the growth rate of urban land expansion reaches 16%, disturbances caused by urbanization would push the social-ecological system over a particular threshold, where the way it functions changes. However, it is found that adaptive and collaborative governance, incorporating increases in both public participation and the efficiency of environment administration, would strengthen social-ecological governance of resilience to provide the urban system with a wide operating space, and even with accelerated urbanization ratios.

1. Introduction

Urban expansion is occurring rapidly all over the world, especially in developing countries [1,2]. Urbanization affects ecosystem functions and services through loss of habit, biomass, and carbon storage [3,4,5,6], which can influence the resilience of urban ecosystems [7,8,9]. Cities across the world face many challenges related to expansion due to the sharp contradiction between ecological limits and urban development, and it is important, therefore, to search for new understandings of urbanization and governance in order to regulate the existing dysfunction towards sustainability. It has been argued that an approach that relies on governing resilience in order to meet ongoing challenges is most effective [10] when it is used in the context of increasing urbanization [11].
Resilience is a unifying concept in a number of disciplines linked to the sustainability sciences [12]. However, resilience and sustainability are two different perspectives. In general, resilience thinking emphasizes adaption of the system to change instead of sustainability’s focus on conservation and mitigation [13]. Definitions of resilience vary between two extremes, with most definitions attempting to achieve a balance between them [14]; resilience is seen as the ability of a system to “bounce back” after stress [15,16], and the capacity of systems to adapt or transform in response to unfamiliar and unexpected shocks [17,18]. In the last decade, the resilience lens broadened its application to social-ecological system [17,19], emphasizing the domains of attraction, alternative stable states, and the need for persistence under varying levels of unpredictable disturbance [12]. The concept of the adaptive cycle is central to social-ecological resilience which describes the general characteristics of dynamic change in ecosystems as comprising four phases: exploitation, conservation, release and reorganization [17]. Sustainable development is about creating and maintaining our options for prosperous social and economic development [20]. Social-ecological resilience with its focus on the governance of linked social-ecological systems is of interest to the strategies for better understanding complex feedbacks from habitat mosaics, species assemblages, and other components of ecosystems [21,22].
Urbanization design is still unclear with respect to future locations, institutions, and rates of urban expansion [5,23], and predictions of how urbanization affects the functioning of urban ecosystems. The definitions related to resilience are helpful in our roles as analysts, change agents, or stakeholders, because we need not only to understand social-ecological resilience in terms of both the resilience of what (values and levels) and the resilience to what (disturbances), but also to determine how social-ecological resilience can be perceived in light of rapid urbanization and unpredictable changes. A resilience assessment builds on theoretical foundations to offer guidance, which can support an understanding of system dynamics in order to inform management interventions [24,25,26]. As helpful and instructive as previous studies are for the development of governance of resilience in urban systems, most of these studies focus on the empirical analysis of species or community dynamics (e.g., natural resources, disaster resilience, economic resilience) [27,28,29,30], or restrict their aims to quantifying the specific impact of urbanization procedure such as population agglomeration, land conversion or regime change [31,32]. However, these aspects are intertwined in that they affect social-ecological resilience. To the best of our knowledge, there have been no efforts in investigating the fixed impacts of urbanization procedures on resilience, including urban population growth, urban land expansion, and social-ecological governance.
Resilience thinking would not presume ‘sufficient knowledge’, but the recognition of ignorance [16]. Therefore, the present study utilizes social, economic, environmental statistical data to present a quantitative assessment for social-ecological resilience by applying a combined Grey-Fuzzy model [33,34] which can identify resilience levels and the heterogeneity of resilience. In addition, we posit several scenarios, revealing the gaps and opportunities that, when acted upon, will guide social-ecological governance of the resilience of the urban ecosystem in the context of rapid urbanization, simultaneously with urban population growth and land expansion. According to our findings, this study proposes a theoretical and practical guide to inform the governance strategies of social-ecological resilience in future urban development.

2. Materials and Methods
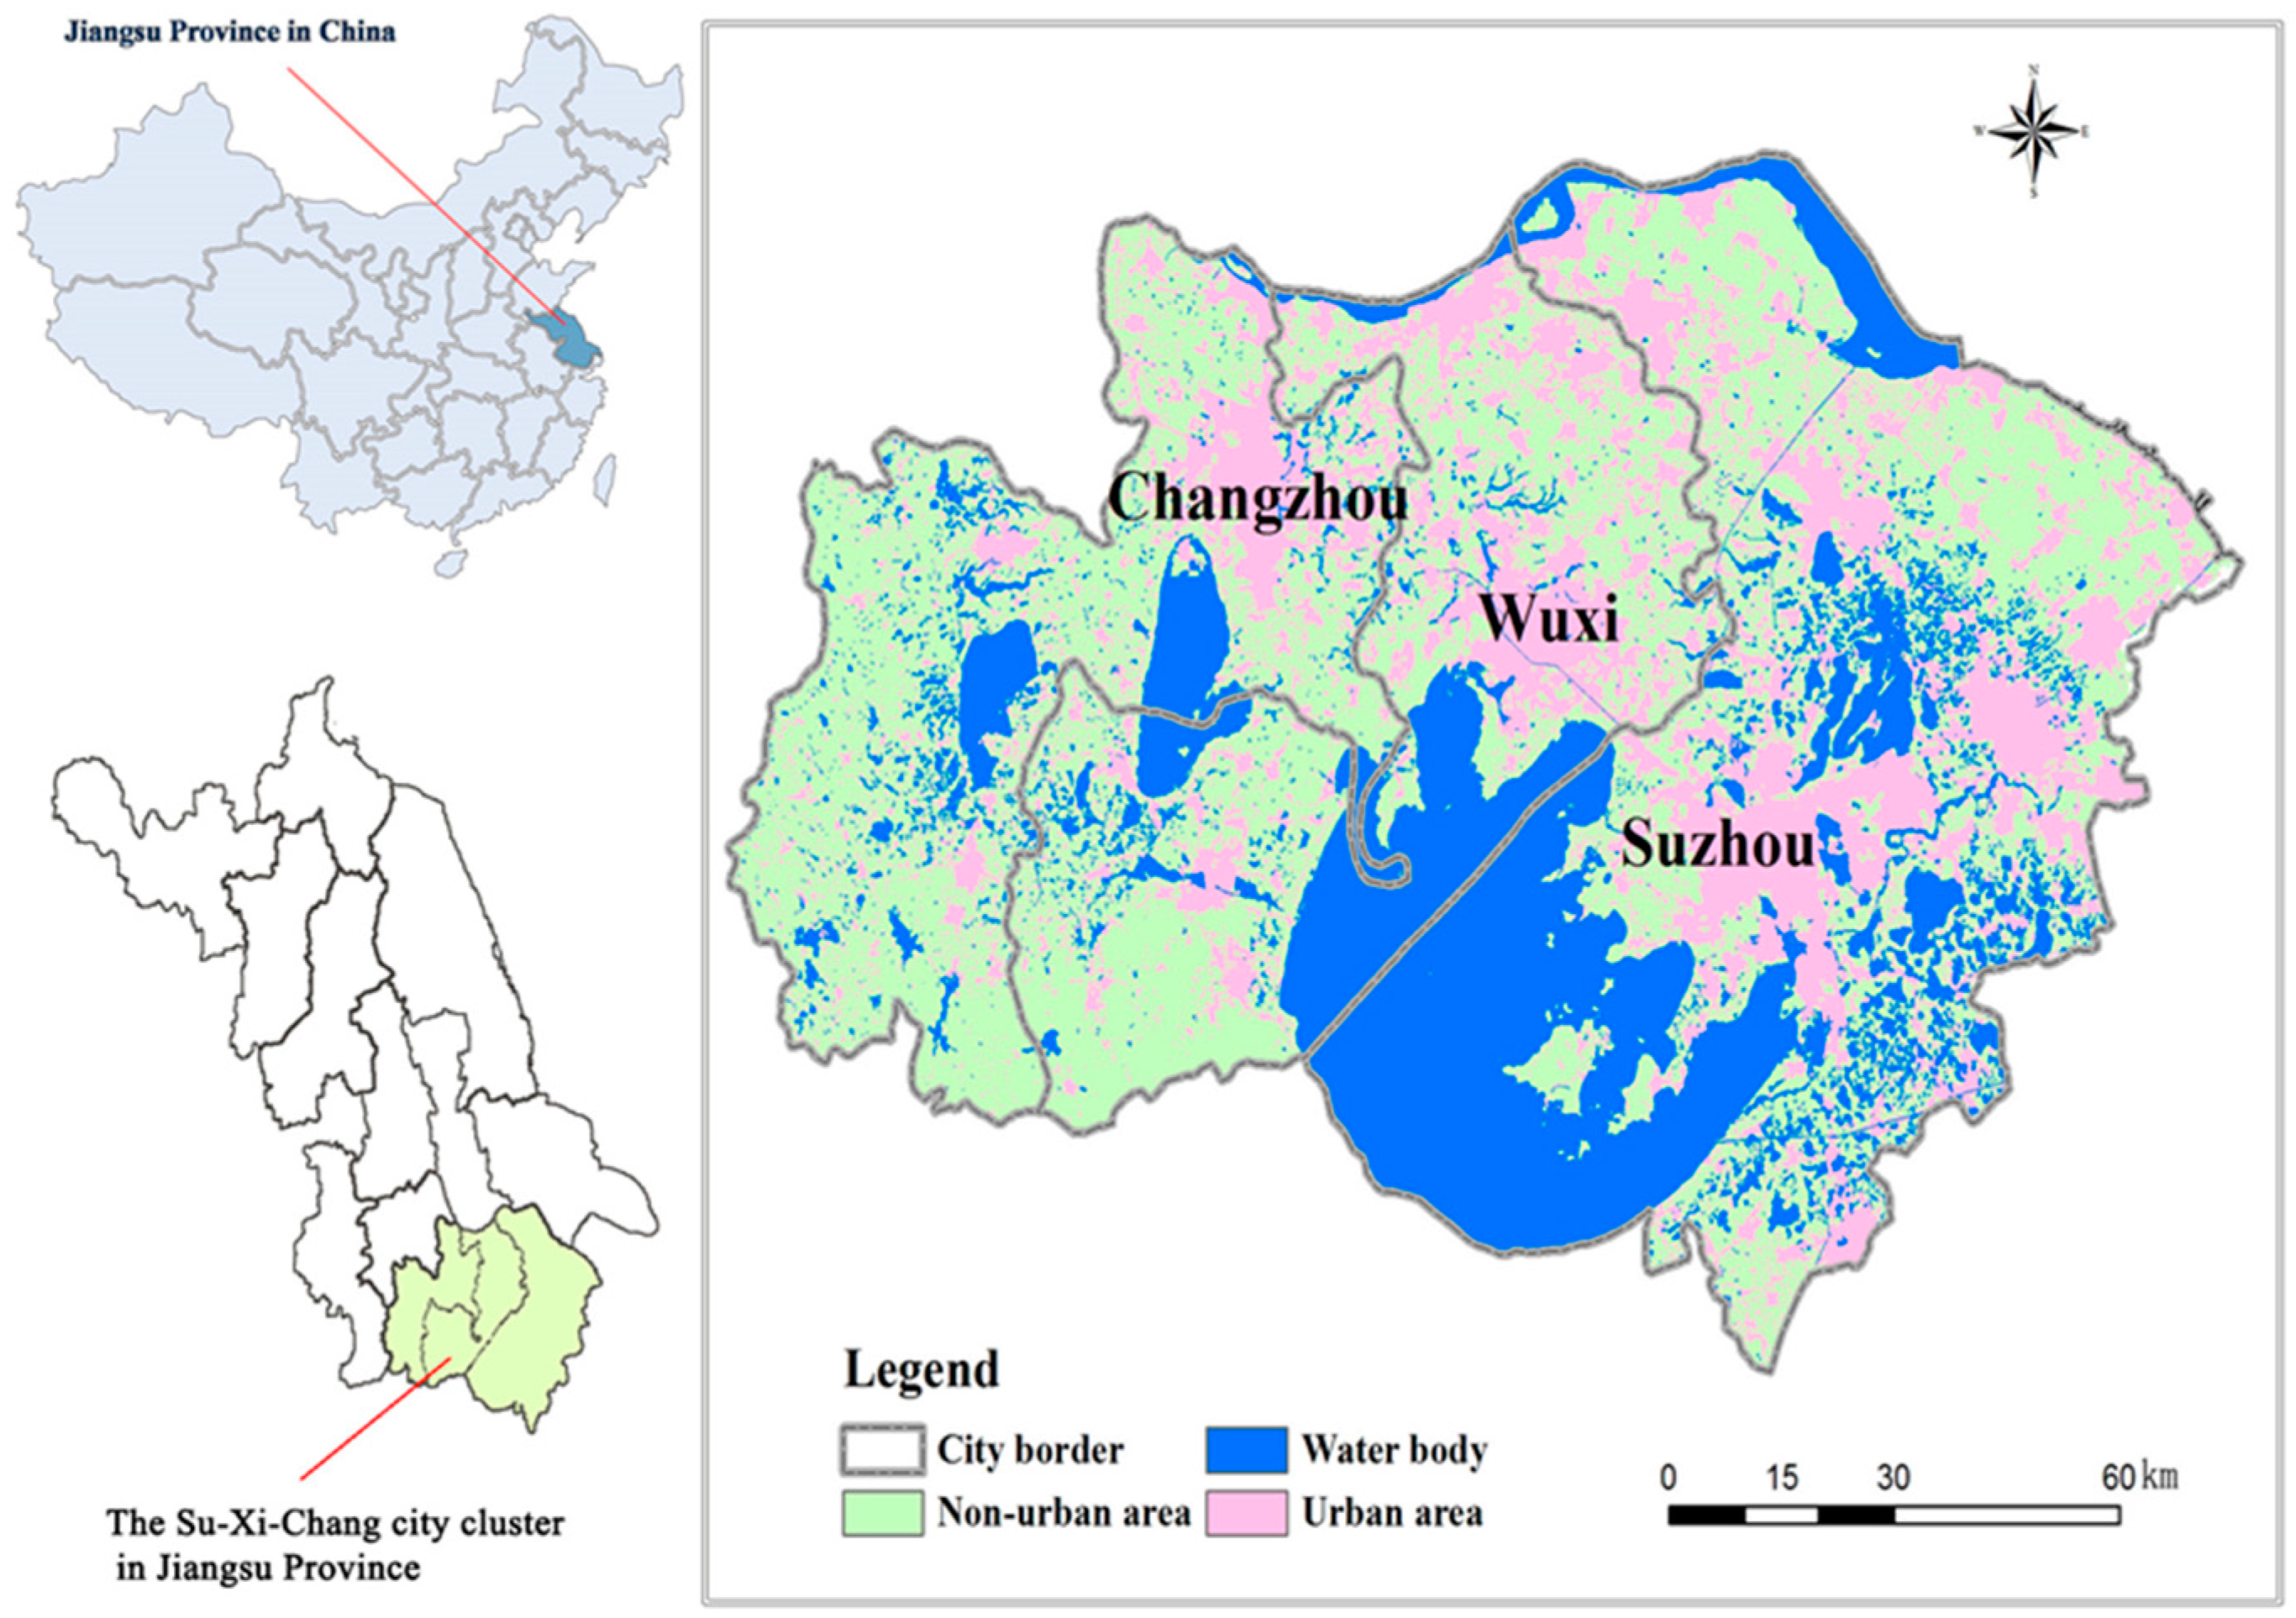
2.1. Study Area

Situated in the eastern coastal economic belt of China (Figure 1), the region of Suzhou, Wuxi, and Changzhou (Su-Xi-Chang), a large city cluster has contributed significantly to the economic growth of Jiangsu Province. The annual gross domestic product (GDP) increased rapidly from 26.87 thousand CNY in 2001 to 114.25 thousand CNY in 2013, far beyond provincial average levels (Figure 2). Following development of the economy, its demographic urbanization level increased from 39.79% in 2001 to 78.22% in 2013, and its land urbanization level grew significantly, from 6.84% in 2001 to 18.83% in 2014 (Figure 3). As of today, China is developing according to its own interpretation of ecological modernization with environmental governance [35,36,37]. In the fierce urban expansion process, environmental problems often remain unidentified in a study region, as there is some uncertainty about which department has official jurisdiction over these issues, and public participation in environmental initiatives is limited. In addition, the local governing system consists of a loose ensemble of institutions, which are increasingly driven by divergent interests. Therefore, significant challenges exist because socio-ecological governance in the region relies on urban planning that lacks scientific content, coordination, and strategy.

2.2. Index of the Social-Ecological Resilience Assessment

Social-ecological resilience refers to the capacity of a social-ecological system that generally allows it to absorb disturbances of all kinds, regenerate, and remain in a desirable state; additionally, it also refers to people’s ability to adapt and maintain the resilience of the system [24]. Walker and Salt [38] state that “resilience is an emergent property that applies in different ways and in the different domains that make up our system; it is contextual and it depends on which part of the system you are looking at and what questions you are asking.” This study focuses on the social-ecological resilience of some specified parts of urban ecosystem, coupled with economic, social, and ecological systems in terms of various disturbances. Some disturbances are frequent, as we know and expect, such as fires, floods, resource consumption, and pollution emissions. The ecosystem has evolved mechanisms to strengthen its resilience in order to absorb these kinds of disturbances. Gradually, the system adapts to these disturbances and deals with them effectively. And it would lead to a loss of resilience. Besides, some other disturbances are more rare and are significantly larger in magnitude, although they might often be similar types as frequent disturbances. These kinds of disturbances can swamp the resilience of the system and reconfigure it. For example, the decease of arable land and woodlands are mainly converted into residential and industrial land in the process of urban land expansion, which leads to a fundamental change in the functions and services of the original ecosystems. Furthermore, there are disturbances that cannot be predicted. A good way of exploring strategies for resilience governance is to review the history of a system in terms of disturbances and to identify the items that have caused a great deal of influence on resilience in the past [39].
Experience from a succession of workshops on assessing resilience suggests that an appropriate process for describing the system is to work through some steps as shown in Table 1. To assess and manage the resilience of social-ecological system, it is vital to identify the characteristics of the systems that are of concerns to stakeholders. According to the identified items, the present case study, therefore, presents a hierarchical structure index system for resilience assessment (Table 2). In the index system, the resilience of the ecological domain focuses on anthropogenic pollution load, urban environmental quality and urban landscape patterns; the resilience of the socio-ecological domain focuses on urban population growth, quality of life, economic structures and activities, and social-ecological governance. These items not only form the baseline indicators of social-ecological resilience, but can also be used to measure the forces contributing to the strengthening or weakening of resilience. The indicators for resilience assessment are selected based on the principles of integrity, simplicity, independence, and data availability, and a strategic explanation of resilience items as its goal.
In the present research, we collected relevant data from the Statistical Yearbooks of Wuxi, Suzhou, and Changzhou (2001–2013), the Environment Statistical Bulletin of Jiangsu Province, and the Water Quality Bulletin of the Provincial Boundaries of Taihu Lake Basin. SPSS 20.0 was used to undertake principal component analysis (PCA) [40,41] in order to holistically convert a large dataset of originally-correlated variables into the principal components of resilience. On this basis, each evaluation criteria layer was weighted according to its relative importance using analytic hierarchy process (AHP) [42]. Furthermore, a composed Grey-Fuzzy model, based on grey correlation analysis and fuzzy hierarchy evaluation was performed. This model enables us to comprehensively evaluate the long-term levels of social-ecological resilience.
The default standardization method of SPSS is applied to calculate z-scores in order to eliminate the influence of the dimension and magnitude of unprocessed data.
That is:
Z ij = ( x ij - x i ) / s i
where Z ij is the standardized variable values; x ij is the actual variable value; x i is the variable (indicators) of arithmetic mean; and s i is the standard deviation.

2.3. Principal Component Analysis of Criteria Layers

PCA forms a new mutually uncorrelated composite index to replace the original index [43,44], and, thus, reduces the dimensionality of the indicators. Consequently, a large dataset of original variables is converted into a smaller set of variables with a minimal loss of original information [45]. All statistical tests were performed using SPSS 20, and the scores show the extent to which the criteria layers of pollution discharge, environmental quality, landscape pattern, social-economic development, and social-ecological governance are related to social-ecological resilience.

2.4. Comprehensive Evaluation by Composed Grey-Fuzzy Model

The Grey-Fuzzy composite evaluation can assess fuzzy factors where insufficient information is available [46]. By linking the Grey system theory and fuzzy evaluation method, we can reduce the influence of subjective factors. More importantly, this method can be quantitatively defined and divided in to the following steps.

2.4.1. Determining the Membership Grade Based on the Grey Correlation Coefficient

The optimal index set was determined according to Equation (2).
y * = ( y 1 * , y 2 * , , y m * )
where y i * ( i = 1 , 2 , , m ) are the annual values of the resilience criteria-layers; therefore, we can construct the initial matrix E:
E = [ y 1 * y 2 * y m * y 11 y 12 y 1 m y 21 y 22 y 2 m y n 1 y n 2 y nm ]
where Y ji is the actual measurement value for the ith evaluation factor in the j-th year. For factor ‘i’, y i min refers to the minimum value of y i and y i max refers to the maximum value of y i , which can be further given as:
A ji = y ji - y i min y i max - y i min   i = 1 , 2 , , m ;   j = 1 , 2 , , n
The Grey correlation coefficient was acquired using the membership functions η j ( i ) , which can be determined using Equation (5).
η j ( i ) = min j   min i | y i * y ji | + ρ   max j   max i | y i * y ji | | y i * y ji | + ρ   max j   max i | y i * y ji | ( i = 1 , 2 , , m ;   j = 1 , 2 , , n ) ;
where y ji is the actual measurement value for the ith evaluation factor in the jth year, and y i * is the priority value of the evaluation factor, ρ [0, 1], ρ = 0.5.
After calculating the membership grades of all evaluation factors, we established the single factor fuzzy judgment matrix using Equation (6).
R = [ η 1 ( 1 ) η 2 ( 1 ) η n ( 1 ) η 1 ( 2 ) η 1 ( 2 ) η n ( 2 ) η 1 ( m ) η 1 ( m ) η 1 ( m ) ] m n
where R is the evaluation matrix of the integrated resilience.

2.4.2. Determining the Weight

To account for the different effects of each factor, using AHP [47,48], we assigned a specific weight to each factor and then created a weight matrix (W) for all evaluation factors, which was achieved in the design of matrix J = (Aij)n*n:
J = ( A ij ) n n = [ A 11 A 1 n A n 1 A n n ]
where, Aij is the mean value (scored by experts) for distinguishing the importance of indicator i relative to indicator j. After the consistency test, the eigenvector of the largest eigenvalue is determined as the index weight:
W = (W1, W2, …, Wn)

2.4.3. Assessing the Fuzzy Composite

The result for the combined reduction technologies were acquired using Equations (9) and (10).
B = W × R
B × C = V
where B is the fuzzy vector of the evaluation results, C is the column vector of each criteria layer, and V consists of the values indicating the overall resilience levels from 2001 to 2013.

2.5. Scenario Analysis and Predictions

Understanding the interplay between thresholds and the linkages between resilience and urbanization is critical in understanding the socio-ecological resilience of urban system in the context of urbanization process. Whereas resilience management has been practiced as a part of urban governance for some time, adaptive design remains a largely untested idea in urban planning, and requires a higher level of transdisciplinary collaboration than that which is currently practiced by the local government. Accordingly, we propose a scenario simulation analysis, for which different scenarios and parameterizations are designed to account for variations in social-ecological resilience, in order to detect the linkages between resilience and urbanization. Measurements, given by regression analysis [49], performed using SPSS 20, have to be chosen in order to identify the links between these different indices in order to increase understanding of how urbanization procedures can be best governed. These links cannot be considered as representing one-to-one, linear relationships, as changes in the region often result from a complex chain of interactions between resilience items.
Regression analysis is a powerful statistical process widely used for estimating the relationships among variables [50,51]. It includes many techniques for modelling and analysing several variables, when the focus is on the relationship between multi-independent variables. More specifically, regression analysis helps one understand how the typical value of the dependent variable changes when any one of the independent variables is varied, while the other independent variables are held fixed. In doing so, the proposed methodology analysed a set of typical indicators evaluated for each considered strategy, which included the urban population ratio (UPR), the growth rate of urban land expansion (ULG), environmental violation (ε1), eutrophication level (ε2), the GDP growth rate of environment administration (μ1), and the percentage of employees working in public administration and social organizations (μ2) (Table 3).

3. Results and Discussion

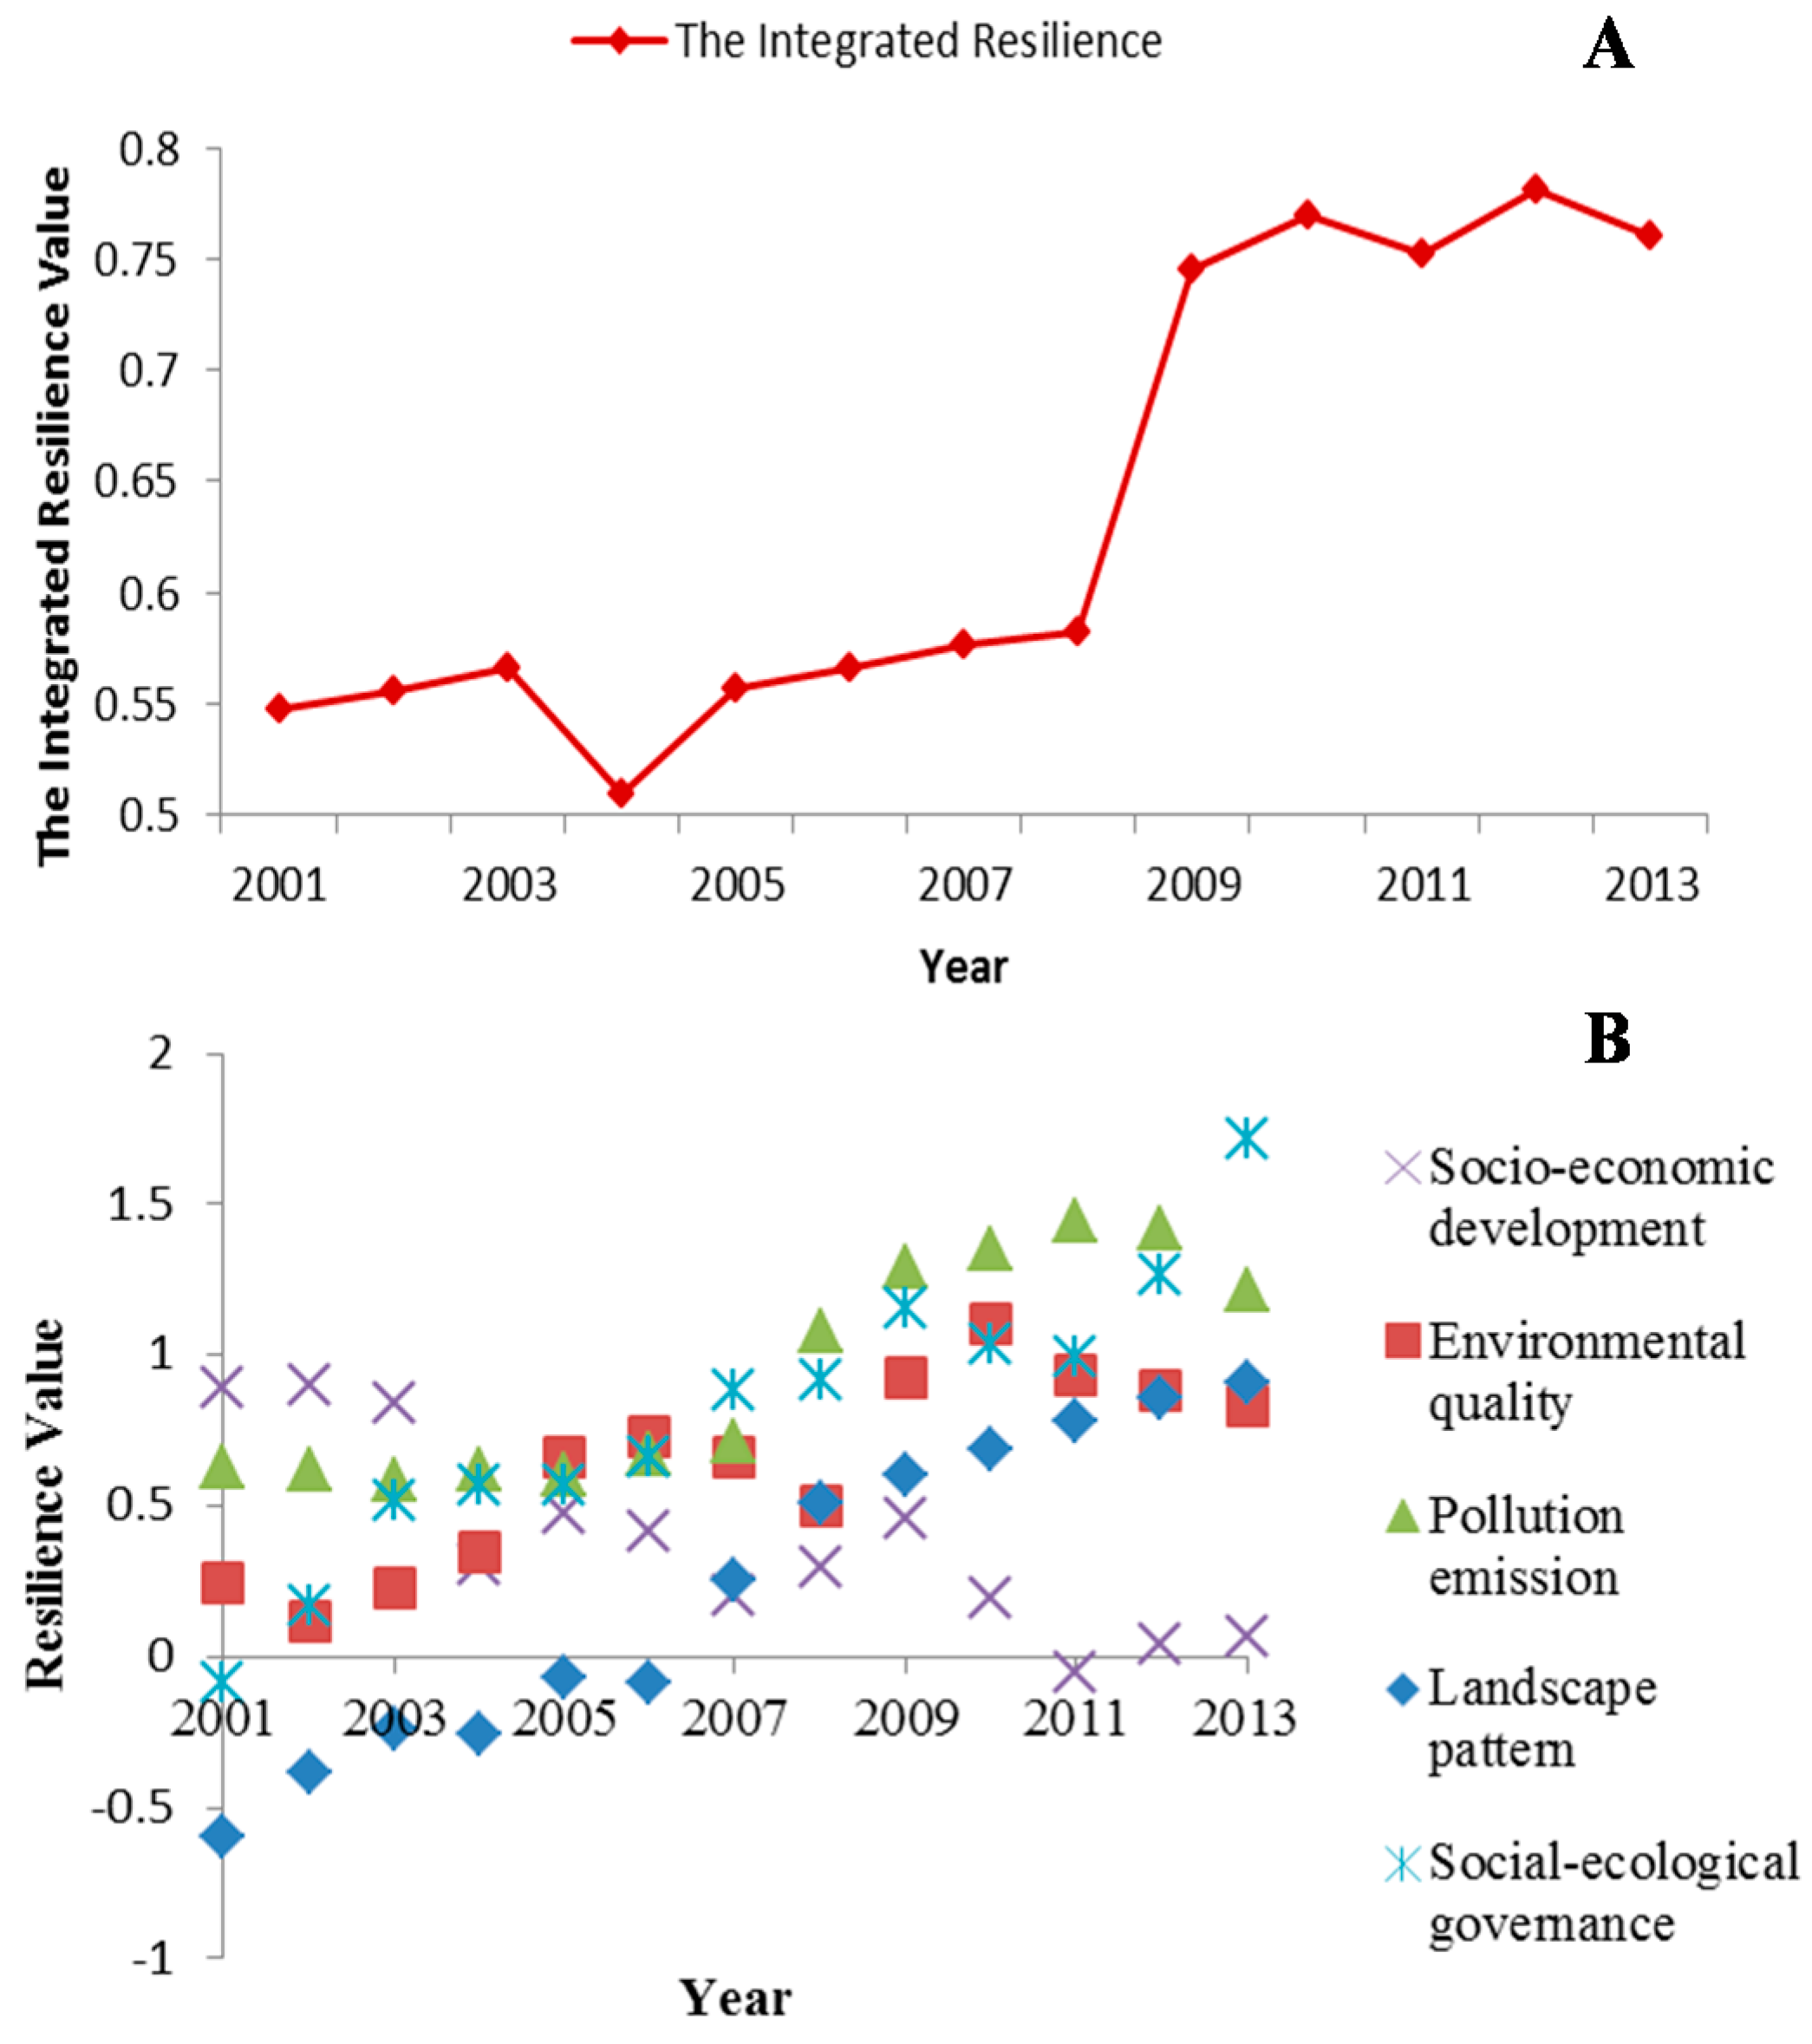
3.1. Resilience Levels

The total social-ecological resilience score of the Su-Xi-Chang city cluster generally exhibited an upward trend from 0.548 in 2001 to 0.760 in 2013, signifying a period of adaptive evolution, as illustrated in Figure 4A. A multiscale analysis of resilience is fundamental to an understanding of the dynamics and development of intertwined urban systems. In this study, the trend in integrated resilience resulted from the combined effect of all five aspects in the social-ecological system, as described in Figure 4B. From 2001 to 2013, resilience related to environmental quality, pollution emission, and landscape pattern and social-ecological governance increased by varying degrees, whereas resilience related to the social-economic development decreased. As shown in Table 2, the first principal component matrix of variables derived from the PCA presents the respective contributions of the indicators to the values of the sub-system’s resilience, using the scoring range: 0 = no impact up (down) to 1 (−1) = high impact. Specifically, the closer an indicator’s absolute value gets to 1, the greater its contribution to the values of the sub-system’s resilience. Different scores indicate the heterogeneity of the resilience in terms of various disturbances. More concretely, in response to relatively small disturbances that have relatively low scores, the social-ecosystem returns to “normal” with relative ease following the disturbances, such as discharge of solid waste, environmental violations and utmost highest/lowest temperature of the year. However, large or infrequent disturbances that have relative high scores might push the system into an undesirable state, a factor that should be given significant importance in resilience governance, such as fierce urban land expansion and a massive blue-algal bloom in Taihu Lake. Furthermore, the resilience from social-economic governance had been strengthened, but the score of employees in public administration and social organizations was as little as 0.051 in the first component of PCA. This suggests that public participation had a low effect on socio-ecological resilience governance during the period of 2001–2013, which conforms to the situation of the study area that lacked horizontal communication in the processes of decision-making, policy design, and implementation.

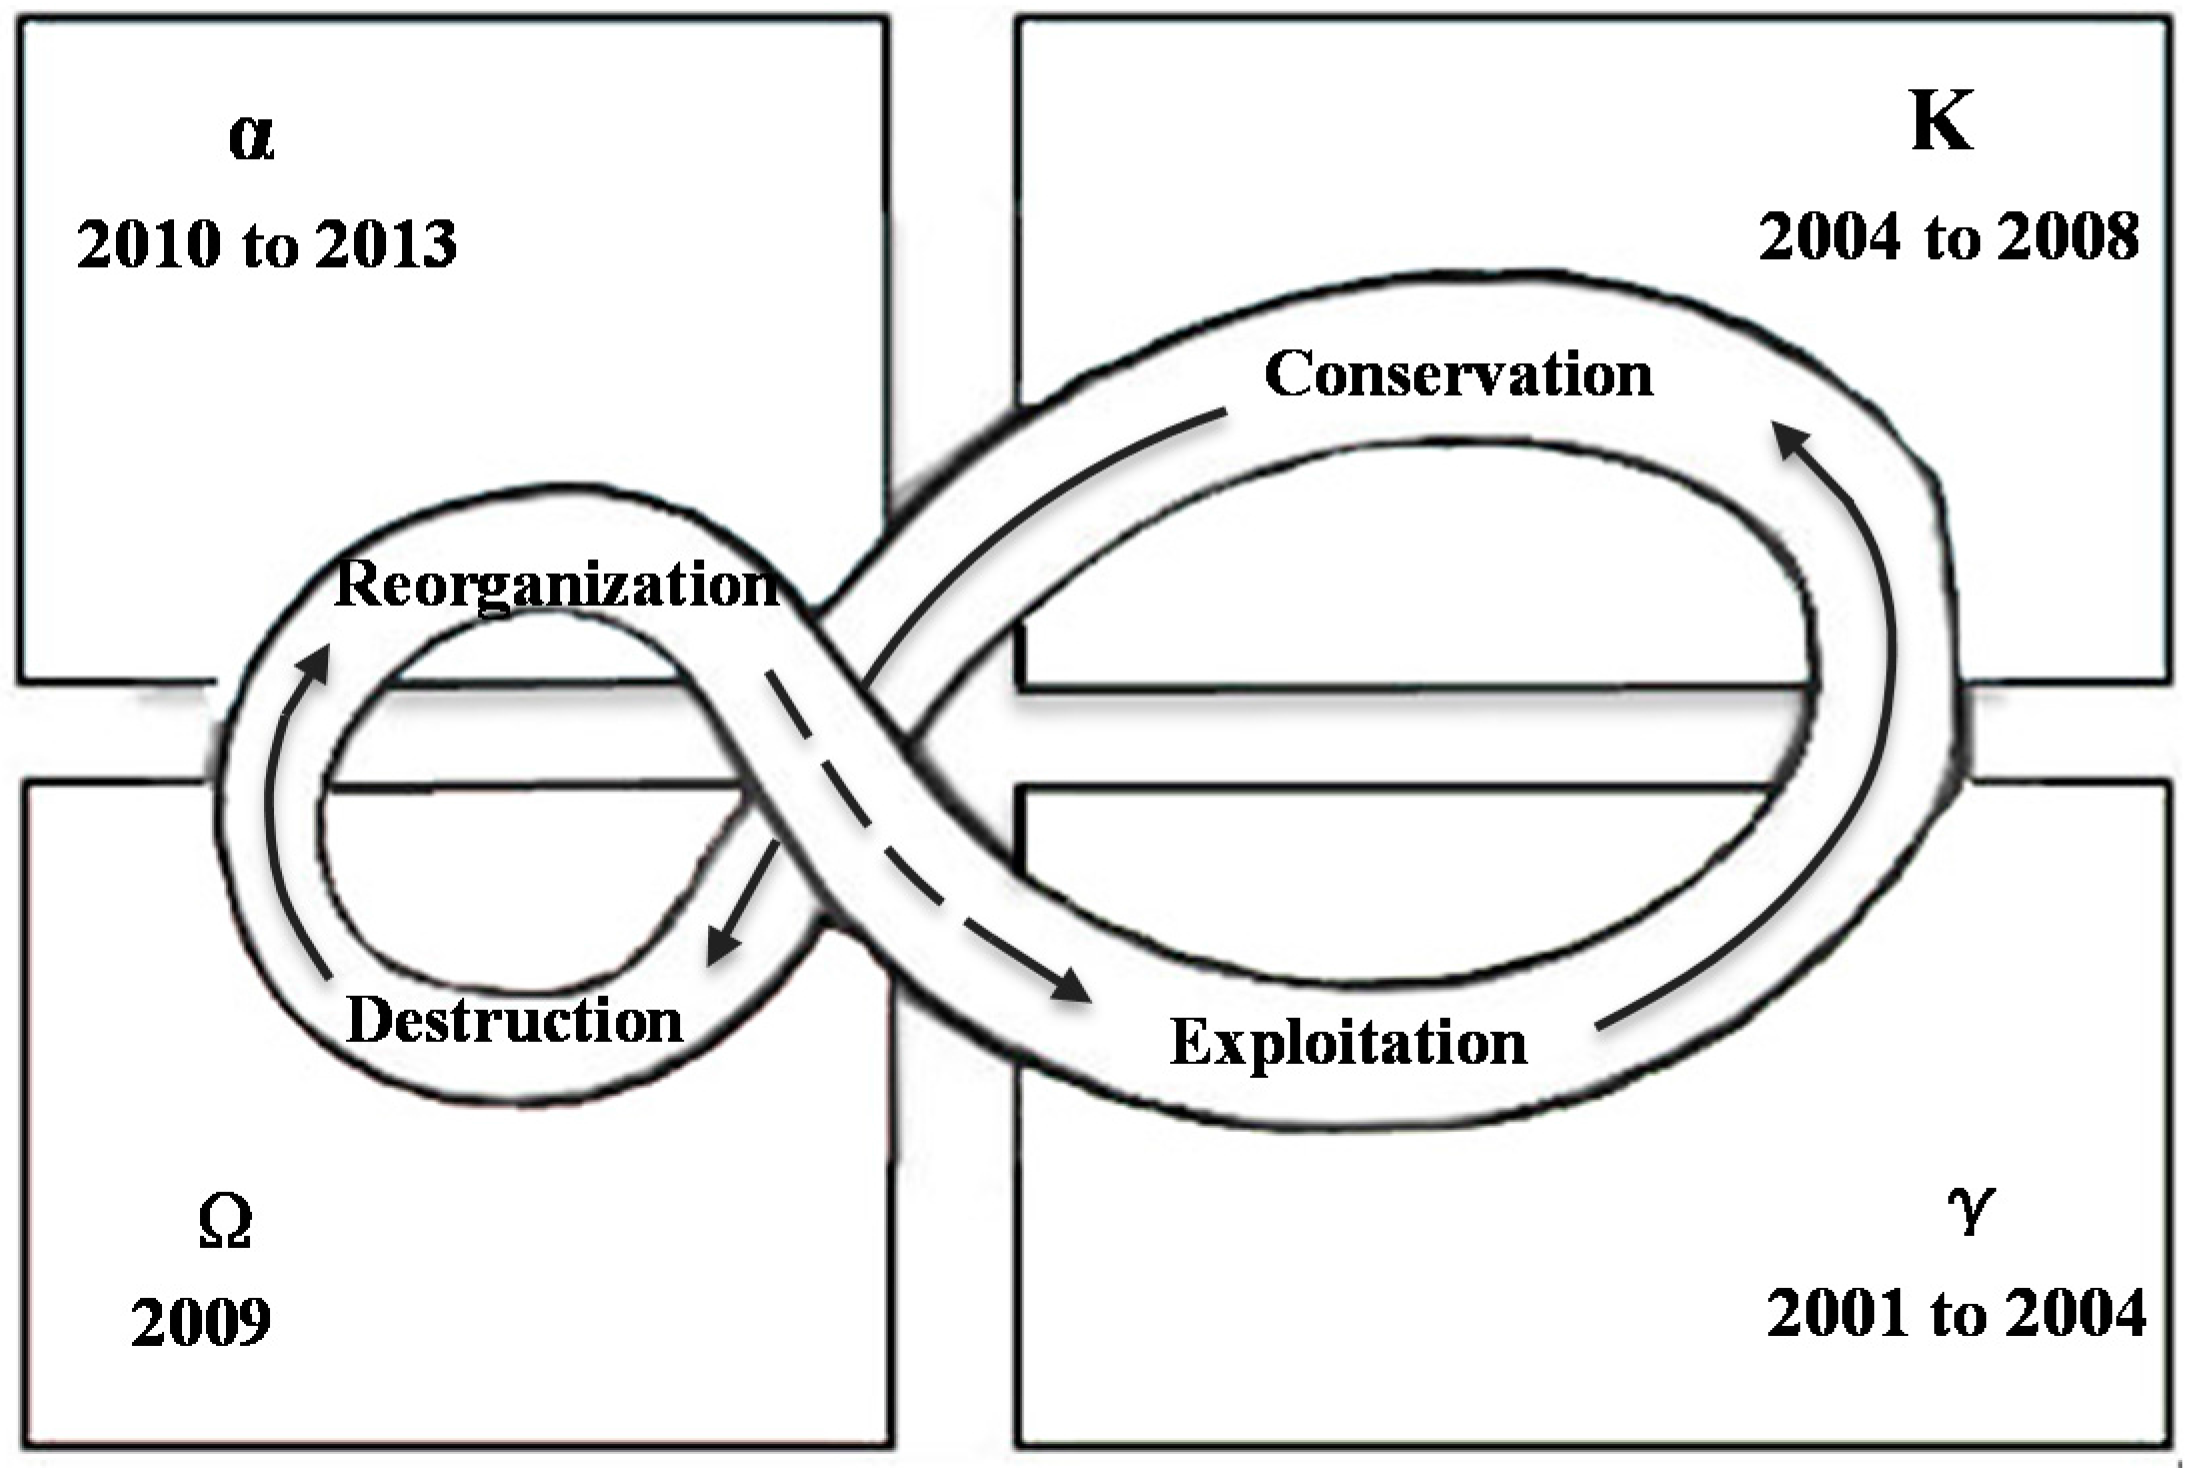
3.2. Resilience Dynamic

As urban systems are characterized by shifting contexts [52], they would appear to be amenable to the adaptive cycle model [53,54], which shows movement of a system through the four dynamic phases of exploitation, conservation, release, and reorganization [55,56]. According to adaptive cycle theory, the Su-Xi-Chang city cluster experienced, for the first phase, exploitation (γ), from 2001 to 2005, where resilience appeared as a wave-linked curve in 2003, after which resilience experienced a rapid growth. This led to a phase of conservation (K) from 2005 to 2008, where levels of resilience were maintained in a stable state. In 2009, the resilience value jumped suddenly to another level, signaling a stage of release (Ω). Finally, after 2009, a reorganization and renewal (α) took place, which saw resilience remaining at a high level. As a system passes through the stages of the adaptive cycle, its resilience is subject to change. The dynamics between periods of abrupt and gradual change, and the capacity to adapt, transform, and persist, are at the core of resilience in social-ecological systems [53]. Based on cluster analyses of resilience values during the period of 2001–2013, the social-ecological resilience in this case study was characterized by adaptability, persistence and transformability (Table 4). Generally, the intrinsic tendency to produce dynamic change is affected by blending in intricate ways given the effects of stochasticity, such as abnormal weather, economic fluctuations, floods, fires or some environmental violation events. When these disturbances occur, resilience may fluctuate as the social-ecosystem absorbs the disturbances and sustains itself by means of its adaptive competence and the accumulation of resources (γ). In the exploitation state (2001–2005), however, disturbances exploited new opportunities and resources available to the ecosystem, and resilience was enhanced, resulting in modifications to the response to the disturbances, leading the system being at a high connectivity and predominated by conservative components (K). In the subsequent conservation of the structure (2005–2008), disturbance-taking was no longer encouraged or even tolerated, and, consequently, resilience persisted in a relatively stable domain. Social-ecological systems may become very resilient in the face of frequent types of disturbances, but are rather weak with respect to infrequent disturbances [57]. In 2007, a rampant bloom of blue-green algae in Taihu caused the aquatic environment to deteriorate severely due to heavy eutrophication, leading to disastrous disruption and damage to ecosystem functions [58,59]. Moreover, in 2008 the government implemented “Land finance”, facilitating sharp urban land expansion in the study area, which, in turn, caused continued changes in land use, and a shortage of and pollution of water resources. As a result, levels of urban resilience suffered a phase of decline (Ω) before transforming and recovering in order to reach a new stability and healthy robustness (α). The γ-K transition is referred to as the front loop while the Ω to α transition is called the back loop in this representation of three-characteristic resilience. Illustrated in Figure 5, the two-loop dynamics of the adaptive cycle reflect the resilience of the urban system during the period of 2001–2013, either in the same or reorganized in a different configuration.

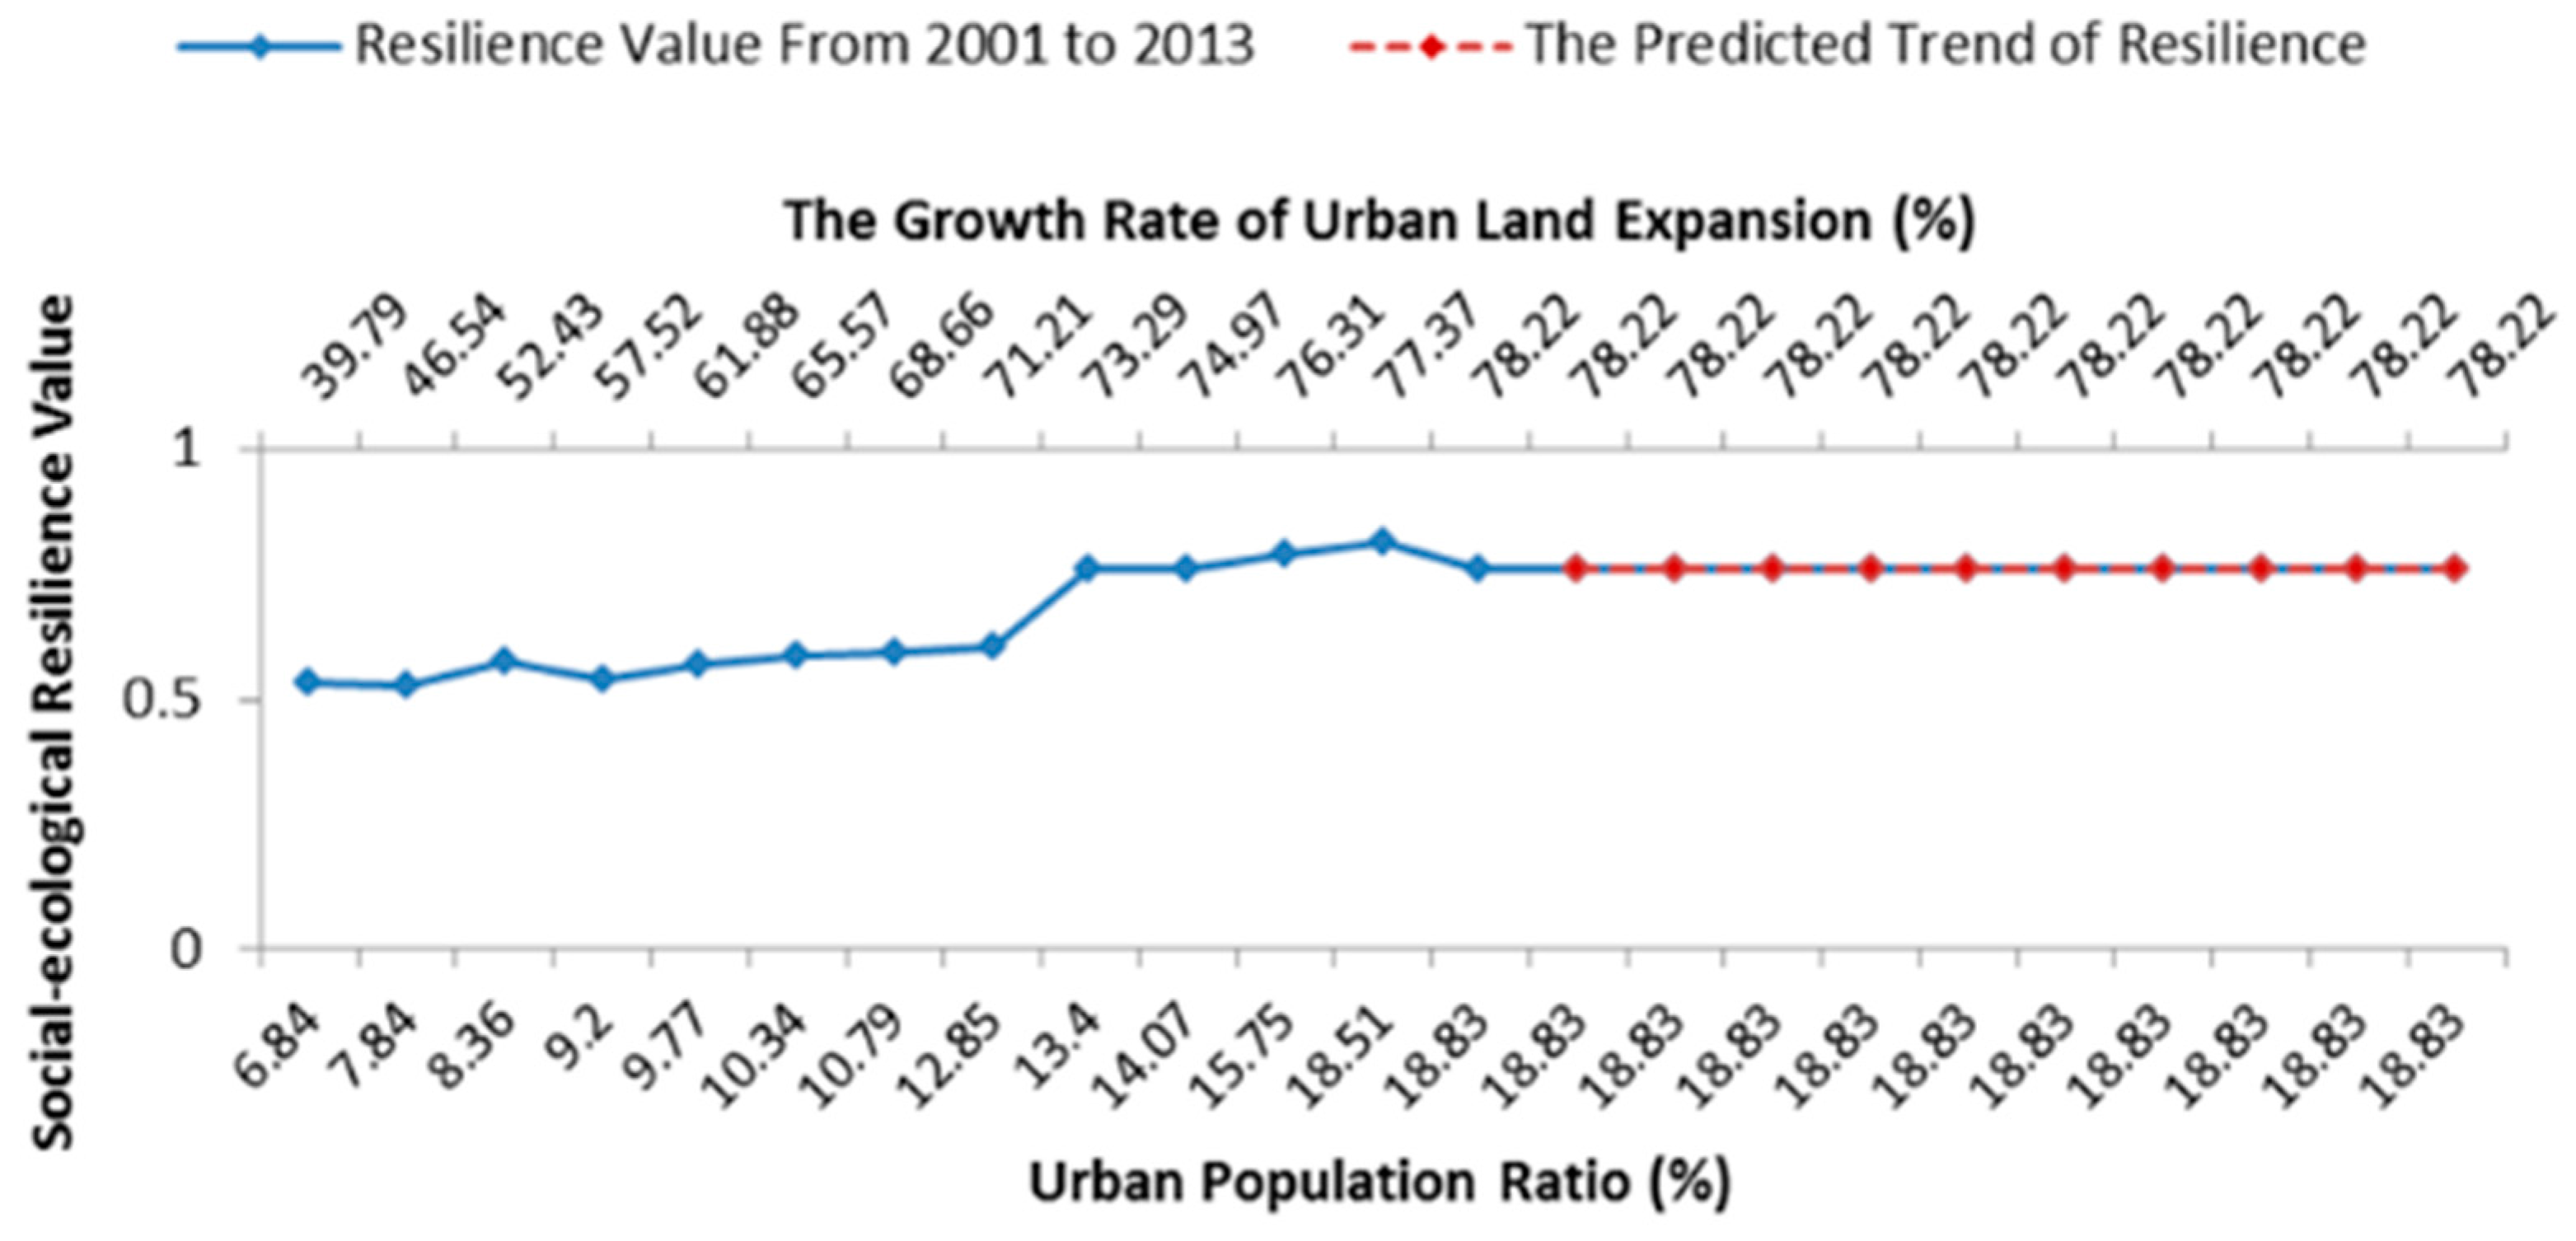
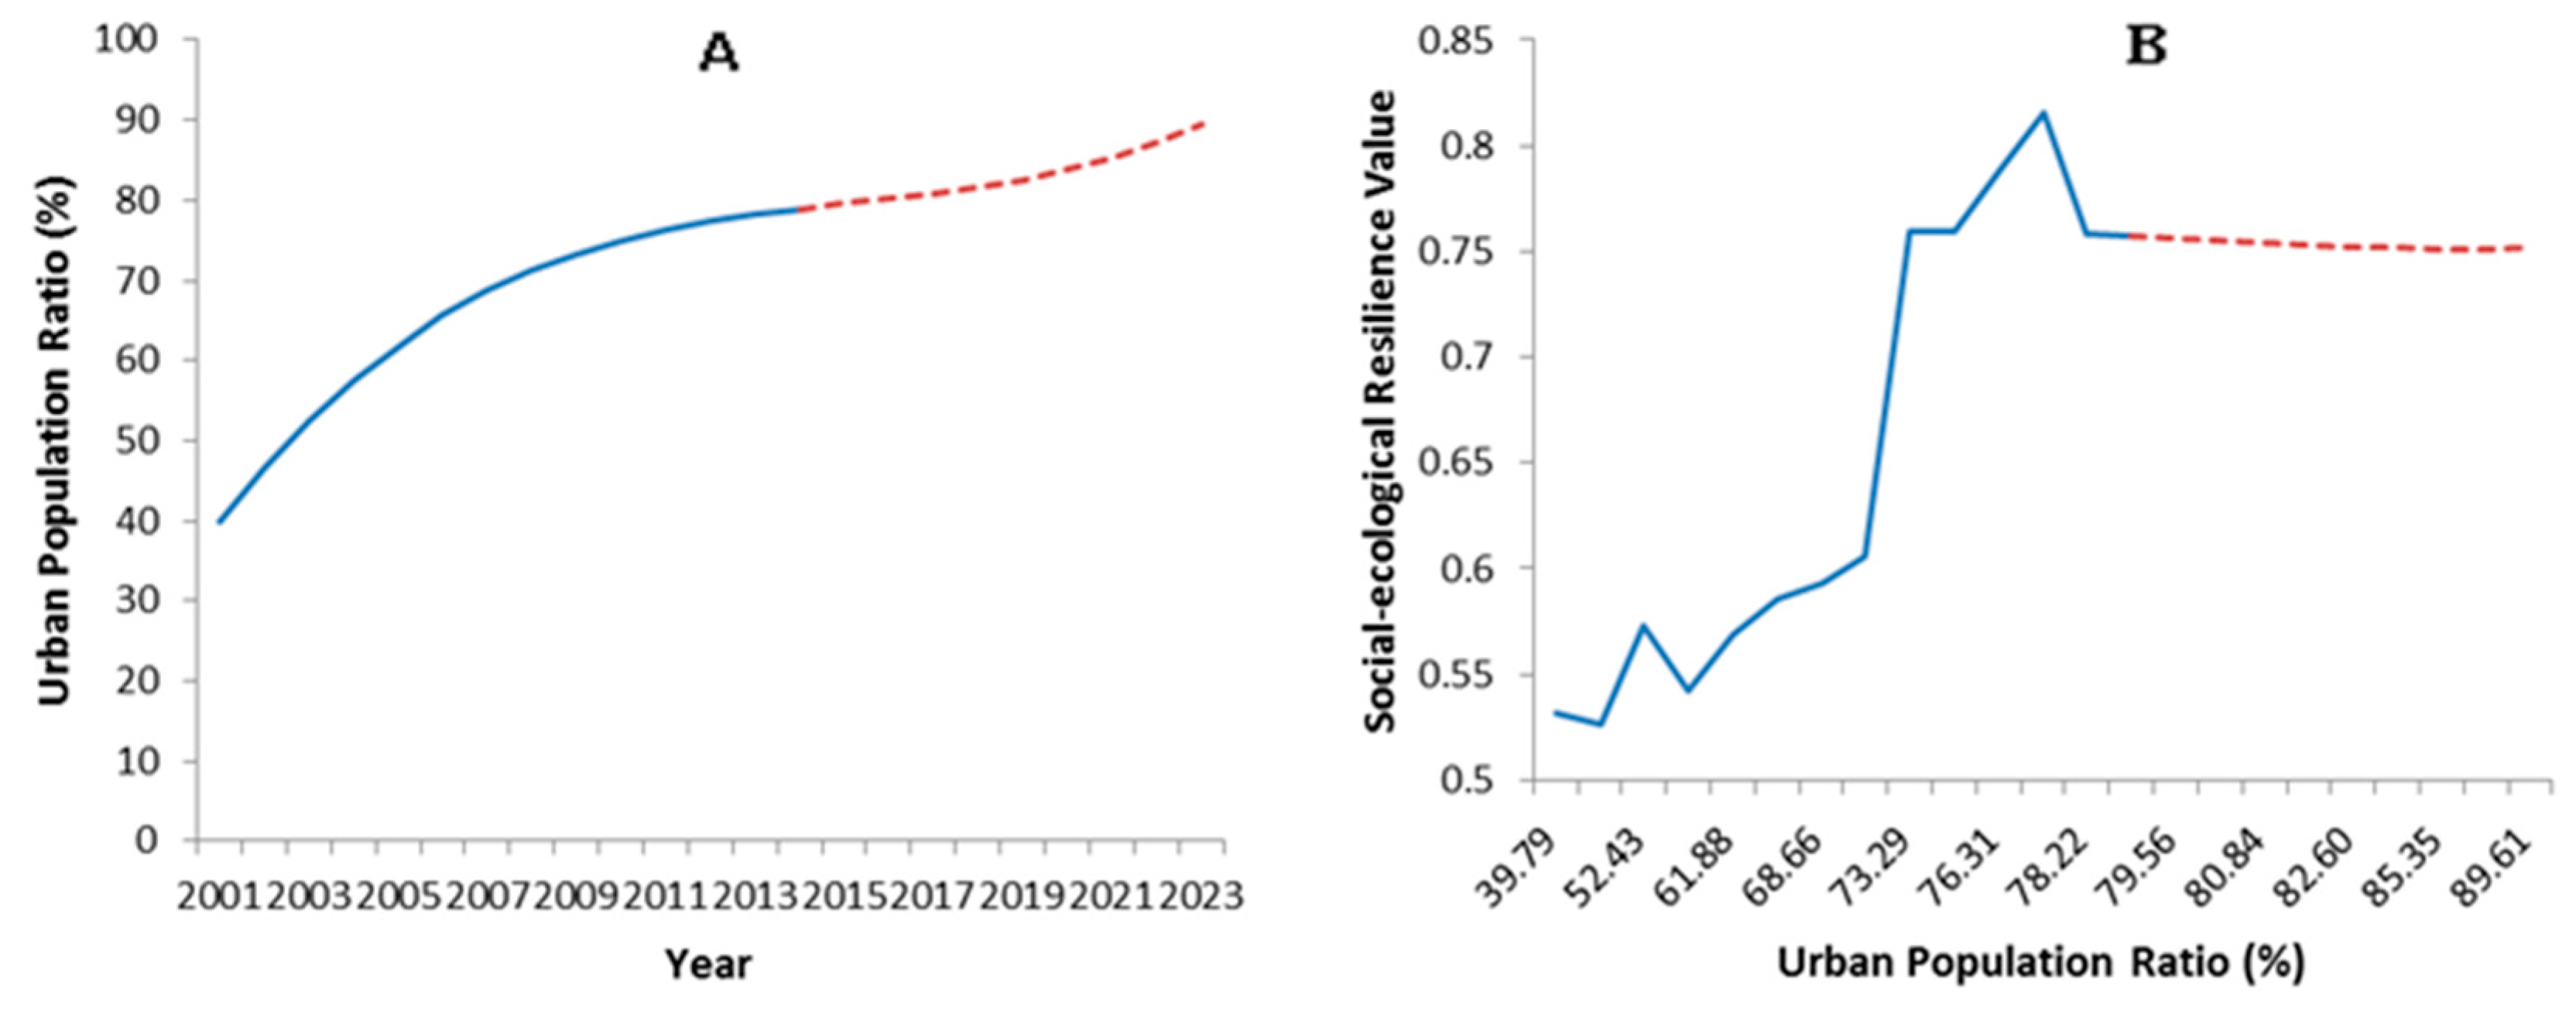
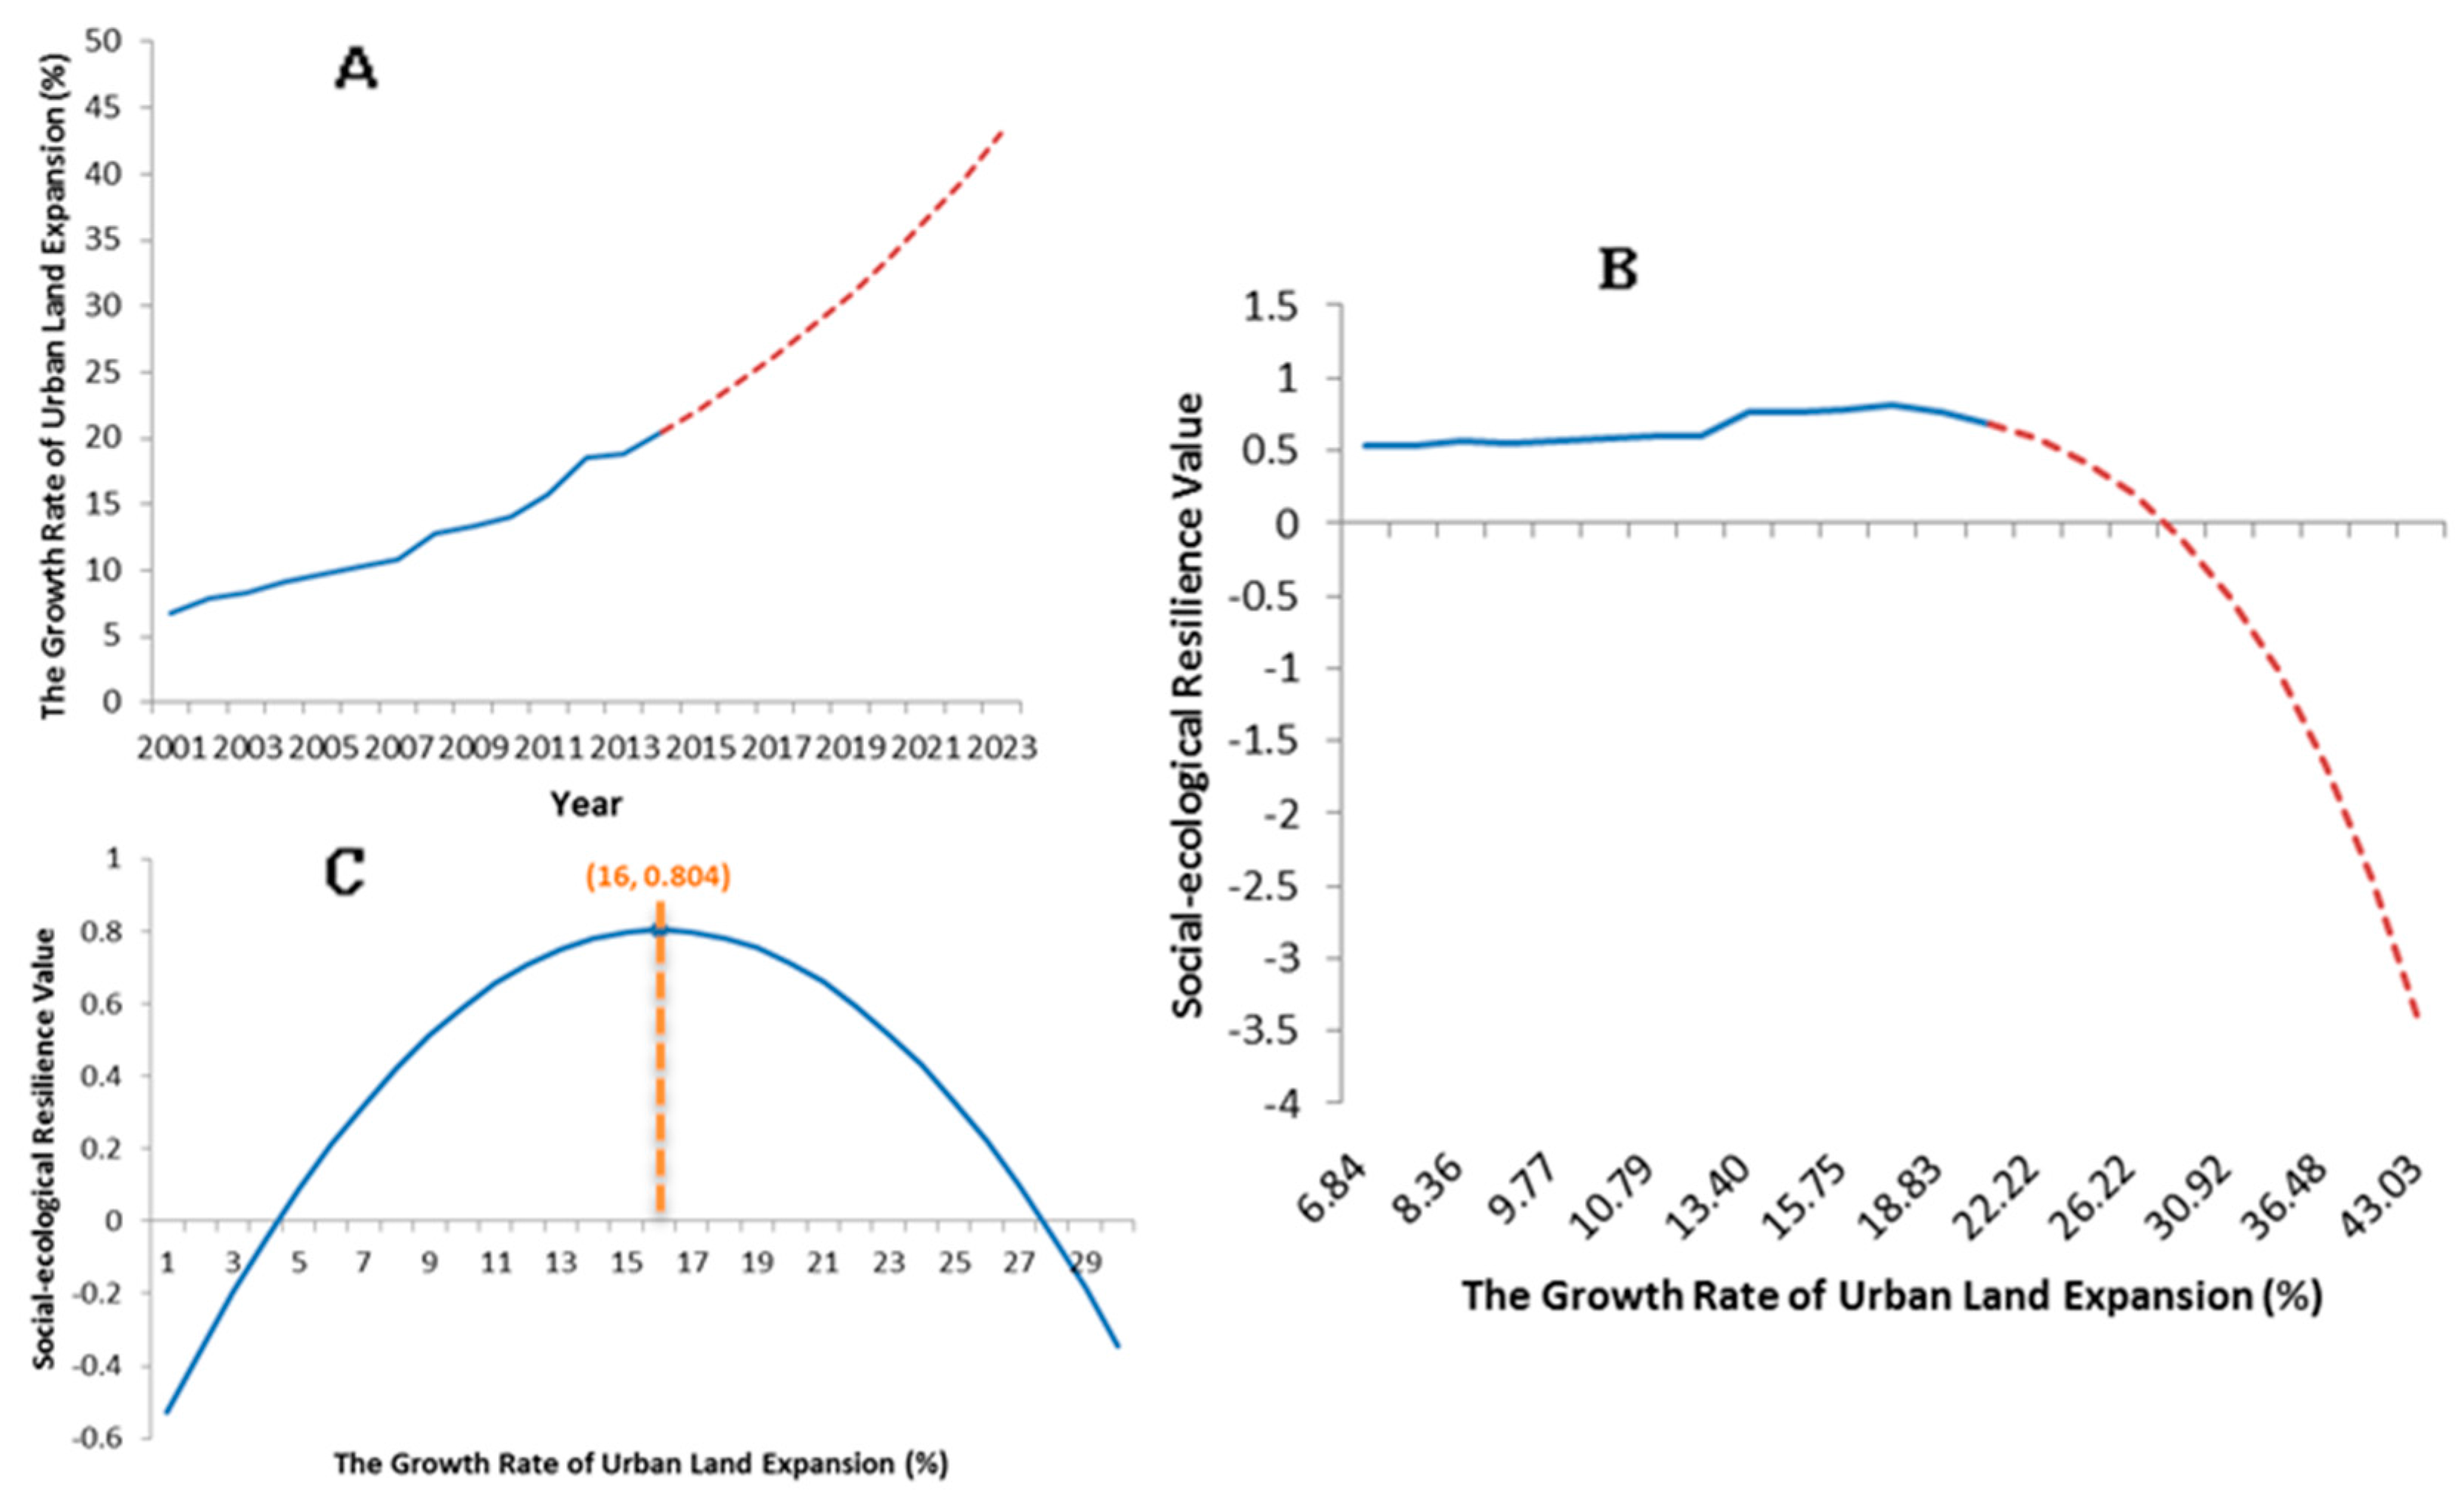
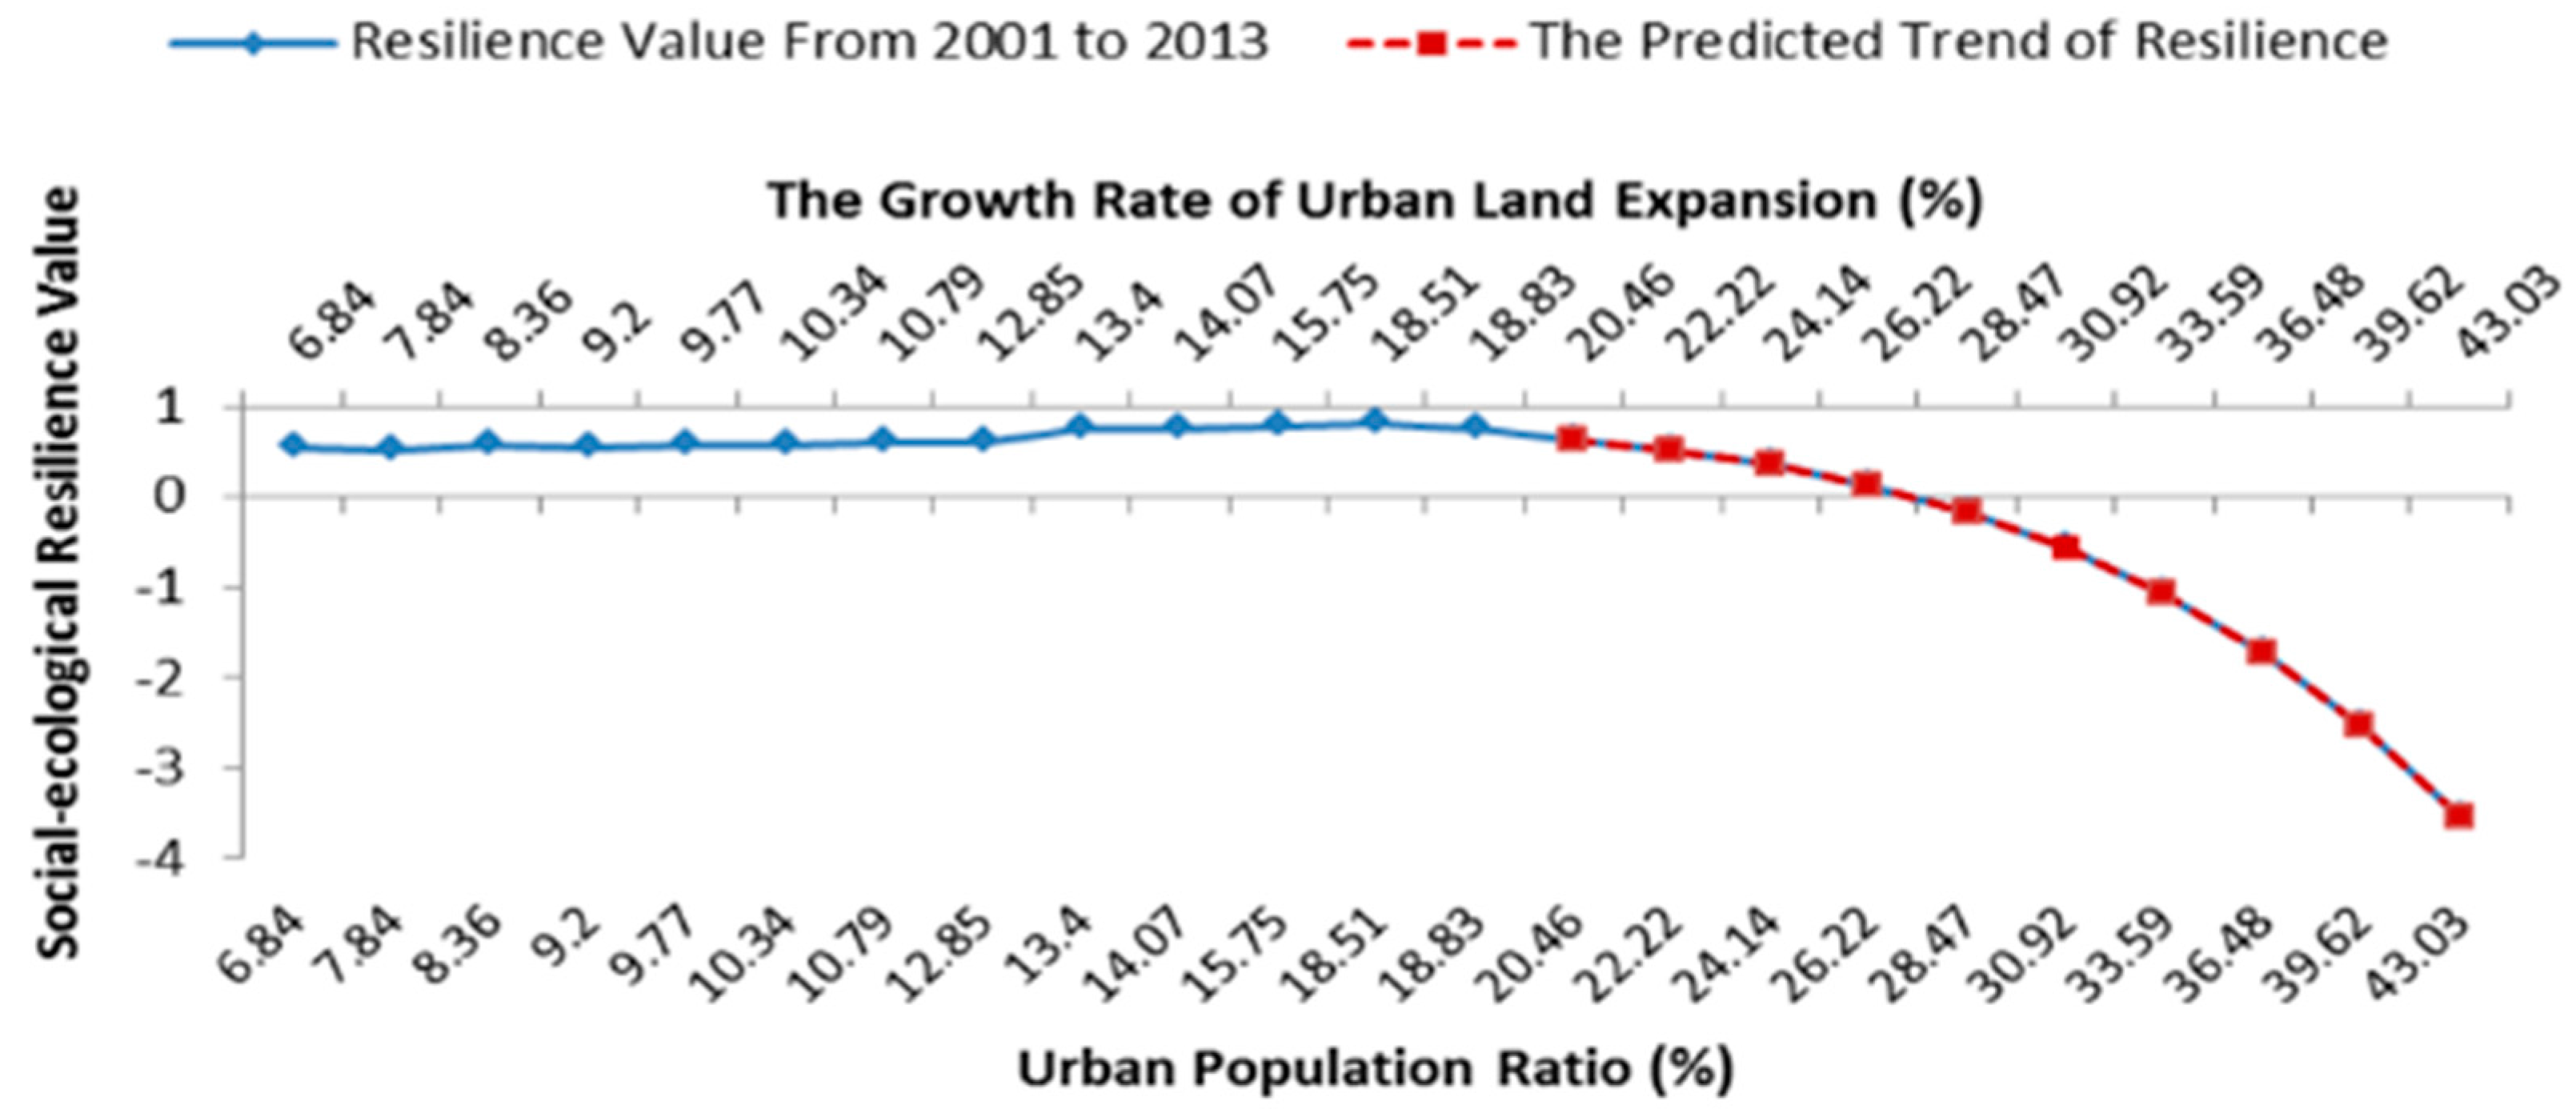
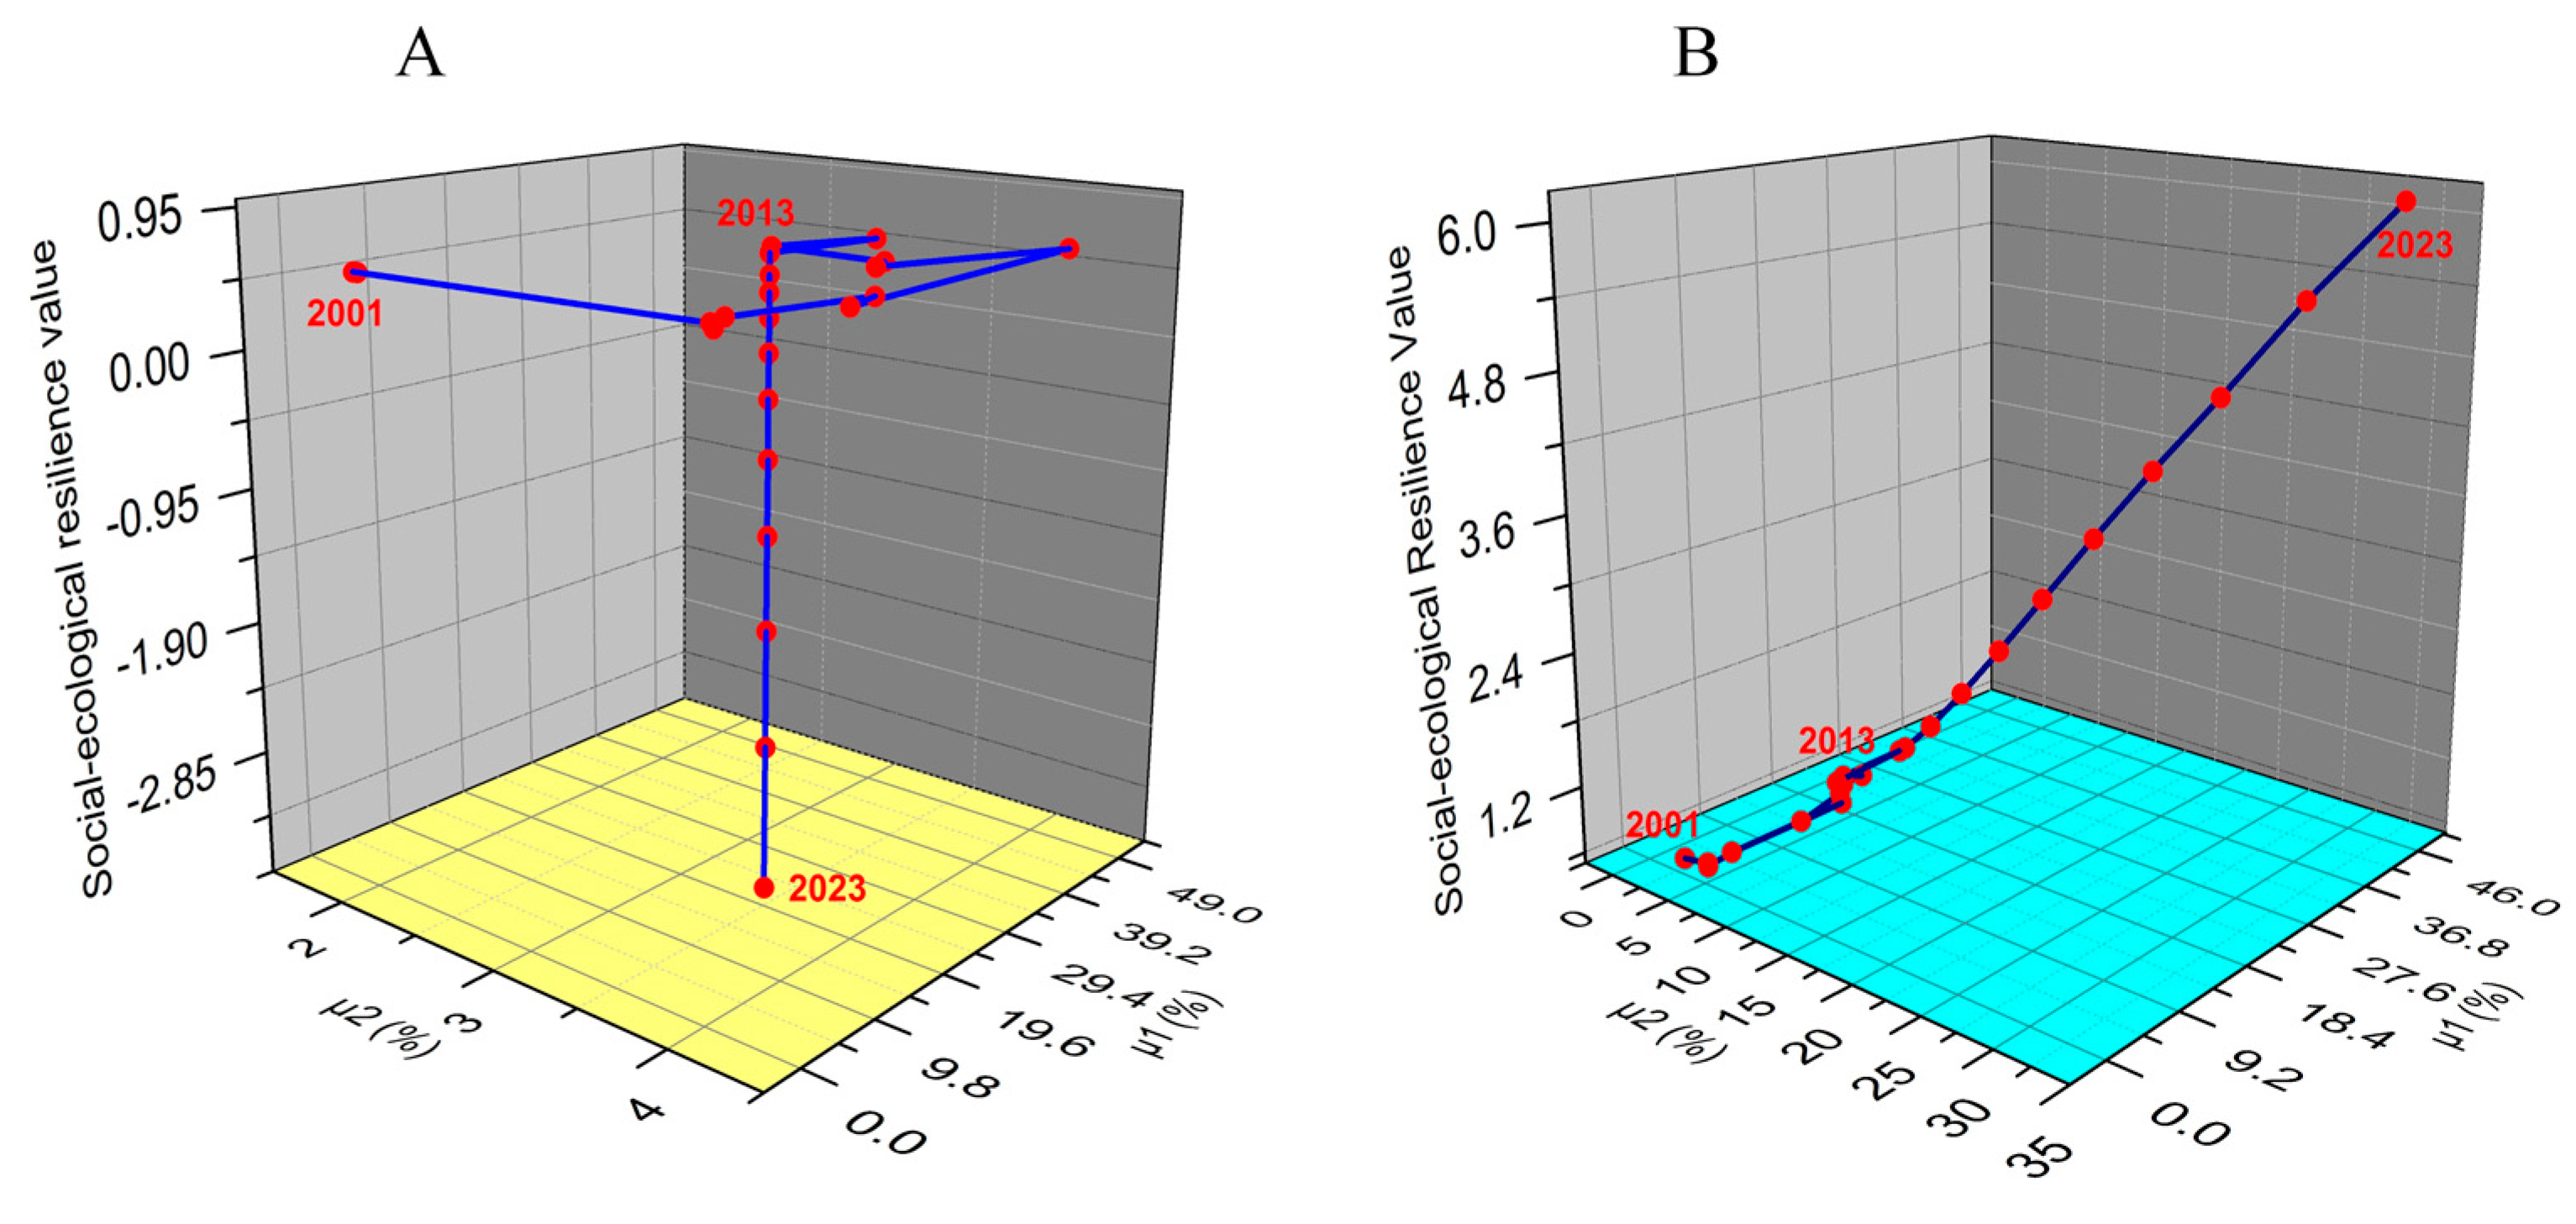
3.3. Scenario Analyses

In line with the changing trends that characterized the period from 2001 to 2013, regression analysis showed further significant relationships among the variables of resilience, urbanization, risk, and social-ecological governance, as presented in the following equation:
Resilience = 0.0216 U P R + 0.0001 U P R 2 + 0.1889 U L G 0.0059 U L G 2 0.0006 ε 1         0.0504 ε 2 + 0.0061 ε 2 2 + 0.0078 μ 1 0.0002 μ 1 2 + 0.3582 μ 2 0.0565 μ 2 2
Scenario analyses were, therefore, made on the basis of the variable relationships as shown in Equation (10).
From 2001 to 2013, UPR in the study area grew from 39.79% to 78.22%, and ULG increased from 6.84% to 18.83%. The environmental changes associated with urbanization have been significant during the last century, and are expected to continue through the next several decades. Therefore, in accordance with this trend, it is predicted that UPR will experience moderate growth (Figure 6A) in the future, while ULG will increase sharply (Figure 7A). Therefore, according to the variable relationships given in Equation (10), and based on the assumption that the other indicators kept the status quo, one analysis shows that levels of resilience will be persistent (Figure 6B) if UPR continues to increase according to the trend from 2001 to 2013; however, another analysis finds that the resilience level will decline substantially (Figure 7B) if ULG increases in line with the trend of 2001 to 2013. Accordingly, continued urbanization, especially with respect to urban land expansion, can have a devastating impact on the resilience. Moreover, the study results show that social-ecological resilience in the study area will first increase in response to the disturbances caused by the processes of land urbanization and then fall off sharply. Resilience might decline if ULG increases to 16% (Figure 7C). This suggests that disturbances caused by urbanization would push the system over a particular threshold where the way it functions will change when the growth rate of urban land expansion reaches 16%.
Considering the combined effects of urban population growth and urban land expansion, the results reveal that resilience will be dramatically eroded when the system is faced with frequent risks, based on the assumption that both UPR and ULG increased in the future, along with the trend from 2001 to 2013 (Figure 8). This reveals that the current level of social-ecological resilience may not be able to withstand future disturbances from urbanization processes, and such disturbances could result in the social-ecological system becoming unable to self-regulate, or even cause it to collapse. In contrast, if the urban development processes focused on the protection of the natural environment by ceasing urban expansion and construction, the trend of eroding resilience might be prevented, and the resilience of the urban system would continue at its present level and absorb disturbances, with risk levels remaining consistent with those of 2013 (Figure 9).
Because cities are the main sources of economic development in a modern society, urbanization has become a global trend for the promotion of economic and social development. Accordingly, urban governance must enable cities to navigate through changes and to develop their capacity to withstand risk. However, existing governance in the study area, which remains characterized by poor efficiency and low public participation, has served as a deterrent to such sustainable urban developments. According to the results of the scenarios analyses, if local governance in the study area continues to maintain its traditional, rigid, and closed structure during future rapid urban development, resilience will be corrupted and eroded, and there could be a return to the release stage of the adaptive cycle (Ω) (Figure 10A). China’s cities are attempting to use urban transition to ecological integration in the new type of urbanization to help as well as protect ecosystems and the environment, advancing policies as well as collaboration and integration. The cities also fully embody the urgency of theoretical research and practical innovations on social-ecological resilience governance and planning practices. Accordingly, this study attempts to link the outcome of social-ecological resilience with urban ecological governance changes. Because the adaptation cycle itself is iterative, dynamic, interconnected [60], and diverse, multi-partner governance arrangements should be created to represent hybrid combinations of the state, market, and community-based systems, including co-management, public-private partnerships, and private-social partnerships [61,62]. Accordingly, on the assumption that the governance of local resilience can be achieved via adaption and collaboration, such as through increases in environmental values and in the proportion of employees in public administration and social organization (e.g., increasing μ1 and μ2), the socio-ecological resilience would be significantly enhanced and would be able to deal with disturbances (Figure 10B), moving towards the exploitation phase (γ) according to the adaptive cycle. This implies that those mechanisms of urban governance that exhibit a co-evolutionary relationship between multi-stakeholders and the urban ecosystem would enable active adaptions to complex urbanization disturbances.

4. Conclusions

Quantifying the social-ecological resilience of urban system leads to a better understanding of the dynamics and development of the system, making it possible to determine how best to make governing strategies for intertwined urban systems to withstand specific disturbances in the future. This work proposes a quantitative assessment of social-ecological resilience for the case study in the Su-Xi-Chang city cluster and attempts to determine the impacts of urbanization on the resilience, with a view to improve social-ecological governing strategies. Our results demonstrate that the social ecosystem experienced an adaptive evolution during the period of 2001–2013 in the Su-Xi-Chang city cluster, and identify the respective contribution of various items that influence their related resilience values, which indicated the heterogeneity of the resilience in terms of various disturbances. In addition, this study reveals the dynamic of the social-ecological system moving through the adaptive cycle, which illuminated the importance of both phase and perspective in understanding the current position of the urban system and possible future trajectories as a function of connectedness and potential for collapse. Moreover, scenario analyses in the study, in which we evaluated the effects of the urbanization process and social-ecological governance on the resilience, revealed that continuously rapid urbanization, under rigid vertically organized governing (as in a top-down method, or a powerful government) with few horizontal communications, would result in a sharp decline in social-ecological resilience (or even returns it to the release phase) in the future, opposite to the loop of Ω to α in an adaptive cycle, especially with respect to urban land expansion. When ULG reaches 16%, disturbances caused by urban land expansion can push the social-ecological system over a particular threshold where it changes the way it functions.
Urbanization is a megatrend that is expected to continue throughout the globe [63]. Governance solutions are important factors to planning for urban resilience. In light of this, innovation in urban governance is rapidly advancing around the world, with neither an established endpoint, nor a predetermined path towards economic development [64]. Currently, China’s governance is lacking a public mechanism and needs to be integrated with multi-stakeholders. Our evaluated results showed that public participation had a low effect in the socio-ecological resilience governance in the study area during the period of 2001–2013. Accordingly, this study posits regime change scenarios and confirmed that adaptive and collaborative governance, incorporating increases in both public participation and the efficiency of environment administration, would strengthen the social-ecological governance of resilience to provide the urban system with a wide operating space, and even with accelerated urbanization ratios.
This explorative study broadens the scope of research in resilience thinking from a focus on the resilience management of urban ecosystem, and understanding and accounting for the social dimensions that allow sustainable ecosystem governance of dynamic populations and landscapes during periods of urbanization. Scenario analysis also helps to recognise what are more efficient actions to adopt in urban governing strategies in terms of social-ecological resilience. Assessment models have been shown to be useful tools in previous assessments of regional ecological carrying capacity and environmental risk [33,34]. The present study expands the methods used to create assessment models for a three-dimensional and comparative analysis, allowing a more comprehensive illustration of social-ecological resilience. While the results of our study are meaningful, it should be noted that scenario analyses for the resilience were designed based on a relatively simplistic consideration by focusing on typical indicators that are easy to measure. An understanding of a complex system requires us to know everything about everything. However, resilience thinking actually aims to identify the minimum key information we need to effectively manage the system for the values which are important for governance [39]. We recommend for future work to supplement some unquantifiable variables for significantly exploring our knowledge of the resilience dynamics of social-ecological systems.

Acknowledgments

This study was financially supported by the National Natural Science Foundation of China Grants (No. 41271008; 40976021), the Research Project of the State Key Laboratory of Pollution Control and Resources Reuse, and the Fundamental Research Funds for the Central Universities of China (No. 20720150074).

Author Contributions

Chen Zhang, Yangfan Li and Xiaodong Zhu conceived and designed the structure of the paper; Chen Zhang collected and analyzed the data, and wrote the paper.

Conflicts of Interest

The authors declare no conflicts of interest.

References

  1. Mallupattu, P.K.; Sreenivasula Reddy, J.R. Analysis of land use/land cover changes using remote sensing data and GIS at an Urban Area, Tirupati, India. Sci. World J. 2013, 2013, 268623. [Google Scholar] [CrossRef] [PubMed]
  2. Pan, J.H.; Wei, H.K. Blue Book of Cities in China: Annual Report on Urban Development of China No. 6; Social Sciences Academic Press: Beijing, China, 2013. (In Chinese) [Google Scholar]
  3. Cui, E.; Ren, L.; Sun, H. Evaluation of variations and affecting factors of eco-environmental quality during urbanization. Environ. Sci. Pollut. Res. 2015, 22, 3958–3968. [Google Scholar] [CrossRef] [PubMed]
  4. Pickett, S.T.A.; Cadenasso, M.L.; Grove, J.M.; Boone, C.G.; Groffman, P.M.; Irwin, E.; Kaushal, S.S.; Marshall, V.; McGrath, B.P.; Nilon, C.H.; et al. Urban ecological systems: Scientific foundations and a decade of progress. J. Environ. Manag. 2011, 92, 331–362. [Google Scholar] [CrossRef] [PubMed]
  5. Seto, K.C.; Güneralp, B.; Hutyra, L.R. Global forecasts of urban expansion to 2030 and direct impacts on biodiversity and carbon pools. Proc. Natl. Acad. Sci. USA 2012, 109, 16083–16088. [Google Scholar] [CrossRef] [PubMed]
  6. Peng, J.; Liu, Y.; Wu, J.; Lv, H.; Hu, X. Linking ecosystem services and landscape patterns in an assessment of urban ecosystem health using Shenzhen City, China as a case study. Landsc. Urban Plan. 2015, 143, 56–68. [Google Scholar] [CrossRef]
  7. Civeroloa, K.; Hogrefea, C.; Lynnc, B.; Rosenthale, J.; Kua, J.; Soleckif, W.; Coxf, J.; Smallg, C.; Rosenzweigc, C.; Goldbergc, R.; et al. Estimating the effects of increased urbanization on surface meteorology and ozone concentrations in the New York City metropolitan region. Atmos. Environ. 2007, 41, 1803–1818. [Google Scholar] [CrossRef]
  8. Ferreira António, J.D.; Pardal, J.; Malta, M.; Ferreira Carla, S.S.; Soares Daniel, D.J.; Vilhena, J. Improving Urban Ecosystems Resilience at a City Level. The Coimbra Case Study. Energy Procedia 2013, 40, 6–14. [Google Scholar] [CrossRef]
  9. Qiu, J. China faces up to “terrible” state of its ecosystems. Nature 2011, 471, 19. [Google Scholar] [CrossRef] [PubMed]
  10. Chelleri, L.; Olazabal, M. Multidisciplinary Perspectives on Urban Resilience; Basque Centre for Climate Change: Bilbao, Spain, 2012. [Google Scholar]
  11. Serre, D.; Barroca, B.; Laganier, R. Resilience and Urban Risk Management; CRC Press: Boca Raton, FL, USA, 2012. [Google Scholar]
  12. Curtin, C.G.; Parker, J.P. Foundations of resilience thinking. Conserv. Biol. 2014, 28, 912–923. [Google Scholar] [CrossRef] [PubMed]
  13. Lew, A.A.; Ng, P.T.; Ni, C.-C.; Wu, T.-C. Community sustainability and resilience: Similarities, differences and indicators. Tour. Geogr. 2015, 18, 18–27. [Google Scholar] [CrossRef]
  14. Bruijne, M.D.; Eeten, M.V.; Boin, R.A. Designing Resilience; University Pittsburgh Press: Pittsburgh, PA, USA, 2010. [Google Scholar]
  15. Holling, C.S. Resilience and stability of ecological systems. Annu. Rev. Ecol. Evolut. Syst. 1973, 4, 1–23. [Google Scholar] [CrossRef]
  16. Peterson, G.; Allen, C.R.; Holling, C.S. Ecological resilience, biodiversity, and scale. Ecosystems 1998, 1, 6–18. [Google Scholar] [CrossRef]
  17. Gunderson, L.H.; Holling, C.S. Panarchy: Understanding Transformations in Human and Natural Systems; Island Press: Washington, DC, USA, 2002. [Google Scholar]
  18. Berkes, F.; Colding, J.; Folke, C. Navigating Social-Ecological Systems: Building Resilience for Complexity and Change; Cambridge University Press: Cambridge, UK, 2003. [Google Scholar]
  19. Berkes, F.; Folke, C.; Colding, J. Linking Social and Ecological Systems: Management Practices and Social Mechanisms for Building Resilience; Cambridge University Press: Cambridge, UK, 1998; pp. 387–389. [Google Scholar]
  20. Walker, B.; Holling, C.S.; Carpenter, S.R.; Kinzig, A. Resilience, Adaptability and Transformability in Social-ecological Systems. Ecol. Soc. 2004, 9, 3438–3447. [Google Scholar]
  21. Adger, W.N.; Rockström, J. Social-ecological resilience to coastal disasters. Science 2005, 309, 1036–1039. [Google Scholar] [CrossRef] [PubMed]
  22. Turner, N.J.; Davidson-Hunt, I.J.; O’Flaherty, M. Living on the Edge: Ecological and Cultural Edges as Sources of Diversity for Social-Ecological Resilience. Hum. Ecol. 2003, 31, 439–461. [Google Scholar] [CrossRef]
  23. Fragkias, M.; Güneralp, B.; Seto, K.C.; Goodness, J. A Synthesis of global urbanization projections. In Urbanization, Biodiversity and Ecosystem Services: Challenges and Opportunities; Springer: Berlin, Germany, 2013; pp. 409–435. [Google Scholar]
  24. Resilience Alliance. Assessing Resilience in Social-Ecological Systems: Workbook for Practitioners (Version 2.0); Resilience Alliance: Halifax, NS, Canada, 2010. [Google Scholar]
  25. Walker, B.H.; Carpenter, S.R.; Rockstrom, J.; Crepin, A.S.; Peterson, G.D. Drivers”, slow” variables”, fast” variables, shocks, and resilience. Ecol. Soc. 2012, 17, 30. [Google Scholar] [CrossRef]
  26. Quinlan, A.E.; Berbés-Blázquez, M.; Haider, L.J.; Peterson, G.D. Measuring and assessing resilience: Broadening understanding through multiple disciplinary perspectives. J. Appl. Ecol. 2015. [Google Scholar] [CrossRef]
  27. Bridges, T.; Henn, R.; Komlos, S.; Scerno, D.; Wamsley, T.; White, K. Coastal Risk Reduction and Resilience; US Army Corps of Engineers: Washington, DC, USA, 2013.
  28. Liao, K. A theory on urban resilience to floods—A basis for alternative planning practices. Ecol. Soc. 2012, 17, 48. [Google Scholar] [CrossRef]
  29. Martin, R.; Sunley, P. On the notion of regional economic resilience: Conceptualization and explanation. J. Econ. Geogr. 2015, 15, 1–42. [Google Scholar] [CrossRef]
  30. Zhai, G.; Li, S.; Chen, J. Reducing Urban Disaster Risk by Improving Resilience in China from a Planning Perspective. Hum. Ecol. Risk Assess. 2015, 21, 1206–1217. [Google Scholar] [CrossRef]
  31. Colding, J. “Ecological land-use complementation” for building resilience in urban ecosystems. Landsc. Urban Plan. 2007, 81, 46–55. [Google Scholar] [CrossRef]
  32. Ernstson, H.; Leeuw, S.E.; Redman, C.L.; Meffert, D.J.; Davis, G.; Alfsen, C.; Elmqvist, T. Urban Transitions: On Urban Resilience and Human-Dominated Ecosystems. Ambio 2010, 39, 531–545. [Google Scholar] [CrossRef] [PubMed]
  33. Zhang, C.; Li, Y.; Xiong, S.; Lu, X.; Zhu, X. Regional environmental risk assessment and management guide for rapid urbanization process of a city cluster in China. Hum. Ecol. Risk Assess. 2015, 22, 283–301. [Google Scholar] [CrossRef]
  34. Zhang, C.; Zhao, Y.; Yu, L.; Xu, T. Evaluation on ecological carrying capacity of Muping district, Yantai city. Bull. Soil Water Conserv. 2012, 32, 271–275. [Google Scholar]
  35. Economy, E. Environmental governance: The emerging economic dimension. Environ. Politics 2006, 15, 171–189. [Google Scholar] [CrossRef]
  36. Mol, A.P.J. Urban environmental governance innovations in China. Curr. Opin. Environ. Sustain. 2009, 1, 96–100. [Google Scholar] [CrossRef]
  37. Park, J.; Sarkis, J.; Wu, Z. Creating integrated business and environmental value within the context of China’s circular economy and ecological modernization. J. Clean. Prod. 2010, 18, 1494–1501. [Google Scholar] [CrossRef]
  38. Walker, B.; Salt, D. Resilience Practice: Building Capacity to Absorb Disturbance and Maintain Function; Island Press/Center for Resource Economics: Washington, DC, USA, 2012. [Google Scholar]
  39. Power, M.E. Resilience Practice: Building Capacity to Absorb Disturbance and Maintain Function. Bioscience 2001, 32, 214–215. [Google Scholar]
  40. Ouyang, Y. Evaluation of river water quality monitoring stations by principal component analysis. Water Res. 2005, 39, 2621–2635. [Google Scholar] [CrossRef] [PubMed]
  41. Hao, R.X.; Li, S.M.; Li, J.B.; Zhang, Q.K.; Liu, F. Water quality assessment for wastewater reclamation using principal component analysis. J. Environ. Inform. 2013, 21, 45–54. [Google Scholar] [CrossRef]
  42. Chan, F.; Kumar, N. Global supplier development considering risk factors using fuzzy extended AHP-based approach. Omega-Int. J. Manag. Sci. 2007, 35, 417–431. [Google Scholar] [CrossRef]
  43. Mainali, B.; Pachauri, S.; Rao, N.D.; Silveira, S. Assessing rural energy sustainability in developing countries. Energy Sustain. Dev. 2014, 19, 15–28. [Google Scholar] [CrossRef]
  44. Recatalá, L.; Sacristán, D. A minimum indicator set for assessing resources quality and environmental impacts at planning level in a representative area of the European Mediterranean Region. Ecol. Indic. 2014, 45, 160–170. [Google Scholar] [CrossRef]
  45. Iscen, C.F.; Emiroglu, O.; Ilhan, S.; Arslan, N.; Yilmaz, V.; Ahiska, S. Application of multivariate statistical techniques in the assessment of surface water quality in Uluabat Lake, Turkey. Environ. Monit. Assess. 2008, 144, 269–276. [Google Scholar] [CrossRef] [PubMed]
  46. Liu, H.X.; Zhang, D.L. Analysis and prediction of hazard risks caused by tropical cyclones in Southern China with fuzzy mathematical and grey models. Appl. Math. Model. 2012, 36, 626–637. [Google Scholar] [CrossRef]
  47. Alshehri, S.A.; Rezgui, Y.; Li, H. Disaster community resilience assessment method: A consensus-based Delphi and AHP approach. Nat. Hazards 2015, 78, 395–416. [Google Scholar] [CrossRef]
  48. Ryu, J.; Leschine, T.M.; Nam, J.; Chang, W.K.; Dyson, K. A resilience-based approach for comparing expert preferences across two large-scale coastal management programs. J. Environ. Manag. 2011, 92, 92–101. [Google Scholar] [CrossRef] [PubMed]
  49. Sen, A.; Srivastava, M. Regression Analysis; Springer: Berlin, Germany, 2012. [Google Scholar]
  50. Glenn, D.; Fabricius, K.E. Classification and Regression Trees: A Powerful yet Simple Technique for Ecological Data Analysis. Ecology 2000, 81, 3178–3192. [Google Scholar]
  51. Graham, M.H. Confronting Multicollinearity in Ecological Multiple Regression. Ecology 2003, 84, 2809–2815. [Google Scholar] [CrossRef]
  52. Boone, C.G.; Redman, C.L.; Blanco, H.; Haase, D.; Koch, J.; Lwasa, S.; Yokohari, M. Group 4: Re-conceptualizing urban land use. In Rethinking Urban Land Use in a Global Era; Seto, K.C., Reenberg, A., Eds.; MIT Press: Cambridge, MA, USA, 2013. [Google Scholar]
  53. Folke, C.; Carpenter, S.R.; Walker, B.; Scheffer, M.; Chapin, T.; Rockstrom, J. Resilience thinking: Integrating resilience, adaptability and transformability. Ecol. Soc. 2010, 15, 20. [Google Scholar]
  54. Grove, J.M. Cities: Managing densely settled social-ecological systems. In Principles of Ecosystem Stewardship: Resilience-Based Natural Resource Management in a Changing World; Chapin, F.S., III, Kofinas, G.P., Folke, C., Eds.; Springer: New York, NY, USA, 2009; pp. 281–294. [Google Scholar]
  55. Carpenter, S.; Walker, B.; Anderies, J.M.; Abel, N. From metaphor to measurement: Resilience of what to what? Ecosystems 2001, 4, 765–781. [Google Scholar] [CrossRef]
  56. Liu, J.G.; Dietz, T.; Carpenter, S.R.; Folke, C.; Alberti, M.; Redman, C.L.; Schneider, S.H.; Ostrom, E.; Pell, A.N.; Lubchenco, J.; et al. Coupled Human and Natural Systems. Ambio 2007, 36, 639–649. [Google Scholar] [CrossRef]
  57. Carson, J.; Doyle, J. Highly optimized tolerance: Robustness and design in complex systems. Phys. Rev. Lett. 2000, 84, 2529–2532. [Google Scholar] [CrossRef] [PubMed]
  58. Otten, T.G.; Xu, H.; Qin, B.; Zhu, G.; Paerl, H.W. Spatiotemporal patterns and ecophysiology of toxigenic microcystis blooms in Lake Taihu, China: Implications for water quality management. Environ. Sci. Technol. 2012, 46, 3480–3488. [Google Scholar] [CrossRef] [PubMed]
  59. Paerl, H.W.; Xu, H.; McCarthy, M.J.; Zhu, G.; Qin, B.; Li, Y.; Gardner, W.S. Controlling harmful cyanobacterial blooms in a hypereutrophic lake (Lake Taihu, China): The need for a dual nutrient (N & P) management strategy. Water Res. 2011, 45, 1973–1983. [Google Scholar] [PubMed]
  60. Wheaton, E.E.; Maciver, D.C. A framework and key questions for adapting to climate variability and change. Mitig. Adapt. Strateg. Glob. Chang. 1999, 4, 215–225. [Google Scholar] [CrossRef]
  61. Emerson, K.; Gerlak, A.K. Adaptation in collaborative governance regimes. Environ. Manag. 2014, 54, 768–781. [Google Scholar] [CrossRef] [PubMed]
  62. Schewenius, M.; McPhearson, T.; Elmqvist, T. Opportunities for Increasing Resilience and Sustainability of Urban Social-Ecological Systems: Insights from the URBES and the Cities and Biodiversity Outlook Projects. Ambio 2014, 43, 434–444. [Google Scholar] [CrossRef] [PubMed]
  63. UN Habitat. State of the World’s Cities; Earthscan: London, UK, 2006. [Google Scholar]
  64. Pickett Steward, T.A.; McGrat, B.; Cadenasso, M.L.; Felson, A.J. Ecological resilience and resilient cities. Build. Res. Inf. 2014, 42, 143–157. [Google Scholar] [CrossRef]
Figure 1. Location of the Su-Xi-Chang city cluster.
Sustainability 08 01101 g001
Figure 2. Gross domestic product (GDP) of the Su-Xi-Chang city cluster (2001 to 2013).
Sustainability 08 01101 g002
Figure 3. Urban expansion in the Su-Xi-Chang city cluster in the year of (A) 2001 and (B) 2010.
Sustainability 08 01101 g003
Figure 4. Trends in (A) the resilience and (B) its five aspects in the social-ecological system of the Su-Xi-Chang city cluster (2001–2013).
Sustainability 08 01101 g004
Figure 5. An interpretation of the adaptive cycle in the Su-Xi-Chang city cluster (2001–2013).
Sustainability 08 01101 g005
Figure 6. Scenario analysis: (A) predicted trends in urban population ratio and (B) the resilience with increasing urban population ratio.
Sustainability 08 01101 g006
Figure 7. Scenario analysis: (A) predicted trends in the growth rate of urban land expansion and (B,C) the resilience with increasing urban land expansion.
Sustainability 08 01101 g007
Figure 8. Scenario analysis of resilience under rapid urbanization.
Sustainability 08 01101 g008
Figure 9. Scenario analysis of resilience without future urban expansion.
Sustainability 08 01101 g009
Figure 10. Scenario analysis: predicted trends of the resilience with (A) rigid and vertically-organized forms of governance, and (B) adaption and collaboration forms of governance, under a rapid urbanization process.
Sustainability 08 01101 g010
Table 1. Identifications of socio-ecological resilience in urban system.
Resilience of WhatSystems Combined with Economy, Society and Environment
Resilience to whatDisturbances that can flip the social ecosystem into an alternate undesirable state
By/for whomUrban ecosystem survivability, wellbeing, and social institutions that want to maintain their social-ecological systems in a desirable state
Strategies for resilienceIdentify existing and new strategies to enhance resilience in response to these disturbances
Table 2. Index system of the social-ecological resilience assessment.
Target LayerSub-SystemDimensionParameterFirst Component in Principal Component Analysis
Social-ecological resilience levelsEcological systemPollution loadThe frequency of acid rain (%)0.030
Discharge of sulfur dioxide (kg)0.943
Discharge of chemical oxygen demand (kg)0.935
Discharge of solid waste (kg)0.498
Discharge of ammonia nitrogen compounds (kg)0.622
Energy consumption (tce)0.975
Water consumption (t)0.883
Fires0.648
Environmental violations case−0.354
Environmental qualityPrecipitation (mm)−0.523
Utmost highest/lowest temperature of the year (°C)−0.364
Up-to-standard rate of urban surface water quality (%)0.613
Up-to-standard rate of the water quality of drinking water source (%)0.827
The proportion of superior air days in total (%)0.868
Coverage of noise controlled area (%)0.879
Eutrophication level of Taihu Lake−0.795
Landscape patternThe growth rate of urban land expansion (%)−0.941
Annual reduction rate of arable land (hectare)0.603
Green coverage rate in urban constructed areas (%)0.869
Area coverage of the parks, gardens, and green areas (hectare)0.981
Areas of roads (hectare)−0.916
Length of anti-flood dykes (km)0.848
Natural conservation area coverage (%)−0.787
Social-economic systemSocial-economic developmentUrban population ratio (%)0.917
GDP per capita (100 million yuan)0.947
Annual increasing in value of gross agricultural output (%)0.626
The proportion of second industry in GDP (%)−0.283
The growth rate of per capita disposable income of urban households (%)0.415
The growth rate of saving deposit of residents (%)0.646
The growth rate of general consumer price index of urban residents (%)0.557
Human life expectancy (year)0.951
Annual increasing rate of privately possessed cars (%)−0.245
Social-ecological governanceThe water-reuse rate (%)0.931
The rate of municipal wastewater treatment (%)0.561
Ratio of industrial waste water that meets discharge standards (%)0.974
Ratio of comprehensive utilization of solid industrial waste (%)0.881
The GDP growth rate of environment administration (%)0.708
Fixed assets investment in environmental and public facilities management (ten thousands yuan)0.899
Expenditures on natural science and technology (ten thousands yuan)0.793
Percentage of employees in public administration and social organizations (%)0.051
Social welfare enterprise−0.956
Note: In the column of “first component in principal component analysis”, a positive value suggests that the indicator contributes positively to the resilience value of the sub-system, and negative value suggests that the indicator contributes negatively to the resilience value of the sub-system.
Table 3. Index for scenario predictions in a social-ecological resilience assessment.
Analysis ModuleIndicators
Urbanization processUrban population ratio (UPR)
The growth rate of urban land expansion (ULG)
RiskEnvironmental violation (ε1)
The eutrophication level (ε2)
Adaptive co-governanceThe GDP growth rate of environment administration (μ1)
Percentage of employees in public administration and social organizations (μ2)
Table 4. Corresponding characteristics of the results of the combined Grey-Fuzzy model and the cluster analysis.
Grade of Cluster AnalysisTimeAssessment Scores of Grey-Fuzzy ModelCharacteristic of Resilience Change
Adaptability2001 to 20030.548–0.509As a part of resilience, the adaptability to adjust its response to change and thereby allowing for development within the original trajectory.
2003 to 20050.509–0.557
Persistence2005 to 20080.557–0.580Resilience remains within a relatively stable domain and perturbations are controlled.
2010 to 20130.770–0.760
Transformability2008 to 20090.582–0.745A shift between different stability trajectories.

