Article

Quantitative Evaluation of Ecosystem Health in a Karst Area of South China

1
School of Karst Science, Guizhou Normal University, Guiyang 550001, China
2
The State Key Laboratory Incubation Base for Karst Mountain Ecology Environment of Guizhou Province, Guiyang 550001, China
3
State Engineering Technology Institute for Karst Desertification Control, Guiyang 550001, China
4
School of Ecological and Environmental Sciences, East China Normal University, Shanghai 200241, China
5
Remote Sensing Center of Guizhou Province, Guiyang 550001, China
*
Author to whom correspondence should be addressed.
Sustainability 2016, 8(10), 975; https://doi.org/10.3390/su8100975
Submission received: 25 May 2016 / Revised: 16 September 2016 / Accepted: 20 September 2016 / Published: 10 October 2016

Abstract

:
The purpose of this study is to propose a GIS-based mechanism for diagnosing karst rocky desertification (KRD) ecosystem health. Using the Huajiang Demonstration Area in Guizhou Province as a case study, this research offers a multi-factor indicator system for diagnosing KRD ecosystem health. A set of geologic, environmental, and socio-economic health indicators were developed based on remote sensing images from field-investigation, hydrological, and meteorological monitoring data. With the use of grid GIS technology, this study gives an indicator for diagnosing the spatial expression of desertification at a 5 m × 5 m grid scale. Using spatial overlaying technology based on grid data, the temporal and spatial dynamics of ecosystem health in the Huajiang Demonstration Area were tracked over a 10 year time span. The results of the analysis indicate that ecosystem health in the Huajiang Demonstration Area varies regionally, and has overall improved over time. The proportion of healthy area increased from 3.7% in 2000 to 8.2% in 2010. However, unhealthy and middle-health areas still accounted for 78.7% of the total area by 2010. The most obvious improvement of ecosystem health was in an area where comprehensive control measures for curbing KRD were implemented. These results suggest that comprehensive control of KRD can effectively mitigate ecosystem deterioration and improve ecosystem health in karst regions of South China.

1. Introduction

Karst areas are one of the most ecologically fragile ecosystems in the world [1]. Of the world’s three largest karst-concentrated areas (European Mediterranean coast, Eastern United States, and Southeast Asia), Southern China’s karst area has the largest area of successive bare carbonate rock [2]. Guizhou is located in the center of South China’s karst area, and has the world’s most complex, concentrated, and diverse karst landscape [3]. The carbonate rocks are well developed and the outcropped area of karst occupies 61.9% of the province’s territory [4].
The karst area in Guizhou Province is characterized by thin and discontinuous surface soil, high connectivity of surface water and groundwater, rapid hydrological cycling, uneven distribution of water and soil resources, high heterogeneity of hydrothermal factors over time and space, and soil rich in calcium (Ca) and magnesium (Mg) and deficient in nitrogen (N), phosphorus (P), and potassium (K). These characteristics result in a very fragile ecosystem, which, combined with the aridity of the climate, makes ecological health in this area particularly challenging to sustain. The fragility of this karst ecosystem is exacerbated by the large population of local inhabitants who have built settlements and established unsustainable agricultural practices in these areas. These human and non-human factors have resulted in karst rocky desertification (KRD), which is marked by reversed ecological succession and the decline of ecological health. KRD in South China has been recognized as a serious issue [5,6]. Fortunately, the Chinese government has identified ecological restoration in karst areas as an important strategy for poverty alleviation and sustainable development in China. Policy measures have been adopted to help mitigate KRD, including the “Protection Forest System Construction Program” and “Sloping Land Conversion Program/Grain for Green Project”. Between 2008 and 2010, the Chinese government spent 3 billion RMB to select 100 county-level demonstration areas (including 55 counties in Guizhou) for implementing comprehensive control measures to restore ecological health of KRD-affected areas. In 2011 through to 2016, the program expanded from 100 counties to 200 counties (including 78 counties in Guizhou) and a series of major projects have been implemented. As comprehensive control mechanisms of KRD are still in the initial stages, the impact of these mechanisms on the ecological health of karst areas needs to be explored. Therefore, it is necessary to set up a diagnostic framework for analyzing the spatial heterogeneity and temporal responses of ecosystem health in KRD-affected areas.
Ecosystem health is the primary goal of environmental management and ecological restoration [7]. Many experts and scholars have put forward different definitions [8,9] and various indicators [10,11,12] to analyze ecosystem health. Ecosystem health research has tended to examine single-ecosystem scales, such as forests [13,14], wetlands [15,16], river basins [17,18,19], marine environments [20,21], farmlands [22,23], mines [24], and cities [25,26,27]. Research on regional, multi-ecosystem scales have only begun to emerge in recent years. Karst geo-ecosystems are highly fragile ecosystems that are suffering from human-induced degradation, often at a regional scale [28].
Assessment of ecosystem health in karst areas is a prerequisite for ecological restoration and sustainable development. However, few researchers have focused on ecosystem health of KRD-affected areas, especially those which have implemented comprehensive control measures. Cao and Su [29] used fuzzy comprehensive evaluation methods to evaluate and compare ecosystem health in three different types of karst area. Zhang et al. [30] applied the ecological footprint model to evaluate the ecosystem health of the Karst Plateau. These previous studies have two short-comings. First, there is no unified standard framework for diagnosing KRD-affected areas. Second, the frameworks used in these studies fail to consider spatial patterns and comprehensive changes of ecosystem health over time.
The purpose of this study is to propose a comprehensive and replicable method for diagnosing the ecosystem health of KRD-affected areas. Using the Huajiang Demonstration Area in Guizhou Province as a case study, this research offers a multi-factor indicator system based on grid GIS for diagnosing the health of KRD-affected ecosystems over time and space. This indicator system can be used to assess and inform the management, restoration, and reconstruction efforts of KRD-affected regions.

2. Materials and Methods
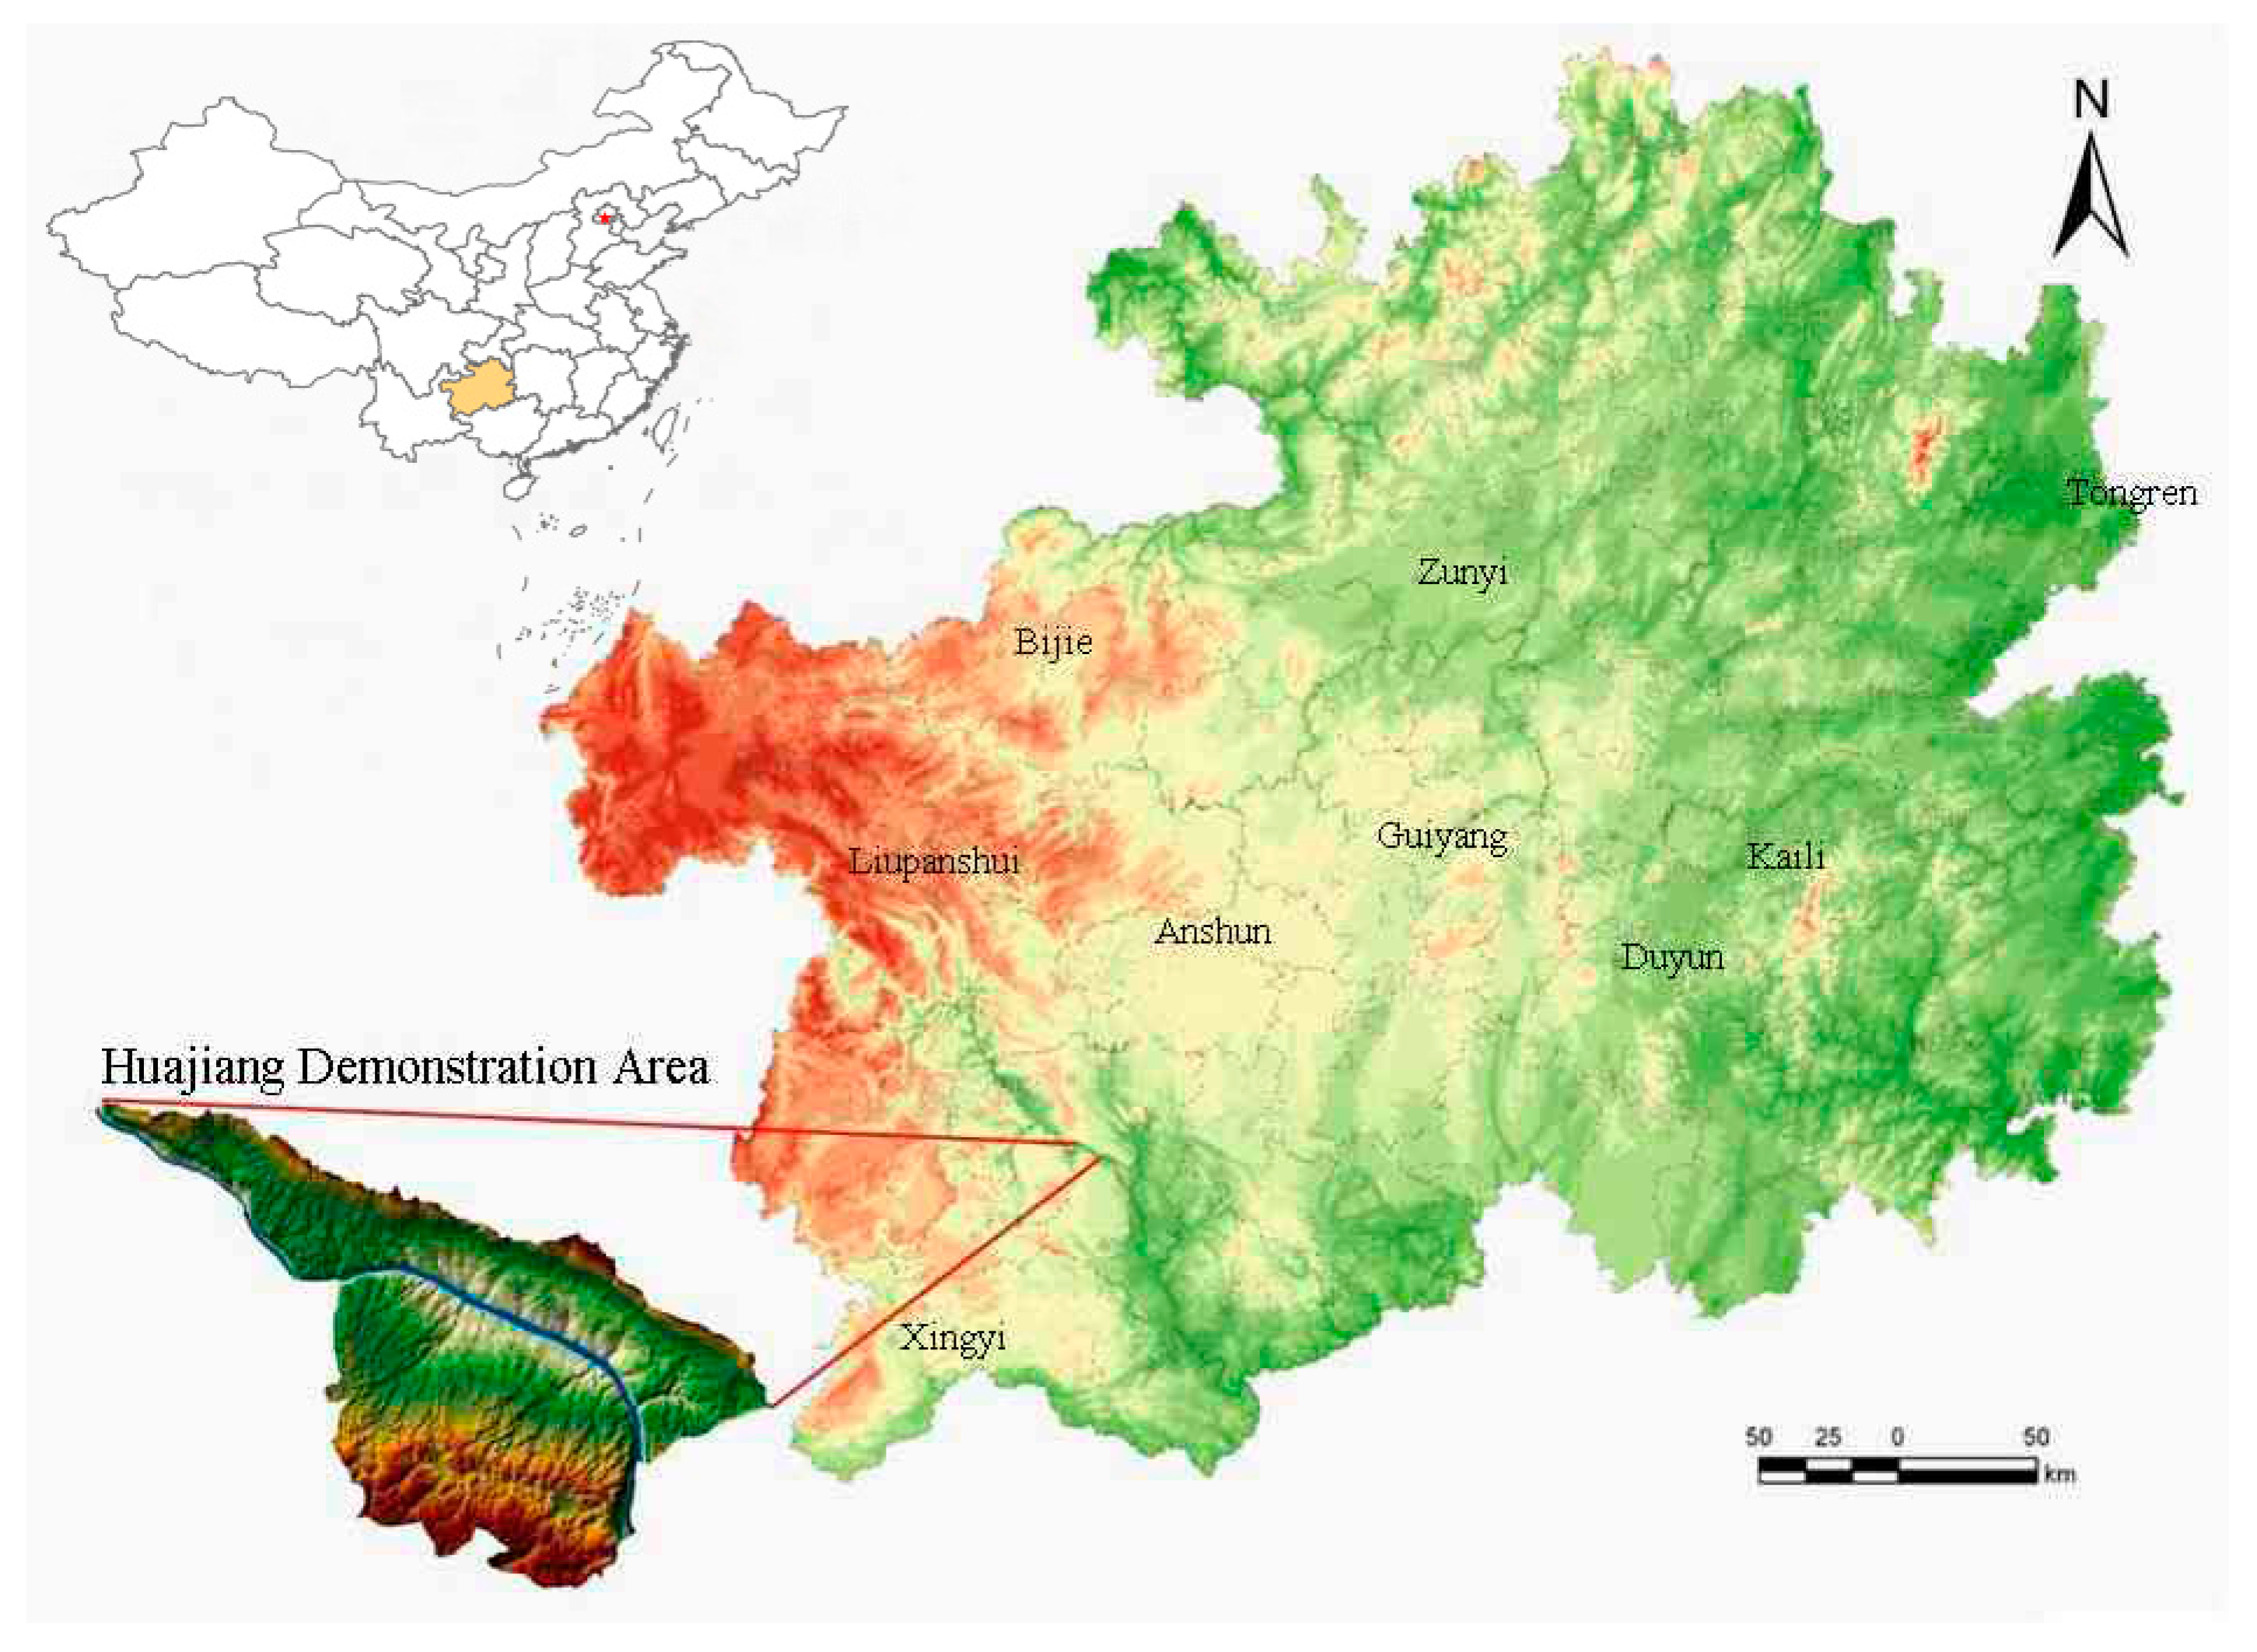
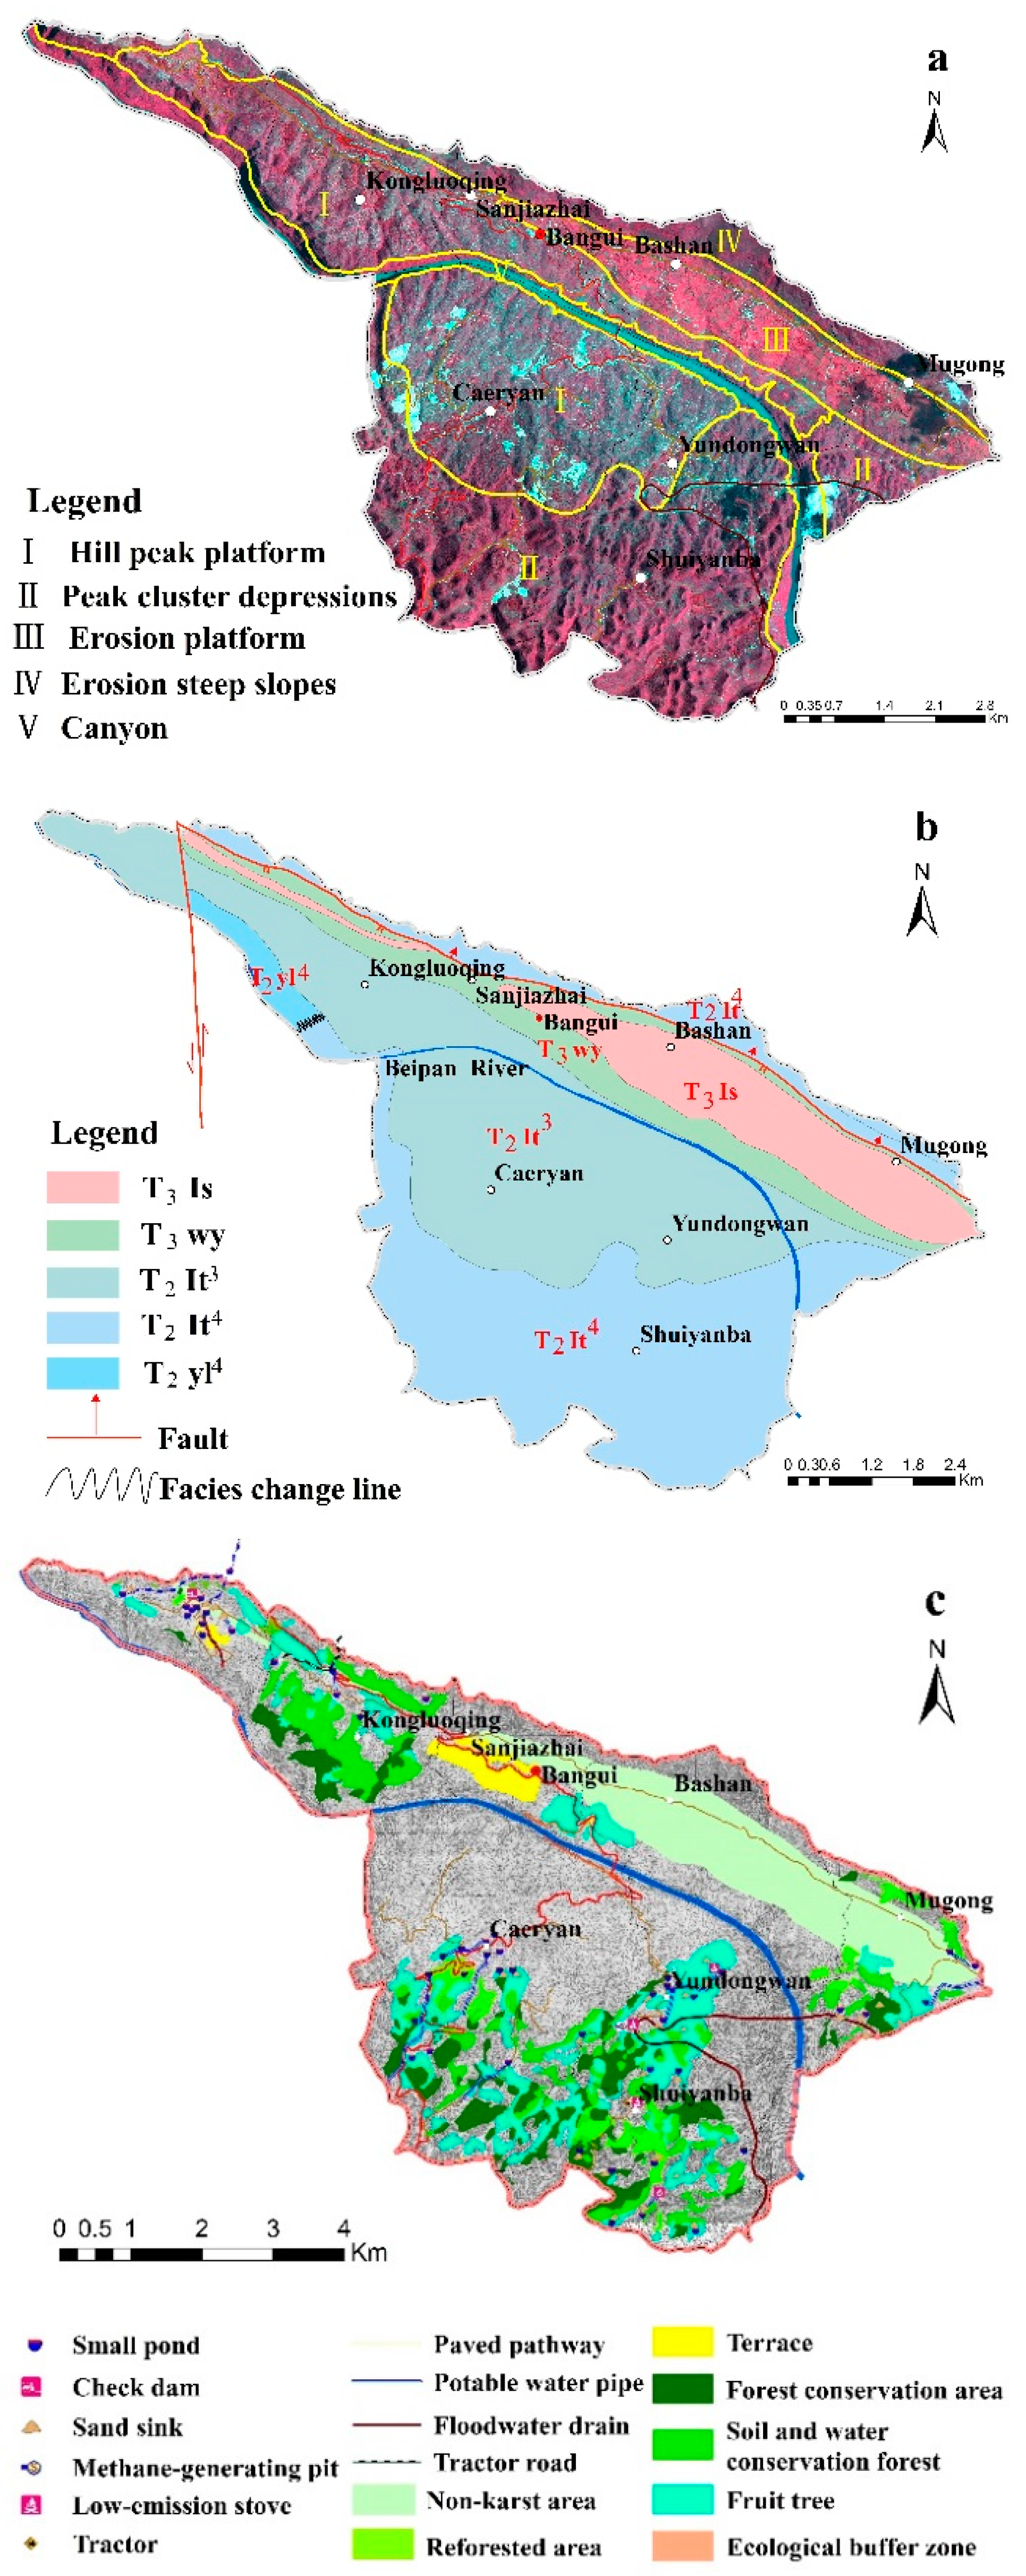
2.1. Study Area

The Huajiang Demonstration Area (HDA) is a typical karst dry-hot valley environment. It is located in the Huajiang Canyon of the Guizhou Plateau, between Guanling and Zhenfeng Counties. Its geographical coordinates are 105°36′30″E–105°46′30″E and 25°39′13″N–25°41′00″N (Figure 1). The total area of HDA is 51.2 km2 and the total population of the demonstration area was 8612 by the end of 2010. The mean population density was 1.7 persons per km2. Carbonate rock occupies > 95% of the total demonstration area. The elevation ranges from 450–1450 m and the average elevation is 1000 m above sea level. HDA is in a subtropical humid monsoon climate zone, with an annual mean temperature of 18.4°C and average annual precipitation of 1100 mm. Lime soil is distributed across this area, resulting in thin soil layers, discontinuous soil distribution, low forest coverage, poor water retention, and poor drought tolerance. With the exception of steep peaks with a few shrubs, desertified karst areas occupy ˃ 70% of the area [4].

2.2. Data Source

Landsat-7 ETM+ images (Row/Path: 127/42, 23 November 2000) and Landsat TM images (Row/Path: 127/42, 9 October 2005) were collected from the U.S. Geological Survey EDC. ALOS images (Row/Path: 21823/3085, 28 February 2010) were purchased from the Center for Earth Observation and Digital Earth Chinese Academy of Sciences (http://www.ceode.cas.cn/new/). The images were rectified to the Albers Equal Area Conic projection. Lithologic information was gained from the 1:200,000 scale regional hydrology geological map of the Guanling-Zhenfeng area (map number: G-48-XXII, Figure 2b). Altitude (DEM) data were taken from a 1:10,000 scale regional topographic map.
The map image was converted into a vector image. DEM data were then generated using the 3D Analyst tool in ArcGIS 10 which was released by ESRI (http://www.esri.com/). Triangular Irregular Network (TIN) is a commonly used algorithm to construct Digital Elevation Mode (DEM).TIN data were created using the “Create TIN From Features” tool, and the “Surface Analysis” tool was then applied to generate a slope map from the TIN surface. Precipitation data in HDA was procured from the Guizhou Province Meteorological Information Center and a portable automatic weather station (model (DAVIS-Vantage Pro26162). Using the supervised classification method to classify land use types, field investigations and sample monitoring were conducted to verify the accuracy of the land use/land cover (LULC). LULC was divided into 13 types, including paddy field, dry land, garden, forest, woodland, grass, river and lake, residential land, industrial and mining land, roadway, and rock [31]. We extracted the normalized difference vegetation index (NDVI) from remote sensing images using ENVI5.1 software, and then calculated vegetation coverage (FV) based on this figure [32]. The landscape diversity index was extracted using FRAGSTATS 3.3 [33]. The research method of soil erosion followed the national standard (SL 461-2009) [34], which divides soil erosion into five levels, including no erosion, mild erosion, moderate erosion, intense erosion, and very intense erosion. Building on the research of Xiong and Zhou [35], rocky desertification data were classified into non-karst areas, no rocky desertification, potential rocky desertification, mild desertification, moderate desertification, and strong rocky desertification. The cultivated land data were derived from the Second Chinese National Land Survey. By referring to data collected by Xiong et al. [4], as well as primary investigation, a comprehensive map of the KRD control mechanisms in HDA was generated (Figure 2c). Social and economic data—including per capita GDP, population density, and population characteristics, were obtained through a combination of local census data and interviews and surveys with local residents. Hemeroby index (HI) data were derived from the geomorphology and land use types of HDA. HI was divided into five levels, including extremely high, high, moderate, low, and extremely low levels of disturbance.

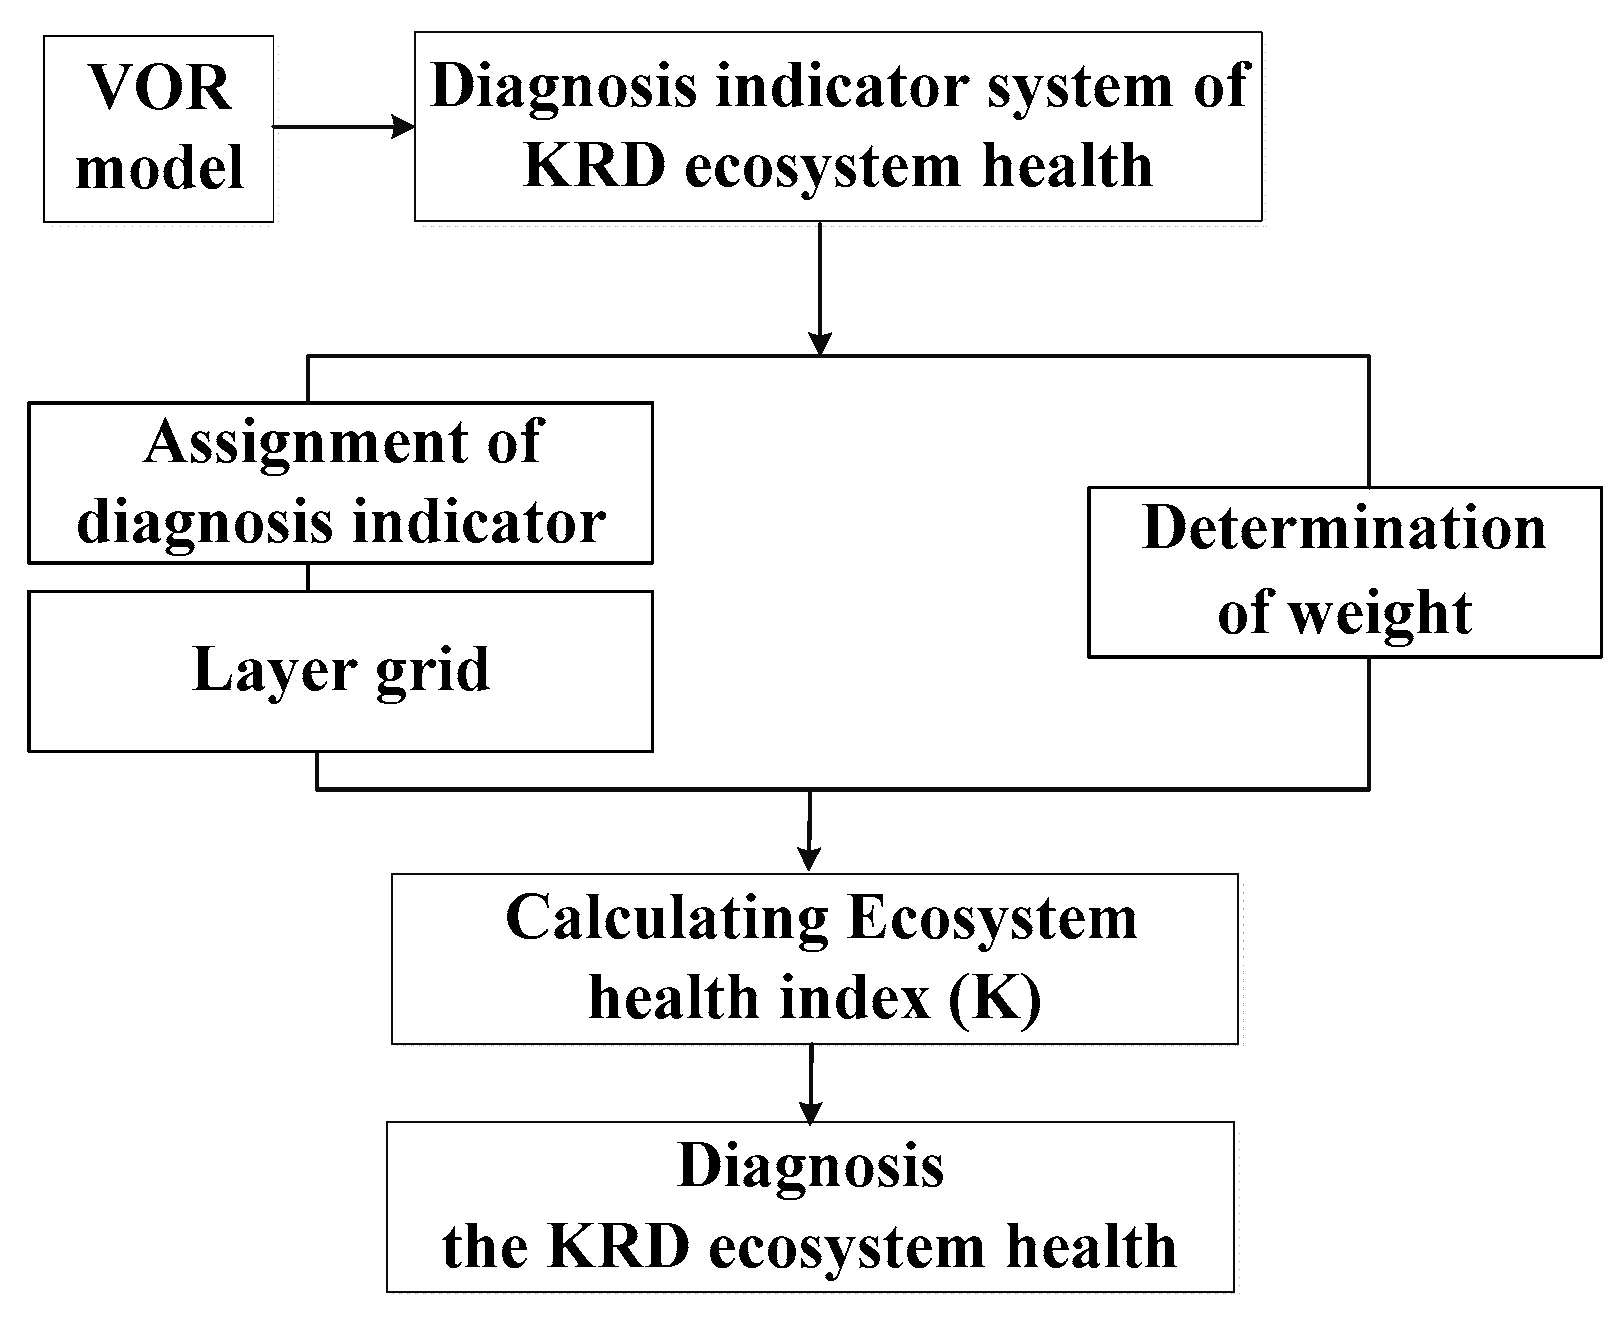
2.3. Design and Calculation of KRD Ecosystem Health Index (K)

Ecosystem health index (K) is a criterion to diagnose the health status of karst regions. A scale from 0–5 was chosen as the basis for this ranking, where a K value of zero indicates the worst possible health state and a K value of 5 indicates the best possible health state. K was further divided into five gradients, with ranges of 0–2, 2–2.5, 2.5–3, 3–4, and 4–5, corresponding to the five health gradients, ”Ill”, ”Unhealthy”, ”Middle Health”, ”Healthy”, and ”Excellent Health”, respectively (Table 1). The division of the Ecosystem Health Index was built according to the karst ecological environment quality index and the results of existing research [36].
Ecosystem health index (K) was calculated according to the formula:
K = i = 1 n E i × W i
where K is the comprehensive ecosystem health index, n is the number of diagnostic indicators, Wi is the weight of the i-th diagnostic indicator, and Ei is the health classification value.

2.4. Diagnosis Method in Grid GIS

Diagnoses of the health of the KRD-affected ecosystem was achieved using the following steps (Figure 3).
(1)
Built a diagnosis indicator system of KRD ecosystem health;
(2)
Prepared a thematic map of HDA for each of the diagnosis indicators. Each diagnosis indicator represents a layer and each thematic map (layer) corresponds to an indicator in the attribute table;
(3)
Assigned all diagnosis indicators with corresponding value according to the assignment table;
(4)
Determined weight of each diagnostic indicator;
(5)
Gridded the layers by first using the “projections” tool in ArcGIS to convert the multi-source data into the same projection coordinates. Then, using the “polygon to raster” tool, all of the indicator data were converted from vector data into raster data. Third, a resolution grid of 5 m × 5 m was chosen as the basic unit of calculation;
(6)
Stacked the layers and calculated the layers using the “calculator raster” tool to calculate the comprehensive index of ecosystem health (K);
(7)
Used the “reclassify” tool to classify the maps of Ecosystem Health Index (K) according to classification table; and
(8)
Analyzed the data.

2.4.1. Diagnosis Indicator System of KRD Ecosystem Health

Karst ecological systems are formed by flows of energy, materials, and information among and between humans and the natural environment [37]. The ecosystem health indicator system used in this study was based on 15 indices spanning geological, environmental, and socio-economic factors (Table 2). A healthy ecosystem can be defined in terms of three main features: vigor, organization and resilience [11,38]. This definition reflects the comprehensive characteristics of the system, and provides a framework for assessing ecosystem health. Vigor is the ecological metabolism and nutrient recycling capacity of an ecosystem. The vigor of the KRD-affected area is based on the vegetation coverage and coefficient of the cultivated land. The coefficient of the cultivated land is the proportion of the cultivated land area to the total land area. There is a positive linear correlation between NDVI and vegetation coverage.
F c o v e r = ( N D V I N D V I min ) / ( N D V I max N D V I min )
Fcover is the vegetation coverage value, ranging from 0 to 1. The higher the value, the greater the vegetation coverage.
Organization is the diversity of the ecosystem’s composition. This is based on the landscape diversity index, soil erosion, and rocky desertification grades. Soil erosion is a process of external forces (water, wind, gravity) and human activities that lead to soil destruction or soil loss. Soil erosion and rocky desertification are the main problems of ecosystem degradation in HDA. Soil erosion decreases soil quantity and compromises ecosystem functioning, due to the slow rate of soil regeneration. Consequently, the distribution of soil in HDA is not continuous. Rocky desertification in HDA is dominated by moderate and strong rocky desertification. According to the 2010 rocky desertification area statistical data by Xiong and Zhou [35], the rocky desertification area is 27.8 km2, >50% of the total area of the HDA. Soil erosion and rocky desertification leads to the decline of soil fertility, the decline of production capacity, and damage of the ecosystem structure and functioning.
Landscape diversity is the foundation for ecological functioning, adaptation, and resilience. Landscape diversity is used to characterize the structure of the ecosystem. In this paper, Shannon’s diversity index (H) was selected to quantify landscape diversity.
H = i = 1 m ( P i ) log 2 ( P i )
H is Shannon’s diversity index; Pi is the proportion of the total landscape area of each patch type; and m is the total number of patch types.
Resilience refers to the ability of the system to recover gradually once external pressure is eliminated. Comprehensive control measures implanted in HDA that help maintain resilience include water resource management initiatives, reforestation projects, clean energy development, community building, and the reallocation of tourism revenues for ecological restoration programs.
Humans have been an important component of the ecological change of ecosystems for millennia, and they have always radically altered the systems of which they have been components [39,40,41]. Social goals for sustainable ecosystem management are thus centered on maintaining the “ecological health” of the system [1]. We chose to include per capita GDP, population density, and population characteristics. These three indicators were used to characterize the impact of human activities on the ecosystem health of karst areas. Hemeroby index is a measure of the human influence on ecosystems [42].

2.4.2. Assignment of Diagnosis Indicator

In order to normalize the data, an assignment method was chosen to convert each diagnosis indicator to values 1, 3, 5, 7, and 9 corresponding to five health states, ”Ill”, ”Unhealthy”, ”Middle health”, ”Healthy”, and ”Excellent health” (Table 3). The assignment standard of each individual diagnosis indicator was based on national, industrial and local standards. The assignment standard of the lithology, altitude, and slope was built according to the “Comprehensive control of soil and water conservation: General rule of planning (GB/T15772-1995)”. The altitude range was assigned from 500–1400 m, based on the elevation of HDA. The annual precipitation factor was built according to the assignment method of precipitation by Xuan and Luo [43]. The land use factor was built according to the “Current land use classification in the People’s Republic of China (GB/T 201010-2007)”. The vegetation coverage and landscape diversity index factors were built according to the study by Fei et al. [44] and Abson et al. [45]. The soil erosion factor was built according to the “Techniques standard for comprehensive control of soil erosion and water loss in karst region (SL461-2009)”. The rocky desertification degree, coefficient of cultivated land and comprehensive control of KRD was built according to the “Rocky desertification comprehensive treatment planning outline in Karst area (2006–2015)”. Social and economic indicators were built according to local construction standards. The assignment standard of the Hemeroby index was built according to the method by Chen et al. [46].

2.4.3. Determination of Weights

Weight is used to measure the relative importance of each factor in the diagnosis system. At present, the analytic hierarchy process (AHP) is a decision making method to analyze complex decision problems with multiple criteria [47,48]. AHP is most widely used, as it is relatively mature. Therefore, AHP was used to determine the index weight in the health diagnosis of the ecological system (Table 2). To measure the consistency of the judgments made using AHP about the importance of each factor relative to large samples of purely random judgments, the consistency ratio (CR) was calculated [49]. The CR was <0.1, which indicates the reliability of the judgments generated through AHP.

3. Results

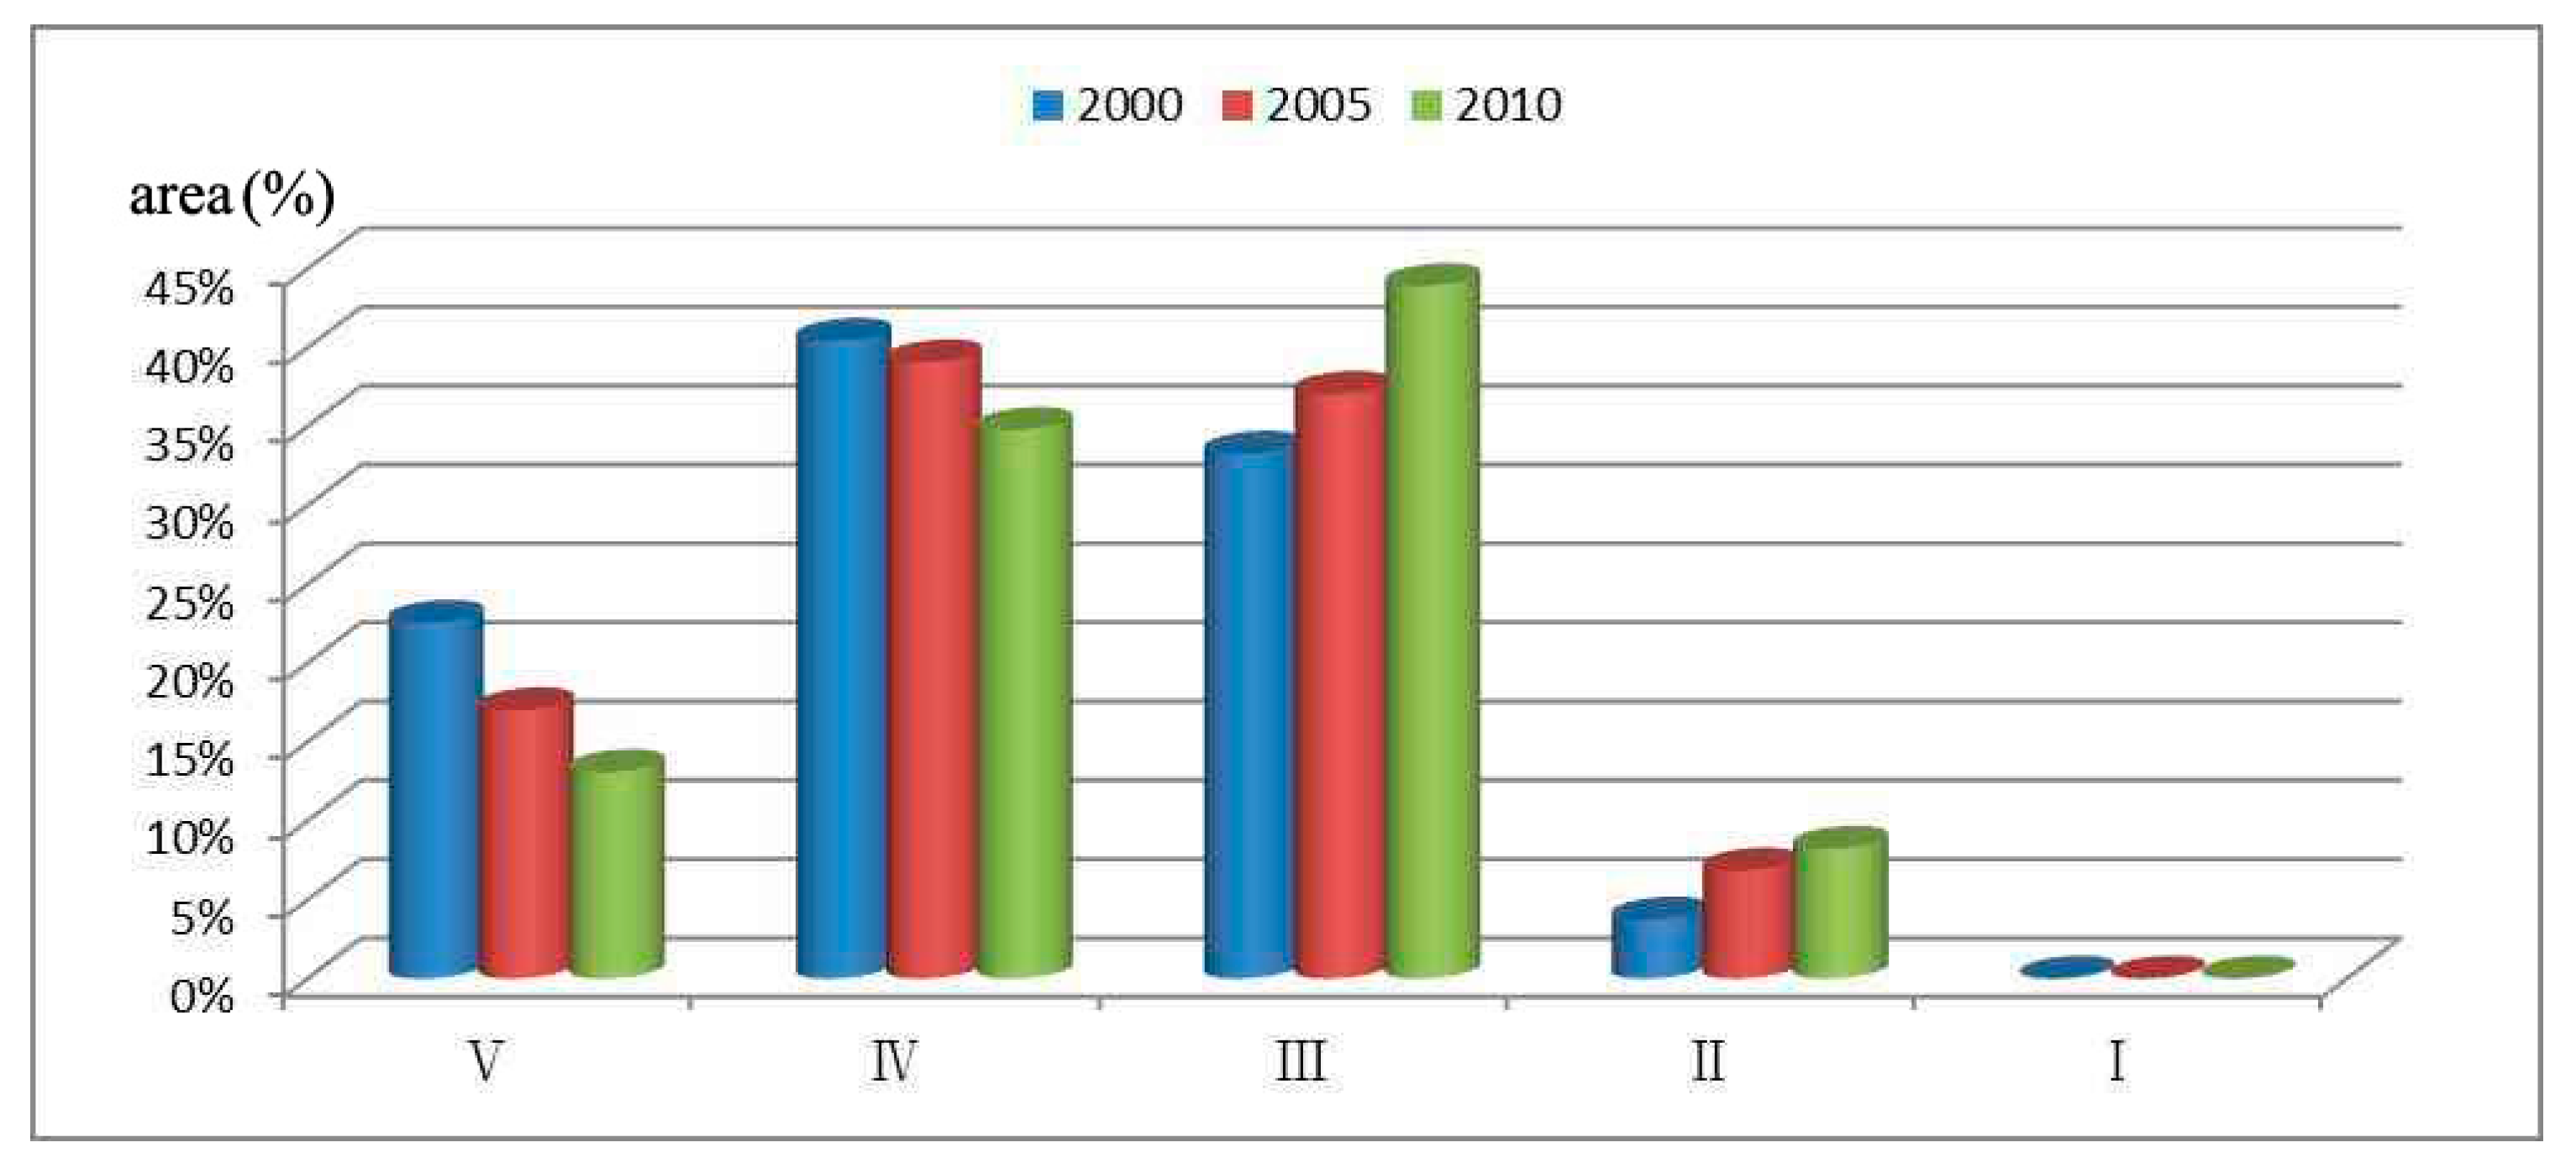
3.1. Temporal Dynamic Analysis of KRD Ecosystem Health

Using the health diagnosis index system and diagnosis model, the following conclusions regarding the ecological system health of HDA between 2000 and 2010 were drawn (Table 4).
In Figure 4, the horizontal axis represents the health category of the ecological system and the vertical axis represents the proportion of the total area in this health range. Comparing the comprehensive health diagnosis results of HDA of 2000, 2005, and 2010 shows that an excellent health zone did not exist. The proportion of healthy regions increased over time, from 3.7% in 2000 to 8.2% in 2010; and middle health areas increased to 33.2%, 37.1%, and 43.9% in 2000, 2005, and 2010, respectively. The proportion of unhealthy land was at its peak of 40.4% in 2000. The proportion of unhealthy areas dropped from 39.1% in 2005 to 34.8% in 2010. The proportion of ill areas decreased over time, from 22.7% in 2000, to 17.0% in 2005, and to 13.1% in 2010. Ultimately, these results show that the ecological system health of HDA has improved over time, but the overall ecological system remains in the unhealthy and middle health levels, accounting for 78.7% of the total area in 2010. The rate of ecological health improved faster in 2005–2010 than in 2000–2005. This was because there were no KRD restoration measures used between the years 2000–2005. However, such measures were adapted in 2008. By 2010, it was still too early to measure the full effects of these initiatives.

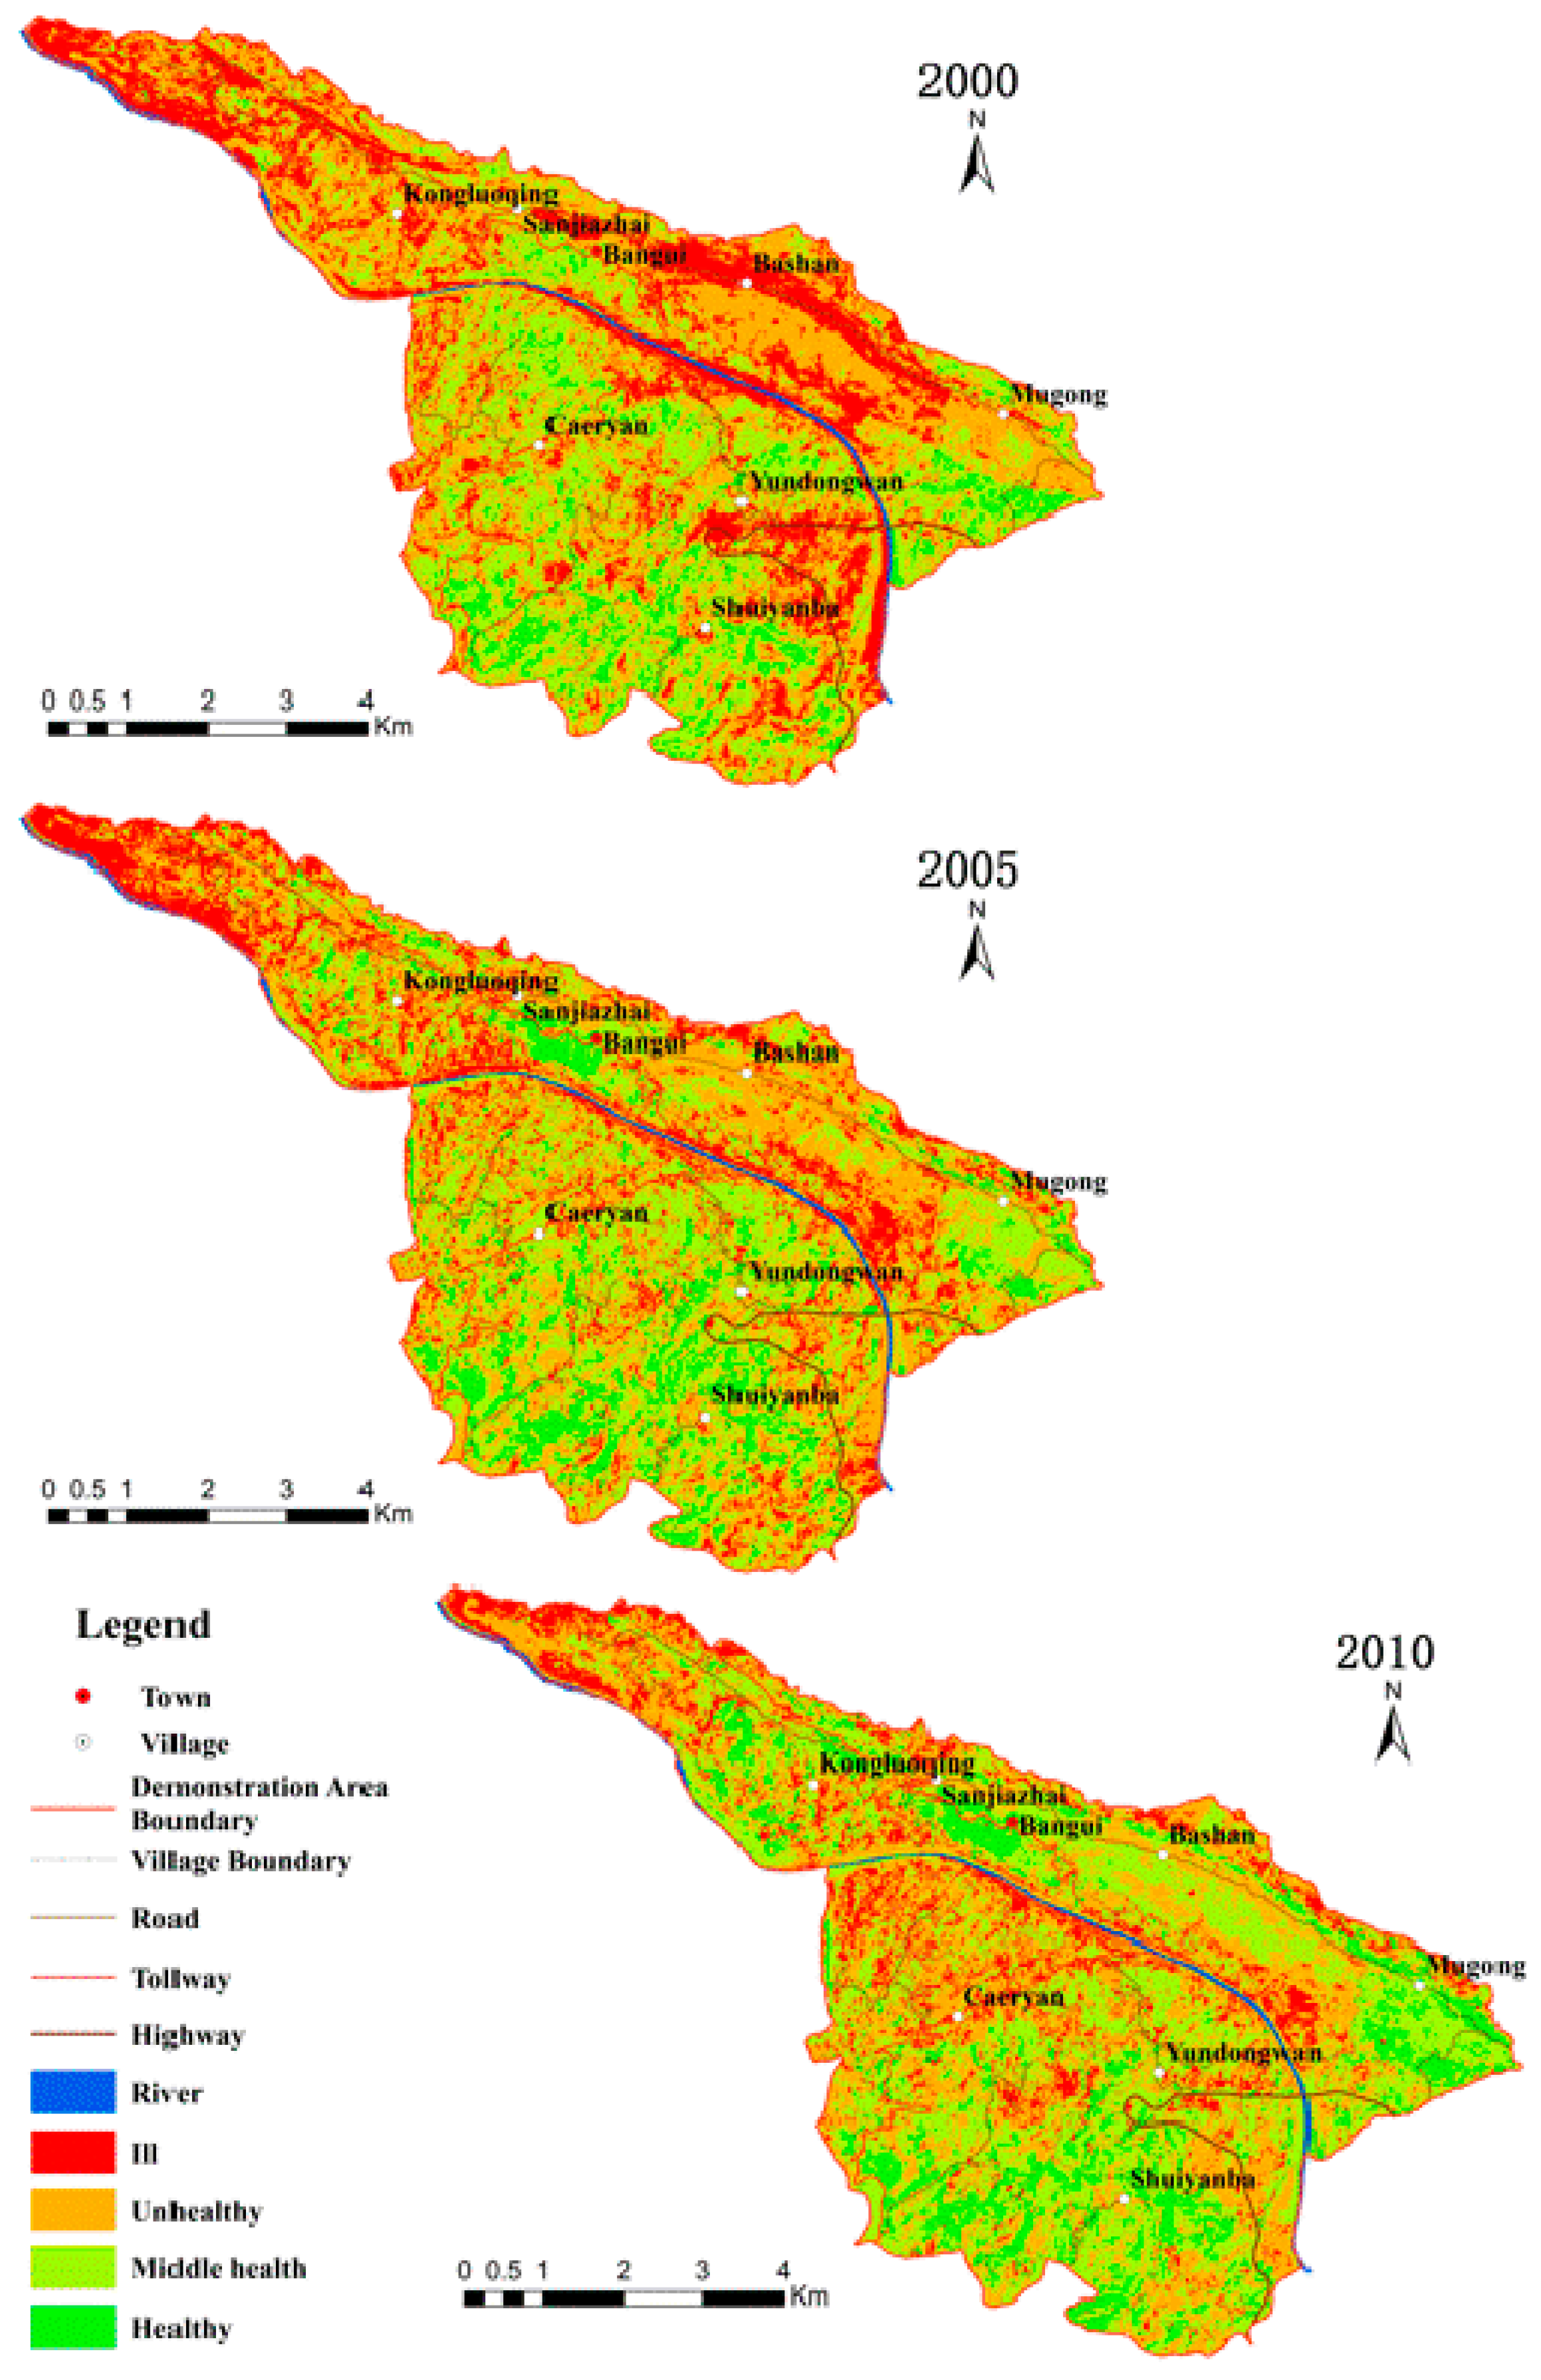
3.2. Spatial Distribution of KRD Ecosystem Health

Based on GIS analysis of ecosystem health in the HDA, there were notable temporal and spatial changes in ecological health between 2000 and 2010 (Figure 5). Over those 10 years, excellent health areas did not exist, but the area of healthy ecosystem increased. The most noticeably improved areas were distributed in peak cluster depressions, peak cluster valleys, and villages below 800 m altitude, including Yundongwan, Shuiyanba, Chaeryan, Sanjiazhai, and Kongluoqing villages. The distribution of middle health areas was uniform, located in different types of geomorphology and altitude, however, the area of middle health land of the hill peak platform along the Beipan River increased relative to other regions; unhealthy areas were concentrated in the hill peak platform and erosion platform, and desertification was serious in the area. Unhealthy and middle health were the most common land health types of HDA. Unhealthy areas were mainly distributed north of the Beipan River, located in the northeast part of the demonstration area, where there was erosion of steep slopes at altitudes 1000–1200 m. The land use types were grassland and bare rocks, characterized by steep slopes, soil erosion, serious rock desertification, and low vegetation coverage.

4. Discussion

The establishment of a diagnostic indicator system was useful in accurately diagnosing the ecosystem health of the KRD-affected area. Compared with other health indicator systems previously used in China [29,30], the diagnostic method based on grid GIS is more accurate at expressing spatial differences in ecosystem health. The selection of the diagnostic indicators and weight of the ecosystem health varies from area to area [50], and as such, the weighted indicator system applied in this study should only be applied for diagnosing the health of KRD-affected areas.
By analyzing the indicators and spatial characteristics of karst desertification, results show that human activity is the key factor affecting KRD ecosystem health. Appropriate human intervention, such as ecological restoration, bionomic control, and comprehensive control of KRD, can help alleviate the deterioration of karst ecological systems. In order to evaluate the effectiveness of comprehensive control measures on KRD on ecosystem health, ecosystem health must be tracked over time. A comparison of the 2000 map with the 2010 map shows that 78.3% of the total HDA area experienced no change in ecological health, 16.7% of total area experienced an improvement in ecological health, and 5.0% of total area experienced a deterioration in ecological health. The results indicate that the improvement of ecological health in areas with KRD control mechanisms was 36.9%, notably higher than the 9.6% increase in areas without control mechanisms. The results show that the comprehensive control mechanisms implemented in HDA have been effective in improving ecosystem health. Similar conclusions about the effectiveness of human intervention in curbing KRD have also been made [51,52].

5. Conclusions

This study has proposed a framework to diagnose the ecological health of KRD-affected areas using grid GIS, with attention to temporal and spatial variations. The ecosystem health status of the Huajiang Demonstration Area is mainly in unhealthy and middle health, which is a result of desertification, soil erosion, and excessive human exploitation. However, the ecosystem health of the Huajiang Demonstration Area has gradually improved over time, especially in areas where comprehensive treatment mechanisms have been applied. The results indicate that rocky desertification protection programs can effectively control the deterioration of the ecosystem in karst areas and improve the health of local ecosystems. Our GIS-based health diagnosis of the HDA area was consistent with field survey results. As such, the comprehensive treatment projects reported in this study may provide an effective model for ecosystem restoration programs in karst areas in South China.

Acknowledgments

This research was sponsored by National Natural Science Foundation of China (Grant No. 41661088), the National Basic Research Program of China (973 Program, Project No. 2012CB723202), The Major Application Foundation Research Project of Guizhou Province (Guizhou S&T Contract JZ 2014-200201), National Natural Science Foundation of China (Grant No. 41301504), and the International Scientific and Technological Cooperation Plan Projects of Guizhou Province (Guizhou S&T International Cooperation Contract G 2012-7022). We wish to thank Professor Honglin Xiao for assisting with the language modification. Authors also thank anonymous reviewers for their constructive suggestions and comments.

Author Contributions

Zhongfa Zhou and Shengzi Chen conceived and designed the experiments; Shengzi Chen performed the experiments; Shengzi Chen and Lihui Yan analyzed the data; Bo Li contributed reagents/materials/analysis tools; Shengzi Chen wrote the paper.

Conflicts of Interest

The authors declare no conflict of interest.

References

  1. Cai, Y. Preliminary research on ecological reconstruction in Karst mountain poverty areas of southwest China. Adv. Earth Sci. 1996, 11, 602–606. [Google Scholar]
  2. Sweeting, M.M. Karst in China: Its Geomorphology and Environment; Springer: Berlin, Germany, 1995. [Google Scholar]
  3. Yuan, D.X. Aspects on the new round land and resource survey in Karst rock desertification areas of south China. Carsol. Sin. 2000, 19, 103–108. [Google Scholar]
  4. Xiong, K.N.; Chen, Y.B.; Chen, H. Touch Graphite and Turn it into Diamond—The Ecological Techniques and Models of Control-Ling of Karst Rocky Desertification in GuiZhou Province; Guizhou Science & Technology Publishing House: Guiyang, China, 2011. [Google Scholar]
  5. Wang, S.J.; Liu, Q.M.; Zhang, D.F. Karst rocky desertification in Southwestern China: Geomorphology, landuse, impact and rehabilitation. Land Degrad. Dev. 2004, 15, 115–121. [Google Scholar] [CrossRef]
  6. Wang, S.J.; Li, Y.B. Problems and development trends about researches on Karst rocky desertification. Adv. Earth Sci. 2007, 22, 573–582. [Google Scholar]
  7. Sahaeffer, D.J.; Henricks, E.E.; Kerster, H.W. Ecosystem health: Measuring ecosystem health. Environ. Manag. 1988, 12, 445–455. [Google Scholar] [CrossRef]
  8. Rapport, D.J.; Costanza, R.; Michael, A.J. Assessing ecosystem health. Trends Ecol. Evol. 1998, 13, 397–402. [Google Scholar]
  9. Lackey, R.T. Values, Policy, and Ecosystem Health. Bioscience 2001, 51, 437–443. [Google Scholar] [CrossRef]
  10. Costanzia, R.; Norton, B.G.; Haskell, B.D. Ecosystem Health: New Goals for Environmental Management; Island Press: Washington, DC, USA; Covelo, CA, USA, 1992; pp. 239–256. [Google Scholar]
  11. Jørgensen, S.E. Exergy and ecological buffer capacities as measures of ecosystem health. Ecosyst. Health 1995, 1, 150–160. [Google Scholar]
  12. Yuan, F.; Zhang, X.Y.; Liang, J. Assessment indicators system of forest ecosystem health based on the disturbance in Wangqing forestry. Acta Ecol. Sin. 2013, 33, 3722–3731. [Google Scholar] [CrossRef]
  13. Fisher, M.C.; Henk, D.A.; Briggs, C.J.; Brownstein, J.S.; Madoff, L.C.; Mccraw, S.L. Emerging fungal threats to animal, plant and ecosystem health. Nature 2012, 484, 184–194. [Google Scholar] [CrossRef] [PubMed]
  14. Ogden, J.C.; Baldwina, J.D.; Bass, O.L.; Browder, J.A.; Cook, M.I.; Frederick, P.C. Waterbirds as indicators of ecosystem health in the coastal marine habitats of southern Florida: 1. Selection and justification for a suite of indicator species. Ecol. Indic. 2014, 44, 148–163. [Google Scholar] [CrossRef]
  15. Horwitz, P.; Finlayson, C.M. Wetlands as settings for human health: Incorporating ecosystem services and health impact assessment into water resource management. Bioscience 2011, 61, 678–688. [Google Scholar] [CrossRef]
  16. Li, C.; Ye, C.; Zhao, X.; Wang, Q.; Chen, X.; Kong, X.; Lu, S.; Xu, D.; Chen, Q. The ecosystem health assessment of the littoral zone of Lake Taihu. Acta Ecol. Sin. 2012, 32, 3806–3815. [Google Scholar]
  17. Liao, J.; Cao, X.; Jie, W.; Yi, H. Basin-scale aquatic ecosystem health assessment with composite indices of chemistry and aquatic biota: A study of Dianchi Lake. Acta Sci. Circumstantiae 2014, 34, 1845–1852. [Google Scholar]
  18. Zhu, W.; Cao, G.; Li, Y.; Xu, W.; Shi, M.; Qin, L. Research on the health assessment of river ecosystem in the area of Tumen River Basin. Acta Ecol. Sin. 2014, 34, 3969–3977. [Google Scholar]
  19. Tett, P.; Gowen, R.J.; Painting, S.J.; Elliott, M.; Forster, R.; Mills, D.K.; Bresnan, E.; Capuzzo, E.; Fernandes, T.F.; Foden, J.; et al. Framework for understanding marine ecosystem health. Mar. Ecol. Prog. Ser. 2013, 494, 1–27. [Google Scholar] [CrossRef]
  20. Kim, Y.O.; Xu, F.L. Marine ecosystem health assessments in Korean coastal waters. Ocean Sci. J. 2014, 49, 249–250. [Google Scholar] [CrossRef]
  21. Jin, S.L.; Huang, Y.Z. A review on rare earth elements in farmland ecosystem. Acta Ecol. Sin. 2013, 33, 4836–4845. [Google Scholar]
  22. Tang, D.; Zou, X.; Liu, X.; Liu, P.; Zhamangulova, N.; Xu, X.; Zhao, Y. Integrated ecosystem health assessment based on eco-energy theory: A case study of the Jiangsu coastal area. Ecol. Indic. 2015, 48, 107–119. [Google Scholar] [CrossRef]
  23. Jia, R.; Liu, X.; Zhao, X.; Song, S. Assessment of ecosystem health in Shenfu mining area. Coal Geol. Explor. 2011, 39, 46–51. [Google Scholar]
  24. Li, Y.; Dong, L. Assessment and forecast of Beijing and Shanghai’s urban ecosystem health. Sci. Total Environ. 2014, 487, 154–163. [Google Scholar] [CrossRef] [PubMed]
  25. Li, S.-J.; Luo, X.; Hu, Y.-N. Ecological Health Assessment of Shijiazhang Urban Ecosystem in Fasting Urbanizing City. Res. Soil Water Conserv. 2012, 19, 245–249. [Google Scholar]
  26. Liu, H. Ecosystem Health Assessment of Guangzhou City. Adv. Mater. Res. 2013, 726, 997–1000. [Google Scholar] [CrossRef]
  27. Parise, M.; Waele, J.D.; Gutierrez, F. Current perspectives on the environmental impacts and hazards in Karst. Environ. Geol. 2009, 58, 235–237. [Google Scholar] [CrossRef]
  28. Cao, H.; Su, W.C. Studies on ecosystem health evaluation based on fuzzy mathematics method in Karst areas. Res. Soil Water Conserv. 2009, 16, 148–154. [Google Scholar]
  29. Zhang, F.T.; Su, W.C.; Zhao, W.Q.; Liang, Y.H.; Shao, J.X. Ecosystem health assessment in mountainous areas of Karst plateau based on ecological footprint model. Bull. Soil Water Conserv. 2011, 31, 256–261. [Google Scholar]
  30. Kawakubo, F.S.; Morato, R.G.; Luchiari, A. Use of fraction imagery, segmentation and masking techniques to classify land-use and land-cover types in the Brazilian Amazon. Int. J. Remote Sens. 2013, 34, 5452–5467. [Google Scholar] [CrossRef]
  31. Pu, R.; Gong, P.; Tian, Y.; Miao, X.; Carruthers, R.I.; Anderson, G.L. Using classification and NDVI differencing methods for monitoring sparse vegetation coverage: A case study of saltcedar in Nevada, USA. Int. J. Remote Sens. 2007, 29, 3987–4011. [Google Scholar] [CrossRef]
  32. Ramezani, H. A Note on the Normalized Definition of Shannon’s Diversity Index in Landscape Pattern Analysis. Environ. Nat. Resour. Res. 2012, 2, 54–60. [Google Scholar] [CrossRef]
  33. Ministry of Water Resources of the People’s Republic of China (MWR). Techniques Standard for Comprehensive Control of Soil Erosion and Water Loss in Karst Region; China Water Conservancy and Hydropower Press: Beijing, China, 2010.
  34. Xiong, K.N.; Zhou, Z.F. Typical Study on Karst Rock Desertification RS and GIS—A Case Study of Guizhou Province; Geology Press: Beijing, China, 2002. [Google Scholar]
  35. Wei, X.D.; Zhou, Z.F.; Wang, Y.Y. Research on the Karst ecological security based on gridding GIS. J. Mt. Sci. 2012, 30, 681–687. [Google Scholar]
  36. Rombouts, I.; Beaugrand, G.; Artigas, L.F.; Dauvin, J.C.; Gevaert, F.; Goberville, E. Evaluating marine ecosystem health: Case studies of indicators using direct observations and modeling methods. Ecol. Indic. 2013, 24, 353–365. [Google Scholar] [CrossRef]
  37. Baek, S.H.; Son, M.; Kim, D.; Choi, H.W.; Kim, Y.O. Assessing the ecosystem health status of Korea Gwangyang and Jinhae bays based on a planktonic index of biotic integrity (P-IBI). Ocean Sci. J. 2014, 49, 291–311. [Google Scholar] [CrossRef]
  38. Wang, D.L.; Zhu, S.Q.; Huang, B.L. Preliminary study on types and desertification in Guizhou Province, quantitative assessment of Karst rocky China. Acta Ecol. Sin. 2005, 25, 1057–1063. [Google Scholar]
  39. Mageau, M.T.; Costanza, R.; Ulanowicz, R.E. The development and initial testing a quantitative assessment of ecosystem health. Acta Psychiatr. Scand. 1995, 1, 201–213. [Google Scholar]
  40. Flannery, T.F. The Future Eaters: An Ecological History of the Australasian Lands and People; Reed Press: Melbourne, Australia, 1994. [Google Scholar]
  41. Redman, C.L. Human Impact on Ancient Environments; University of Arizona Press: Tucson, AZ, USA, 1999. [Google Scholar]
  42. Diamond, J. Collapse: How Societies Choose to Fail or Succeed; Viking Penguin: New York, NY, USA, 2005. [Google Scholar]
  43. Ji, X.; Luo, Y. A Precipitation Estimation Method and Its Application in Hydrologic Simulation in Data-scarce High Mountain Area. J. Irrig. Drain. 2011, 30, 103–106. [Google Scholar]
  44. Fei, M.C.; Wen, M.J.; Aosaier, B. Quantitative Assessment of Vegetation Coverage Factor in USLE Model Using Remote Sensing Data. Bull. Soil Water Conserv. 2001, 21, 6–9. [Google Scholar]
  45. Abson, D.J.; Fraser, E.D.; Benton, T.G. Landscape diversity and the resilience of agricultural returns: A portfolio analysis of land-use patterns and economic returns from lowland agriculture. Agric. Food Secur. 2013, 2, 1–15. [Google Scholar] [CrossRef]
  46. Chen, A.L.; Zhu, B.Q.; Chen, L.D.; Wu, Y.H.; Sun, R.H. Dynamic changes of landscape pattern and eco-disturbance degree in Shuangtai estuary wet land of Liaoning province, China. Chin. J. Appl. Ecol. 2010, 21, 1120–1128. [Google Scholar]
  47. Lu, L.; Zhan, Y.; Ye, Y.; Chen, J. Regional ecosystem health assessment based on land use pattern: A case of study of Zhoushan Island. Acta Ecol. Sin. 2010, 30, 245–252. [Google Scholar]
  48. Su, X.Y.; Wu, J.Y.; Zhang, H.J.; Li, Z.Q.; Sun, X.H.; Deng, Y. Assessment of grain security in China by using the AHP and DST methods. J. Agric. Sci. Technol. 2012, 14, 715–726. [Google Scholar]
  49. Huang, Q.H.; Cai, Y.L. Spatial pattern of Karst rock desertification in the Middle of Guizhou Province, Southwestern China. Environ. Geol. 2007, 52, 1325–1330. [Google Scholar] [CrossRef]
  50. Su, W.C.; Yang, H.; Li., Q.; Guo, Y. Rocky land desertification and its controlling measurements in the Karst mountainous region, Southwest of China. Chin. J. Soil Sci. 2006, 37, 446–450. [Google Scholar]
  51. Wu, J.G.; Chang, X.X. Assessment of the Health of Desert Ecosystem. J. Desert Res. 2005, 25, 604–611. [Google Scholar]
  52. Styers, D.M.; Chappelka, A.H.; Marzen, L.J.; Somer, G.L. Developing a land-cover classification to select indicators of forest ecosystem health in a rapidly urbanizing landscape. Landsc. Urban Plan. 2010, 94, 158–165. [Google Scholar] [CrossRef]
Figure 1. Location of the study area.
Sustainability 08 00975 g001
Figure 2. (a) Geomorphologic map; (b) lithologic map; and (c) map of the comprehensive KRD control mechanisms of HAD.
Sustainability 08 00975 g002
Figure 3. The procedure for diagnosing the health of KRD-affected areas using Grid GIS.
Sustainability 08 00975 g003
Figure 4. Ecosystem health diagnoses of the Huajiang Demonstration Area.
Sustainability 08 00975 g004
Figure 5. The spatial distribution map of ecosystem health in the Huajiang Demonstration Area.
Sustainability 08 00975 g005
Table 1. Classification of KRD ecosystem health.
LevelEcosystem Health Index (K)StateCharacteristics of Ecosystem Health Index (K)
I>4Excellent HealthHigh level of structural integrity, stability, and sustainability; perfect ecological function; none or nearly no negative impact from external human and/or non-human factors; no abnormalities; high resilience.
II(3, 4]HealthyModerate level of structural integrity, stability, and sustainability; high ecological function; slight negative impact from external human and/or non-human factors; no abnormalities; moderate resilience.
III(2.5, 3]Middle HealthMarginal level of structural integrity, stability, and sustainability; degraded ecological functioning; noticeable levels of human disturbance; low resilience.
IV(2, 2.5]UnhealthyLow level of structural integrity, stability, and sustainability; degraded ecological functioning; significant human disturbance; low resilience
V≤2IllExtremely poor structural integrity, stability, and sustainability; highly degraded ecological functioning; severe human disturbance; very low resilience
Table 2. Indicators for assessing the health of KRD-affected areas.
Object (Level A)Aspects BElement CIndicators DData SourcesWeight E
Ecological system health diagnosis in rocky desertification areaGeologic support systemGeologyLithologyGeologic map0.0297
TerrainAltitudeDEM data0.0218
SlopeDEM data0.0315
ClimateAnnual precipitationMonitoring data0.0392
SoilLand useRS + GIS + DEM data0.0978
Environmental support systemVitalityVegetation coverageRS + GIS + Monitoring data0.0899
Coefficient of cultivated landRS + GIS + The basic geographic data0.0512
OrganizationSoil erosionRS + GIS + Monitoring data0.0848
Landscape Diversity IndexRS + GIS + The basic geographic data0.0699
Rocky desertification gradesRS + GIS + Monitoring data0.0943
Restoring forceComprehensive control of KRDRS + GIS + Monitoring data0.1398
Socio-economic support systemEconomicsPer capita GDPField survey data0.0345
PopulationPopulation densityField survey data0.0641
Education levelPopulation characteristicsField survey data0.0321
Human interferenceHemeroby IndexRS + GIS + basic geographic data0.1194
Table 3. Health diagnosis classification system for KRD-affected areas.
IndicatorDiagnosis Value, Evaluation Standard, Standard Classification
9, I,
Excellent Health
7, II,
Healthy
5, III,
Middle Health
3, IV,
Unhealthy
1, V,
Ill
LithologyT3lsT3wyT2lt4T2lt3T2yl
Altitude (m)500–650650–850850–10501050–12501250–1400
Slope (°)<88–1515–2525–35>35
Annual precipitation (mm)1300–14001200–1300; >14001100–12001000–1100<1000
Land useForest, River and lakeWoodland, Grass, Paddy fieldDryland, GardenResidential land, RoadwayIndustrial and mining area, rock
Vegetation coverage>0.750.6–0.750.45–0.60.3–0.45<0.3
Landscape Diversity Index>2.52–2.5<2--
Soil erosionNo erosionMild erosionModerate erosionIntense erosionVery intense erosion
Rocky desertification degreeNon-Karst area, No rocky desertificationPotential rocky desertificationMild desertificationModerate desertificationStrong rocky desertification
Coefficient of cultivated land<1010–2020–3535–50>50
Comprehensive control of KRD-Conservancy area Forest for soil and water conservationFruit forest zones Protection forest Terraced plowing Planting grassNo project area
Per capita GDP (¥ *)>45003500–45002500–35001500–2500<1500
Population density (people per km2)<100100–150150–200200–250>250
Population characteristics (person)>2520–2515–2010–15<10
Hemeroby IndexNot interference <0.1Light disturbance 0.1–0.39Moderate disturbance 0.4–0.59Disturbance intensity 0.6–0.79Pole strength interference 0.8–1
* US $1 = ¥6.6796, €1 = ¥7.4932 (date: 14 September 2016).
Table 4. Diagnosis of ecosystem health in the HDA.
RankEcological Health DiagnosisIn 2000 In 2005In 2010∆ * 2000–2005 (%)∆ * 2005–2010 (%)∆ * 2000–2010 (%)
Area (km2)Proportion (%)Area (km2)Proportion (%)Area (km2)Proportion (%)
Excellent health000000000
Healthy1.93.73.56.84.28.23.11.44.5
Middle health1733.21937.122.543.93.96.810.7
Unhealthy20.740.42039.117.834.8−1.3−4.3−5.6
Ill11.622.78.7176.713.1−5.7−3.9−9.6
* The proportion of change.

