Next Article in Journal
Measurement of Heat-Flux of New Type Façade Walls
Previous Article in Journal
Diffusion Patterns in Convergence among High-Technology Industries: A Co-Occurrence-Based Analysis of Newspaper Article Data
 
 
Correction published on 21 June 2017, see Sustainability 2017, 9(6), 1074.
Article

CUDe—Carbon Utilization Degree as an Indicator for Sustainable Biomass Use

1
Leibniz Institute for Agricultural Engineering and Bioeconomy (ATB), Max–Eyth–Allee 100, 14469 Potsdam, Germany
2
Faculty of Life Sciences, Humboldt–Universität zu Berlin, Invalidenstraße 42, 10115 Berlin, Germany
*
Author to whom correspondence should be addressed.
Sustainability 2016, 8(10), 1028; https://doi.org/10.3390/su8101028
Submission received: 19 July 2016 / Revised: 28 September 2016 / Accepted: 8 October 2016 / Published: 14 October 2016
(This article belongs to the Section Environmental Sustainability and Applications)

Abstract

:
Carbon (C) is a central element in organic compounds and is an indispensable resource for life. It is also an essential production factor in bio-based economies, where biomass serves many purposes, including energy generation and material production. Biomass conversion is a common case of transformation between different carbon-containing compounds. At each transformation step, C might be lost. To optimize the C use, the C flows from raw materials to end products must be understood. The estimation of how much of the initial C in the feedstock remains in consumable products and delivers services provides an indication of the C use efficiency. We define this concept as Carbon Utilization Degree (CUDe) and apply it to two biomass uses: biogas production and hemp insulation. CUDe increases when conversion processes are optimized, i.e., residues are harnessed and/or losses are minimized. We propose CUDe as a complementary approach for policy design to assess C as an asset for bio-based production. This may lead to a paradigm shift to see C as a resource that requires sustainable exploitation. It could complement the existing methods that focus solely on the climate impact of carbon.

1. Introduction

Carbon (C) is an essential part of life on earth; approximately 50% of dry plant biomass is carbon (Table 1). All organisms rely on C in their metabolism, for example, to generate body tissue and energy carriers [1].
In the same way, human society relies on carbon, particularly in the form of chemical compounds:
  • as carbohydrates and fats in food and feed,
  • as hydrocarbons in energy carriers and
  • as bulk chemicals for the chemical industry.
Humans are dependent on C as a production factor, whether derived from biogenic or fossil sources. However, this perception is not widely held: C is mostly addressed in the context of climate change in its bonded form in greenhouse gases (GHG; carbon dioxide: CO2, methane: CH4) or as a pollutant (e.g., in volatile organic compounds). Hence, it is more common to see C as a threat instead of an indispensable resource. The interest in its climate change impact is reasonable because the C buffer capability of the atmosphere and other natural sinks is limited [6].
The perception of C in CO2 as a production factor has progressively gained scientific interest, which can be observed from conference topics [7], from the increasing number of studies on so-called ‘dream reactions’ [8], by which CO2 is (re-)transformed into organic compounds as chemical bulk material [9], as well as from a journal with special focus on this topic since 2013 [10]. This is demonstrated by a three-digit increase in low-carbon studies since 2011 [11], representing also societies’ interest in a transition from a fossil-based economy to a bio-economy (‘low-carbon’). As stated above, one main reason for this transformation is to avoid climate change by using recently fixed rather than fossilized carbon compounds. However, sustainability assessments of biomass production and usage in the context of a transition to a bio-economy should include more than just their climate impact, and reliable indicators are needed [12,13]. Impact-oriented assessments have to address several methodological caveats, which are discussed in depth in scientific literature on climate impact. Among them are the appropriate choice of reference systems [14], the assessment of indirect effects [15], the allocation in multi-product systems [16], the CO2 neutrality assumption for biomass [17], and changes in metrics (e.g., global warming potentials change with the new release of IPCC reports [18]). Such restrictions are also relevant for other impact assessments.
Following a paradigm shift from mainly impact-oriented perception (for example, climate change) to a productivity-oriented one, we suggest a consideration of C in biomass as a limited resource. Although C is abundant in its gaseous form as CO2 in the atmosphere, its transformation into biomass C is a demanding process, needing, for instance, energy, land, water, and nutrients. Furthermore, C is a resource that cannot be substituted by other elements, and the strong sustainability concept needs to be applied [19]. We can assess its appropriate use with the methodological concept of ‘productivity’, which is common in economics. Productivity is an indicator for the use of limited resources and is expressed as an output/input ratio, e.g., Hill [20]. Several published approaches use the productivity concept to assess C, for instance, technology- [21], sector- [22] or country-specific [23,24] (for more approaches, please refer to Appendix Table A1). However, their common focus is the cost-efficient reduction of CO2 emissions to avoid climate change [21]. Recently, the limitation of resources has led to approaches that seek to decouple economic growth and resource use by switching from linear to more circular economic models. Circularity indicators were presented to measure their success [25]. However, they focus on non-renewable resources and have only limited applicability for renewable materials, such as biomass.
In this manuscript, we adopted the productivity concept for a new indicator, Carbon Utilization Degree (CUDe), and apply it to two case studies. CUDe aims to assess efficient C use in production chains. Our objectives are:
  • to extend the perception of C (and accordingly CO2) from having a negative impact to being an indispensable, limited resource and
  • to provide a supplementary indicator for policy decision support to express efficient C use in production chains.

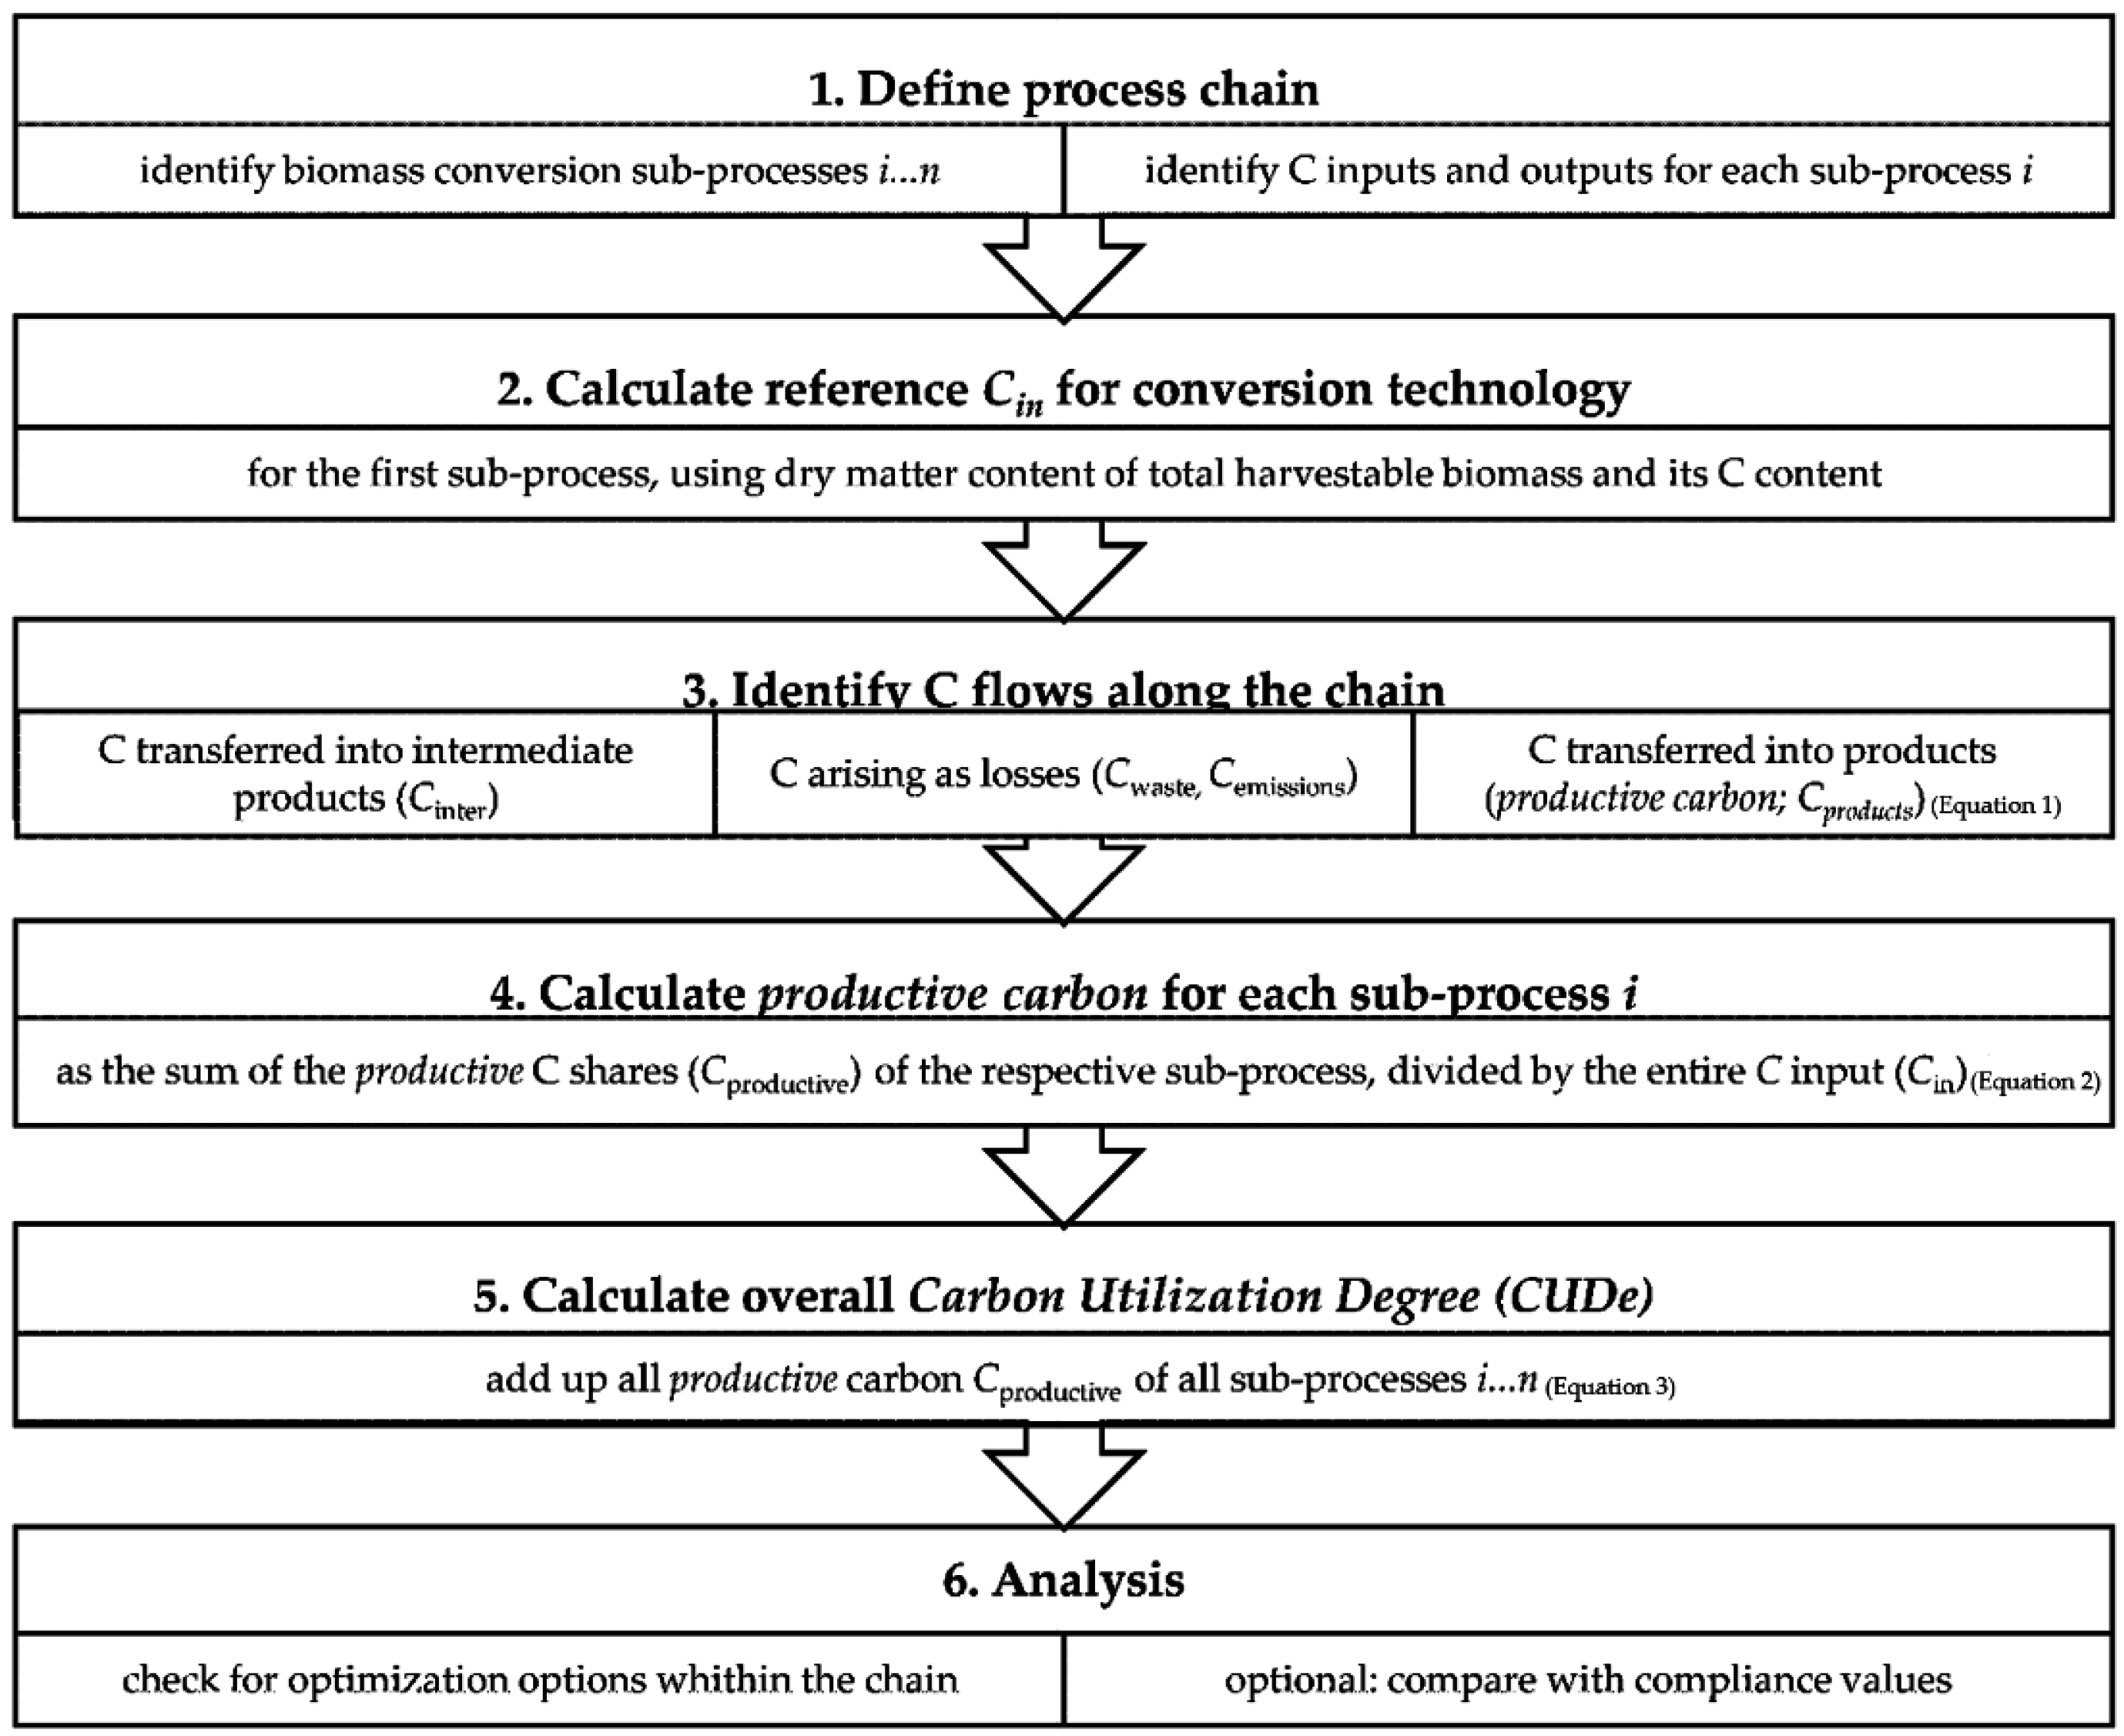
2. The Carbon Utilization Degree Approach

Productivity is generally defined as the ratio of output to input (r = output/input), sometimes expressed as a percentage (rp = output/input × 100) [20]. Accordingly, productivity increases if more output is produced from the same input. This can occur if losses are reduced or if additional outputs are generated, for instance, by putting waste to use.
We adopt this concept and propose CUDe (We use the term ‘CUDe’ to avoid confusion with other concepts: ‘C productivity’, which was defined as the specific GDP/CO2 in Kaya and Yokobori [23], or with ‘C efficiency’, which was defined as the ratio of the target level of C emissions and the actual level of C emissions of an economy in Yang [22]. Productiveness, as another possible term, has a different meaning than productivity in an economic context (“[…] productiveness (or productive capacity) is a measure of the quality of being productive or having the capacity to produce” [26]).) as a supplementary indicator for policy decision support to assess biomass conversion technology. It expresses the productive carbon fraction of the biomass that is utilized in biomass conversion chains. CUDe is defined as the ratio of carbon which is finally productive, to the carbon that was originally available in the biomass. Carbon is considered productive in an anthropocentric view if it provides a useful output, i.e., it:
  • is transformed into marketable products or provides useful services, e.g., insulation material, forage or energy generation (direct benefit), or
  • performs important ecological functions, e.g., improves soil fertility (indirect benefit).
The approach to calculate the Carbon Utilization Degree for a biomass conversion pathway follows a process chain assessment and comprises five steps plus an analysis step (Scheme 1).
First, all relevant transformation processes in the chain need to be identified and described. In the second step, the system’s carbon input is defined as a reference value: the amount of fixed carbon Cin in the harvestable biomass that enters the process chain is calculated. Third, for each of the subsequent processes, the C balance is determined. C is considered in the following flows: transfer to the chain boundary as products (Cproducts), transfer to a following process as intermediates (Cinter), and C in wastes (Cwaste) and emissions (Cemissions). Then, the productive carbon is calculated by adding up Cproducts, which equals the difference between Cin and the C in wastes, emissions and intermediate products (Equation (1)). The productive C related to the originally fixed Cin is expressed as a percentage share for each (sub-)process (Equation (2)). In the fifth step, the Carbon Utilization Degree of the chain is calculated by adding up the productive carbon shares of all sub-processes (Equation (3)). In the final step, sub-processes with wastes and emissions or the complete chain can be analyzed further to identify the optimization potential and, optionally, to check whether compliance values are reached. The latter could be set by policy in the future, for example, that a minimum CUDe of 66% has to be reached for a specific technology to receive tax reductions or to apply for incentives.
CUDe can be calculated according to Equations (1)–(3):
C productive   i   [ kg   C ] = C products   i   =   C inter   i 1     C emissions   i   C waste   i   C inter   i with   i = 1 ,   ,   n ;   C inter   0 = C in ;   C inter   n = 0
C productive   i   [ % ] = C productive   i C in · 100   with   i = 1 ,   ,   n
C U D e   [ % ]   = i = 1 n   C productive   i   [ % ]
Cin is the carbon content [kg C; Cin > 0] of the entire harvestable biomass (i.e., including the harvest residues) that enters the biomass transformation chain at sub-process i = 1. It explicitly includes the C in harvest residues that remains in the field, for instance, as stubble, to address other sustainability aspects. Although C in stubble is finally returned to the atmosphere via soil biota on varying time scales, we consider it productive because it contributes to sustainable agricultural management. However, this effect is limited and could be accounted for more precisely, for instance by inclusion of site-specific characteristics.
Cin can be calculated from own data generated by a chemical analysis, from published C contents of biomass that are available in the literature (some dry matter contents are listed in Table 1), or from data repositories, for instance, from ecoinvent [27]. Data on harvest residues can also be derived from repositories, for example, from FAO [28].
The total number of transformation processes in the conversion chain is denoted by n, whereas i denotes the respective sub-process, where C is further transformed to products and intermediates or is lost. Cemissions i consists of the gaseous C losses [kg CO2, kg CH4] that are converted into kg C according to their molar conversion factors: CFCO2 = 12/44 [kg C/kg CO2], and CFCH4 = 12/16 [kg C/kg CH4] as well as fluid C losses. Cwaste i is the C in production waste. Cproductive i is the productive C of sub-process i, whereas CUDe represents the productive carbon of the complete transformation chain. Cinter i [kg C] is the carbon that is transferred as an intermediate product from sub-process i to the following sub-process i + 1. We assume that every transformation chain yields some useful carbon. Hence, CUDe ∈ (0, ∞], representing that C reuse is theoretically infinite. The upper frontier ∞ originates from the possibility of using biomass in a cascading way: biomass can—like many non-renewable resources—be used several times, first (or more often) as a material and finally as an energy carrier. With this understanding, we follow the definition of cascading use in Carus et al. [29]. n greater than two means that after the harvesting step, (part of) the biomass is used at least two times. In such cases, in contrast to common productivity or efficiency calculations, the numerator can take values higher than the denominator and the total CUDe can yield values greater than 100%.
In the following section, we apply the CUDe concept to simplified systems of current technologies that transform biomass into energy (bioelectricity from maize silage) or to a material (hemp fibers as insulation).

3. Example Application

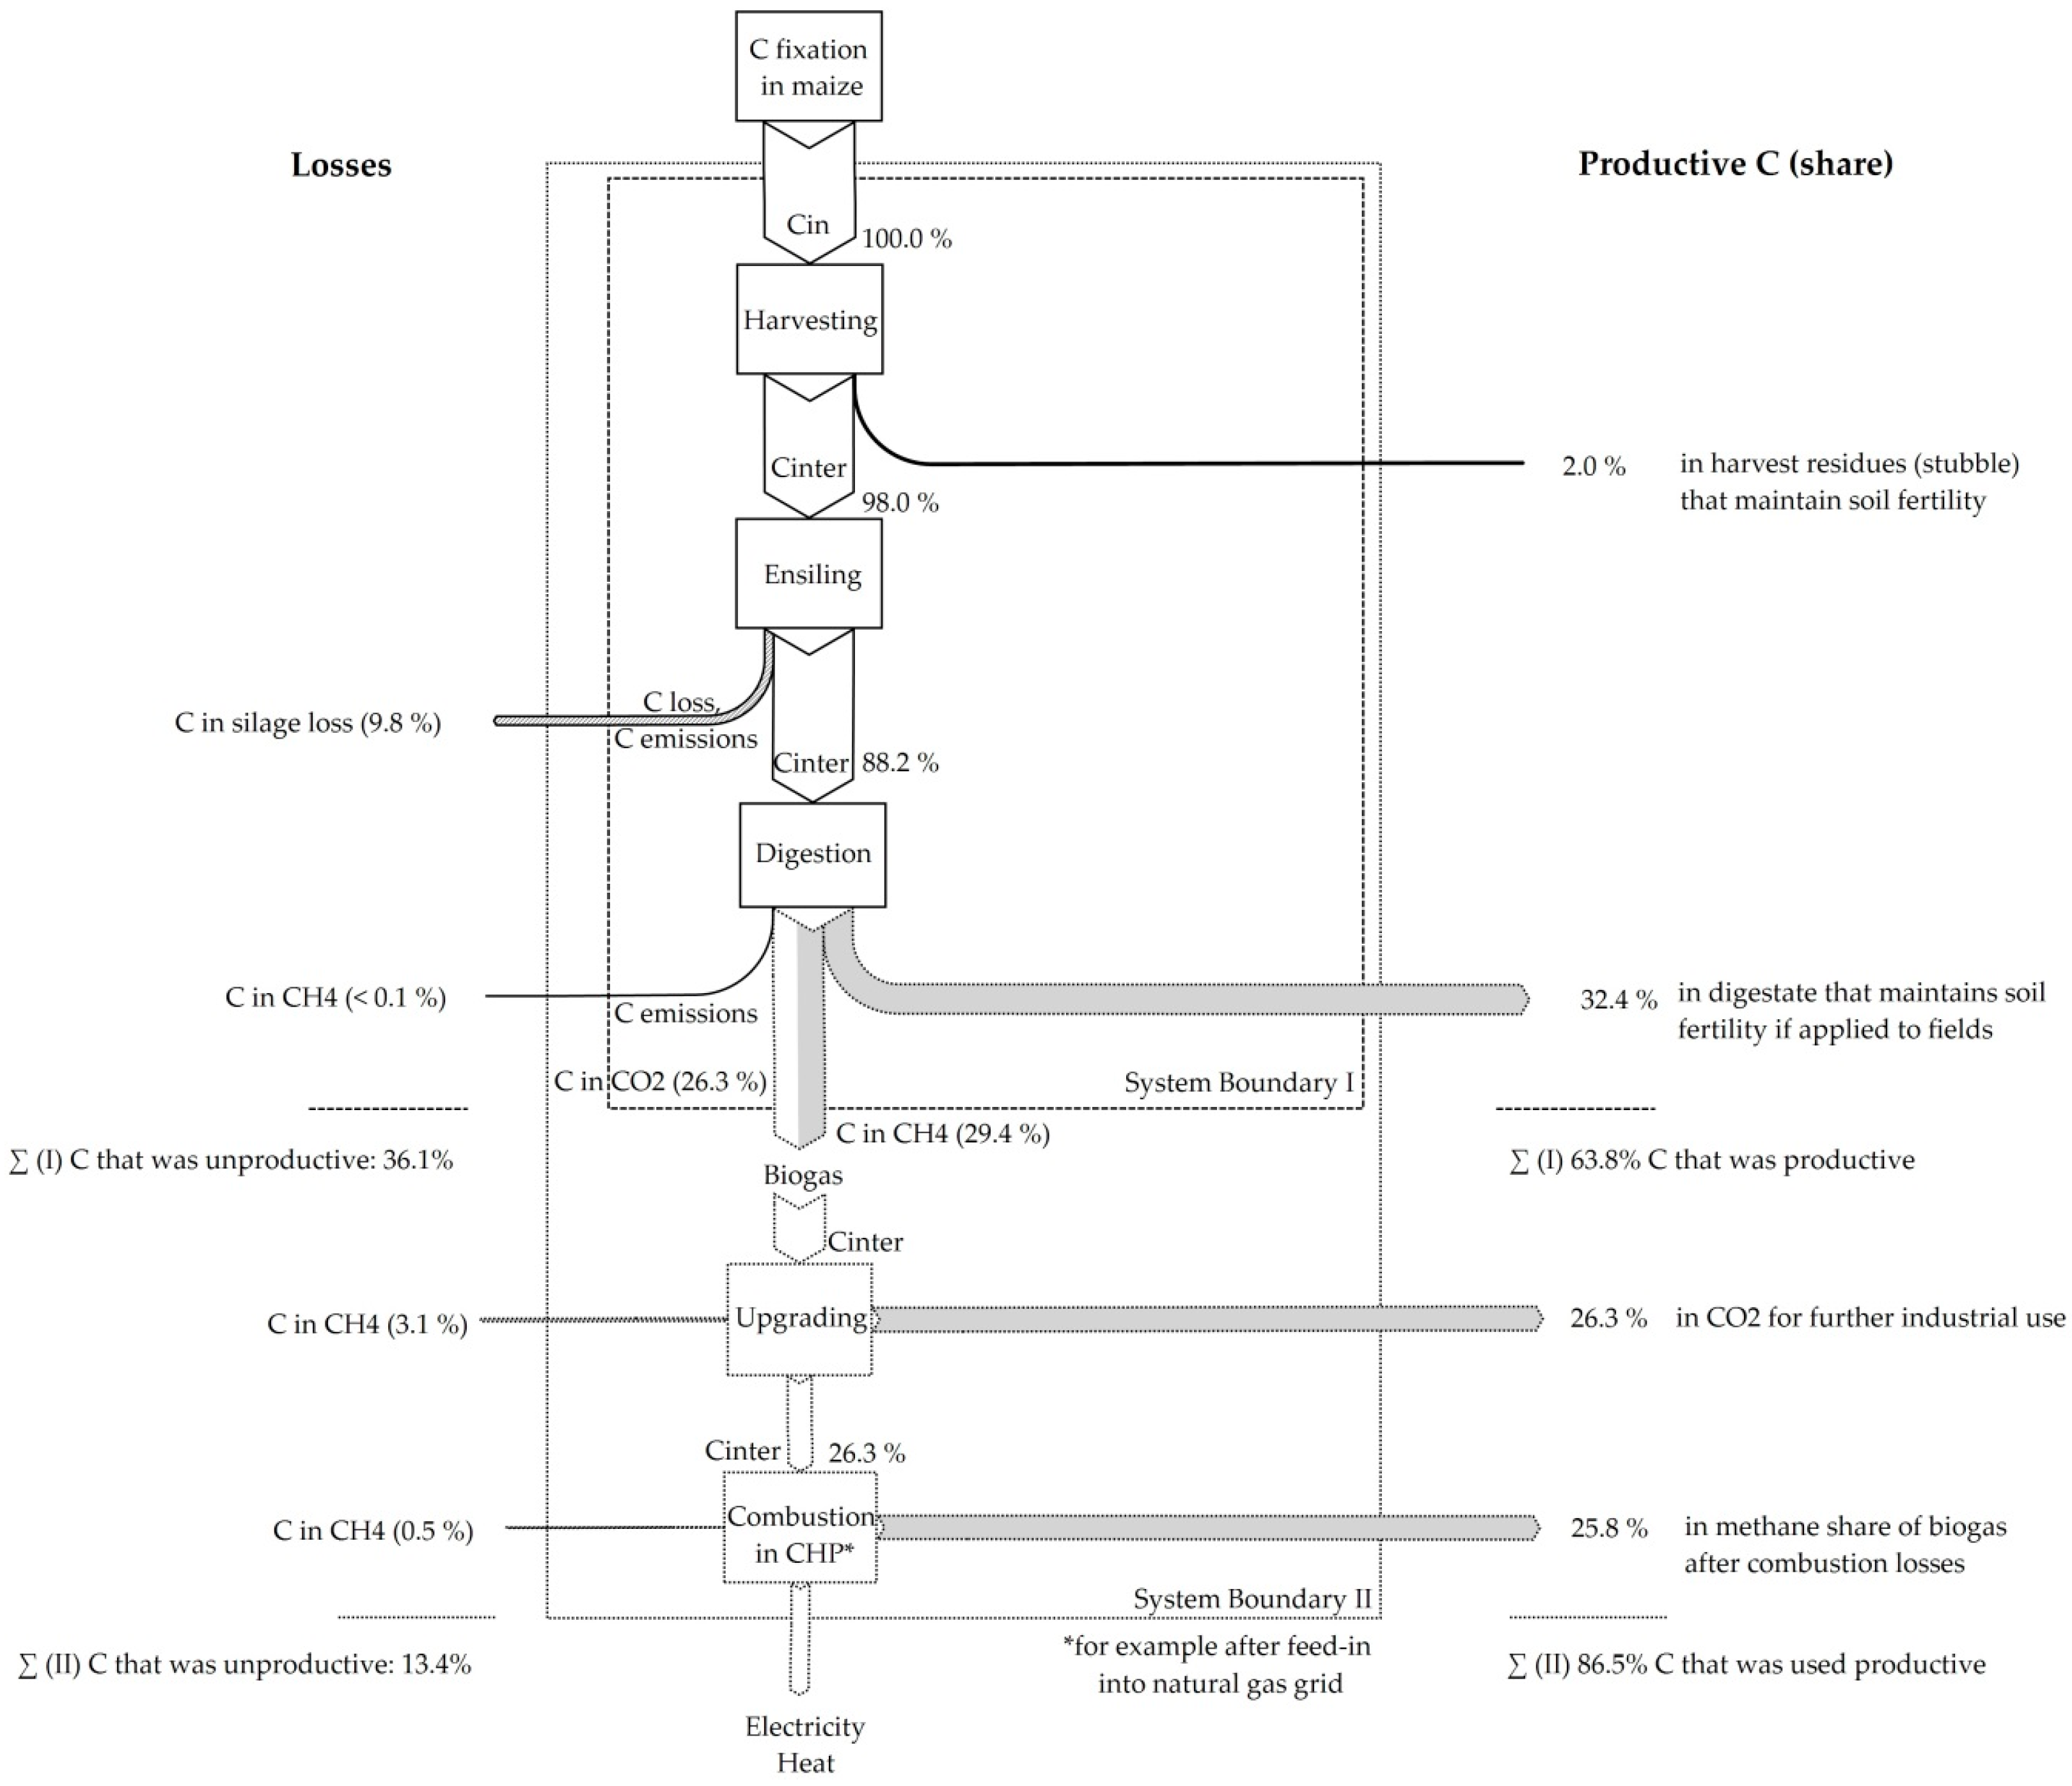
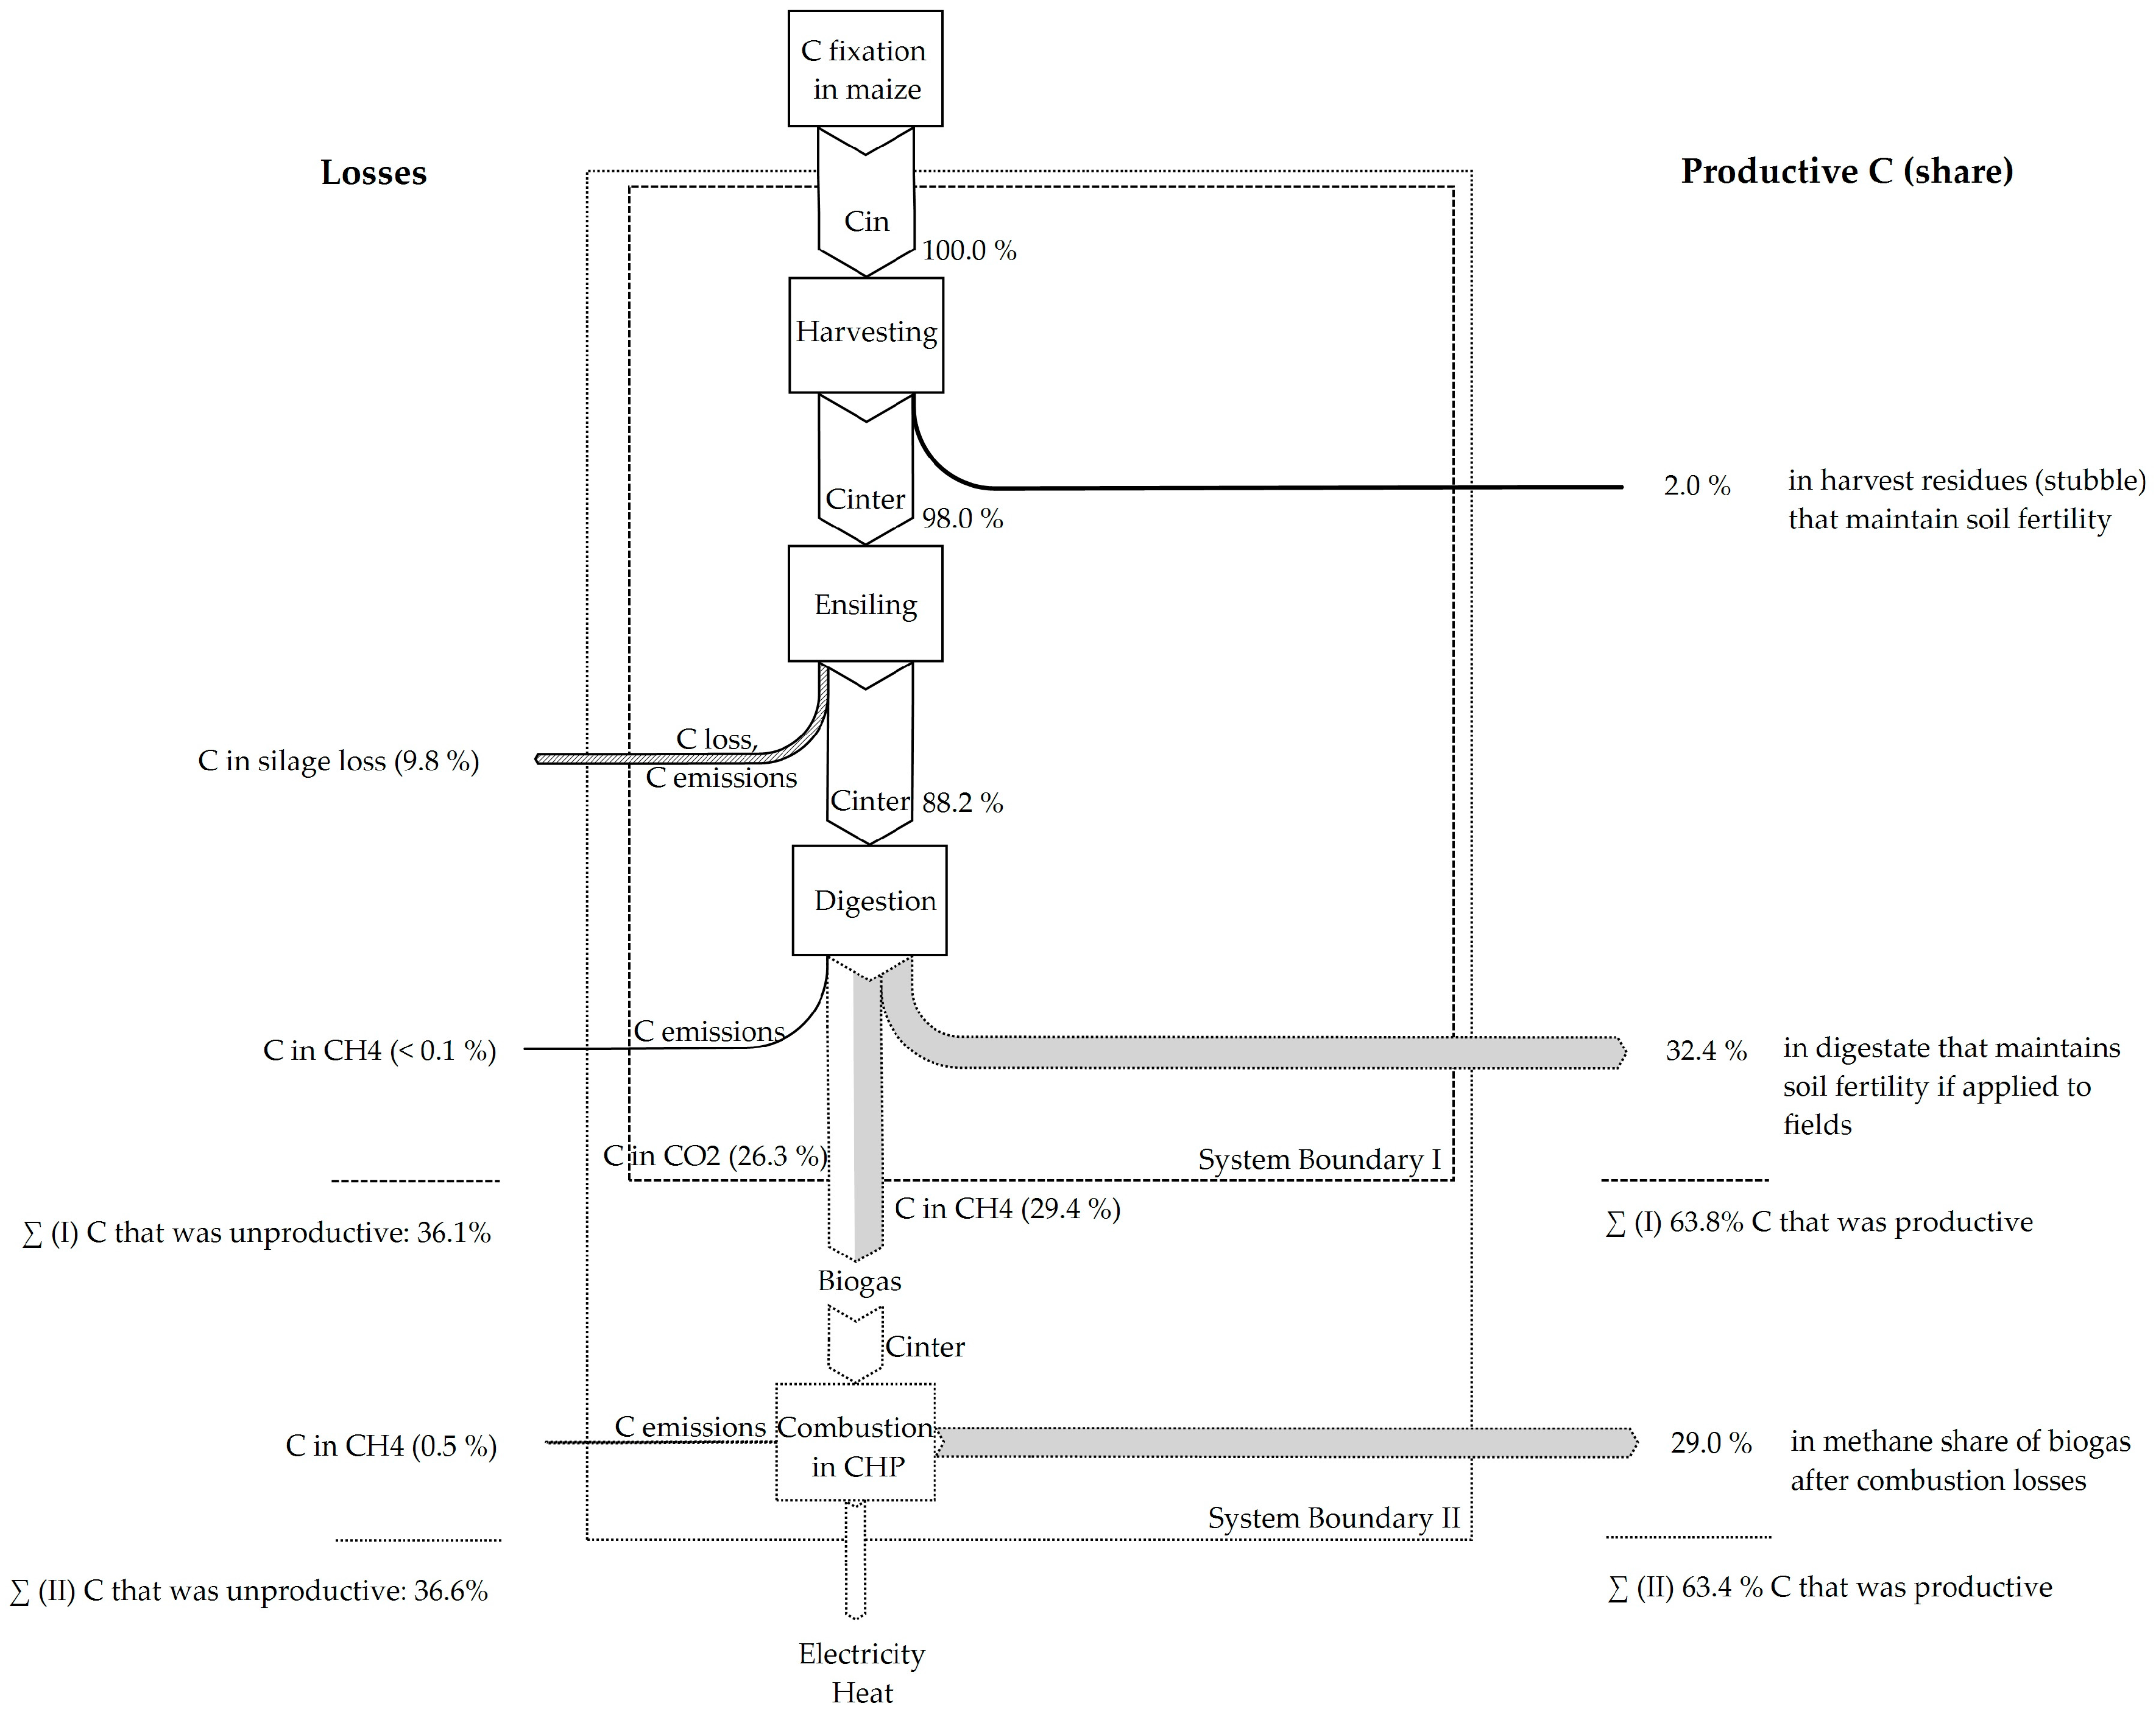
3.1. Carbon Utilization Degree of a Biomass Transformation to Bioenergy—Anaerobically Digested Maize

Electricity generation from digested maize silage is a bioenergy pathway that is frequently associated with GHG mitigation potentials (e.g., 15%–44% of emissions compared to fossil electricity) [30]. However, it is necessary to be aware that some carbon is not productive along the biomass transformation chain (Figure 1).
Maize plants fix atmospheric carbon in their biomass. Biomass in the roots, leaves, and the lower part of the stem (stubble) remains in the field after the ‘harvest’ step, and its C content is returned to the soil pool, maintaining soil productivity. Ratios of 1%–3% of C in stubble vs. C in directly harvestable biomass have been reported from a long-term field experiment of different fertilizer treatments in maize [31]. Although C in stubble is eventually returned to the atmosphere via soil biota activity on varying time scales, we consider it productive because it contributes to sustainable agricultural management. Accordingly, it is included in the CUDe calculation. A total of 98% of the harvested biomass is then transferred to the next step.
During the next step, ‘ensiling’, C can be lost in silage effluent as well as from microbial activity in the silage. Such losses have been reported with ranges from 1% to 3% [32] as well as from 15% to 25% [33]. We applied a value of 10% loss. The maize silage is then transferred as an intermediate product to the ‘digestion’ process, where some gaseous leakage may occur (C lost as methane; 0.01% v/v [34]). The digestion step delivers digestate as a co-product, which can be re-applied to agricultural fields as a fertilizer, returning to the soil C pool and maintaining soil productivity [35], and can thus be considered productive. Adding up the productive C for these steps of the biogas generation technology results in a CUDe of 63.8% (CUDe = 2% + 32.4% + 29.4%; Boundary I in Figure 1) if we assume that only the CH4 share of the biogas is of interest and optionally productive. If the boundary is expanded by including ‘energy generation’, the biogas is considered as an intermediate product. In a combined heat and power plant (CHP), the CH4 share of the biogas (approximately 53% v/v [36]) is burned to generate electricity and heat and therefore becomes productive. However, depending on the CHP engine type, 1.5%–3% of the methane may be emitted to the atmosphere [37]. The CO2 share of the biogas (47% v/v; [36]) is not considered productive. Accordingly, the total CUDe of the electricity and heat generation from maize silage results in a CUDe of 63.4% (CUDe = 2% + 32.4% + 29.0%; Boundary II in Figure 2). More than one-third of the harvestable C did not become productive.
Approximately 25% of harvestable Cin is used by the microorganisms in the digester to metabolize the biomass to biogas, which, as a consequence, consists of a mixture of combustible methane and CO2. If this CO2 is separated from the biogas in an additional step to produce bio-methane (upgrading), the CUDe does not automatically increase. It could even decrease because of additional losses from 0.1%–8% during the upgrading, depending on the treatment process [38]. However, it could increase if the cleaned CO2 share is used as a resource in further technological processes [8,39,40]. As the following example shows, upgrading biogas to bio-methane and utilization of the separated CO2 could increase the overall CUDe up to 86.5% (Figure 2). We assumed a feed-in into the natural gas grid and final use in a CHP plant.

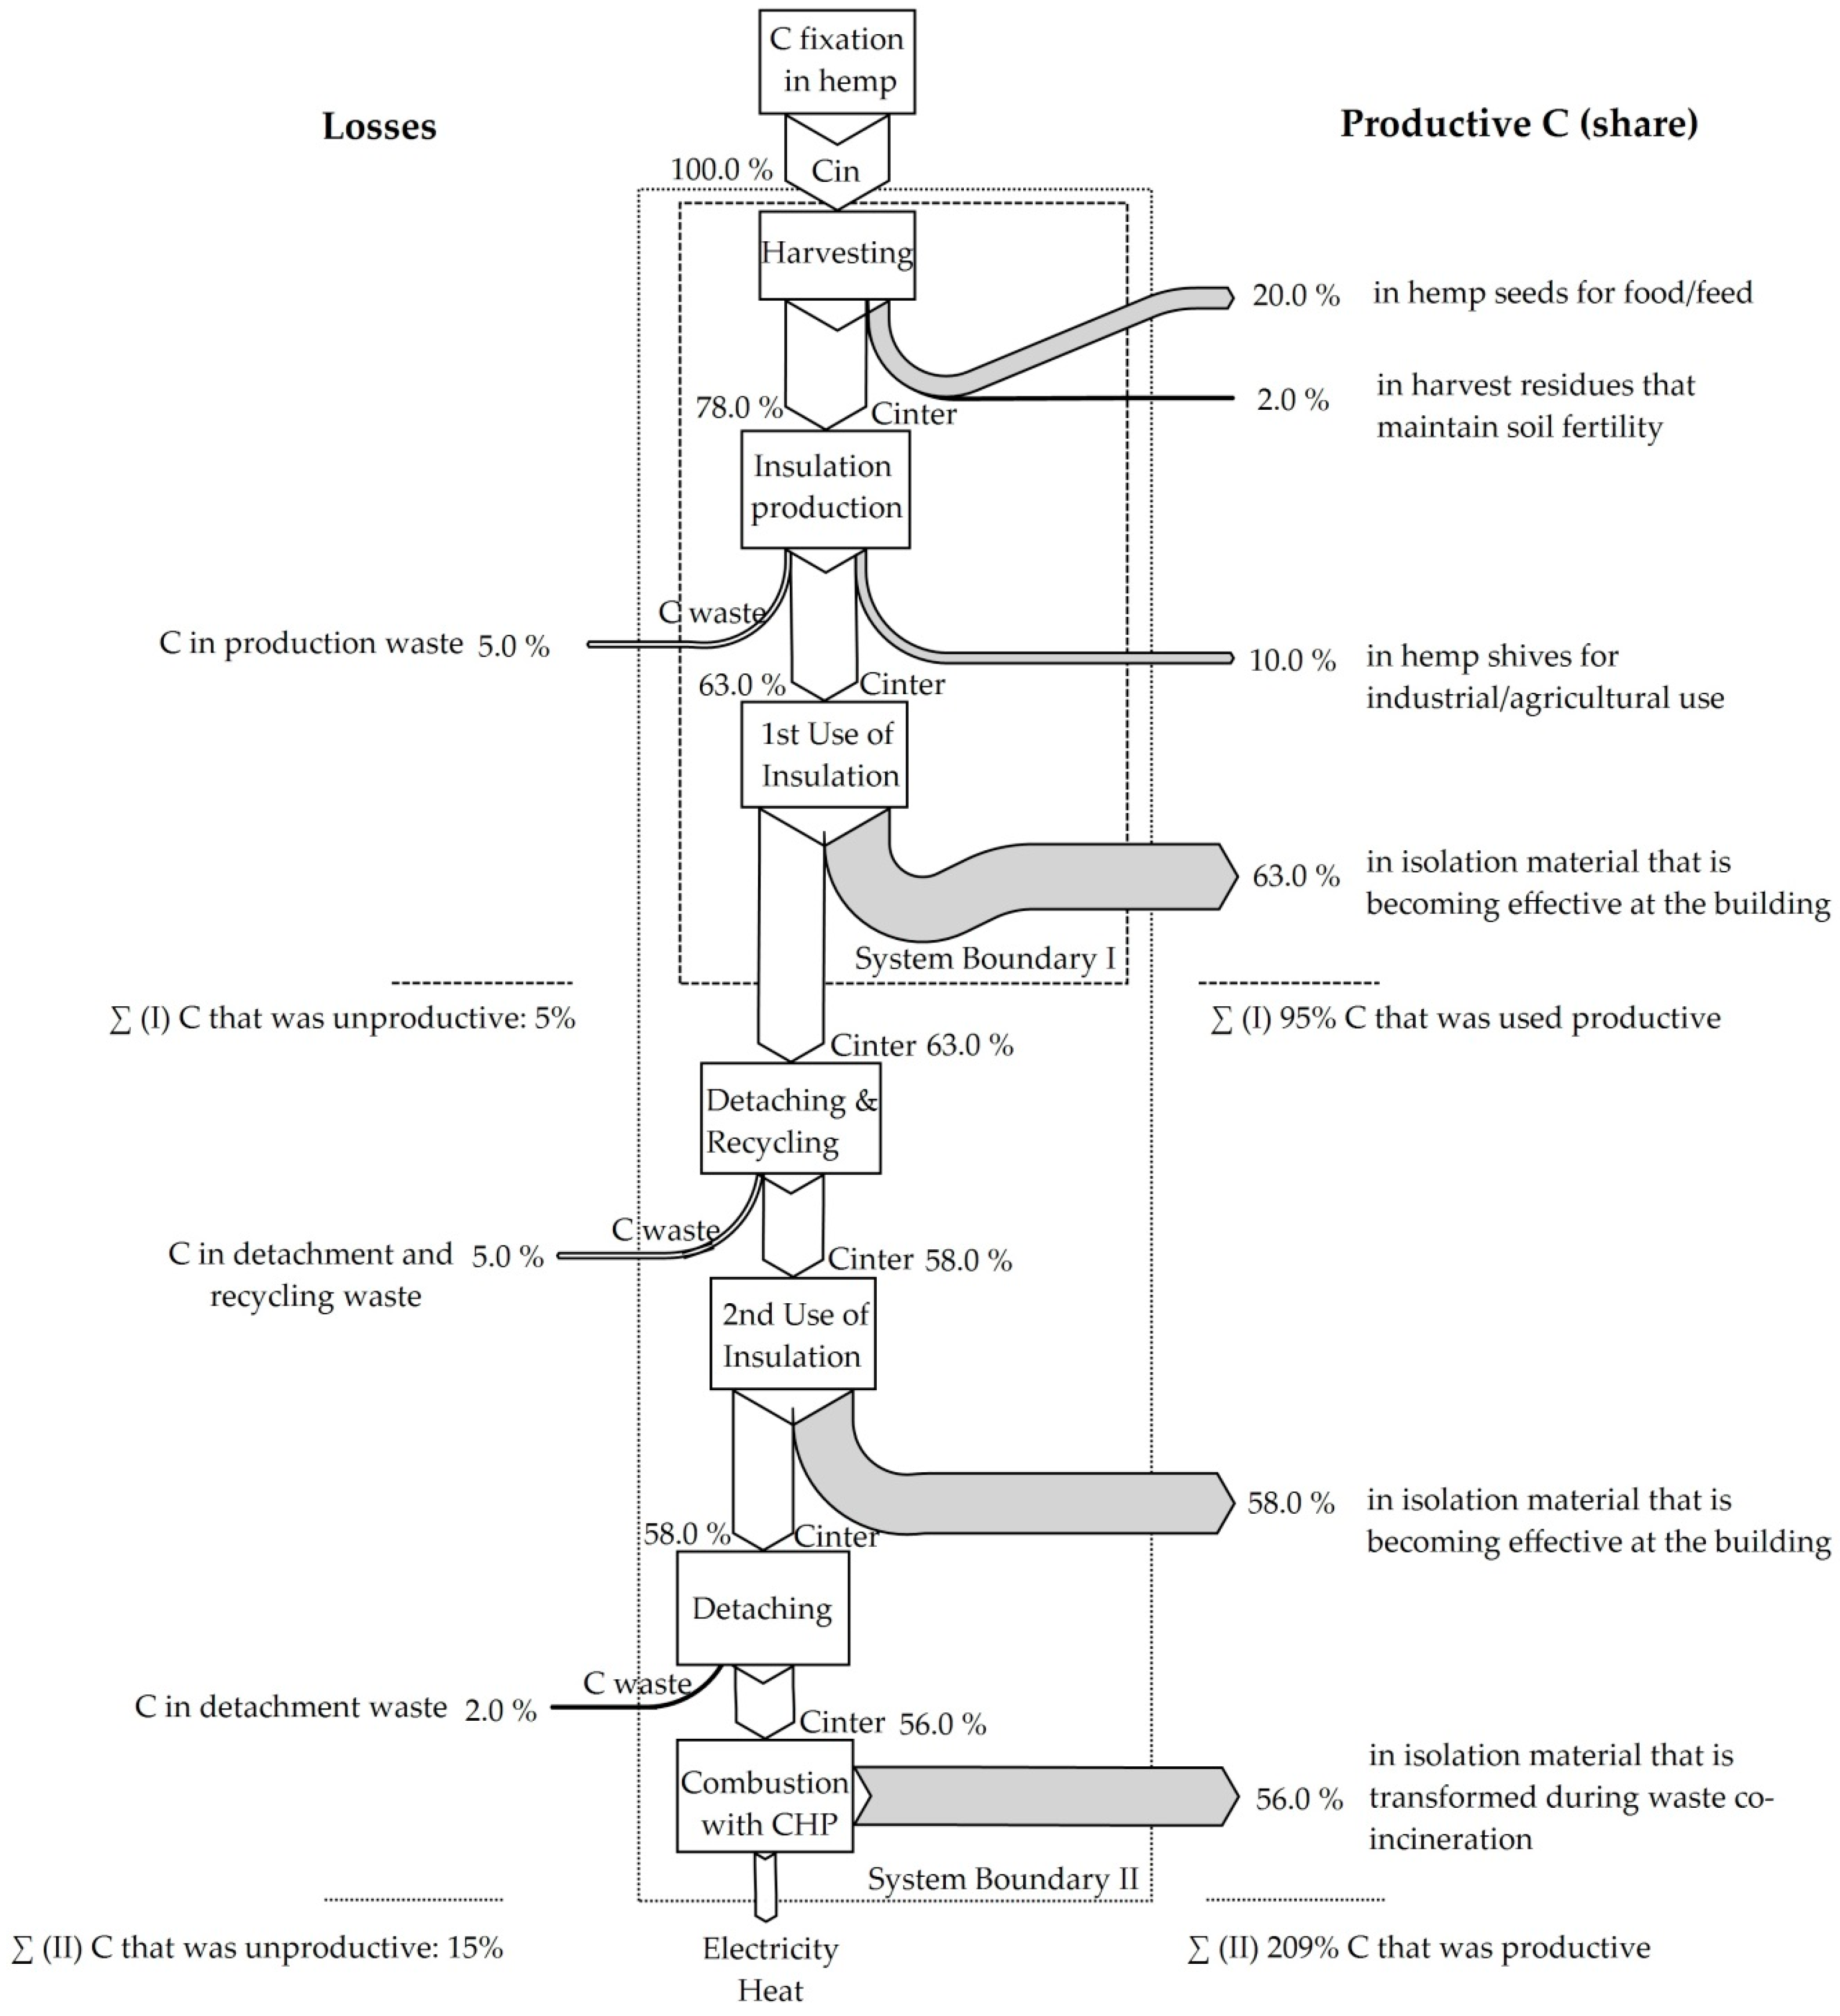
3.2. Carbon Utilization Degree of a Biomass Material Usage—Hemp Fibers as Insulation Material

The overall Carbon Utilization Degree may increase for some technology chains with a cascading type of biomass use (Figure 3): Hemp is used as a material for building insulation (Boundary I; CUDe = 20% + 2% + 10% + 63% = 95%), and after detaching, it is once again used as an insulation material.
Finally, the material is detached and incinerated with energy recovery (Boundary II). In this scenario, CUDe might reach 209% (CUDe = 20% + 2% + 10% + 63% + 58% + 56%) for the transformation chain. Such a CUDe value greater than 100% represents cascading C use which is explained at the end of Section 2.

4. Discussion of the Approach

4.1. Impact-Oriented Approaches vs. Resource-Use-Oriented Approaches for Policy Decision Support

Numerous assessment approaches have been published within the last twenty-five years that address carbon and that inherently use a productivity concept. Some of their specifications are listed in Table A1 and are compared to our Carbon Utilization Degree approach. Mainly, they address the sustainability goal of ‘avoiding climate change’ and thus are, by definition, impact-oriented assessments: Emissions of CO2 and other GHGs are to be reduced because of their negative effects if they are released into the atmosphere. However, their names and/or methodological approaches suggest that they are productivity-oriented.
To achieve the sustainability goal of ‘avoiding climate change’, policy makers can choose between different regulatory methods: emission pricing (carbon taxes or ‘cap and trade’) or technology mandates and performance standards [41]. Some policy instruments are currently in place for carbon pricing, for example, the European Union Emission Trading System (EU ETS) [42]. So far, mainly energy-intensive sectors, such as power generation and manufacturing industries, participate in the scheme. During the transition to a bio-economy, bioenergy may be included in the carbon trading market, calling for a reliable assessment of its CO2 emissions. A pricing approach transforms C as CO2 into a limited resource. For both pricing and standards, we need profound knowledge of the biogenic carbon emissions associated with the biomass conversion processes. It would not be appropriate to assume carbon neutrality of biomass (setting its emission factor to zero) or to calculate CO2 emissions from the biomass C content. This has been discussed comprehensively in the scientific literature on biofuels [15,43,44]. Additionally, emissions from biomass conversion can vary depending on the type of biomass used, the process conditions and the conversion technology or emission reduction measures implemented [45]. Admittedly, this is also true for fossil-based energy carriers.
If we consider the difficulties to reliably assess biogenic process emissions and that additional criteria need to be taken into account to ensure that the transition to bio-economies is performed in a sustainable way (i.e., not only addressing climate impact), then we should focus on the other policy options, technology mandates and performance standards. This is even truer because recent projections suggest that European targets—set at 40% emission reductions compared to 1990 [46]—will probably not be met by the current policies (e.g., by the EU ETS, which is a pricing instrument [47]). If, in society in general, a transition could be initialized to improve efficient C use, i.e., a paradigm shift to ‘C is a resource’ from ‘C is a threat’, then more actors could enter the field to achieve the goal [48]. Such a paradigm shift by implementing efficiency standards for (biomass) conversion technologies could be a promising way to develop a sustainable transition pathway. Additionally, the strategy could go hand-in-hand with other public goals to increase efficient resource use [49] and energy efficiency [50].
Reliable criteria and appropriate indicators are necessary for such standards. To fill this gap, we proposed the CUDe approach. Optimization options could be identified at the process level, which subsequently could have an impact on the design of entire transformation chains. For bioenergy, the CUDe could offer a regulatory instrument, for instance, if a CUDe level exceeds a specific threshold, then incentives are paid, or fees fall due if a level is not reached.
Even if CUDe as an indicator might not influence policy making directly, it could have the potential to open debates and perspectives, which recently was identified as one important characteristic of indicators [51]. On the other hand, Runhaar [52] recently stated that the performance of integration tools is modest (“tools that aim to steer particular actors in such a way that they are stimulated (or forced) to incorporate environmental objectives in their policies or practices”) and expectations should be realistic. Nevertheless, we think that CUDe could complement the existing assessment approaches’ toolbox as an additional indicator in a way that a ‘dashboard’ is provided, where different indicators are presented (as suggested by Jakob and Edenhofer [53]). Furthermore, a combination of integrated assessment models with those of other disciplines was recently identified as necessary to support policy formation and action toward low-carbon transitions [54]. As with the concept of ‘umbrella’ species that was proposed in conservation biology in the 1980s [55], CUDe could help to address more than one sustainability goal—avoiding climate change—because it inherently considers the enhancement or at least maintenance of soil productivity.

4.2. Boundaries, Time Frames, and Carbon Sequestration

An important aspect of the CUDe approach is the definition that the C baseline is set at the carbon content of the theoretically harvestable biomass in the field. This addresses the aspect that input levels in agriculture are site-dependent (climate, soils, etc.). It is not our focus to advise where (and how) to produce biomass(-C) but to advise how we should use it. Methodologies are already available that are more suitable to choose biomass production ways, for example Life Cycle Assessment (LCA, [56,57]).
The CUDe system boundary includes all possible co-products in the analysis that a crop might yield. It also accounts for the fact that in the future, new technology options or market situations might be available to make the C in the harvest residues economically useful. Furthermore, this boundary enables, to some extent, the inclusion of ecological effects in the assessment, for example, the impacts on the humus balance and soil productivity. A prominent example is the use of straw, which could either be left in the field to, among other effects, replenish soil organic carbon pools or be used in stables for bedding or as an energy carrier for combustion [58]. In either use, the C content of the straw would be considered productive.
Another example of the ecological effects is the ecosystem service ‘provision of important habitats’. In forestry, stubble use has been propagated in GHG mitigation studies [59]. This could trigger a loss of important habitats. Our baseline choice might reduce this pressure because the C in stubble is already considered productive and CUDe would not increase further.
The end-point of a CUDe analysis is not fixed, and it can be extended depending on the cycles of biomass use if the technology under study starts to use the carbon from biomass in a cascading way (as in Section 3.2). CUDe values greater than 100% indicate cascading usage. The same effect has been reported from a cascade factor in the wood industry [60]. One could argue that additional energy—which is mostly C-based today—is necessary for C recycling. As already highlighted, biomass transformation systems should be assessed with a variety of metrics including energy-related ones, such as cumulated energy demand [61]. Hence, the concept could in the future be expanded by a combined presentation with such an energy-related metric, for example in a 2-dimensional metric to illustrate different biomass technology pathways and visualize target corridors.
Another relevant boundary is the time frame. Fixed time frames are defined in other approaches, for example, in the Carbon Stability Factor (CSF) for biochar [62] (100 years, Table A1). For GHG assessments, different time horizons are used depending on the scope of the study and the longevity of the involved greenhouse gases. The published global warming potentials (GWP) with horizons of 20, 100 or 500 years reflect this [63]. These GWP characterization factors have been changing over time due to progress in the scientific understanding of atmospheric processes. The CUDe approach does not have a fixed time horizon by definition and, accordingly, does not rely on such external factors and is robust against changes in external metrics. Calculations of CUDe can be performed for different time horizons, but they must be properly communicated.
Biomass carbon can be stored in different pools with different time frames. In the context of climate change mitigation, the sequestration effect is an important aspect. However, the CUDe approach does not explicitly focus on this topic. This can be observed by how the C in soils is addressed. CUDe considers the C, which is returned to the soil, as productive (e.g., it could improve soil fertility), even though it is eventually re-emitted to the atmosphere by soil biota activity. This represents the perception that CUDe is an approach for efficient C use in general, not just with a focus on climate change mitigation. In the latter case, it would be necessary to account for additional benefits for C that is stored long-term.
Multi-product systems, such as most biomass conversion systems, can be assessed by numerous approaches. The methodologies account for possible product and co-product diversity. For instance, LCA, as an impact-oriented assessment, uses, among others, ‘system enlargement’. However, system enlargement can lead to increasing uncertainty in the analysis’ outcome due to the diversity of possible biomass uses and potential reference products. CUDe considers all biomass co-products in its calculation directly; hence, it avoids the difficulty of defining reference products and reduces the time for the analyses because no additional data need to be gathered.
The CUDe approach could help to compare biomass transformation systems where biomass is used for energetic and/or material purposes. Although different biomasses have similar C contents per dry matter (Table 1), they can lead to differing CUDe values as one biomass can be more suitable for a certain purpose than another. Thus, the approach considers different biomasses as well as the design of biomass conversion chains as a whole.

5. Conclusions and Outlook

Existing approaches to assessing C, which are used to analyze biomass conversion chains, have some critical issues to address. These include external effects, such as changes in the underlying assumptions. Robust indicators for decision support for biomass use are needed. We proposed Carbon Utilization Degree CUDe as an indicator that represents the efficient use of carbon as a production factor in biomass conversion processes for energetic and material use. This indicator could reflect a paradigm shift that CO2 is not a threat but a finite resource that requires suitable management. CUDe, as a supplementary indicator for existing methods, could aid in the design of policies for biomass transformation pathways by defining threshold values for efficient carbon use in conversion processes. The approach needs additional testing to prove its applicability even to more complex pathways than those provided in this manuscript.

Acknowledgments

English grammar and expressions were improved by AJE. Three anonymous reviewers provided helpful comments.

Author Contributions

Anja Hansen and Jörn Budde developed the idea and the methodological concept; Anja Hansen prepared the case studies, figures and wrote most of the paper. Jörn Budde, Yusuf Nadi Karatay and Annette Prochnow contributed to the discussion of the concept and to the organization and phrasing of the manuscript.

Conflicts of Interest

The authors declare no conflicts of interest.

Abbreviations

The following abbreviations are used in this manuscript:
CCarbon
CFCharacterization factor
CH4Methane
CHPCombined Heat and Power
CemissionsCarbon in gaseous losses, e.g., in CO2 or CH4
CinCarbon content in biomass dry matter that enters the biomass conversion chain
CinterCarbon in intermediate products
CO2Carbon dioxide
CproductiveCarbon that becomes productive in a wide anthropocentric view
CproductsCarbon in final products and co-products
CSFCarbon Stability Factor
CUDeCarbon Utilization Degree [%]
CwasteCarbon in waste, e.g., in production waste
EU ETSEuropean Union Emissions Trading System
GDPGross Domestic Product
GHGGreenhouse Gas(es)
GWPGlobal Warming Potential(s)
L.Carl von Linné (botanical author citation)
LCALife Cycle Assessment
MACCMarginal Abatement Cost Curves
NPPNet Primary Production
NEPNet Ecosystem Production

Appendix A

Table A1. Overview of some productivity approaches dealing with carbon. CUDeCarbon Utilization Degree, CSF—Carbon Stability Factor, GDP—Gross Domestic Product, GHG—Greenhouse Gases, MACC—Marginal Abatement Cost Curves, NPP/NEP—Net Primary Productivity/Net Ecosystem Productivity, S&P/IFCI—Standard & Poor’s International Finance Corporation Indexes.
NameNPP/NEPCarbon ProductivityCarbon IntensityC BalanceMACCS&P/IFCI Carbon Efficient IndexCSFCarbon EfficiencyCUDe
DenominatorUnit of area and unit of timeUnit of emitted CO2a per period per countryUnit of sales Unit of mitigated CO2e Unit of C in fresh biocharTotal C present in reactantsCarbon fixed in harvestable biomass
NumeratorUnit of generated energy (or biomass)Unit of the specific value of GDP in the same periodC emissions Unit of cost of a technology Unit of biochar C after 100 yearsAmount of C in product × 100Productive C
Unitg·C·m−2·year−1Currency kg−1 CO2 emittedkg C emitted/unit of sales $%Currency t−1 CO2e mitigated Dimensionless or %%%
BaselineUsually one yearArbitrary period length, often one year Marginal cost and projected emissions of reference technology 100 yearsNot statedAdjustable
DescriptionRate at which energy is converted into biomassUsed in economics;
reciprocal of carbon emission intensity per unit of GDP b;
“Reflects economic benefits yielding from per unit of CO2 emission” c
“A MAC curve is a graph that indicates the marginal cost (the cost of the last unit) of emission
abatement for varying amounts of emission reduction.” d
Remaining C in carbonized biomass (biochar) after labile and instable fractions are released Ratio of productive C to initial Cin in the biomass
Target audienceSciencePolicy Policy SciencePharmaceutical industryPolicy
Methodology1. Measure biomass production (for example: destructive measurements/NPP; flux measurements/NEP; models)
2. Convert biomass dry matter according to C contents
1. Define period
2. Look up GDP and fossil resource use for that period
3. Calculate CO2 emissions from resource use via emission factors
1. Define baselines (emissions in target year; technology)
2. Identify and describe possible abatement technologies and their costs for the target year
3. Plot abatement potentials on x-axis and costs per ton on y-axis
1. Measure C content in fresh biochar
2. Identify labile (after a few weeks) and instable (e.g., via accelerated ageing methods) C shares in original biochar
Please refer to Scheme 1
BenefitsIn combination with modelling approaches, shortcomings (see below) can be overcome.Comparison of different nations possible
Different development stages visible
Comparison of different nations possible
Illustrative tool to present mitigation options
Intuitive to understand
Reflects C sequestration
Percentages in different products in multi-product systems can be summed up.
Simplified formula takes into account the stoichiometry of reactants and products of interest to the pharmaceutical industry where the development of carbon skeletons is key to their work.Paradigm change to carbon being an asset of the bio-economy instead of a threat
Reflects the C use efficiency of the conversion process
ShortcomingsRepresentativeness for analyzed biomes and attributed area critical
Accounting for land use change
Only fossil CO2 (no other GHG included, for example, nitrous oxide, CH4)
Inherent connection to economic cycle and growth paradigm
Static representation of costs for single years; no allocation of costs to ancillary benefits of GHG mitigation; lack of transparency; poor treatment of uncertainty, inter-temporal dynamics, interactions between sectors (see details in d) No additional necessary C for conversion processes considered
CSF uncertain due to the wide range of assumed residence times of C remaining in the biochar after application to soils (293–9259 years e)
No complete GHG assessment (only CO2 and CH4 included)
CUDe is not directly related to output quantity
No energy-related C input considered
References[64][6] c, [23] b, [65] a. a uses CO2 equivalents as a basis.Only sparse information given in [66][67][68], [69] d[70][62] e, [71,72]Acc. to [73] developed at GlaxoSmithKline (GSK); no original source availableThis manuscript
Unless otherwise indicated by superscripts, information was taken from cited References in the last row.

References

  1. Brock, T.D.; Madigan, M.T.; Martinko, J.M.; Parker, J. Biology of Microorganisms: (1994): Biology of Microorganisms, 7th ed.; Prentice Hall International: Englewood Cliffs, NJ, USA; London, UK, 1994; p. 909. [Google Scholar]
  2. KTBL. Energiepflanzen—Daten für die Planung des Energiepflanzenanbaus; KTBL Kuratorium für Technik und Bauwesen in der Landwirtschaft: Darmstadt, Germany, 2006. [Google Scholar]
  3. Reisinger, K.; Haslinger, C.; Herger, M.; Hofbauer, H. BIOBIB—A Database for Biofuels. Available online: http://cdmaster2.vt.tuwien.ac.at/biobib/sd112.html (accessed on 11 September 2014).
  4. Romanova, N.D.; Sazhin, A.F. Relationships between the cell volume and the carbon content of bacteria. Oceanology 2010, 50, 522–530. [Google Scholar] [CrossRef]
  5. Bi, Z.; He, B.B. Characterization of Microalgae for the Purpose of Biofuel Production. Trans. ASABE 2013. [Google Scholar] [CrossRef]
  6. Jiankun, H.; Mingshan, S. Carbon Productivity Analysis to Address Global Climate Change. Chin. J. Popul. Resour. Environ. 2011, 9, 9–15. [Google Scholar] [CrossRef]
  7. Nova-Institut für Politische und Ökologische Innovation GmbH. 5th Conference on Carbon Dioxide as Feedstock for Fuels, Chemistry and Polymers. Available online: http://co2-chemistry.eu/ (accessed on 12 October 2016).
  8. Liu, Q.; Wu, L.; Jackstell, R.; Beller, M. Using carbon dioxide as a building block in organic synthesis. Nat. Commun. 2015, 6, 5933. [Google Scholar] [CrossRef] [PubMed]
  9. Kortlever, R.; Shen, J.; Schouten, K.J.P.; Calle-Vallejo, F.; Koper, M.T.M. Catalysts and Reaction Pathways for the Electrochemical Reduction of Carbon Dioxide. J. Phys. Chem. Lett. 2015, 6, 4073–4082. [Google Scholar] [CrossRef] [PubMed]
  10. Park, S.-E. Editorial. J. CO2 Util. 2013, 1, 3. [Google Scholar] [CrossRef] [PubMed]
  11. Science Direct. Online Search, Search Term in Journals: “Low Carbon”. 2016. Available online: http://www.sciencedirect.com/ (accessed on 31 May 2016).
  12. Bosch, R.; van de Pol, M.; Philp, J. Policy: Define biomass sustainability. Nature 2015, 523, 526–527. [Google Scholar] [CrossRef] [PubMed]
  13. Koskela, S.; Mattila, T.; Antikainen, R.; Mäenpää, I. Identifying Key Sectors and Measures for a Transition towards a Low Resource Economy. Resources 2013, 2, 151–166. [Google Scholar] [CrossRef]
  14. Cherubini, F.; Strømman, A.H. Life cycle assessment of bioenergy systems: State of the art and future challenges. Bioresour. Technol. 2011, 102, 437–451. [Google Scholar] [CrossRef] [PubMed]
  15. Searchinger, T.D.; Hamburg, S.P.; Melillo, J.; Chameides, W.; Havlik, P.; Kammen, D.M.; Likens, G.E.; Lubowski, R.N.; Obersteiner, M.; Oppenheimer, M.; et al. Climate change. Fixing a critical climate accounting error. Science 2009, 326, 527–528. [Google Scholar] [CrossRef] [PubMed]
  16. Taheripour, F.; Hertel, T.W.; Tyner, W.E.; Beckman, J.F.; Birur, D.K. Biofuels and their by-products: Global economic and environmental implications. Biomass Bioenergy 2010, 34, 278–289. [Google Scholar] [CrossRef]
  17. Rabl, A.; Benoist, A.; Dron, D.; Peuportier, B.; Spadaro, J.V.; Zoughaib, A. How to account for CO2 emissions from biomass in an LCA. Int. J. Life Cycle Assess. 2007, 12, 281. [Google Scholar] [CrossRef]
  18. Greenhouse Gas Protocol. Global Warming Potential Values, Adapted from IPCC Fifth Assessment Report (AR5). 2014. Available online: http://ghgprotocol.org/sites/default/files/ghgp/Global-Warming-Potential-Values%20(Feb%2016%202016).pdf (accessed on 8 June 2016).
  19. Ott, K.; Thapa, P.P. Greifswald’s Environmental Ethics, from the Work of the Michael Otto Professorship at Ernst Moritz Arndt University 1997–2002; Steinbecker: Greifswald, Germany, 2003; Available online: https://doi.org/10.13140/2.1.2435.3604 (accessed on 31 May 2016).
  20. Hill, B. An Introduction to Economics: Concepts for Students of Agriculture and the Rural Sector, 4th ed.; CABI: Oxfordshire, UK, 2014. [Google Scholar]
  21. Jackson, T. Least-cost greenhouse planning supply curves for global warming abatement. Energy Policy 1991, 19, 35–46. [Google Scholar] [CrossRef]
  22. Yang, H. Carbon Efficiency, Carbon Reduction Potential, and Economic Development in the People’s Republic of China, a Total Factor Production Model. 2010. Available online: http://www.adb.org/sites/default/files/publication/27499/carbon-efficiency-prc.pdf (accessed on 13 January 2016).
  23. Kaya, Y.; Yokobori, K. Environment, Energy and Economy: Strategies for Sustainability; Bookwell Publications: Delhi, India, 1999. [Google Scholar]
  24. Wang, P.-C.; Lee, Y.-M.; Chen, C.-Y. Estimation of Resource Productivity and Efficiency: An Extended Evaluation of Sustainability Related to Material Flow. Sustainability 2014, 6, 6070–6087. [Google Scholar] [CrossRef]
  25. Ellen MacArthur Foundation; Granta Material Intelligence. Circularity Indicators, an Approach to Measuring Circularity. Methodology. 2015. Available online: https://www.ellenmacarthurfoundation.org/assets/downloads/insight/Circularity-Indicators_Methodology_May2015.pdf (accessed on 21 June 2016).
  26. Kallis, G.; Kalush, M.; O’Flynn, H.; Rossiter, J.; Ashford, N. “Friday off”: Reducing Working Hours in Europe. Sustainability 2013, 5, 1545–1567. [Google Scholar] [CrossRef]
  27. Ecoinvent Centre. Ecoinvent Data. Available online: www.ecoinvent.org (accessed on 11 September 2014).
  28. De Lucia, M.; Assennato, D. Agricultural Engineering in Development: Post-Harvest Operations and Management of Foodgrains; Food and Agriculture Organizations of the United Nations: Rome, Italy, 1994. [Google Scholar]
  29. Carus, M.; Raschka, A.; Fehrenbach, H.; Rettenmaier, N.; Dammer, L.; Köppen, S.; Thöne, M.; Dobroschke, S.; Diekmann, L.; Hermann, A.; et al. Environmental Innovation Policy—Greater Resource Efficiency and Climate Protection through the Sustainable Material Use of Biomass, Short Version. 2014. Available online: https://www.umweltbundesamt.de/sites/default/files/medien/378/publikationen/texte_03_2014_druckfassung_uba_stofflich_abschlussbericht_kurz_englisch.pdf (accessed on 11 July 2016).
  30. Meyer-Aurich, A.; Schattauer, A.; Hellebrand, H.J.; Klauss, H.; Plöchl, M.; Berg, W. Impact of uncertainties on greenhouse gas mitigation potential of biogas production from agricultural resources. Renew. Energy 2012, 37, 277–284. [Google Scholar] [CrossRef]
  31. Zhang, W.; Liu, K.; Wang, J.; Shao, X.; Xu, M.; Li, J.; Wang, X.; Murphy, D.V. Relative contribution of maize and external manure amendment to soil carbon sequestration in a long-term intensive maize cropping system. Sci. Rep. 2015, 5, 10791. [Google Scholar] [CrossRef] [PubMed]
  32. Herrmann, C.; Heiermann, M.; Idler, C. Effects of ensiling, silage additives and storage period on methane formation of biogas crops. Bioresour. Technol. 2011, 102, 5153–5161. [Google Scholar] [CrossRef] [PubMed]
  33. Murphy, J.; Braun, R.; Weiland, P.; Wellinger, A. Biogas from Crop Digestion. Available online: http://www.iea-biogas.net/files/daten-redaktion/download/publi-task37/Biogas%20from%20Crops_2011_Final.pdf (accessed on 13 June 2016).
  34. Liebetrau, J.; Reinelt, T.; Clemens, J.; Hafermann, C.; Friehe, J.; Weiland, P. Analysis of greenhouse gas emissions from 10 biogas plants within the agricultural sector. Water Sci. Technol. 2013, 67, 1370–1379. [Google Scholar] [CrossRef] [PubMed]
  35. Al Seadi, T.; Lukehurst, C.T. Quality Management of Digestate from Biogas Plants Used as Fertiliser. 2012. Available online: http://www.iea-biogas.net/files/daten-redaktion/download/publi-task37/digestate_quality_web_new.pdf (accessed on 9 June 2016).
  36. Persson, M.; Jonsson, O.; Wellinger, A. Biogas Upgrading to Vehicle Fuel Standards and Grid Injection. 2006. Available online: http://www.iea-biogas.net/files/daten-redaktion/download/publi-task37/upgrading_report_final.pdf (accessed on 9 June 2016).
  37. Aschmann, V.; Effenberger, M.; Gronauer, A. Kohlenwasserstoffverbindungen im Abgas biogasbetriebener Blockheizkraftwerke. Landtechnik 2010, 65, 338–341. [Google Scholar]
  38. Fachagentur Nachwachsende Rohstoffe e. V. (FNR). Biogasaufbereitung (Biogas Upgrading). 2013. Available online: http://biogas.fnr.de/biogas-gewinnung/anlagentechnik/biogasaufbereitung/ (accessed on 9 June 2016).
  39. Chery, D.; Lair, V.; Cassir, M. Overview on CO2 Valorization: Challenge of Molten Carbonates. Front. Energy Res. 2015, 3, 5546. [Google Scholar] [CrossRef]
  40. Götz, M.; Lefebvre, J.; Mörs, F.; McDaniel Koch, A.; Graf, F.; Bajohr, S.; Reimert, R.; Kolb, T. Renewable Power-to-Gas: A technological and economic review. Renew. Energy 2016, 85, 1371–1390. [Google Scholar] [CrossRef]
  41. Goulder, L.H.; Schein, A. Carbon taxes versus cap and trade: A critical review. Clim. Chang. Econ. 2013, 4, 1350010. [Google Scholar] [CrossRef]
  42. European Commission. The EU Emissions Trading System (EU ETS). 2016. Available online: http://ec.europa.eu/clima/policies/ets/index_en.htm (accessed on 2 February 2016).
  43. Searchinger, T.D. Biofuels and the need for additional carbon. Environ. Res. Lett. 2010, 5, 024007. [Google Scholar] [CrossRef]
  44. Smith, K.A.; Searchinger, T.D. Crop-based biofuels and associated environmental concerns. Glob. Chang. Biol. Bioenergy 2012, 4, 479–484. [Google Scholar] [CrossRef]
  45. Van Loo, S.; Koppejan, J. The Handbook of Biomass Combustion and Co-Firing, 2nd ed.; Earthscan: London, UK, 2008. [Google Scholar]
  46. European Commission. A Policy Framework for Climate and Energy in the Period from 2020 to 2030. 2014. Available online: http://eur-lex.europa.eu/legal-content/EN/TXT/PDF/?uri=CELEX:52014DC0015&from=EN (accessed on 9 June 2016).
  47. European Commission. Climate Action Progress Report 2015, Including the Report on the Functioning of the European Carbon Market and the Report on the Review of Directive 2009/31/EC on the Geological Storage of Carbon Dioxide. Available online: http://ec.europa.eu/clima/policies/strategies/progress/docs/progress_report_2015_en.pdf (accessed on 9 June 2016).
  48. Pansera, M.; Sarkar, S. Crafting Sustainable Development Solutions: Frugal Innovations of Grassroots Entrepreneurs. Sustainability 2016, 8, 51. [Google Scholar] [CrossRef]
  49. G7. Leaders’ Declaration G7 Summit, 7–8 June 2015. Available online: https://sustainabledevelopment.un.org/content/documents/7320LEADERS%20STATEMENT_FINAL_CLEAN.pdf (accessed on 11 July 2016).
  50. European Council. European Council Meeting (23 and 24 October 2014), Conclusions. 2014. Available online: http://www.consilium.europa.eu/uedocs/cms_data/docs/pressdata/en/ec/145397.pdf (accessed on 11 July 2016).
  51. Lehtonen, M.; Sébastien, L.; Bauler, T. The multiple roles of sustainability indicators in informational governance: Between intended use and unanticipated influence. Curr. Opin. Environ. Sustain. 2016, 18, 1–9. [Google Scholar] [CrossRef]
  52. Runhaar, H. Tools for integrating environmental objectives into policy and practice: What works where? Environ. Impact Assess. Rev. 2016, 59, 1–9. [Google Scholar] [CrossRef]
  53. Jakob, M.; Edenhofer, O. Green growth, degrowth, and the commons. Oxf. Rev. Econ. Policy 2015, 30, 447–468. [Google Scholar] [CrossRef]
  54. Geels, F.W.; Berkhout, F.; van Vuuren, D.P. Bridging analytical approaches for low-carbon transitions. Nat. Clim. Chang. 2016, 6, 576–583. [Google Scholar] [CrossRef]
  55. Robergé, J.-M.; Angelstam, P.E. Usefulness of the Umbrella Species Concept as a Conservation Tool. Conserv. Biol. 2004, 18, 76–85. [Google Scholar] [CrossRef]
  56. International Organization for Standardization. ISO 14040. Environmental Management—Life Cycle Assessment—Principles and Framework; Beuth Verlag: Berlin, Germany, 2006. [Google Scholar]
  57. International Organization for Standardization. ISO 14044. Environmental Management—Life Cycle Assessment—Requirements and Guidelines; Beuth Verlag: Berlin, Germany, 2006. [Google Scholar]
  58. Hansen, A.; Budde, J.; Prochnow, A. Resource Usage Strategies and Trade-Offs between Cropland Demand, Fossil Fuel Consumption, and Greenhouse Gas Emissions—Building Insulation as an Example. Sustainability 2016, 8, 613. [Google Scholar] [CrossRef]
  59. Melin, Y.; Petersson, H.; Egnell, G. Assessing carbon balance trade-offs between bioenergy and carbon sequestration of stumps at varying time scales and harvest intensities. For. Ecol. Manag. 2010, 260, 536–542. [Google Scholar] [CrossRef]
  60. Mantau, U. Wood flow analysis: Quantification of resource potentials, cascades and carbon effects. Biomass Bioenergy 2015, 79, 28–38. [Google Scholar] [CrossRef]
  61. Verein Deutscher Ingenieure (VDI). Cumulative Energy Demand (KEA)—Terms, Definitions, Methods of Calculation; Beuth Verlag: Berlin, Germany, 2012. [Google Scholar]
  62. Hammond, J.; Shackley, S.; Sohi, S.; Brownsort, P. Prospective life cycle carbon abatement for pyrolysis biochar systems in the UK. Energy Policy 2011, 39, 2646–2655. [Google Scholar] [CrossRef]
  63. Intergovernmental Panel on Climate Change (IPCC). Contribution of Working Group I to the Fourth Assessment Report of the Intergovernmental Panel on Climate Change: “The Physical Science Basis”; Solomon, S., Qin, D., Manning, M., Chen, Z., Marquis, M., Averyt, K.B., Tignor, M., Miller, H.L., Eds.; Cambridge University Press: Cambridge, UK; New York, NY, USA, 2007. [Google Scholar]
  64. Roy, J.; Saugier, B. Terrestrial Primary Productivity. In Terrestrial Global Productivity; Elsevier: Amsterdam, The Netherlands, 2001; pp. 1–6. [Google Scholar]
  65. McKinsey Global Institute. The Carbon Productivity Challenge: Curbing Climate Change and Sustaining Economic Growth; McKinsey & Company: New York, NY, USA, 2008. [Google Scholar]
  66. Cazalet, W.; Wong, K.Q. Green Beta: Carbon Efficiency Investing. 2015. Available online: https://www.bnymellon.com/_global-assets/pdf/our-thinking/business-insights/green-beta-carbon-efficiency-investing.pdf (accessed on 15 March 2016).
  67. AVA-CO2. Technology, Hydrothermal Carbonisation (HTC). 2016. Available online: http://www.ava-CO2.com/web/pages/en/technology/hydrothermal-carbonization.php (accessed on 15 March 2016).
  68. Enkvist, P.-A.; Nauclér, T.; Rosander, J.A. A cost curve for greenhouse gas reduction: A global study of the size and cost of measures to reduce greenhouse gas emissions yields important insights for businesses and policy makers. McKinsey Quat. 2007, 35–45. [Google Scholar]
  69. Kesicki, F.; Ekins, P. Marginal abatement cost curves: A call for caution. Clim. Policy 2012, 12, 219–236. [Google Scholar] [CrossRef]
  70. S&P Dow Jones Indices. S&P/IFCI Carbon Efficient Index, Methodology. 2016. Available online: http://www.ifc.org/wps/wcm/connect/4e600a8048855921820cd26a6515bb18/Factsheet_SP_IFCI_Carbon_Efficient_Index.pdf?MOD=AJPERES (accessed on 15 March 2016).
  71. Guest, G.; Bright, R.M.; Cherubini, F.; Strømman, A.H. Consistent quantification of climate impacts due to biogenic carbon storage across a range of bio-product systems. Environ. Impact Assess. Rev. 2013, 43, 21–30. [Google Scholar] [CrossRef]
  72. Shackley, S.; Carter, S.; Knowles, T.; Middelink, E.; Haefele, S.; Haszeldine, S. Sustainable gasification—Biochar systems? A case-study of rice-husk gasification in Cambodia, Part II: Field trial results, carbon abatement, economic assessment and conclusions. Energy Policy 2012, 41, 618–623. [Google Scholar] [CrossRef]
  73. Boodhoo, K.; Harvey, A. Process Intensification Technologies for Green Chemistry: Engineering Solutions for Sustainable Chemical Processing; Wiley: Hoboken, NJ, USA, 2013. [Google Scholar]
Scheme 1. Workflow to calculate the Carbon Utilization Degree (CUDe) of biomass conversion technologies plus an analysis step. For details, please refer to Equations (1)–(3).
Sustainability 08 01028 sch001
Figure 1. Carbon flows as a percentage of carbon fixed in harvestable biomass Cin, including stubble, and the resulting productive (grey arrows) and unproductive C (hatched arrows) during biogas generation from maize (Boundary I) and further use of this biogas in a combined heat and power (CHP) unit (Boundary II).
Sustainability 08 01028 g001
Figure 2. Carbon flows as a percentage of carbon fixed in harvestable biomass Cin, including stubble, and the resulting productive (grey arrows) and unproductive C (hatched arrows) during biogas generation from maize (Boundary I) and further upgrading to bio-methane by conversion in a combined heat and power (CHP) unit, as well as separation of CO2 for further industrial use (Boundary II).
Sustainability 08 01028 g002
Figure 3. Carbon flows as a percentage of carbon fixed in harvestable biomass Cin and the resulting productive (grey arrows) and unproductive C (hatched arrows) of a cascading use of natural fibers as building insulation, followed by thermal recycling in a CHP unit.
Sustainability 08 01028 g003
Table 1. Carbon content of different organisms (% of dry matter).
OrganismMean Carbon Content (% of Dry Matter)RangeReference
Overall mean of energy crops46.5 [2]
Maize (Zea mays L.) (whole plant)48.647–50.2[2]
Poplar (Populus spec.) (in wood)47.5 [2]
Willow (Salix spec.) (in wood)47.1 [2]
Wheat (Triticum L.) (whole plant)45.2 [2]
Rye (Secale cereale L.) (whole plant)48.0 [2]
Grasses43.941.4–46.4[2]
Hemp (Cannabis L.)45.12 [3]
Bacteria≈50 [4]
Microalgae (green/brown)54.4/24.749–58/24–25[5]

