1. Introduction
Numerous studies have pointed out that one of the most important aspects to reduce energy consumption and avoid heating losses is increasing airtightness in buildings [
1,
2,
3]. It is because of this that most European countries have developed regulatory setups to limit energy consumption in homes associated with losses from air leaks, norms which, in some countries, have been applied for over a decade and that have gradually been increasing their rigorousness.
The first energy code came into force in Chile towards the end of 2010. For the time being, this considers minimum thermal resistance levels in roofs, ventilated floors and walls. All residential buildings built prior to this year lack any applicable thermal requirements. The next update will incorporate measures to regulate airtightness in homes. The main obstacle, however, is establishing compliance revision methods for these requirements, a situation which could impede the commitments set out in Chile’s Energy Efficiency Action Plan (PAEE20) from being met. The goal is to reach a 12% reduction in the energy demand [
4] in 2020 as compared to 2007.
The assessment method is done through air permeability tests in the buildings, a common procedure in several countries, such as, for example, the United States, Spain, Germany, Belgium, England, etc., and a norm which incorporates performance-based demand as is the case of France and Denmark [
5]. However, this is costly, and this is without considering setting up and certifying the technical team needed. Chile lacks a network of teams, laboratories and laboratory staff which can guarantee carrying out the tests throughout the entire country.
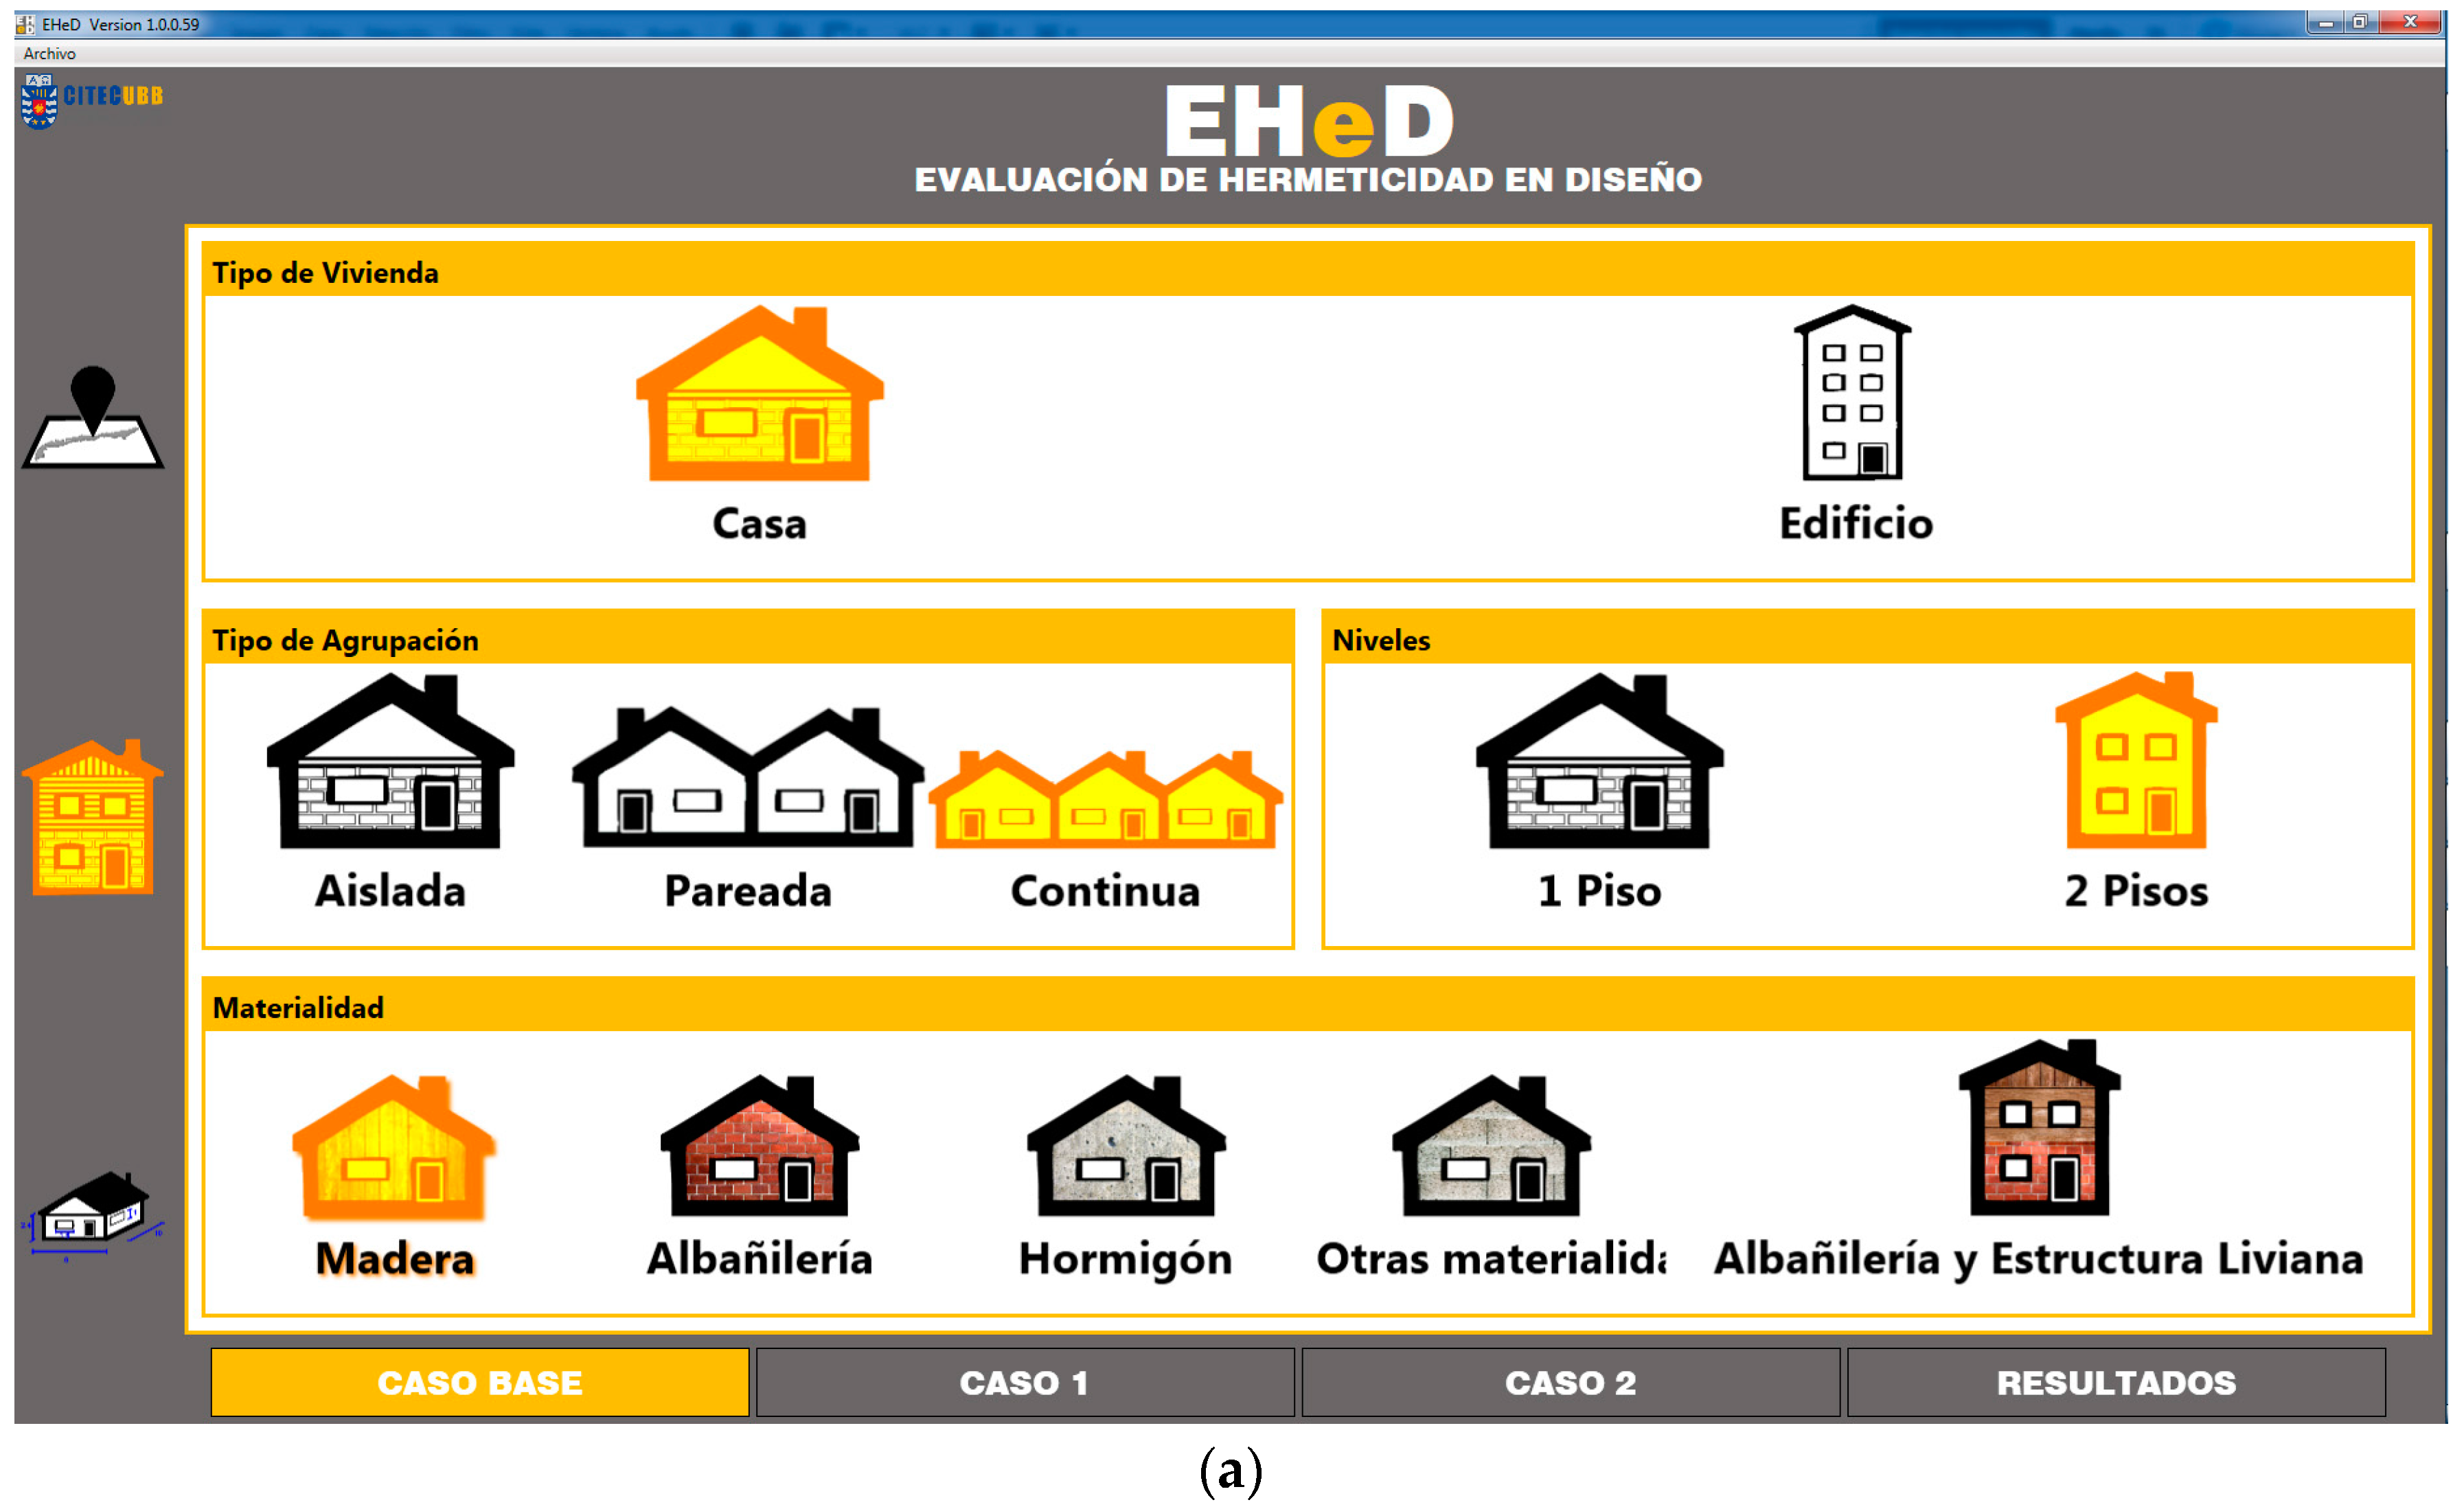
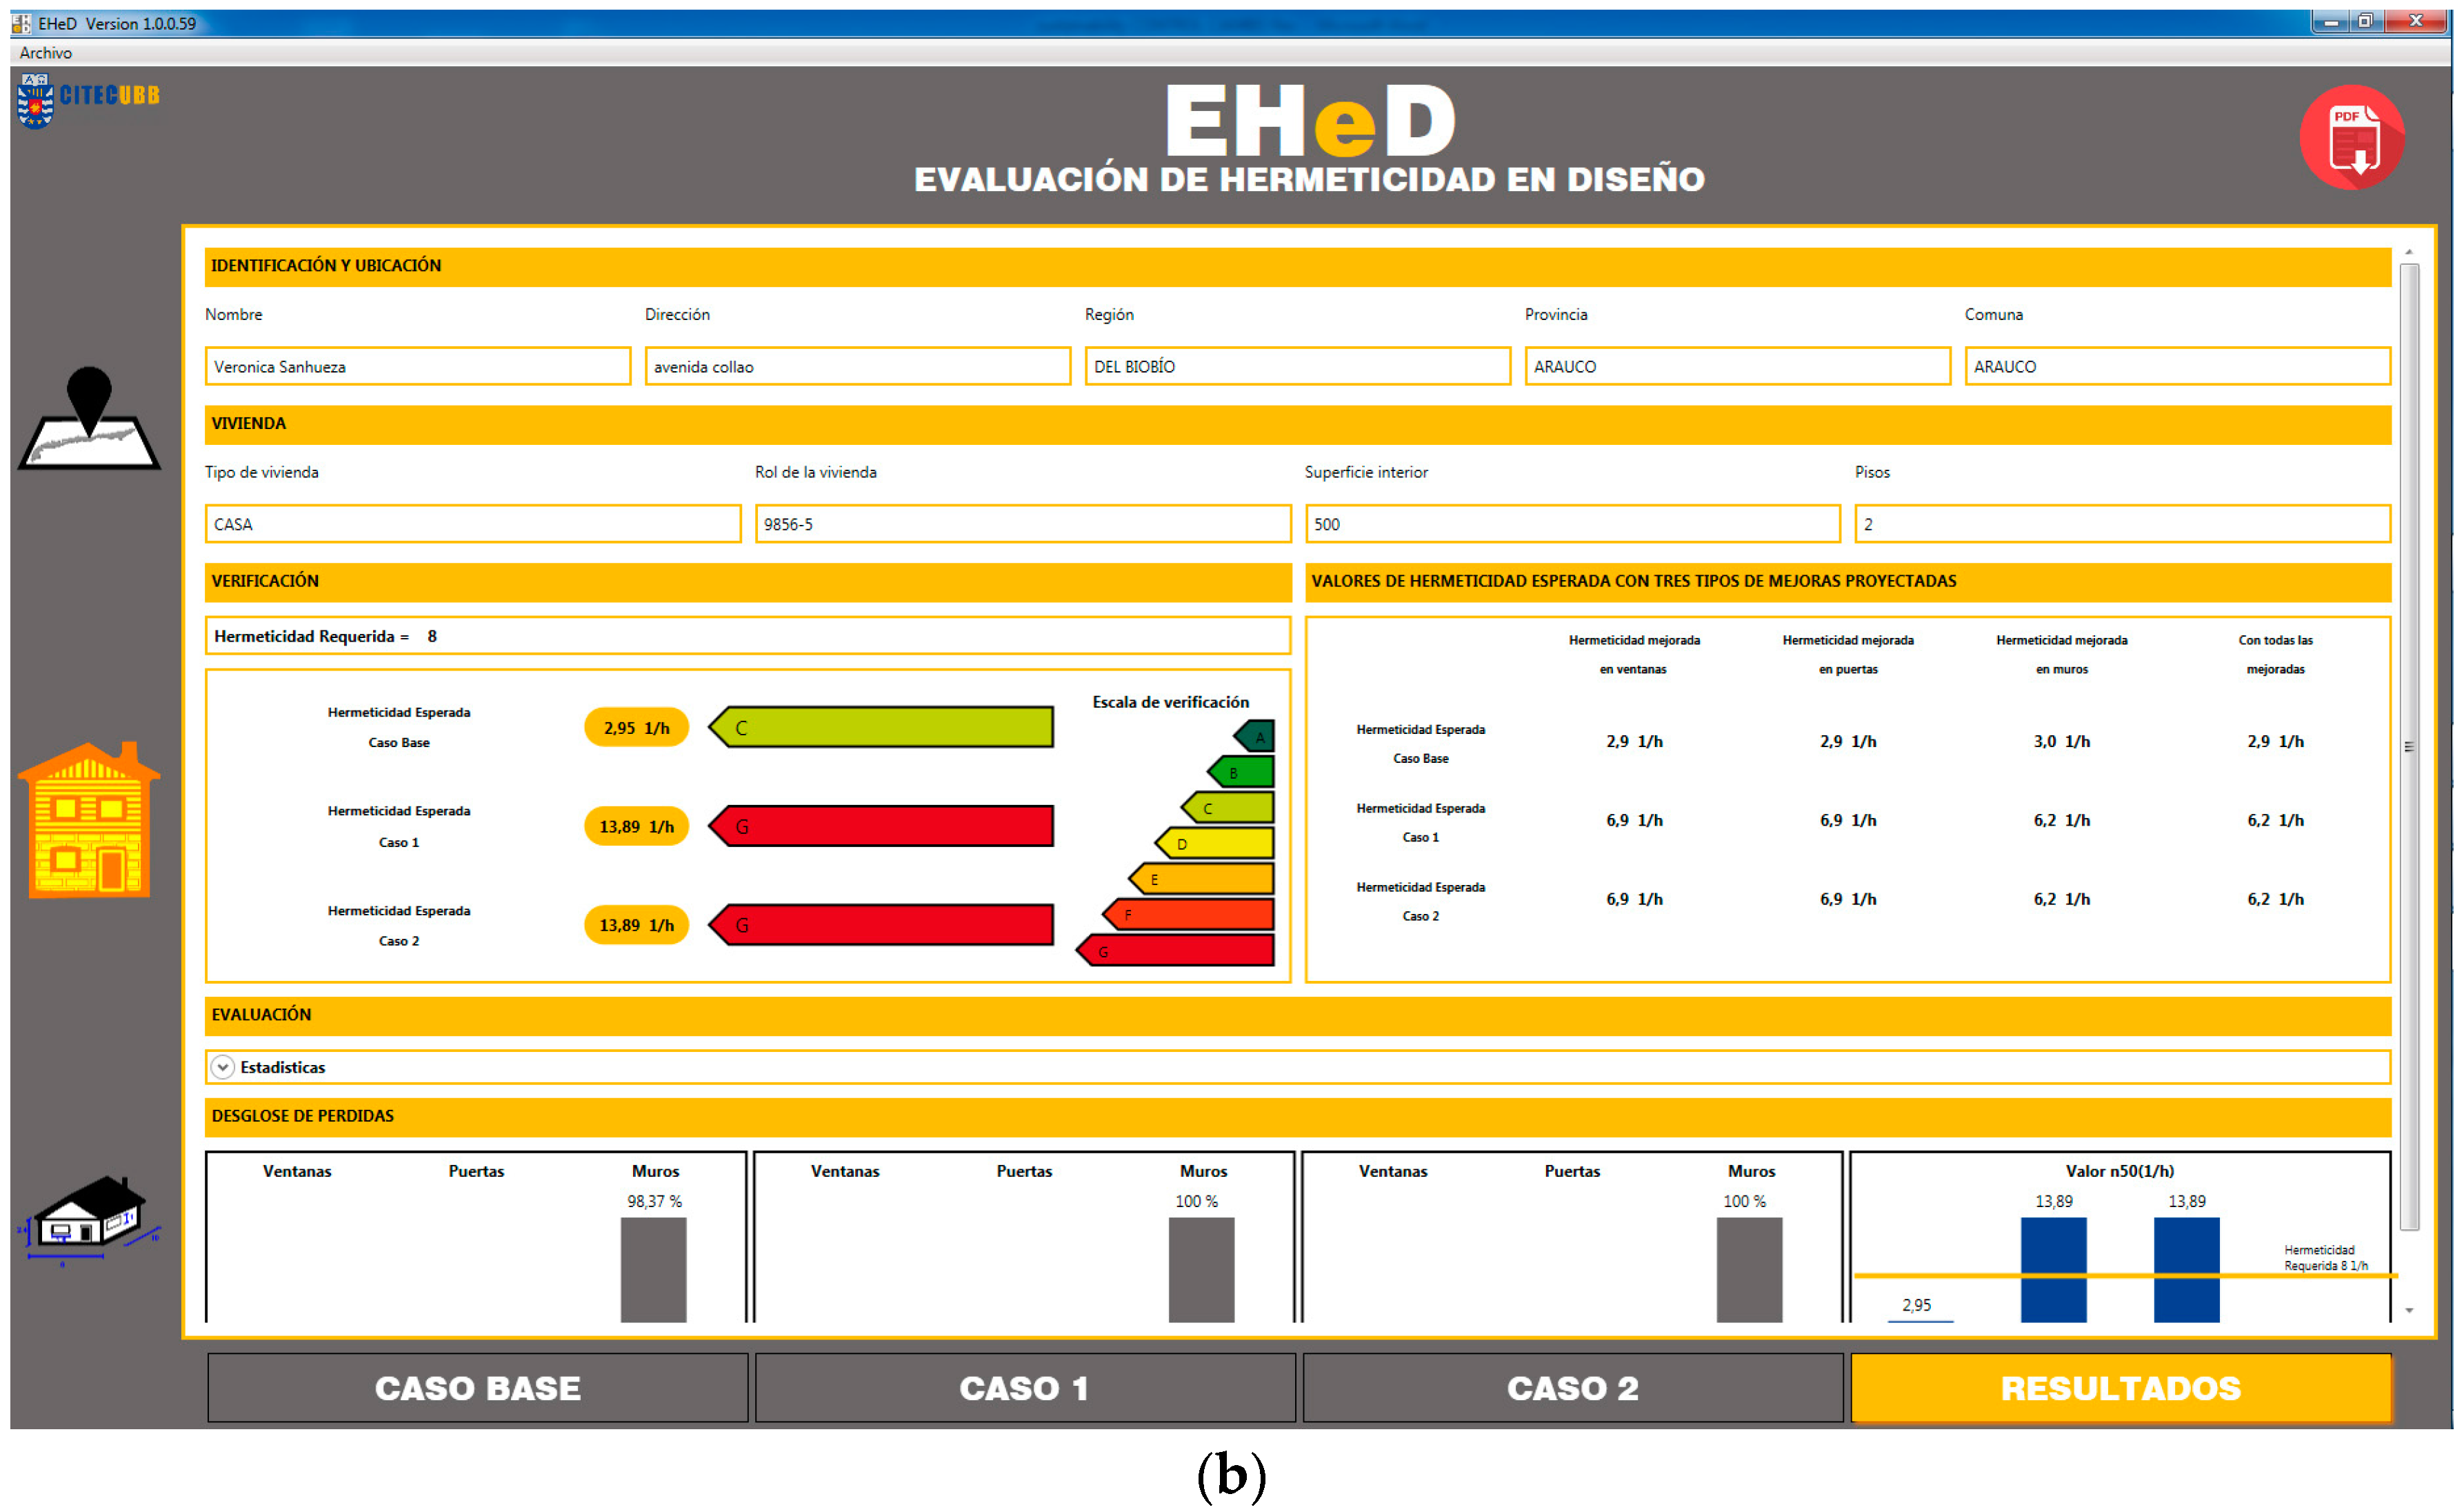
To meet this requirement, an IT tool has been created, which allows predicting the airtightness (n50 value) of housing, using the technology and demands that existed in Chile in 2007. The revision can be done both in the design stage and in the occupational stage of the home. The EHeD tool (Citec: Concepcion, Chile) uses a calculation model which has more than 450 sets of test data, developed from a database obtained both onsite and in the laboratory. Its inputs are the material, the type of windows and doors, as well as the architectonic typology. From this, the types of housing are likewise distinguished: detached, semi-detached or in blocks. The tool also incorporates three possible improvement scenarios based on the same aforementioned inputs.
2. Pressurization Test
According to ISO 9972 [
6], airtightness checks are performed using the air permeability test in buildings, commonly known as the Blower Door Test. This is a diagnostic tool designed to measure airtightness and to eventually help locate locations of leaks.
The test consists of a large fan being installed on an external threshold, which can be formed by a door or window. The fan drives air inside or outside the building, depending on the type of test being done (pressurization or depressurization), creating a pressure difference between the inside and outside of the building.
3. Airtightness Quality in Chile Compared Internationally
In general terms, housing construction in Chile cannot be considered as first rate, especially homes from the lower-income socio-economic stratums. This is due to the deficit of modern updated norms, leading to materials being chosen based on cost rather than quality. Another determining factor is the lack of clear technical specifications, the lack of technical sealing solutions, deficient work and the reluctance of construction companies to implement quality control and certification. Airtightness can be a design and execution indicator for the construction, which could directly influence the repair cost. It is estimated, in Chile, that the cost of faults, including airtightness ones, are between 15% and 25% of the home’s cost [
7]. Added to this are the implications that these have on the consumption in a Chilean home. According to estimates [
8], these have an impact of between 24% and 73% on the heating energy demands.
Chile has an average airtightness value of 12 ach measured at 50 Pa. Studies on airtightness levels in developed countries before air permeability requirements began showed, for example, in the case of Canada, 5 ach [
9], 10.2 ach in the United Kingdom [
10], and between 15 and 20 ach in the United States [
11], all of these values measured at 50 Pa. All these levels are currently greatly exceeded thanks to the implementation of regulations for some 10 years now, which has increased the gap in the Chilean reality even further. These deficiencies in the country are also an opportunity to increase construction quality, improve comfort standards inside buildings, and reduce energy consumption and contaminant emissions.
4. Airtightness Prediction Methods
Different approaches have been made to predict airtightness in buildings. In order to introduce the state-of-the-art methods present in the literature, the authors feel it pertinent to group the prediction approaches into three different categories: prediction based on physical appearances, on inverse models and on statistics.
4.1. Physical Modeling
The physical method is the simplest to perform. It assumes that if the characteristic loss value of each element of the envelope is known, the sum of these is the total leak stream value at the pressure applied. From this, it can be understood that what is most important to apply this method is obtaining the respective loss value. To determine this, it is necessary to make air permeability measurements so that the losses for each component of the envelope can be individualized in square meters and linear meters, as applies. With these values, it is possible to estimate the airtightness of a home, assigning an air loss value to each component that is exposed to experiencing air losses to the outside, namely the wall, ceiling, floor, window, etc.
There is a database that can be used. For example, permeability characterization tables can be used in accordance with the construction component as presented in [
12]. An investigation that uses this method is the approach that the authors of [
13] propose, which explains the prediction of wooden housing. For this, they divide the air leaks into three groups: by surface layer, by linear meter of the joint and by individual points. Once the leak values are obtained, all the flows are added up and an estimated airtightness value is obtained. They collected loss data for each component through a survey, done mainly in Norway. However, the authors concluded that the experiment did not produce a correlation between the measured and forecast data. They deduce that this could be due to a series of factors, such as the labor, properties of the materials, possible leaks omitted and standardization of measurements in the laboratory for other materials.
The main problem that is seen in the physical method is the representativeness and accuracy of the leak characterization data, as there are diverse variables which could lead to the loss flows not reflecting the reality of the constructions, especially when the data, design, technology and labor belong to different countries or regions. The weather conditions the building is exposed to, the regulations, the maintenance required, and so on, all add to this. What is understood from the relationship between the calculation model and the measurements is that the accuracy of the results is going to depend on the quality of the data that is used to assign the air losses. Up until now, there has not been a study which develops a statistical analysis which proves that the representative losses that are proposed correspond to a population or an important number of buildings in a given area.
4.2. Inverse Modeling
The method design by Qi [
14] is a model which, through energy consumption and external climate variable monitoring, is capable of estimating the leak rate through the iteration of the ELA value (Effective air leakage area at 4 Pa (m
2)). This process is done by means of energy simulation programs coupled to a flow network software, obtaining a great amount of possible ELA values. For this process, real climate data is used during a given period, which coincides with the data of the building’s energy consumption monitoring, in this case over two weeks. In addition, the wind pressures for each façade obtained through the Cp calculation website [
15] are considered. Said ELA values are used to calibrate the simulation model, where the value that is closest to the monitored energy consumption values is finally the leak value that is later used to establish the airtightness value. The author does not specify whether they considered the climate variables of the environment inside or the U values of the thermal envelope, data which should have a high impact in the calibration process. The author deduces that there is a percentage of uncertainty in regards to the method, as it is calibrated following the energy consumption, leaving a wide range of inputs that are not considered, such as, for example, the occupation and the efficiency of the heating system, among others. The number of tests and the monitoring needed to calibrate the model correctly means that this method is not as complicated or as expensive as performing a pressurization test.
4.3. Statistics
The statistics models are performed by using airtightness databases in buildings, normally for a delimited area, to obtain a representative universe for this location. Unlike the physical prediction method, statistics models can include qualitative aspects of the construction and the income level of the occupants or the age of the building. The most important aspect of this method is to correlate the components or aspects which have the greatest impact on the airtightness, which could be applied as adjustment factors to predict the quality of the envelope’s opposition to the passing of air.
Montoya uses multiple regressions to determine a model that predicts airtightness of homes in Catalonia [
16]. For this, he uses a statistical model developed from an airtightness database of 251 French homes. According to the author, both types of housing have the same designs and construction techniques. The factors are applied in a formula which simplifies the law of powers, modifying the value of C using different factors. For this, n = 2/3 is assumed as an exponent and the area and number of floors, the age of the construction and the type of structure are included as factors. q50 is calculated according to Equation (2):
Chan [
17], using regression techniques, identified different parameters to determine housing leaks in different areas of the US. For this, he used a database with an approximate total of 70,000 pressurization test measurements. The prediction equation is developed based on the connection of physical and qualitative variables with the standardized leak, considering the area and number of floors, the age of the property, the type of foundation and the economic level of the home. Airtightness was expressed as the effective leakage (ELA); the formula is presented in Equation (3).
5. Background Information
5.1. Methodology
The study uses the physical prediction method to develop the calculation formula, considering the [
13] estimation method as a reference. This assumes that it is possible to determine the airtightness of a home, using the sum of the losses of all the envelope’s components. The process considered three levels of development: identifying the main factors that have an impact on the airtightness of homes in Chile, preparing an airtightness database for each component detected as causing losses (wall, windows and doors), and preparing a calculation model integrated with an IT interface.
5.2. Presumption
The article refers to walls, considering all the envelope. It is assumed that there is loss through the ceiling, which is of the type of wall itself, and for this reason, this result is not individualized. In the case of the corners, a characteristic loss value or coefficient for this phenomenon is not included. Ventilation openings were excluded and all those could be affected by determining the losses from the envelope itself, such as the sanitary installations and electrical connections. Given that each wall typology studied presents a characteristic construction system and design, the losses through the ceilings and floors are assumed as a characteristic of the wall typology itself.
5.3. Citec Database
According to [
18], the first database of air permeability values is created starting from the airtightness baseline study of thermal envelopes of residences built in Chile, information that allows establishing the calculation basis of the EHeD software. This study covers each region of the country, where the relevant factors are evaluated, namely the age of the building, the predominant wall material, the number of floors, the area built and the regulatory thermal demands. Once this information is obtained, the parameters which the housing universe must comply with to evaluate the airtightness were established. A sample of 191 cases was taken where the impact of each one of these elements was detected.
The second database was obtained using experimental techniques developed onsite and in the laboratory. The site tests were used to obtain the walls’ air permeability database. Additionally, to begin with, the pressurization test was considered to also evaluate the losses through windows. However, due to the lack of variety in material and types of openings of these in situ, the tests were rejected, preferring laboratory tests where there was a higher amount and variety of manufacturers, and also controlled test conditions. The same was done in the case of the doors.
5.3.1. Opaque Exterior Walls
The airtightness results on walls were obtained using pressurization techniques that are commonly called pressurization tests, following the procedures found in the ISO 9972 Norm [
6]. One hundred and ninety-one tests were performed, both on houses and apartments. These studies were carried out between 2012 and 2013 in the country’s two main cities, Santiago (97 homes) and Concepcion (94 homes).
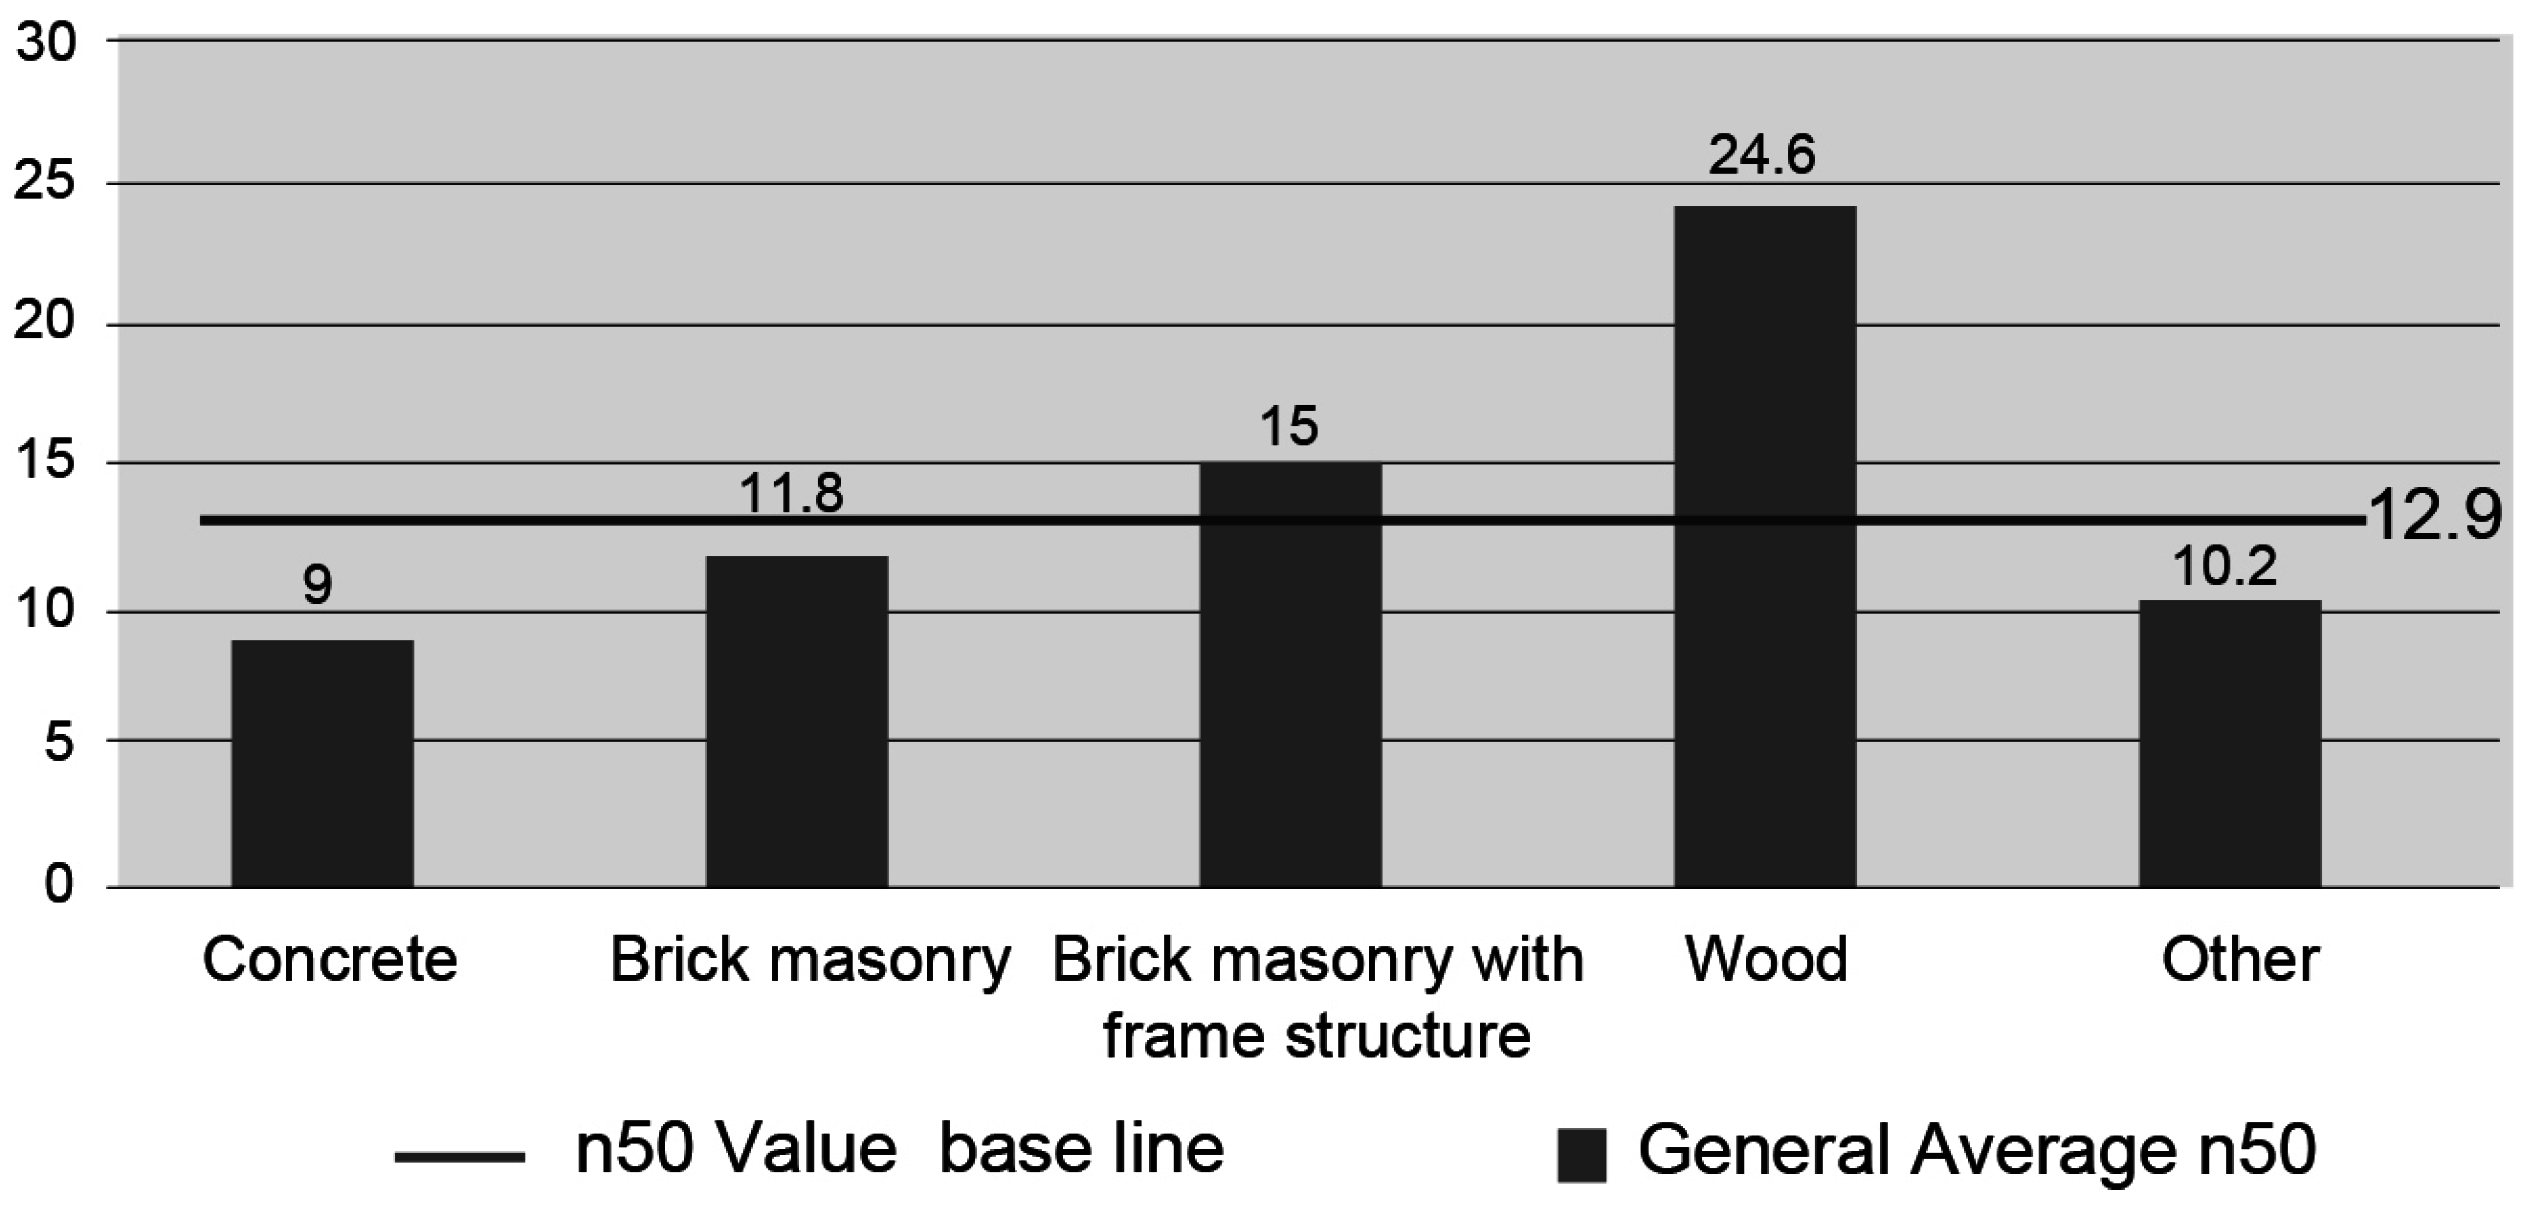
The database contains the values of walls with five different materials: concrete, brick masonry, brick masonry with a frame structure, wood and other materials (
Figure 1). The pressurization test procedure was performed on each one of the homes, covering all the openings (latticework and others) and hollows to, in this way, obtain the specific value of the opaque exterior wall. According to the analysis performed on the database, it is established that the average airtightness level of homes in Chile is around 12 ach, where its variation is going to depend mainly on the type of construction system of the envelope.
Faults in wall elements were mainly found where there are discontinuities between construction components. This covers ceiling-wall, wall-foundation, first floor wall–second floor wall, overlaps and corner joints. A fact which reveals a deficient housing construction, is lack of or unsuitable wind barrier specifications along with the lack of use of products which guarantee airtightness of the joints also adds to this.
5.3.2. Windows Database
The database was prepared using laboratory tests obtained through the procedure described in NCh892 Of. 2001 [
19], which contains a total of 260 tests for different manufacturers. Although the measurement according to the standard test is 100 Pa, for practical purposes the values presented are at 50 Pa as shown in
Table 1. This sample represents the most commonly used window types in the country. According to the database results, it is deduced that there is great disparity in the permeability in the windows, the main difference being the type of opening, the material of the frame and the manufacturer. The permeability of a window depending on the frame’s material can vary greatly; as such, this factor does not necessarily guarantee airtightness. Thus, it can be deduced that the broad range of results obeys mainly differences in the levels of standardization of the manufacturing processes.
A general description of the windows results is presented below in terms of opening type and frame material, as a way of showing the windows’ air permeability quality in the Chilean market. However, the EHeD calculation method uses the average value of the windows per manufacturer, material, and type of opening for each case, giving a more accurate value (
Table 2).
Horizontal Sliding
Sliding windows are the most used typology, as they do not consume space for opening. However, this type of window presented one of the worst air permeability performances for openings, with an average value of 9.8 (m³/h/m²), and variations between 0.4 (m³/h/m²) to 71.7 (m³/h/m²), measured at 50 Pa. This comes from their natural closing system, which lacks a compression design, reducing the friction between their components. Their main leak points are generated where the mobile panels meet. The panels have a lack of rigidity on the tracks, which means that these lose stability due to the wind pressure, letting air in. Another important aspect is the lack of efficient airtight stoppers, which avoid air exchange. The closing devices guarantee blocking the panel’s movement, but do not necessarily guarantee the airtightness of the set, since in many cases, the window’s design does not consider the incorporation of measures to avoid letting air through.
Casement
These presented an average loss stream of 17.4 (m³/h/m²), with values ranging between 0.1 (m³/h/m²) and 76 (m³/h/m²), when measured at 50 Pa, with the latter being the worst evaluated. The leak points are found on the upper and lower edges of the frame; this is because normally a single closing point is considered to be located in the center of the window, being pressed only in the center, weakening the effectiveness of the closure towards the edges of the window. Another characteristic of these windows is that they have fewer contact points and longer joints in comparison to other typologies, which exposes them to having greater leak points.
Top or Bottom Hung
One characteristic of this type of window is that they have pressure seals and, generally, flexible rubber weather strips (rather than brush-type strips) which seal by compression, providing good airtightness. However, most had a single contact which means that the edges of the window do not have the same level of pressure as in the center (where the closure is located). This generates the main leak points.
5.3.3. Material
Zinc-Coated Iron
The iron frames are most commonly found in older homes in Chile. They presented the most deficient levels in terms of permeability, mainly due to their not very industrialized manufacturing, which leads to irregularities in their design and manufacture.
Wood
Due to problems on opening, caused by expanding and contracting with the climatic conditions and the care these require to avoid fungi, they are not frequently used anymore. In spite of this, thanks to the technology that exists nowadays, it is possible to obtain high quality products in Chile.
Aluminum
The aluminum windows presented the greatest disparity. They have high levels of technology and manufacturing processes; however, hand-made windows are still produced, which lack quality control. This would explain the asymmetry of the results.
PVC
In general, PVC windows have a high level of industrialization, which is reflected in the quality of the joints, assembly and finish of the windows.
5.3.4. Doors
The same procedure was performed for the doors. These were evaluated in regards to the frame’s material, where the greatest disparity is seen between the different products. According to site and laboratory experiences, it is inferred that another determining factor is the quality of the labor during installation and the lack of sealing elements which guarantee airtightness.
5.3.5. Seals and Weather Strips Applied to Door and Window Components
The data was prepared using laboratory tests following the NCh892 Of. 2001, where leaks were measured by the linear meter of the joint at 50 Pa, both in windows and on door frames. The tests were performed with and without seals to estimate the impact using seals has on airtightness over the envelope’s components.
Three main parameters were considered for the choice of sealing solutions: adhesion of the seal to diverse sublayers; movement capacity or elasticity; durability; and change in the physical properties after exposure to inclement weather. Several of the products available in the market comply with these characteristics, with neutral silicon and polyurethane foam being chosen in the end.
Weather strips, used mainly to restrict air passing through where the wall meets the door or window component, were also tested. The selection criteria were resistance to open air and had excellent stability under UV rays. For door weather strips, a double contact was chosen and for windows a wedge type or type depending on the window.
In all the cases, the use of these seal elements reduced the air leaks. The values fluctuated between 15% and 35%.
6. Calculation Method
The formula is comprised following the results of the analysis by the database of walls (
Table 3), windows and doors, whose loss flows, when added together, give the total expected airtightness results (value n50) at 50 Pa, as described in Equation (1).
There is also the option of generating improved scenarios with regards to the use and incorporation of seals and weather strips on doors and windows, which for practical purposes are reduction coefficients. These were deduced from the experimental tests associated with the use of weather strips and silicon seals as shown in
Table 4.
The reduction coefficients proposed in
Table 5 were not part of the validation processes, as these are proposed as having a moderate savings potential. It is estimated that the improvements should be greater than those previously stated by the program. Coefficients
c1 and
c2 are for the cases of wooden homes and do not apply to the rest.
7. Validation
The validation considered two types of analysis. The first is a general verification, in which it is expected to determine the tool’s capacity to assess and forecast the class of airtightness into which the houses being analyzed fit.
For the classification-based evaluation, this was done based on limit values which the NTM 11/03 [
20] norm demands, which vary depending on the climatic rigorousness. For this (
Table 6), a label was used that is similar to the one set in 1992 as a common outline for energy labels, used on washing machines, dryers, lamps, and so on, where letter A is green for the best quality level and G is red for the level with the worst performance. The level the norm demands is an E, and given that its requirement level is considered minimal, it is located among the three worst ones.
The second validation procedure refers to the tool’s accuracy, where its capacity to calculate the air losses for each component of the envelope involved in the study (walls, windows and doors) is assessed. Both validation cases, general and detailed, are compared with results obtained through site tests and by means of pressurization tests. For this purpose, 14 tested homes were used.
8. Results and Discussion
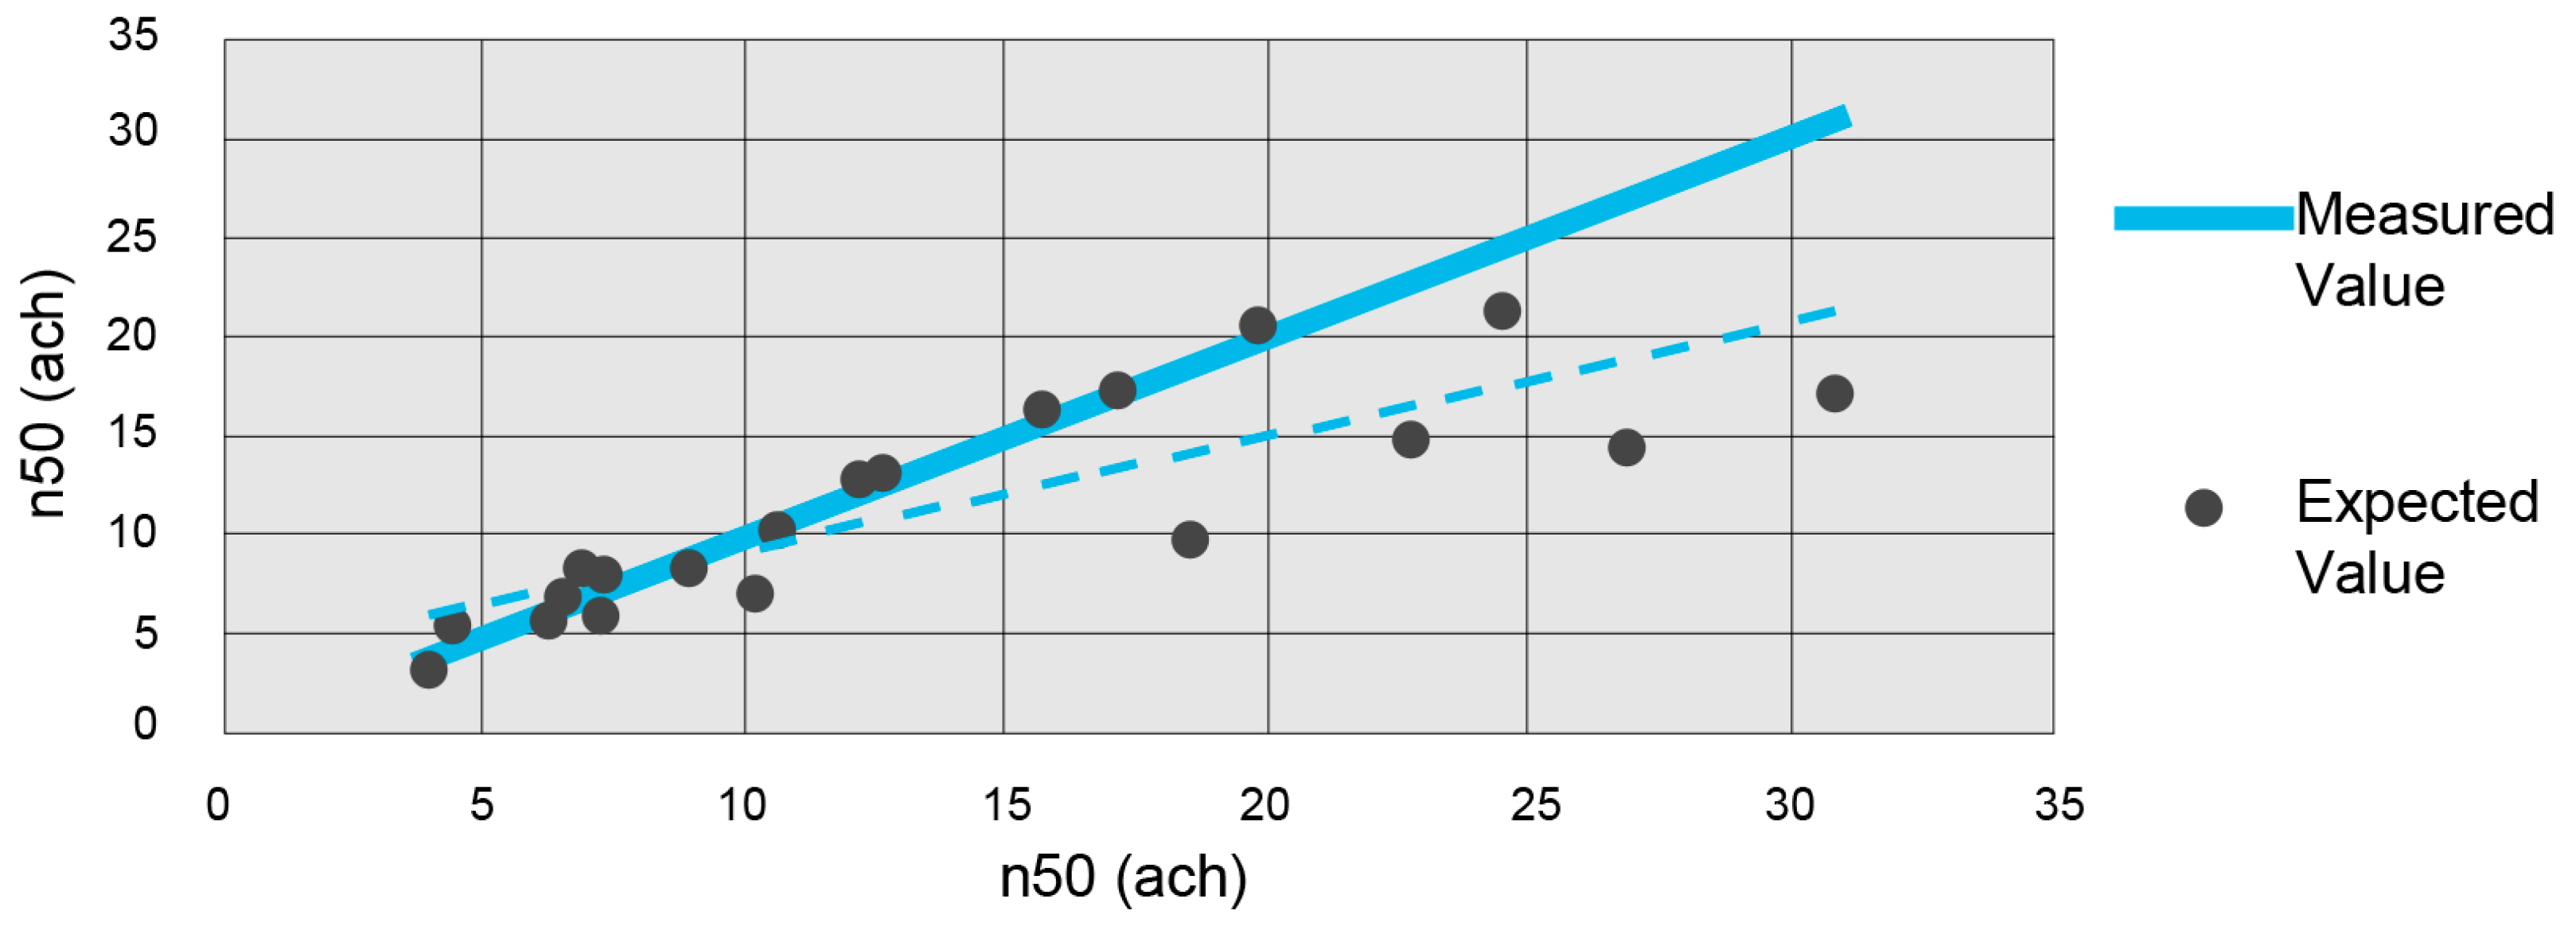
Fourteen homes were evaluated with the EHeD tool, five with brick masonry, three wooden, two mixed and four concrete. The verification through the ranges provided a 75% degree of accuracy, with ranges of 1.1 ach at 50 Pa. In the detailed evaluation of all the homes, a correlation of
r = 83% was obtained between the values expected vs. those measured. As such, it is assumed that the choice of the variables considered for the calculation model is right. On the other hand, the homes analyzed by material presented differences. Wooden homes showed a high degree of deviation, with a mean absolute percentage error (MAPE) of 20.6% due to the low number of tests in the database, which is why its mean airtightness value is not that strong. Concrete and brick masonry had better prediction performances with variations of 14.2% and 13.0%, respectively. It is deduced that this is because the disparity in airtightness between homes of both construction systems does not present as much variation as in the case of systems in wood, which is why the mean values of these must fit and incorporate coefficients for singularities. More data is required to categorically confirm that the results are representative. According to
Figure 2, it is deduced that the relation between the measurement and the expected values has a higher correlation in the tests with better airtightness, while the houses with greater losses are further from the expected values. In general, the values measured were higher than those forecast (
Table 7).
9. Limitations/Future Work
The developed software presents a simplified model to estimate airtightness in Chile. Given that its use is orientated towards architects, builders and home owners, a simple calculation method was opted for, considering simplified inputs, so that the process can be done without needing much time. The results that the tool provides were limited to cover the needs of non-specialist users, which is why they only present information deemed appropriate for quality verification purposes and for comparison between improvement investments. The software has a database for each component of the envelope; in the case of windows and doors, it is possible to identify manufacturer and model. In some cases, these values have a low degree of reliability as there is a lower number of tests. However, the database is uploaded, and as such it will get stronger as a higher number of experimental and onsite tests are generated. There are factors which affect the airtightness and that, due to the magnitude of their quantification, have still not been incorporated in the tool, such as the labor, variety of sealing techniques, age of the housing, etc; these are aspects which could cause major deviations in the total values provided. These adjustments will be incorporated into a second version of the software.
The results were carefully designed to be easily understood, allowing the comparison of scenarios, identifying elements that have the greatest impact on airtightness and how it can be improved;
Figure 3 is an example of the software-friendly design.
10. Conclusions
Air leaks are one of the most important factors in energy expense in buildings, especially in homes. A user-friendly software, named EHeD, has been developed to predict the airtightness of Chilean homes. The software is orientated for use by non-expert users in the sustainability area, to evaluate the expected behavior of the home, with different scenarios and options which allow orientating the design stage.
A simple airtightness prediction calculation model has been presented, which assumes that the flow can be obtained by using the sum of the known losses of all the envelope’s components. The development of the calculation model has been obtained by analyzing the reality in the airtightness quality of homes in Chile, assessed by making studies in laboratories and onsite of the home’s components. The mathematical model has been obtained by a state-of-the-art study on calculation prediction models, modifying the system that best fits the local building characteristics. It was shown that the modified method of Relander and Holøs (2010) [
13] is capable of obtaining a correlation between airtightness measurements and predictions in homes. For this, the authors suggest that the correlation between predictions and measurements is going to vary in regards to the accuracy of the source of the characteristic leaks that are used. The software has been checked using a detailed analysis of the home’s airtightness onsite, presenting the expected results, which vary by ±5%.
Acknowledgments
This article was written within the framework of the CD INES I+D 14-41 Project “Development of an IT tool for the analysis and satisfactory verification of the airtightness of building projects in Chile, following the standards of the NTM 011/3 2014 Norm” 2014–2015, developed by Citec at the Universidad del Bio-Bio.
Author Contributions
The work done in the project was distributed equally among authors: Alex González and Carolina Recart, have developed the software together, including the calculation method adjustment. Rodrigo Espinoza worked with the materials database and Ariel Bobadilla validated the results.
Conflicts of Interest
The authors declare no conflict of interest.
Nomenclature
| ELA | Effective air leakage area at 4 Pa (m2) |
| n50 | Airtightness value at 50 Pa |
| V | Volume |
| qL LL | Linear leakages in joints. (m³/h)/m |
| qs As | Leakages in the surfaces. (m³/h)/m² |
| Qp | Leakages associated with all the penetrations (m³/h pcs) |
| q50 | Air flow through envelope |
| C’ | Modified power law leakage coefficient as defined (m3/(s·Pa2/3)) |
| ΔP | Pressure difference (Pa) |
| NL | Normalized leakage area |
| Area | Floor area (m2) |
| qM | Air flow through the wall |
| qV | Air flow through windows |
| qP | Air flow through doors |
| sM | Wall surface (m2) |
| sV | Window surface (m2) |
| sP | Door surface (m2) |
| c1 | Reduction coefficient (housing typology) |
| c2 | Reduction coefficient (seals) |
| c3 | Reduction coefficient (seals) |
| c4 | Reduction coefficient (weather strips) |
References
- Fennell, H.C.; Haehnel, J. Setting Airtightness Standards. ASHRAE J. 2005, 47, 26–30. [Google Scholar]
- Emmerich, S.J.; McDowell, T.; Anis, W. Investigation of the Impact of Commercial Building Envelope Airtightness on HVAC Energy Use; The National Institute of Standards and Technology (NIST): Washington, DC, USA, 2005.
- Venckus, N.; Bliūdžius, R.; Endriukaityte, A. Research of low energy house design and construction opportunities in Lithuania. Technol. Econ. Dev. Econ. 2010, 16, 541–554. [Google Scholar] [CrossRef]
- Ministerio de Obras Públicas; Ministerio de Vivienda y Urbanismo; Ministerio de Energía, Ministerio de Medio Ambiente. Estrategia Nacional de Construcción Sustentable. Available online: http://csustentable.minvu.cl/wp-content/uploads/2014/11/Estrategia-Construccion-Sustentable_ENERO-2014_VF_Baja.pdf (accessed on 31 August 2016). (In Spanish)
- Kunkel, S.; Kontonasioum, E.; Arcipowska, A.; Mariottini, F.; Atanasiu, B. Indoor Air Qualitu Thermal Comfort and Daylight. Analysis of Residential Buildings Regulations in Eight eu Members States; Rapfs, O., Lottes, R., Faber, M., Marian, C., Dumitru, M., Eds.; Buildings Performance Institute Europe (BPIE): Brussels, Belgium, 2015. [Google Scholar]
- International Organization for Standardization (ISO). Thermal Performance of Buildings-Determination of Air Permeability of Buildings-Fan Pressurization Method; ISO: Geneva, Switzerland, 2006. [Google Scholar]
- Ramírez, V.; Serpell, A. Certificación de la calidad de viviendas en Chile : Análisis comparativo con sistemas internacionales. Rev. Constr. 2012, 11, 134–144. (In Spanish) [Google Scholar] [CrossRef]
- Bustamante, W.; Rozas, Y.; Cepeda, R.; Encinas, F.; Martínez, P. Guia de Diseño Para la Eficiencia Energetica en la Vivienda Social; Bustamante, W., Ed.; Ministerio de Vivienda y Urbanismo (MINVU) & Programa Pais de Eficiencia Energética (PPEE): Santiago, Chile, 2009. (In Spanish) [Google Scholar]
- Minister of Natural Resources. Improving Energy Performance in Canada; Minister of Natural Resources: Ottawa, IL, USA, 2000.
- Johnston, D.; Miles-Shenton, D.; Wingfield, J.; Bell, M. Airtightness of UK dwellings: Some recent measurements. In RICS Foundation Construction and Building Research Conference; Ellis, R., Bell, M., Eds.; Royal Institution of Chartered S bajar urveyors: London, UK, 2004; p. 13. [Google Scholar]
- Sherman, M.H.; McWilliams, J. Air Leakage of U.S. Homes: Model Prediction. In Proceedings of the Buildings X Conference—Thermal Performance of the Exterior Envelopes of Whole Buildings, Clearwater Beach, FL, USA, 2–7 December 2007.
- Liddament, M. A Guide to Energy Efficient Ventilation; Air Infiltration and Ventilation Centre: Coventry, UK, 1996. [Google Scholar]
- Relander, T.-O.; HolØs, S. Testing a Component Method to Estimate the Airtightness of Wind-Tightened Wood-Frame Houses; SINTEF Building and Infrastructure: Oslo, Norway, 2010. [Google Scholar]
- Qi, T.; Oneill, Z.; Augenbroe, G.L. Inverse modeling to estimate the effective leakage area in buildings. In Proceedings of the Building Simulation Conference, Atlanta, GA, USA, 10–12 September 2014; pp. 323–330.
- CP Simulation Program. CP Generator. Available online: http://cpgen.bouw.tno.nl (accessed on 1 January 2015).
- Montoya, M.I.; Pastor, E.; Carrié, F.R.; Guyot, G.; Planas, E. Air leakage in Catalan dwellings: Developing an airtightness model and leakage airflow predictions. Build. Environ. 2010, 45, 1458–1469. [Google Scholar] [CrossRef] [Green Version]
- Chan, W.R.; Price, P.N.; Sohn, M.D.; Gadgil, A.J. Analysis of U.S. Residential Air Leakage Database. Atmos. Environ. 2003, 39, 3445–3455. [Google Scholar] [CrossRef]
- Bobadilla, A.; Diaz, M.; Figueroa, R.; Arriagada, R. Proposal of Acceptable Air Tightness Classes for Buildings in Chile. Rev. Constr. 2014, 13, 15–23. [Google Scholar] [CrossRef]
- INN. Arquitectura y Construcción-Ventanas-Ensayo de Estanquidad al Aire: Nch 892 Of. 2001. Available online: http://ecommerce.inn.cl/Resultado_Busqueda/ (accessed on 31 August 2016). (In Spanish)
- Minvu (Ministerio de Vivieda y Urbanismo, Santiago, Chile). Anteproyecto de Norma NTM 11/03 Requisitos y mecanismos de acreditación para acondicionamiento ambiental de las edificaciones. Parte 3: Hermeticidad al aire. Unpublished work. 2014. (In Spanish) [Google Scholar]
© 2016 by the authors; licensee MDPI, Basel, Switzerland. This article is an open access article distributed under the terms and conditions of the Creative Commons Attribution (CC-BY) license (http://creativecommons.org/licenses/by/4.0/).


