Article

Land Use Changes Induced County-Scale Carbon Consequences in Southeast China 1979–2020, Evidence from Fuyang, Zhejiang Province

1
Institute of Rural Development, Zhejiang Academy of Agricultural Sciences, Hangzhou 310021, China
2
Institute of Economic and Social Development, Zhejiang University of Finance and Economics, Hangzhou 310018, China
3
Institute of Remote Sensing and Information System Application, Zhejiang University, Hangzhou 310029, China
*
Author to whom correspondence should be addressed.
Sustainability 2016, 8(1), 38; https://doi.org/10.3390/su8010038
Submission received: 30 September 2015 / Revised: 24 December 2015 / Accepted: 28 December 2015 / Published: 31 December 2015

Abstract

:
Land use change (LUC) is the most dynamic force in terrestrial carbon stock change, and it is imperative to account for the dynamics of LUC in carbon stock change when forming land use policies. This paper explored the impacts of LUCs on carbon (C) stocks at a county scale and detected changes of soil C stocks within a county-scale land use planning policy. The LUCs within 1979–2006 in Fuyang County (eastern China) and Fuyang Land Use Master Planning (FLUMP) (2006–2020) were selected for this pilot study. The estimates of C stock changes were examined by compiling vegetation and soil organic C density data from six land use types, and through literature reviews and field surveys. The results showed that LUCs between 1979 and 2006 already caused a vegetation carbon (VC) decrease of 273.44 Gg and a soil organic carbon (SOC) decrease of 771.01 Gg, mainly due to urbanization processes. Further, the FLUMP (2006–2020) is expected to lead to a potential C loss of 25.93 × 10⁻³ Mg C ha−1year−1 for vegetation and 27.48 × 10⁻³ Mg C ha−1year−1 for soil between 2006 and 2020. As the situation stands, it is urgent to devise rational policies and effective measures to reverse the C loss process.

1. Introduction

Land use at a global scale has changed notably during recent decades. Especially in developing countries, the acceleration of agricultural production coupled with population growth and urban expansion has led to a daunting transformation in land use and land cover. These intensive changes significantly modify the physical, chemical and biological properties of terrestrial ecosystems [1,2]
Global warming and climate change have been major environmental concerns in the past few decades. The role of terrestrial ecosystems as sources and sinks of C has been highlighted [3]. Soil C including ground (VC) and underground (SOC) is considered the largest C stock in most terrestrial ecosystems. As a consequence, increasing attention has been paid to soil C sequestration over recent decades. Since the Kyoto Protocol was enunciated, such changes in C storage due to land use change (LUC) have been vigorously assessed. Soil C may take centuries to accumulate under natural conditions, but human-induced LUC can have significant direct and indirect effects on VC and SOC stocks by altering the balance between C sequestration and C losses, which are extremely difficult to restore in the short term [4]. Thus, it is important to study the dynamics of current LUC and assess the impact of land use policy on soil C stock change.
Numerous researchers have discussed possible soil C changes in relation to land use and management practices [5,6,7,8,9,10]. In Europe, the dynamics of LUC in the overall carbon balance were assessed by Schulp et al. [11] and Zaehle et al. [12] using high-resolution LUC modelling approaches to analyze the effect of four LUC scenarios on carbon stock changes. Significant differences then were found in the spatial distribution of C sinks and sources between the LUC scenarios, the magnitude of which was influenced by the scale of the study area. Moreover, Batlle-Bayer et al. [13] reviewed publications about SOC stock changes following LUCs in Brazil, finding that intensive agricultural land use has resulted in SOC losses for the top 0.3 m of soil after conventional tillage-based systems were applied. The consequences of LUCs on vegetative carbon stocks were also explored with a combination of direct field measurements and a time series of remote sensing data in Xiamen, China [14] and Seattle, USA [15]. The former study exhibited a rapid increase in vegetation carbon storage from 1972 to 1996, while the implementation of reforestation programs was taking place in Xiamen. Conversely, an average loss of 1.2 Mg C ha−1year−1 in vegetative carbon stocks was detected from 1986 to 2007 in Seattle due to the decline of forest area.
In China, preserving and enhancing soil C storage has become a crucial issue for feeding an increased population and also reducing greenhouse gas emissions. Thus, the effects of LUCs on soil C balance have been extensively investigated in varied landscapes across the country using different approaches [16,17,18,19,20,21]. The Chinese nationwide governance of land use management is in accordance with the Land Administrative Law of China (LAL, formulated in 1986, amended in 1998 and 2004). The LAL provides detailed legal frameworks for establishment of land use policy, explicitly concerning environmental protection. In 2002, the Chinese government passed the Environmental Impact Assessment Law of China, which further required land use plans to undergo environmental impact assessments [22]. However, given that the formal legal arrangement has been documented on paper, environmental impact assessments related to the soil C balance issue remain neglected in fact. Furthermore, limited relevant studies in this field can be found.
In this research, we chose Fuyang County in eastern China as our study area, as traditionally the land use planning at the county level is representative of land use planning systems across China. The aim of this research is to investigate the dynamics of VC and SOC stock changes resulting from LUCs from 1979 to 2006 and to estimate changes of soil C stocks under FLUMP (2006–2020) [23]. The research focus is the role of LUCs in the overall carbon balance of the study area. Additionally, the information gathered would contribute to comprehensive assessment of current land use planning and further revision.

2. Materials and Methods
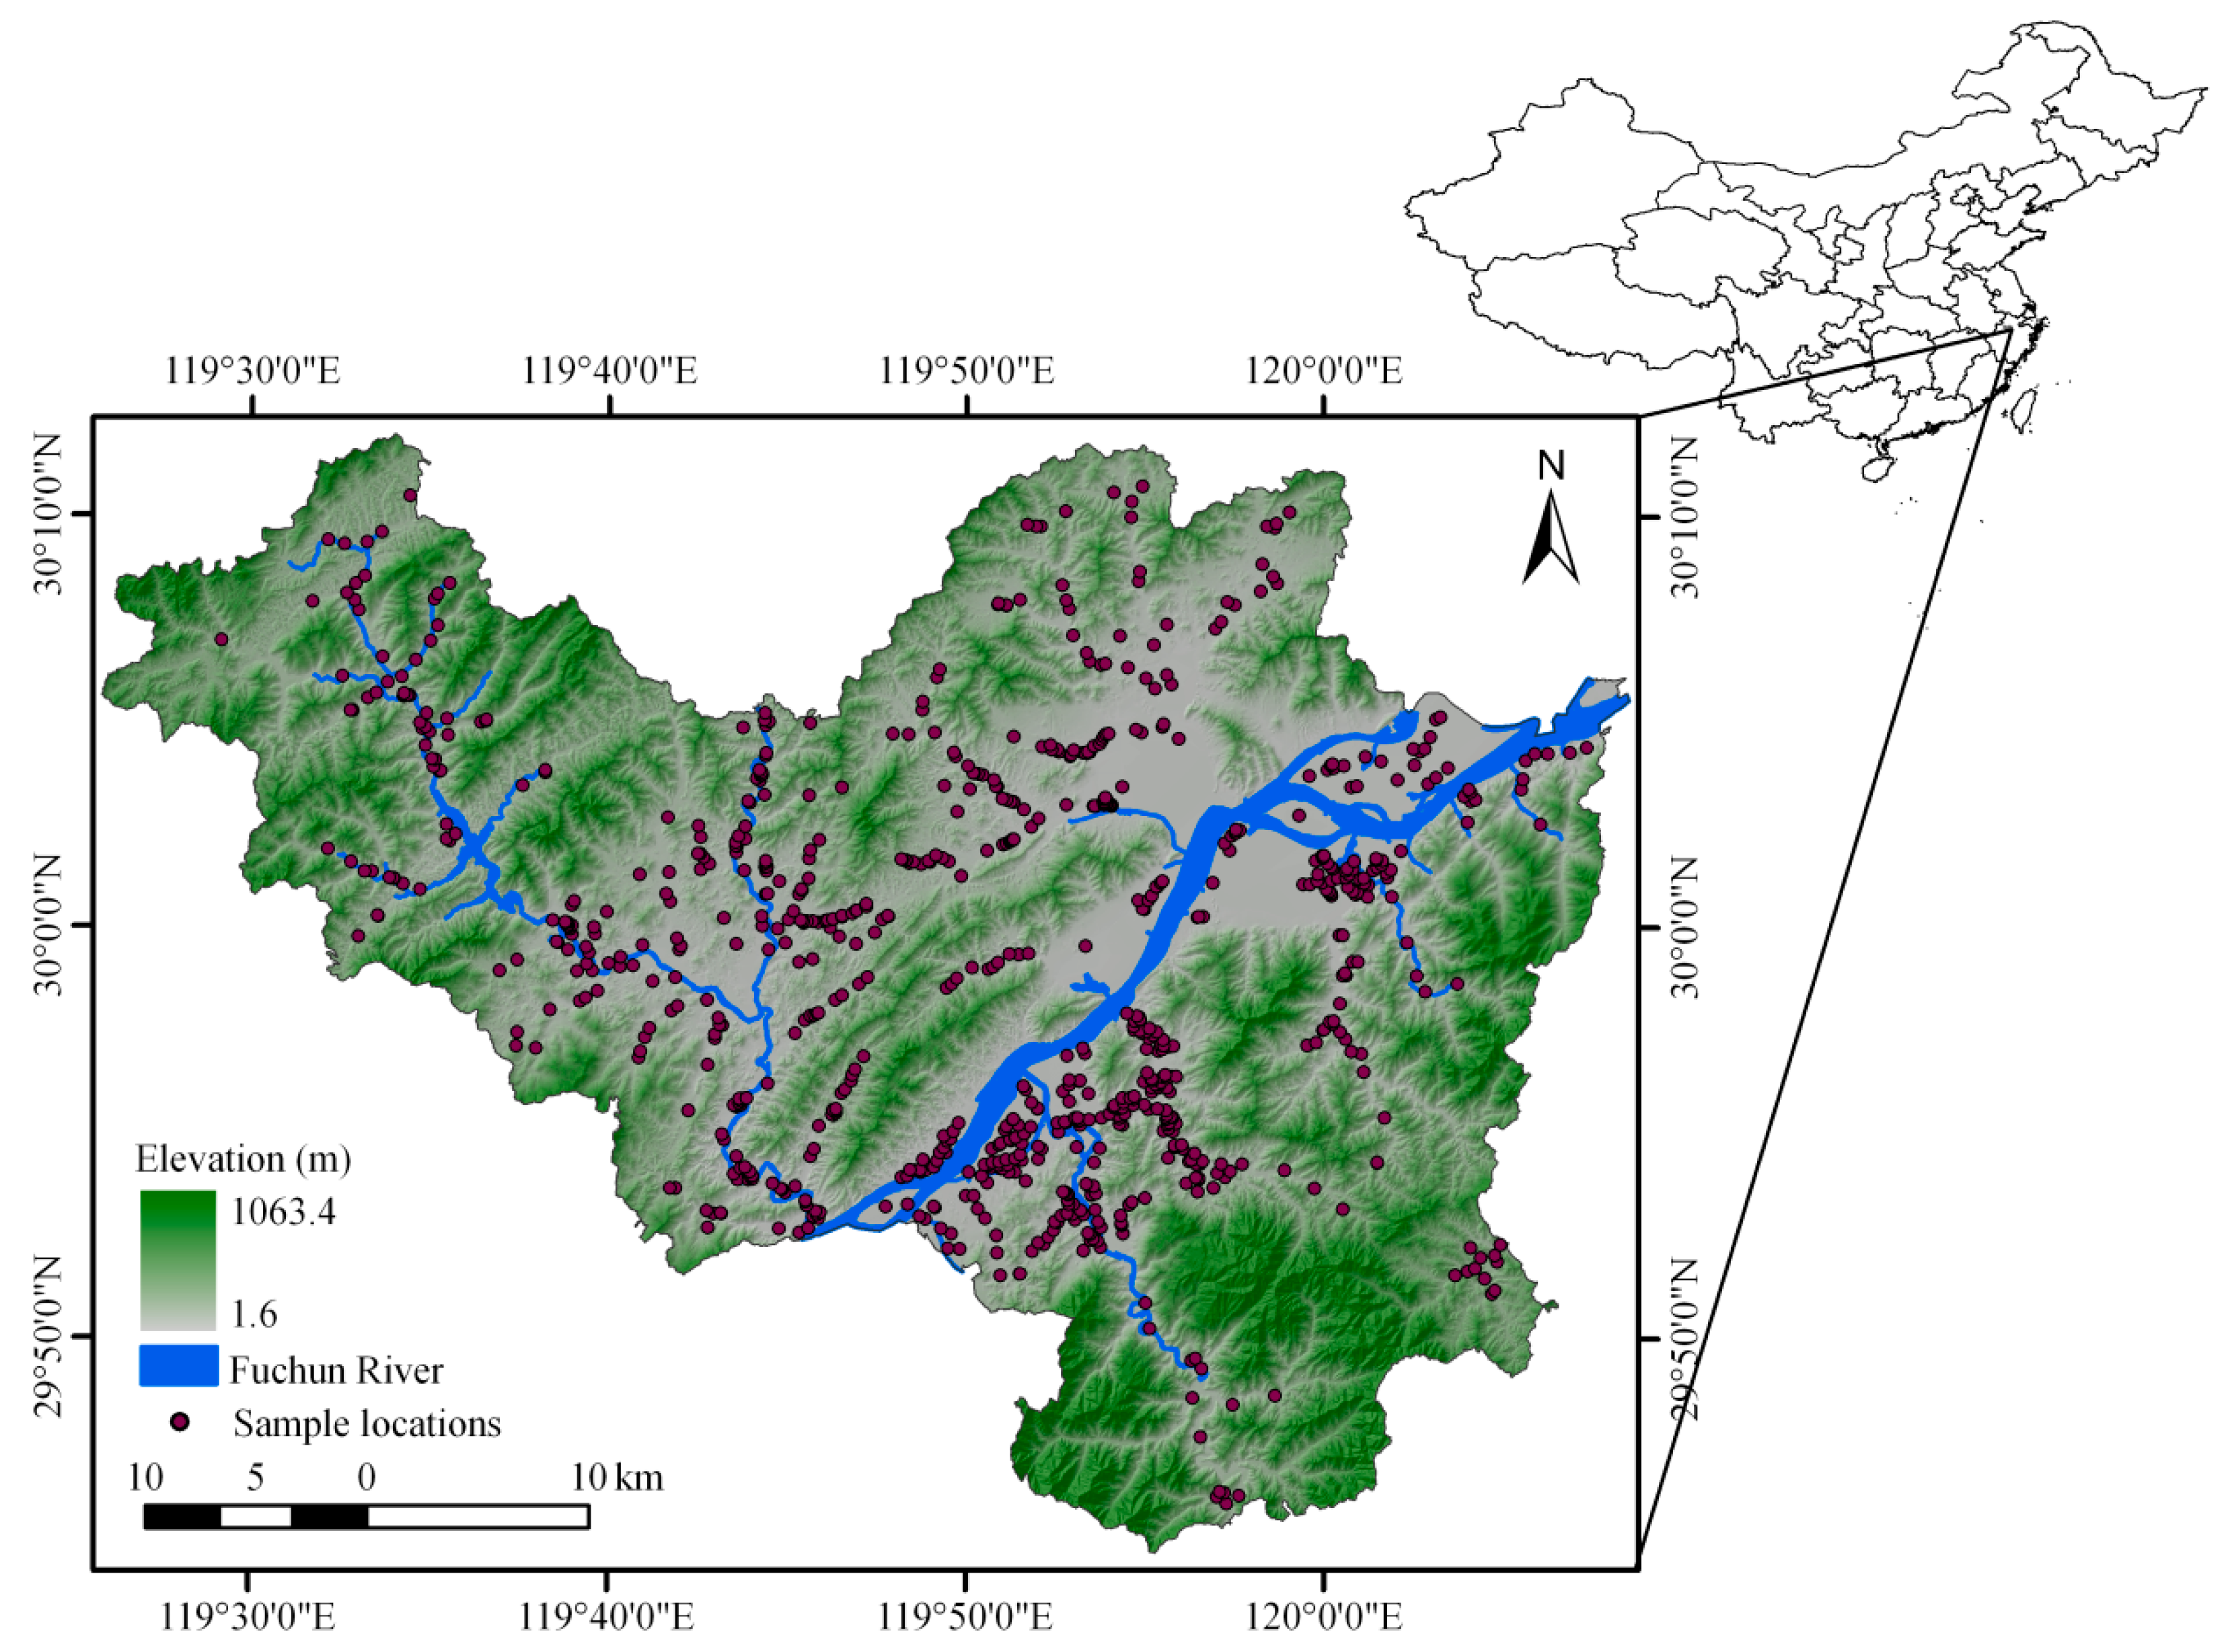
2.1. Study Area

Fuyang County, which is situated to the north of Zhejiang Province, eastern China, is selected to investigate the C sequestration (Figure 1). The county (119°25′00″–120°19′30″ E, 29°44′45″–30°11′58.5″ N) has a total area of 1831.2 km2, with Fuchun River flowing through it. The geomorphology over the region is constructed with mountains and river valleys, with the relative elevation varying from 1 m to 1063 m above sea level. Amongst the more common landforms, hills and mountains cover 78.61% of the county area, whereby plains and basins only account for 16.36%. The annual mean temperature is 16.1 °C. The mean annual rainfall is 1441.9 mm, and is unevenly distributed throughout the year. The dominant soils in the area are defined as anthrosols and ferrosols with clay loam texture.
Fuyang County is characterized by a large variety of land use types, most of them common to eastern China. Much of the natural vegetation is subtropical evergreen forests, of which, the tree species mainly consist of Fagaceae, Lauraceae, Theaceae, Magnoliaceae, Cunninghamia lanceolata, and Pinus massoniana. Traditionally, agricultural products have included rice, tea and fruit. Since the economic reforms began in 1978, the past three decades have seen urbanization and economic development rise at an unprecedented pace. There has been a massive transfer from agricultural land use to various other land uses in eastern China due to the rapid urban expansion. Thus, the land use data of 1979 were selected as a point of reference before rapid land use changes started in Fuyang County [24].
Figure 1. Location of study area and spatial distribution of soil sampling sites.
Sustainability 08 00038 g001

2.2. Carbon Density for Land Use Types

VC and SOC stocks were calculated separately for land use types in Fuyang County. Initially, a land use map for 2006 was derived from the results of the Second National Land Survey [25] which had been conducted by Bureau of Land and Resources of Fuyang County at scale 1:10,000. Also, the land use map for 1979 was produced by photo-interpretation of 1979 Landsat MSS images with a spatial resolution of 60 m. Within the GIS environment, all the spatial data were converted into raster layers with 60 m resolution, then geo-referenced to the (UTM) WGS-84 coordinate system and processed using ArcGIS 9.2 (ESRI Inc., Redlands, CA, USA.) software. Moreover, a pixel resolution corresponding to 60 m was chosen to better combine an exhaustive representation of the land use maps with a reasonable amount of data processing. Then, all the data acquired from these land use maps were primarily divided into 57 classes in reference to the criteria of National Land Use Classification (GB/T 21010-2007) (Ministry of Land and Resources of China). Accordingly, six categories of land use (cover) were generalized throughout the reclassification process, and these are: (1) built-up land: continuous urban fabric, industrial or commercial units, and road networks and associated facilities; (2) forest: broadleaved forest, shrub land, and mixed forest; (3) orchard land: fruit trees, and tea plantations; (4)vacant land: bare land, waste grassland, and bottomland; (5) cropland: paddy field, non-irrigated land, and irrigated land; (6) water bodies: rivers, lakes, and ponds (Figure 2). However, due to the low spatial resolution of MSS images in 1979, we were unable to classify the vacant land in that year. Moreover, in line with other C assessment studies [26,27], neither built-up land nor water bodies were assumed to have C stock, nor were they considered for C accounting.
Figure 2. Land use maps in Fuyang County for (a) 1979; (b) 2006 and (c) 2020.
Sustainability 08 00038 g002
Following this round of data acquisition, to detect the SOC of cropland, a field survey combined with laboratory work was conducted in 2006, and a total of 875 soil samples measured (Figure 1). First, each sample was collected at a depth of 0–20 cm profile and from five localities within 5 m of a specific sampling location, and then they were proportionally mixed. In the meantime, global positioning systems (GPS) were used to coordinate every sampling location. Afterwards, all the samples were air-dried at room temperature, stones and plant residuals in soil sample were manually removed, and the soil samples were ground to pass a 2-mm sieve. Then, SOC content was determined according to the Walkley and Black method [28]. Then, the SOC density of cropland soil was calculated by Equation (1) [29]:
D o c = S O C × r × H × ( 1 d 2 m m / 100 ) × 10 1
where Doc (Mg ha−1) and SOC (g kg−1) are the density and content of organic C, respectively; r (g cm−3) is the bulk density, H (20 cm) is the thickness, and d2−mm (%) is the coarse fraction of 2-mm soil which is negligible here.
The SOC densities for other land use types and VC densities for each land use type were estimated in Mg ha−1 using values derived from a systematic literature review. Relevant publications were identified through Google Scholar searching (scholar.google.com) using the search terms “Fuyang County” or “China” and “land use” or “land cover” or the name of each land use type, “vegetable carbon” or “soil carbon”. Literature searches were incrementally extended from Fuyang County into Zhejiang Province, and from eastern China into a wider region in China until three carbon values were obtained for each land use type (Table 1). Publications were preferentially selected that referred to data collected in 2006 ± 10 years to be consistent with the soil sampling data used, and that referred to the soil carbon contained in the top 20 cm of soil. Detailed information on how each carbon value has been calculated can be found in the Supplementary Material (Supplementary).
Table 1. Carbon density (Mg ha−1) for the six land-use categories considered in this study devised from National Land Use Classification (GB/T 21010-2007) classes in China.
Land Use TypeVegetation Carbon Density (Mg ha−1)ReferencesSoil Carbon Density (Mg ha−1)References
X XMINXMAX X XMINXMAX
1 *--------
228.1112.0650.18[14,30,31]55.5425.2577.77[32,33,34,35,36,37,38,39,40,41,42,43,44]
319.384.0448.93[31,33,35]42.3532.6846.2[32,33,36]
41.2402.3[35,37,38]16.644.7527.78[39,40,41]
53.251.295.7[31,35,38]42.52.481.6-
6 *--------
Note: *: built-up land and water bodies was not considered for C accounting. 1 = built-up land (continuous urban fabric, industrial or commercial units, and road networks and associated facilities); 2 = forest (broadleaved forest, shrub land, and mixed forest); 3 = orchard land (fruit trees and tea plantations); 4 = vacant land (bare land, waste grassland, and bottomland); 5 = cropland (paddy field, non-irrigated land, and irrigated land); 6 = water bodies (rivers, lakes, and ponds).

2.3. Fuyang Land Use Master Planning (2006–2020)

The dynamic changes in soil C stocks from 2006 to 2020 were assessed on the basis of FLUMP (2006–2020) acquired from Bureau of Land and Resources of Fuyang. The FLUMP (2006–2020) firmly restricts LUCs in Fuyang County during this period. Any g organization, business or individual that uses land must act in strict accordance with it. As such, FLUMP (2006–2020) data was considered as the land use map for 2020, and were reclassified into six categories using the classification method adopted in this study.

2.4. Data Process

Both VC and SOC stocks for the years 1979, 2006 and 2020 were calculated by multiplying C density for each land use type linked to land use areas. In the meantime, statistical analyses were performed by using EXCEL 2007 (MICROSOFT Inc., Redmond, WA, USA). Spatial overlay analyses of land use maps and the distribution map of C stocks was conducted using ArcGIS 9.2 (ESRI Inc., Redlands, CA, USA).

3. Results

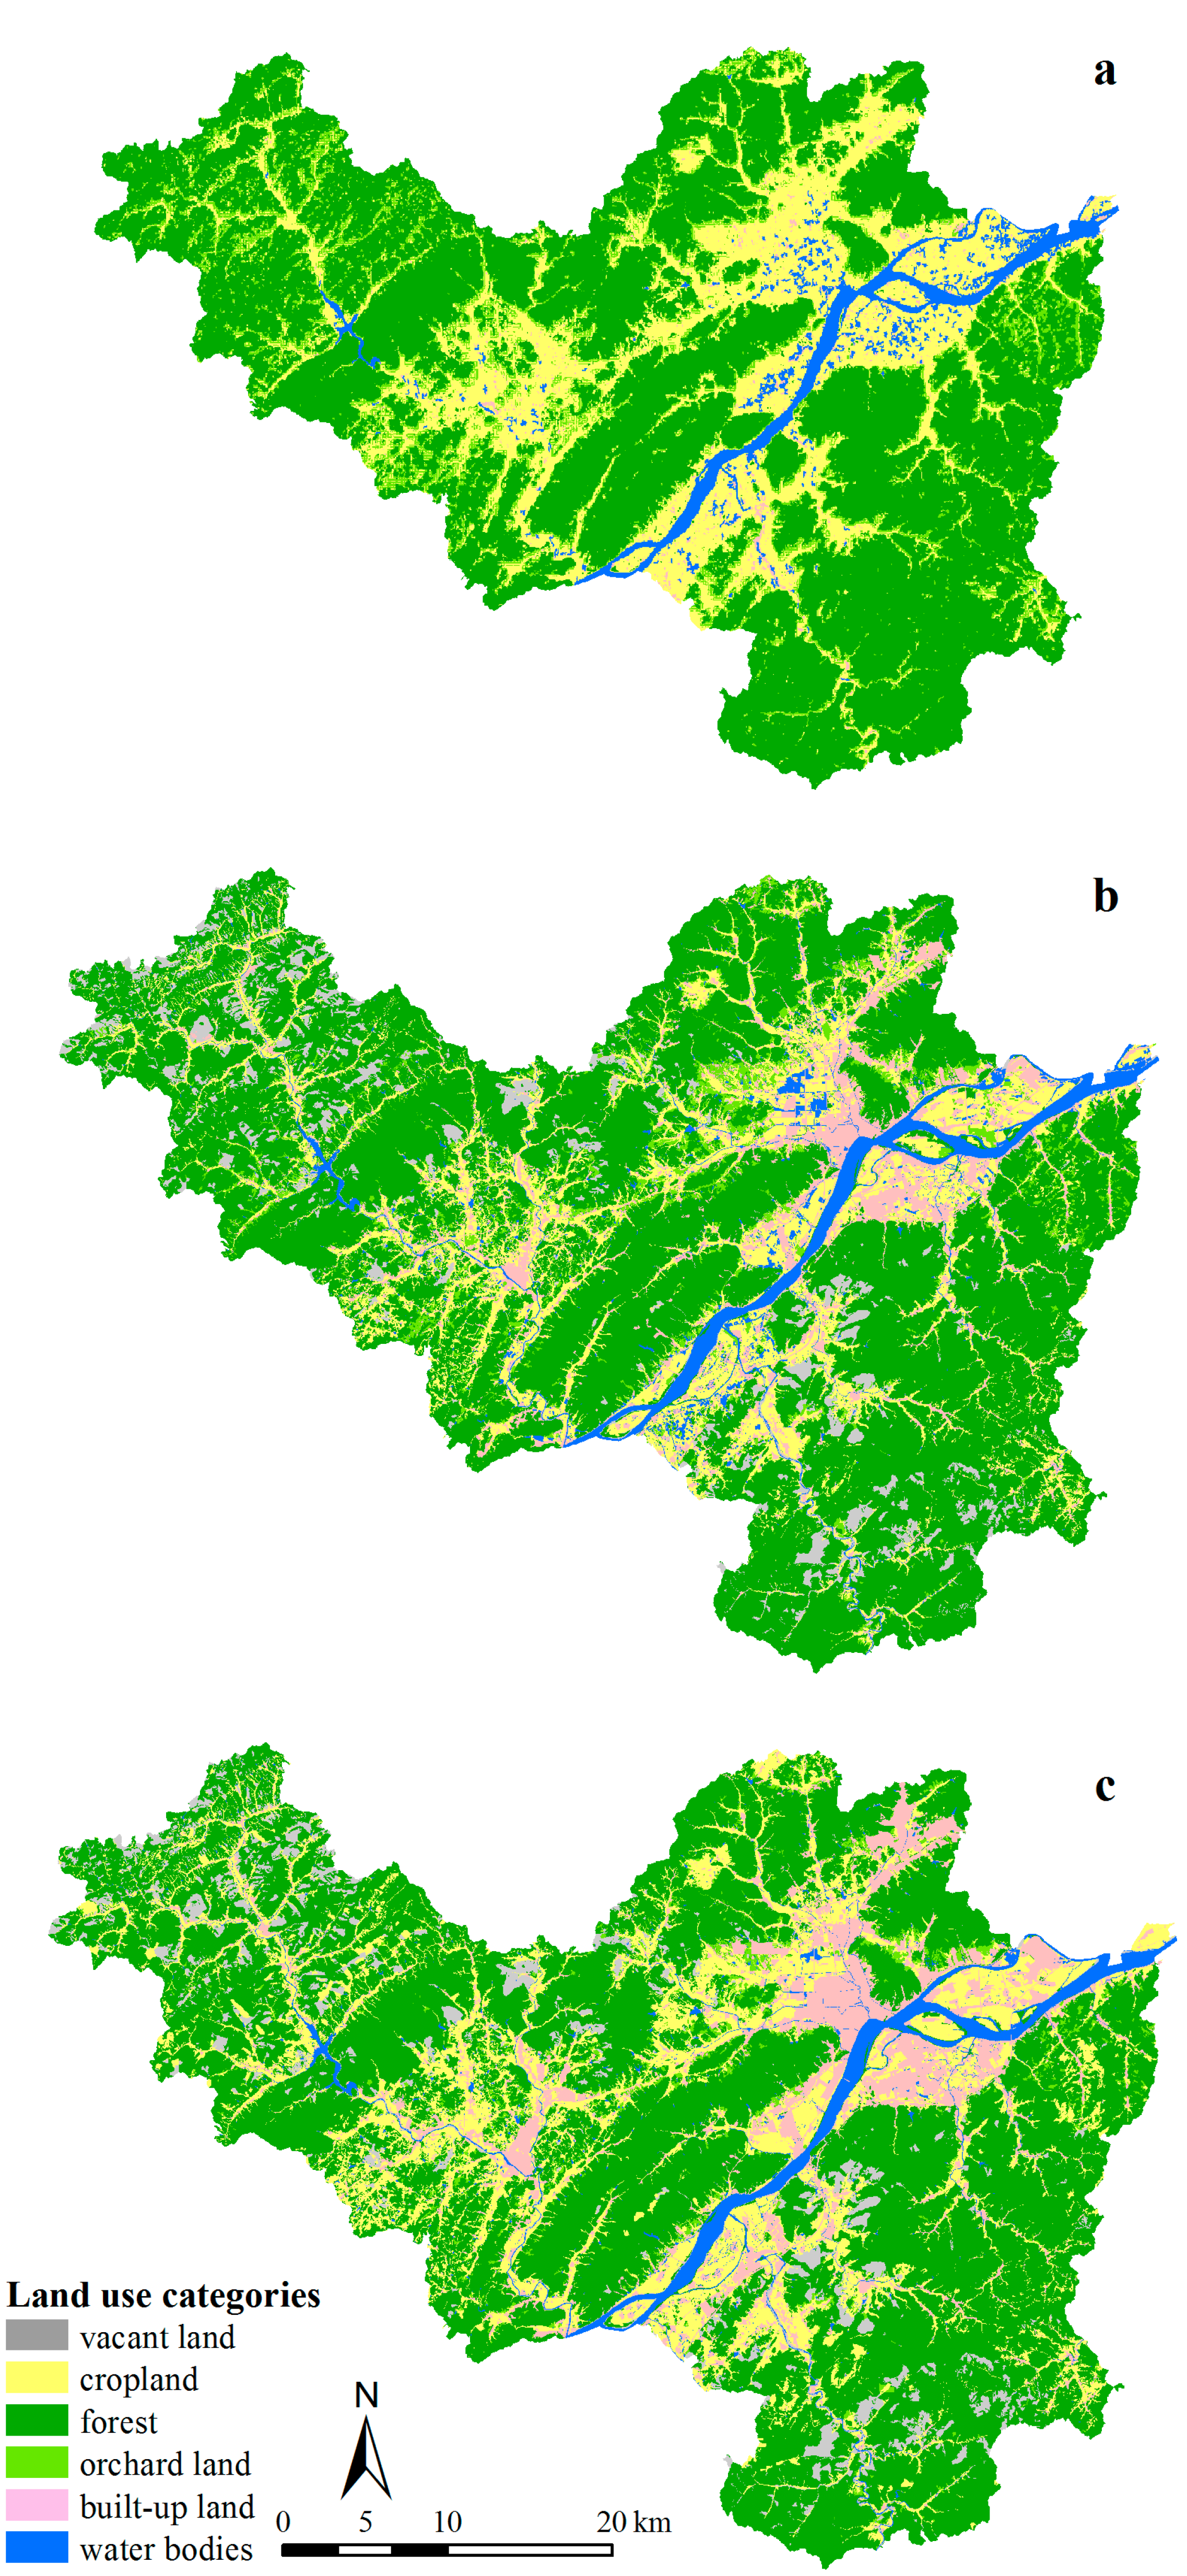
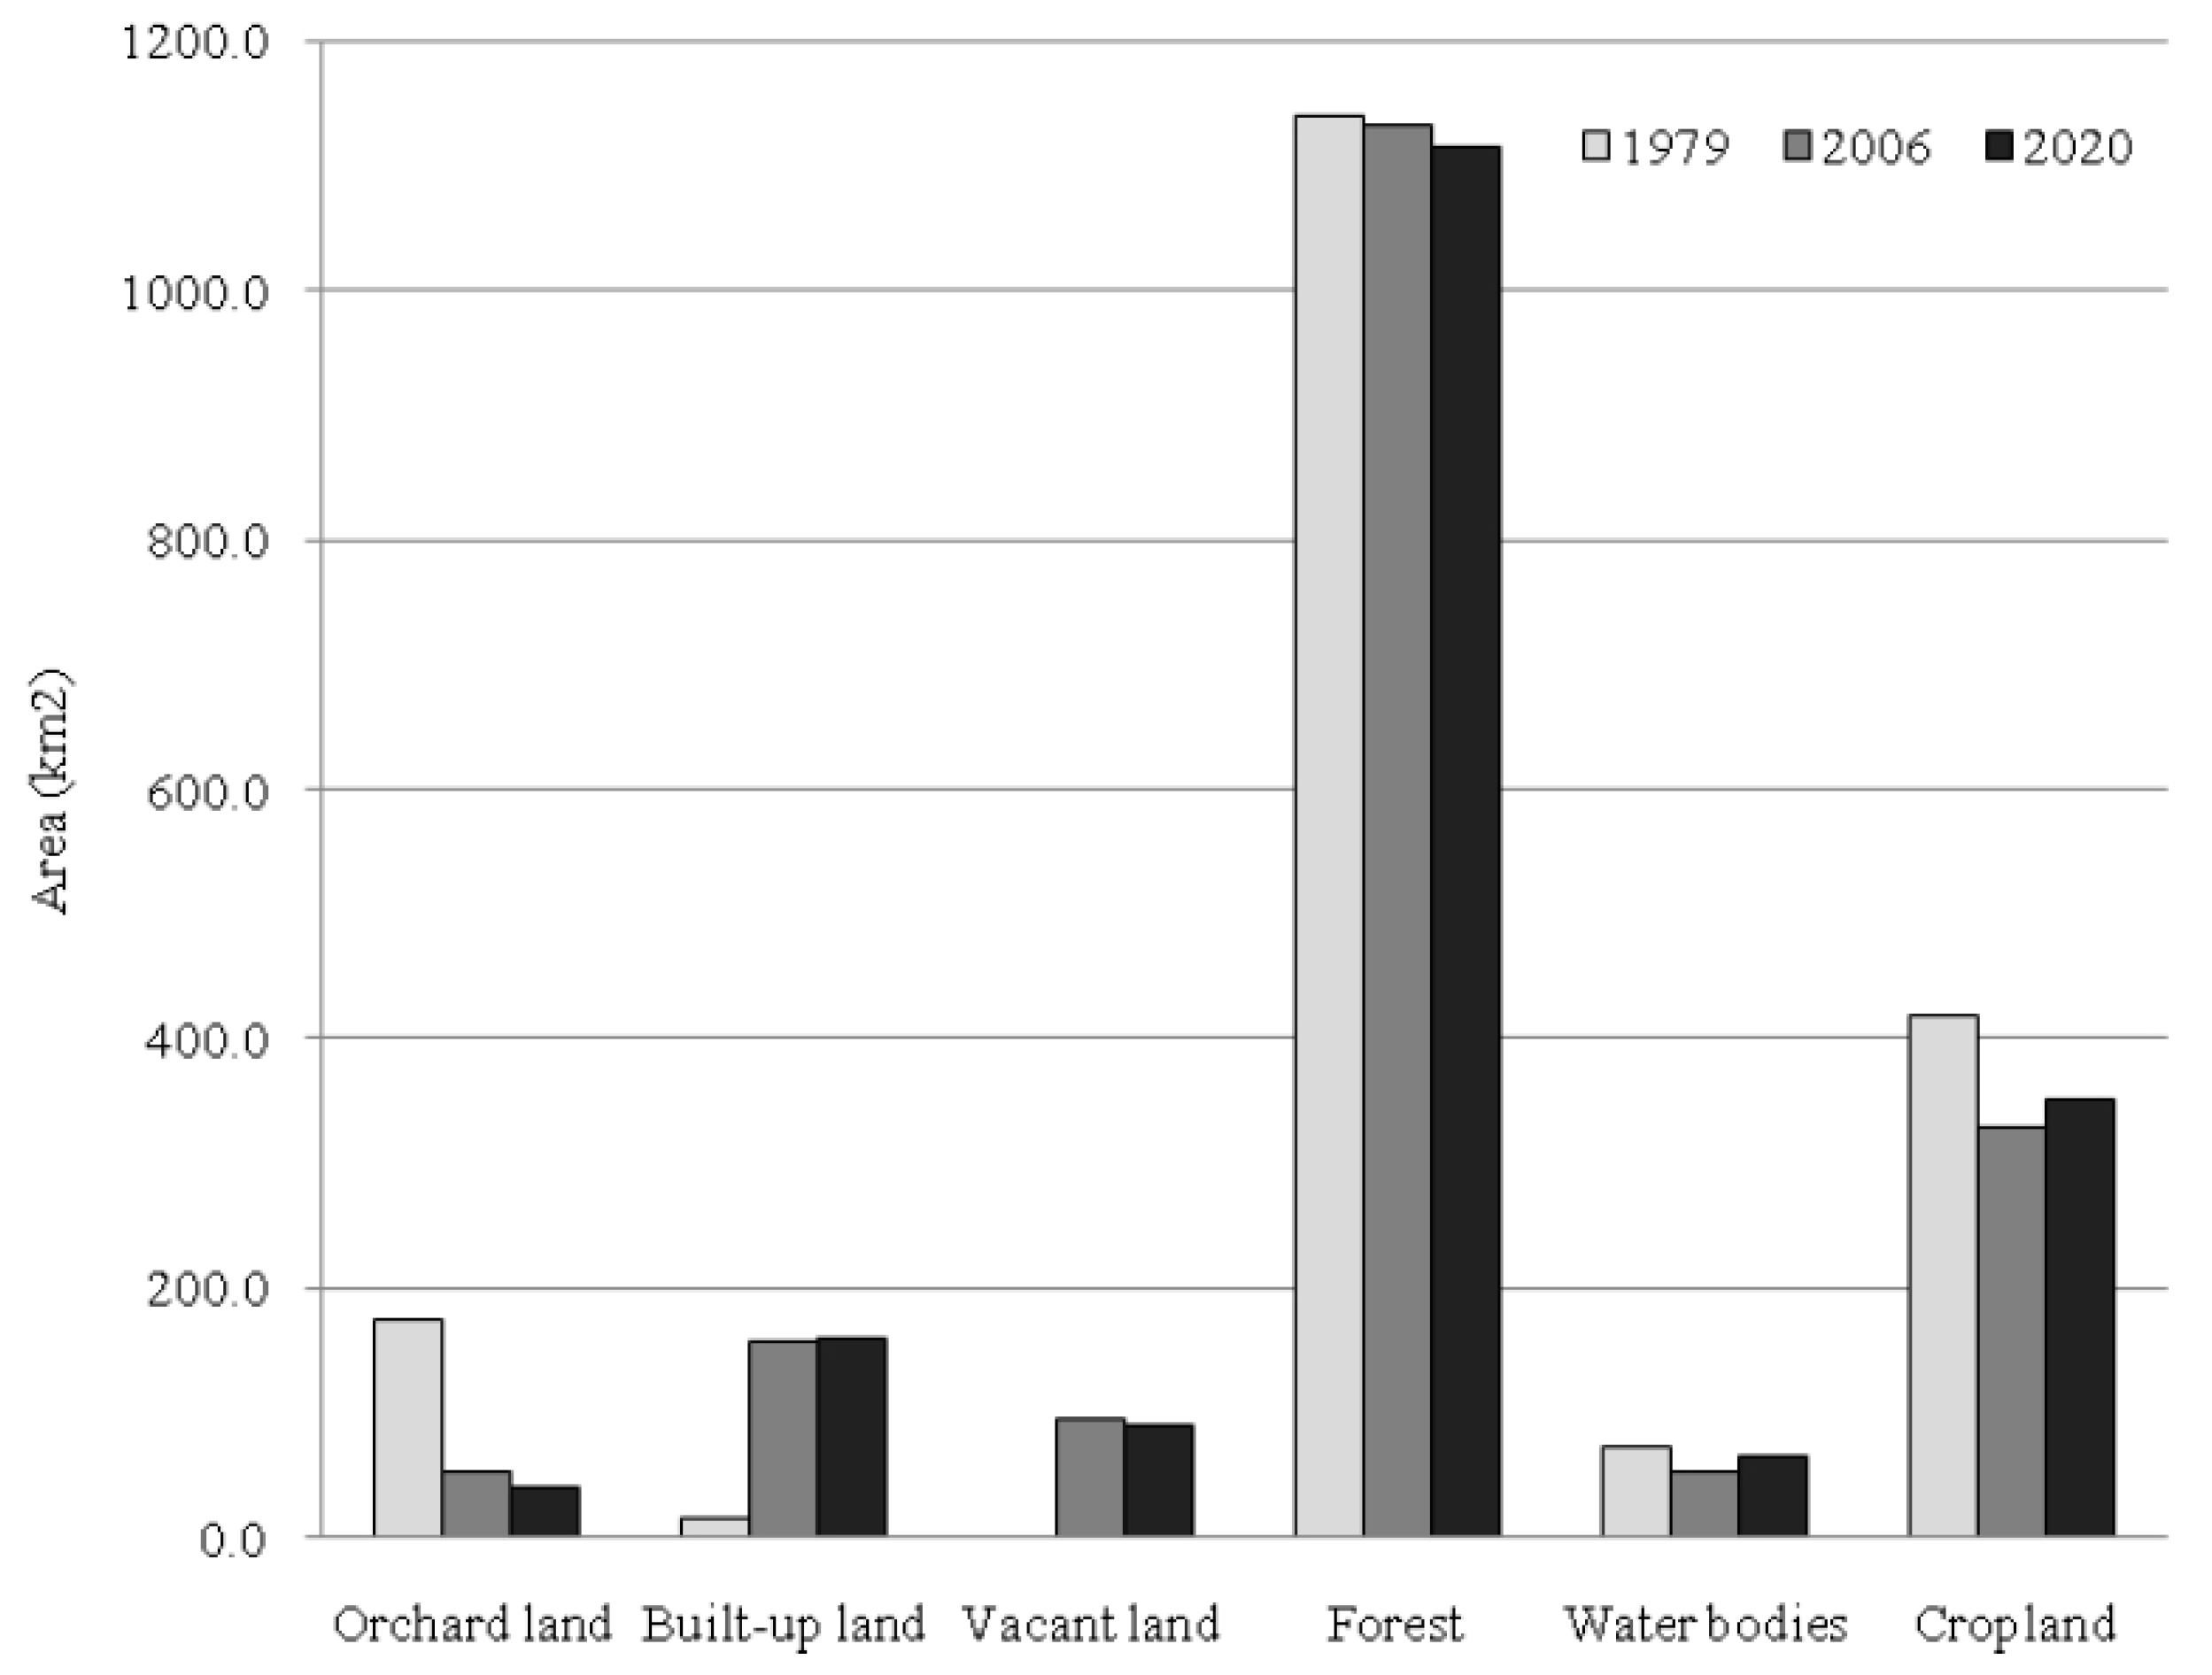
3.1. Land Use Changes in Fuyang between 1979 and 2006

During the past 30 years, forest was always a predominant land use type in Fuyang, despite that its area slightly decreased 0.6% (from 1140.7 km2 in 1979 to 1133.4 km2 in 2006) (Figure 3). Besides, the cropland area dramatically decreased by 21.1%, from 417.8 km2 in 1979 to 329.8 km2 in 2006. In contrast, built-up land area demonstrated the biggest increase, from 15.8 km2 in 1979 to 157.4 km2 in 2006 (10 times that in 1979), whereas orchard area experienced a significant decrease of 69.8%, from 174.1 km2 in 1979 to 52.6 km2 in 2006. Vacant land area was not compared here due to lack of data in 1979, nor was water body area involved in this research.
Figure 3. Land use changes in Fuyang County for 1979, 2006 and 2020.
Sustainability 08 00038 g003
The area affected by LUCs in Fuyang was 614.37 km2, representing 33.7% of the total study area (Table 2). In detail, major changes include the conversion from cropland to built-up land (105.8 km2, 25.3% of cropland areas in 1979); from orchard land to forest areas (90.3 km2, 51.9% of orchard land areas in 1979) and from cropland to forest areas (78.4 km2, 18.8% of cropland areas in 1979). Other significant changes were those converted from forest to cropland (66.8 km2, 5.9% of forest areas in 1979), from orchard land to cropland areas (45.0 km2, 25.8% of orchard land areas in 1979) and from forest to vacant land areas (74.6 km2, 6.5% of forest areas in 1979), respectively.
Table 2. Land use changes (km2) in Fuyang County for the period 1979–2006. See Table 1 for details on the six land use categories considered.
Land Use Classes (1979)Land Use Classes (2006)Total Area (1979, km2)Area Ratio (1979, %)
123456
14.31.50.60.68.00.815.80.9
218.5960.217.874.666.82.91140.762.6
316.690.311.98.945.01.4174.19.6
5105.878.421.69.5192.610.0417.822.9
612.42.70.61.517.737.872.74.0
Total Area (2006, km2)157.51133.152.695.1330.052.81821.2100.0
Area ratio (2006, %)8.662.22.95.218.12.9100.0-

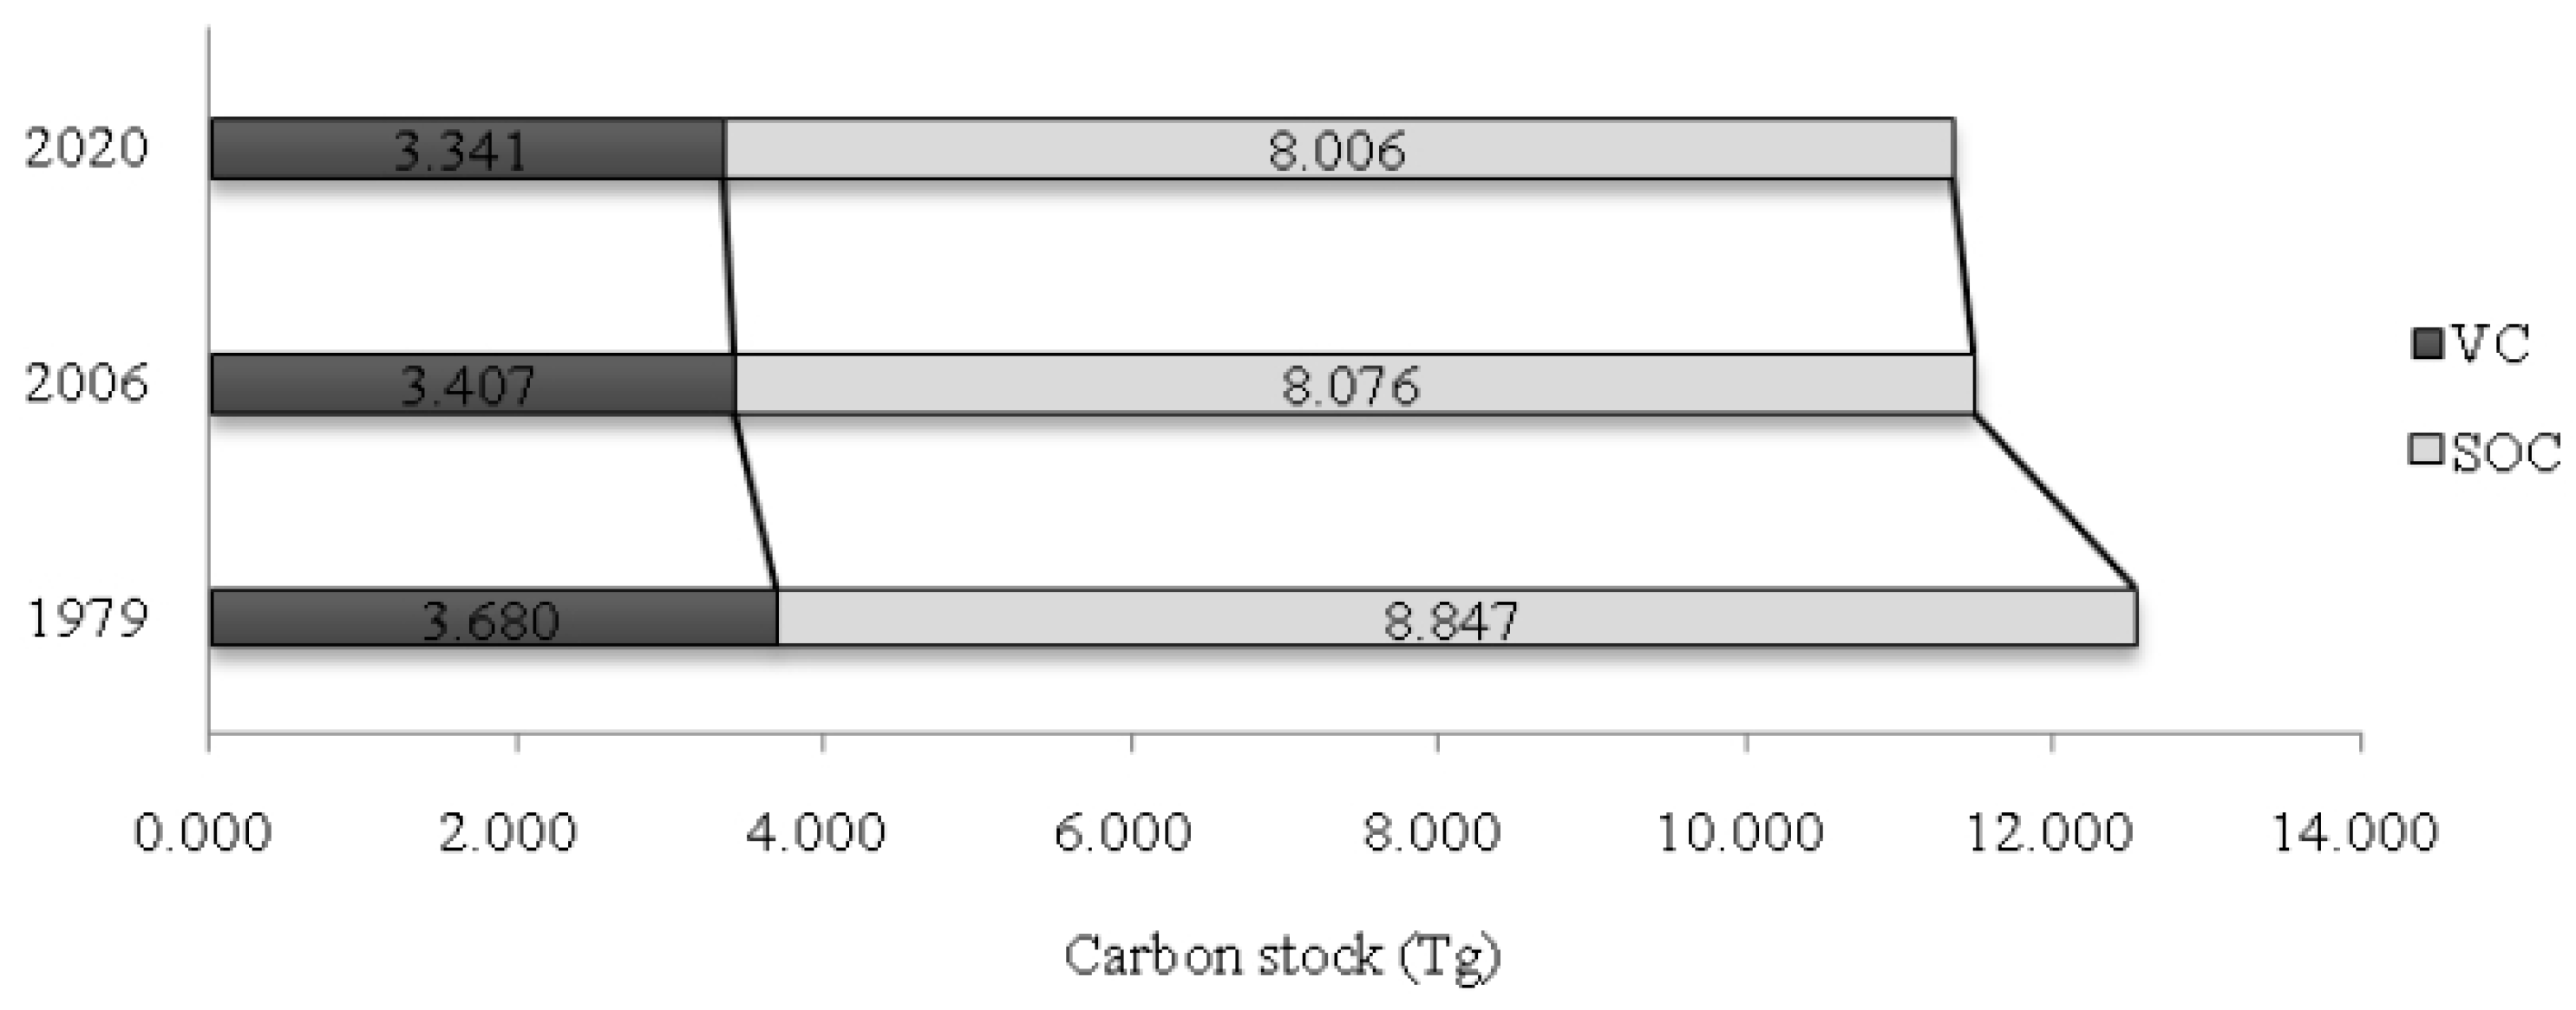
3.2. Carbon Stock Changes in Fuyang between 1979 and 2006

The variation with VC stocks between 1979 and 2006 is shown in Figure 4. The total VC stocks estimated in Fuyang were 3.680 Tg in 1979 and 3.407 Tg in 2006. In the same period, LUCs generated a VC decrease of 273.44 Gg which translated into source of 55.61 × 10⁻³ Mg C ha−1year−1. In contrast, afforestation contributed to a VC sequestration of 285.7 Gg (Table 3), while deforestation between 1979 and 2006 resulted in the biggest loss of 442.0 Gg VC. Other changes relating to cropland, vacant land and built-up land also caused C loss of 230.1, 218.5 and 118.5 Gg C from vegetation, respectively.
Figure 4. VC and SOC stock in Fuyang County for 1979, 2006 and 2020.
Sustainability 08 00038 g004
Table 3. Carbon sinks and sources (Gg) according to land use changes for the period 1979–2006. See Table 1 for details on the six land use categories considered.
FromToTotal (1979)
123456
10.0 * (0.0) **4.3 (8.4)1.2 (2.7)0.1 (1.0)2.6 (34.0)0.0 (0.0)8.2 (46.1)
2−52.1 (−102.9)0.0 (0.0)−15.6 (−23.5)−200.4 (−290.1)−165.9 (−87.3)−8.0 (−15.9)−442.0 (−519.6)
3−32.1 (−70.2)78.9 (119.1)0.0 (0.0)−16.1 (−22.9)−72.5 (0.5)−2.8 (−6.0)−44.7 (20.5)
5−34.4 (−449.0)195.0 (102.6)34.8 (−0.2)−1.9 (−24.7)0.0 (0.0)−3.2 (−42.3)190.2 (−413.6)
60.0 (0.0)7.7 (15.1)1.2 (2.7)0.2 (2.5)5.8 (75.3)0.0(0.0)14.8 (95.5)
Total (2006)−118.5 (−622.0)285.7 (245.2)21.7 (−18.3)−218.2 (−334.2)−230.1 (22.4)−14.0 (−64.2)−273.4 (−771.0)
Note: *: VC; **: SOC.
As regards C stock at a depth of 0–20 cm soil, it is larger than VC in the study area (Figure 4). The total quantity of C at the depth of 0–20 cm soil in Fuyang was estimated to be 8.847 Tg in 1979 and 8.076 Tg in 2006. Nevertheless, LUCs within this period also caused a SOC decrease of 771.01 Gg (156.81 × 10⁻³ Mg C ha−1year−1, 8.7% of SOC stock in 1979). Likewise, built-up land expansion resulted in a total C loss of 622.0 Gg in the soil between 1979 and 2006 (Table 3). Moreover, the transformation from both forests and cropland to built-up land caused C loss of 102.9 Gg and 449.0 Gg, respectively, despite the fact that afforestation contributed to a SOC sequestration of 245.2 Gg.

3.3. Future Land-Use Change and Carbon Sequestration

In accordance with the FLUMP (2006–2020), the overall VC and organic C at a depth of 0–20 cm soil stock for the Fuyang County are estimated approximately at 3.341 Tg in 2006 and 8.006 Tg in 2020 (Figure 4), respectively. This equals to a potential C loss of 25.93 × 10⁻³ Mg C ha−1year−1 for vegetation, and 27.48 × 10⁻³ Mg C ha−1year−1 for soil during this period. In addition, forest is the land use type that contributes to most of the fall of C stocks owing to an reduction of its area of 17.6 km2 (1.6% of forest areas in 2006) (Figure 3, Table 4). Nevertheless, cropland increases the C stocks as a result of an expansion of its area of 20.0 km2 (6.1% of cropland areas in 2006).
Table 4. Land use changes (km2) in Fuyang County for the period 2006–2020. See Table 1 for details on the six land use categories considered.
Land Use Classes (2006)Land Use Classes (2020)Total Area (2006, km2)Area Ratio (2006, %)
123456
1131.58.61.0-16.3-157.48.6
22.91107.3--23.3-1133.562.2
35.9-40-6.7-52.62.9
40.4--90.24.5-95.15.2
518.7---298.912.1329.718.1
60.1---0.152.652.82.9
Total Area (2020, km2)159.51115.941.090.2349.864.71821.2100.0
Area ratio (2020, %)8.861.32.35.019.23.6100.0-

4. Discussion

4.1. Land Use Changes and Soil Carbon Stocks

Many studies suggest that LUCs have a significant effect on soil C stock dynamics, since land use types differ in the amount of C stored in soil and vegetation and also in the potential rate of C content change [4,27,42]. According to this research, land use in Fuyang County has undergone intense changes in the past decades, manifesting important consequences for both VC and SOC sequestration. Previous studies have reported the VC sequestration rate of 0.64 Mg C ha−1year−1 in Xiamen, China [14] and the loss rate of 1.2 Mg C ha−1year−1 in Seattle, USA [15]; and the SOC sequestration rate of 6 × 10⁻³ Mg C ha−1year−1 in Wujiang, China [43] and the loss rate of 8 × 10⁻³ Mg C ha−1year−1 in Murcia, Spain [44]. In comparison with their findings, our research findings in Fuyang demonstrated that the VC rate of loss (55.61 × 10⁻³ Mg C ha−1year−1) between 1979 and 2006 was slow, but the SOC rate of loss (156.81 × 10⁻³ Mg C ha−1year−1) was fast.
Since the start of the economic reforms in 1978, there has been a massive transfer of land from agriculture to various construction developments in eastern China caused by rapid urban sprawl [45]. For instance, in 2008, the shift from cropland to construction land was as high as 191.6 km2 in China (0.16% of cropland areas in 2008) [46]. In Fuyang, the built-up land area in 1979 was 15.8 km2, whereas in 2006 it was up to 157.4 km2, about 10-fold higher than the previous figure. This exposes a growing tendency towards the depletion of ecosystems in urbanizing areas, where large plots of fertile land and vegetation cover have been increasingly replaced by impervious surfaces, resulting in both a loss of stored C and a reduction of potential future terrestrial C uptake by the land. Thus, such transformation has caused a tremendous decline in C stocks, with a SOC of 622.0 Gg and a VC of 118.5 Gg, respectively. This is due to the fact that 67.1% of the present county area attributed to urban expansion was originally cropland, and the cropland has higher SOC density than VC density; hence, the loss of SOC stocks has been much larger. Besides, according to the distribution map of C balance between 1979 and 2006 (Figure 5), those regions in which C storage declined steeply were almost always situated in the alluvial valley plain of Fuchun River and alongside its tributaries, where most of the crops are planted because of the flat terrain and access to water resources. Nevertheless, the dramatic sprawl of urbanization occurred and cropland was removed here, leading to an irreversible loss of C stocks.
Figure 5. C balance between 1979 and 2006.
Sustainability 08 00038 g005
Contrasting with the loss of C stock in the region, the process of afforestation proved to be a positive force in driving C stock change. Fang et al. [47] found substantial increases in C storage of China’s forests during the 1980s and 1990s due to national afforestation and reforestation programs. These afforestation programs in Fuyang have yielded significant growth of forest areas (Figure 3). Furthermore, most of the new forest areas were transformed from cropland and orchard land areas (Table 2). Overall, these land use types are relatively easy to transform into each other because the arable layer of soil is not destroyed. Again, since forests have the highest density of both VC and SOC among land use types (Table 1), C levels were increased through the afforestation process from 1979 to 2006, which almost compensated for the VC loss from the urbanization process. This has also explained the steady rate of VC stock (Figure 4), despite that land use types changed remarkably in the study area in the same period. Nevertheless, the compensation effect on SOC was limited because SOC stocks experienced a much larger loss than they did C sequestration by afforestation.

4.2. Carbon Balance in Land Use Planning

In order to promote and achieve coordinated development of the economy, society and environment, achieving more environmentally friendly economic growth must be a priority in the 12th Five-Year Plan in China. To meet this target, the incorporation of environmental concerns regarding carbon balance in the land use decision-making process is fundamental. This is because the conflict between development and the environment has already posed enormous challenges, as can be observed from two main trends of LUCs in the study area in accordance with the FLUMP (2006–2020) (Table 4). One trend is the increase of cropland area. The prominent position of agricultural production is in agreement with the demand for modern agricultural development according to the 12th Five-Year Plan in China. Additionally, most of the additional cropland areas will be taken as part of forest reclamation. The other trend is a further urbanization process as China continues on its development pathway. Thus, given that the built-up land area will increase slightly according to Table 4, areas of vacant land, most of which are in fact intermediate bare land available for construction, will decrease 5.2% of vacant land area in 2006. As a consequence, both SOC and VC storage in Fuyang County will experience significant loss by 2020 (Figure 4), which should be a concern for decision-makers. As the situation stands, further research is required to comprehensively examine the costs-benefit in relation to the C balance from FLUMP 2006–2020; hence, the overall net economic impacts on C stock loss can be measured.

4.3. Limitations

First, we assumed that the only change occurring in VC and SOC stocks was due to LUCs, while VC and SOC stocks were not receiving or losing C from those areas where land use types remained unchanged from 1979 to 2020. In reality, however, many land use types that have undergone natural succession or anthropogenic activities can experience long-term impacts in their soil C stock [48,49]. Therefore, more in-depth research is needed to assess the changing phases in VC and SOC stocks in those areas where land use types remain steady between 1979 and 2020, so that the methodology applied in this study can be improved. Second, our fieldwork concerning C density measurement for cropland was not extended to all other categories of soil, land, or vegetation cover in the study area, because the detailed fieldwork as such was constrained by the limited project budget and difficulties in conducting it at a large scale. Third, the accuracy and reliability of estimates of C stocks in the study area relied on the quality of land use maps of 1979, 2006 and 2020. However, the maps of 2006 and 2020 underwent official verification by the Ministry of Land and Resources of China, while the 1979 map was validated via complementary historical maps and records in the research.

5. Conclusions

This paper examined LUCs both historically from 1979 to 2006 and by making forecasts (2006–2012), and detected their effects on soil C stocks in a county-scale study area. The study is one of the first county-wide assessments of land use planning that fully accounted for the VC and SOC stock changes in China. Furthermore, the devised method made consistent use of available data at the scale of analysis and is easily applicable to other regions.
The LUCs in the Fuyang County between 1979 and 2006 were highly imperative, affecting 33.7% of the study area. Overall, these changes led to C loss of 273.44 Gg (approx. 55.61 × 10⁻³ Mg C ha−1year−1) in the vegetation and 771.01 Gg (approx. 156.81 × 10⁻³ Mg C ha−1year−1) at a depth of 0–20 cm in the soil. Moreover, the SOC loss rate was much faster than that of VC. Behind the scenes, urbanization and afforestation are two main LUC drivers which contributed to the soil C stock dynamics in Fuyang as a whole.
As indicated in the FLUMP (2006–2020), C loss rates are likely to accelerate (25.93 × 10⁻³ Mg C ha−1year−1 for vegetation and 27.48 × 10⁻³ Mg C ha−1year−1 for soil) from now onwards, mainly due to a further decrease in forest area and an increase in cropland, coupled with a continuous rise of pre-construction land areas attributed to modern agricultural development and further urbanization processes. Much evidence suggests that significant efforts should be made to reversing the current C loss situation and balance the C dynamics in land use planning.

Supplementary Materials

The following are available online at www.mdpi.com/2071-1050/8/1/38/s1, Table S1: Details of Carbon Calculations for the C Stocks in Vegetation; Table S2: Details of Carbon Calculations for the C Stocks in Soil.

Acknowledgments

This study was financially supported by National Natural Science Foundation of China (No. 41401595) and National Science and Technology Support Program (No. 2015BAL02B03).

Author Contributions

Study design: Lefeng Qiu; Literature research: Lefeng Qiu, Ke Wang; Data acquisition: Ke Wang and Wei Hu; Data analysis: Lefeng Qiu and Jinxia Zhu; Manuscript preparation: Lefeng Qiu and Jinxia Zhu; Manuscript revision/review: Lefeng Qiu and Wei Hu.

Conflicts of Interest

The authors declare no conflict of interest.

References

  1. Celik, I. Land-use effects on organic matter and physical properties of soil in a southern mediterranean highland of turkey. Soil Tillage Res. 2005, 83, 270–277. [Google Scholar] [CrossRef]
  2. Lax, A.; Diaz, E.; Castillo, V.; Albaladejo, J. Reclamation of physical and chemical properties of a salinized soil by organic amendment. Arid Soil Res. Rehabil. 1994, 8, 9–17. [Google Scholar] [CrossRef]
  3. Freibauer, A.; Rounsevell, M.D.A.; Smith, P.; Verhagen, J. Carbon sequestration in the agricultural soils of europe. Geoderma 2004, 122, 1–23. [Google Scholar] [CrossRef]
  4. Ostle, N.J.; Levy, P.E.; Evans, C.D.; Smith, P. UK land use and soil carbon sequestration. Land Use Policy 2009, 26, S274–S283. [Google Scholar] [CrossRef]
  5. Li, P.; Wang, Q.; Endo, T.; Zhao, X.; Kakubari, Y. Soil organic carbon stock is closely related to aboveground vegetation properties in cold-temperate mountainous forests. Geoderma 2010, 154, 407–415. [Google Scholar] [CrossRef]
  6. Mishra, U.; Ussiri, D.A.N.; Lal, R. Tillage effects on soil organic carbon storage and dynamics in Corn Belt of Ohio USA. Soil Tillage Res. 2010, 107, 88–96. [Google Scholar] [CrossRef]
  7. Xu, S.; Shi, X.; Zhao, Y.; Yu, D.; Li, C.; Wang, S.; Tan, M.; Sun, W. Carbon sequestration potential of recommended management practices for paddy soils of China, 1980–2050. Geoderma 2011, 166, 206–213. [Google Scholar] [CrossRef]
  8. Liu, Y.; Yu, D.; Wang, N.; Shi, X.; Warner, E.D.; Zhang, H.; Qin, F. Impacts of agricultural intensity on soil organic carbon pools in a main vegetable cultivation region of China. Soil Tillage Res. 2013, 134, 25–32. [Google Scholar] [CrossRef]
  9. Tesfaye, M.A.; Bravo, F.; Ruiz-Peinado, R.; Pando, V.; Bravo-Oviedo, A. Impact of changes in land use, species and elevation on soil organic carbon and total nitrogen in ethiopian central highlands. Geoderma 2016, 261, 70–79. [Google Scholar] [CrossRef]
  10. Winowiecki, L.; Vågen, T.G.; Huising, J. Effects of land cover on ecosystem services in tanzania: A spatial assessment of soil organic carbon. Geoderma 2016, 263, 274–283. [Google Scholar] [CrossRef]
  11. Schulp, C.J.E.; Nabuurs, G.J.; Verburg, P.H. Future carbon sequestration in europe-effects of land use change. Agric. Ecosyst. Environ. 2008, 127, 251–264. [Google Scholar] [CrossRef]
  12. Zaehle, S.; Bondeau, A.; Carter, T.R.; Cramer, W.; Erhard, M.; Prentice, I.C.; Reginster, I.; Rounsevell, M.D.A.; Sitch, S.; Smith, B.; et al. Projected changes in terrestrial carbon storage in europe under climate and land-use change, 1990–2100. Ecosystems 2007, 10, 380–401. [Google Scholar] [CrossRef]
  13. Batlle-Bayer, L.; Batjes, N.H.; Bindraban, P.S. Changes in organic carbon stocks upon land use conversion in the brazilian cerrado: A review. Agric. Ecosyst. Environ. 2010, 137, 47–58. [Google Scholar] [CrossRef]
  14. Ren, Y.; Wei, X.; Wei, X.; Pan, J.; Xie, P.; Song, X.; Peng, D.; Zhao, J. Relationship between vegetation carbon storage and urbanization: A case study of Xiamen, China. For. Ecol. Manag. 2011, 261, 1214–1223. [Google Scholar] [CrossRef]
  15. Hutyra, L.R.; Yoon, B.; Hepinstall-Cymerman, J.; Alberti, M. Carbon consequences of land cover change and expansion of urban lands: A case study in the seattle metropolitan region. Landsc. Urban Plan. 2011, 103, 83–93. [Google Scholar] [CrossRef]
  16. Rui, W.; Zhang, W. Effect size and duration of recommended management practices on carbon sequestration in paddy field in Yangtze Delta Plain of China: A meta-analysis. Agric. Ecosyst. Environ. 2010, 135, 199–205. [Google Scholar] [CrossRef]
  17. Fang, X.; Xue, Z.; Li, B.; An, S. Soil organic carbon distribution in relation to land use and its storage in a small watershed of the Loess Plateau, China. Catena 2012, 88, 6–13. [Google Scholar] [CrossRef]
  18. Fu, X.; Shao, M.; Wei, X.; Horton, R. Soil organic carbon and total nitrogen as affected by vegetation types in northern Loess Plateau of China. Geoderma 2010, 155, 31–35. [Google Scholar] [CrossRef]
  19. Kong, X.; Dao, T.H.; Qin, J.; Qin, H.; Li, C.; Zhang, F. Effects of soil texture and land use interactions on organic carbon in soils in north China cities’ urban fringe. Geoderma 2009, 154, 86–92. [Google Scholar] [CrossRef]
  20. Wang, S.; Chen, J.M.; Ju, W.M.; Feng, X.; Chen, M.; Chen, P.; Yu, G. Carbon sinks and sources in China’s forests during 1901–2001. J. Environ. Manag. 2007, 85, 524–537. [Google Scholar] [CrossRef] [PubMed]
  21. He, N.; Yu, Q.; Wu, L.; Wang, Y.; Han, X. Carbon and nitrogen store and storage potential as affected by land-use in a Leymus chinensis grassland of northern China. Soil Biol. Biochem. 2008, 40, 2952–2959. [Google Scholar] [CrossRef]
  22. Tao, T.; Tan, Z.; He, X. Integrating environment into land-use planning through strategic environmental assessment in China: Towards legal frameworks and operational procedures. Environ. Impact Assess. Rev. 2007, 27, 243–265. [Google Scholar] [CrossRef]
  23. Ministry of Land and Resources of China. Land use master planning of Zhejiang province. Available online: http://www.mlr.gov.cn/tdsc/tdgh/201011/t20101102_791712.htm (accessed on 31 December 2015).
  24. Qiu, L.F.; Zhu, J.X.; Zhu, Y.H.; Hong, Y.; Wang, K.; Deng, J.S. Land use changes induced soil organic carbon variations in agricultural soils of Fuyang County, China. J. Soils Sediments 2013, 13, 981–988. [Google Scholar] [CrossRef]
  25. Ministry of Land and Resources of China. The key data results of the second national land survey in Zhejiang province. Available online: http://www.mlr.gov.cn/tdzt/tdgl/decdc/dccg/gscg/201407/t20140724_1324788.htm (accessed on 31 December 2015).
  26. Cantarello, E.; Newton, A.C.; Hill, R.A. Potential effects of future land-use change on regional carbon stocks in the UK. Environ. Sci. Policy 2011, 14, 40–52. [Google Scholar] [CrossRef]
  27. Munoz-Rojas, M.; de la Rosa, D.; Zavala, L.M.; Jordan, A.; Anaya-Romero, M. Changes in land cover and vegetation carbon stocks in Andalusia, Southern Spain (1956–2007). Sci. Total Environ. 2011, 409, 2796–2806. [Google Scholar] [CrossRef] [PubMed]
  28. Walkley, A.; Black, I.A. An examination of the degtjareff method for determining soil organic matter, and a proposed modification of the chromic acid titration method. Soil Sci. 1934, 37, 29–38. [Google Scholar] [CrossRef]
  29. Schwager, S.J.; Mikhailova, E.A. Estimating variability in soil organic carbon storage using the method of statistical differentials. Soil Sci. 2002, 167, 194–200. [Google Scholar] [CrossRef]
  30. Pan, Y.D.; Luo, T.X.; Birdsey, R.; Hom, J.; Melillo, J. New estimates of carbon storage and sequestration in China’s forests: Effects of age-class and method on inventory-based carbon estimation. Clim. Chang. 2004, 67, 211–236. [Google Scholar] [CrossRef]
  31. Li, Z.C. The effects of land-use change on the soil organic carbon. Ph.D. Thesis, Chinese Academy of Forestry, Beijing, China, 2006. [Google Scholar]
  32. Li, Z.C.; Xu, D.Y.; Fu, M.y.; Sun, X.Z.; Xi, J.R. Effects of land-use change on vertical distribution and storage of soil organic carbon in north subtropical areas. For. Res. 2007, 20, 744–749. (In Chinese) [Google Scholar]
  33. Li, S.; Wu, X.; Xue, H.; Gu, B.; Cheng, H.; Zeng, J.; Peng, C.; Ge, Y.; Chang, J. Quantifying carbon storage for tea plantations in China. Agric. Ecosyst. Environ. 2011, 141, 390–398. [Google Scholar] [CrossRef]
  34. Gao, Z.Q.; Fu, M.Y. Characteristics of seasonal changes in soil carbon and nitrogen nutrients of different phyllostachys pubescens stands. J. Zhejiang For. Coll. 2006, 23, 248–254. (In Chinese) [Google Scholar]
  35. Li, K.R.; Wang, S.Q.; Cai, M.K. Vegetation and soil carbon storage in China. Sci. China Ser. D 2003, 33, 72–80. (In Chinese) [Google Scholar] [CrossRef]
  36. Li, S.Y. Carbon balance of tea plantation ecosystem in China. Ph.D. Thesis, Zhejiang University, Hangzhou, China, 2010. [Google Scholar]
  37. Wang, S.Q.; Zhou, C.H.; Luo, C.W. Studying carbon storage spatial distribution of terrestrial natural vegetation in China. Prog. Geogr. 1999, 18, 238–244. (In Chinese) [Google Scholar]
  38. Jiang, Q.O.; Deng, X.Z.; Zhang, J.Y.; Liu, X.Q. Impacts of cultivated land conversion on the vegetation carbon storage in the Huang-Huai-Hai Plain. Geogr. Res. 2008, 27, 839–846. (In Chinese) [Google Scholar]
  39. Peng, X.H.; Zhang, B.; Zhao, Q.G. Effect of soil organic carbon on aggregates stability after vegetative restoration on severely eroded red soil. Acta Ecol. Sin. 2003, 23, 2176–2183. (In Chinese) [Google Scholar]
  40. Liu, S.Z.; Guo, S.L.; Wang, X.L.; Xue, B.M. Effect of vegetation on soil organic carbon of slope land in gully region of Loess Plateau. J. Natl. Resour. 2005, 20, 529–536. (In Chinese) [Google Scholar]
  41. Li, Z.P. Density of soil organic carbon pool and its variation in hilly red soil region. Soils 2004, 36, 292–297. (In Chinese) [Google Scholar]
  42. Bellamy, P.H.; Loveland, P.J.; Bradley, R.I.; Lark, R.M.; Kirk, G.J.D. Carbon losses from all soils across England and Wales 1978–2003. Nature 2005, 437, 245–248. [Google Scholar] [CrossRef] [PubMed] [Green Version]
  43. Gao, J.; Pan, G.; Jiang, X.; Pan, J.; Zhuang, D. Land-use induced changes in topsoil organic carbon stock of paddy fields using MODIS and TM/ETM analysis: A case study of Wujiang County, China. J. Environ. Sci. 2008, 20, 852–858. [Google Scholar] [CrossRef]
  44. Boix-Fayos, C.; de Vente, J.; Albaladejo, J.; Martínez-Mena, M. Soil carbon erosion and stock as affected by land use changes at the catchment scale in mediterranean ecosystems. Agric. Ecosyst. Environ. 2009, 133, 75–85. [Google Scholar] [CrossRef]
  45. Yang, H. Land conservation campaign in China: Integrated management, local participation and food supply option. Geoforum 2004, 35, 507–518. [Google Scholar] [CrossRef]
  46. Ministry of Land and Resources of China. Land Resources Bulletin 2008. Available online: http://www.mlr.gov.cn/zwgk/tjxx/200912/t20091215_699769.htm (accessed on 30 December 2015).
  47. Fang, J.; Chen, A.; Peng, C.; Zhao, S.; Ci, L. Changes in forest biomass carbon storage in China between 1949 and 1998. Science 2001, 292, 2320–2322. [Google Scholar] [CrossRef] [PubMed]
  48. Eynard, A.; Schumacher, T.E.; Lindstrom, M.J.; Malo, D.D. Effects of agricultural management systems on soil organic carbon in aggregates of Ustolls and Usterts. Soil Tillage Res. 2005, 81, 253–263. [Google Scholar] [CrossRef]
  49. Wagai, R.; Mayer, L.M.; Kitayama, K.; Knicker, H. Climate and parent material controls on organic matter storage in surface soils: A three-pool, density-separation approach. Geoderma 2008, 147, 23–33. [Google Scholar] [CrossRef]

