Article

The Optimization of Cyclic Links of Live Pig-Industry Chain Based on Circular Economics

1
School of Business, Central South University, Changsha 410079, China
2
School of Business, Hunan International Economics University, Changsha 410205, China
*
Author to whom correspondence should be addressed.
Sustainability 2016, 8(1), 26; https://doi.org/10.3390/su8010026
Submission received: 8 October 2015 / Revised: 19 December 2015 / Accepted: 21 December 2015 / Published: 28 December 2015

Abstract

:
To reduce waste and wastewater pollution and to improve the utilization rate of resources in the pig-industry chain, a circular economy of the chain can be developed. The key to constructing the circular economic system of the pig-industry chain is to determine the path of the cyclic materials and to design reasonable waste- and wastewater-treatment capacities. This paper focuses on the treatment and recycling of wastewater in the pig-industry chain and the treatment and recycling of waste into manure and feed. After giving the two circular paths, the paper proposes a multi-objective uncertainty-optimization model for the cyclic links of the pig-industry chain with the highest resource-reuse efficiency and the lowest construction cost based on the uncertainty of market demand. Using a combination of the neural network and genetic algorithm method for designing the solution process for the model, the paper finally introduces the determination methods of relevant parameters and verifies the feasibility and effectiveness of the model through a case study.

Graphical Abstract

1. Introduction

A circular economy [1], or a material cyclic flow-based economy, refers to an economy that relies on ecological resources. This type of economy is transformed from the traditional economy of linear growth, which relies on resource consumption in the entire process of resource investment, enterprise production, product consumption and waste disposal within the larger system of people, natural resources and science and technology. Its theoretical principles are elaborated in the “spaceship theory” [2] proposed by Kenneth Boulding in the 1960s. Since the 1990s, the implementation of sustainable development strategy, environmental protection, clean production, green consumption and waste regeneration and re-use have become gradually integrated into a circular economic strategy featuring resource cyclic utilization and the avoidance of waste generation. The concept of a circular economy has therefore been systematically introduced into Chinese academic circles [3,4].
In 2013, the “State Council’s Notice on Issuing the Circular Economy Development Strategy and Action Plan for the Near Future” formally initiated the concept of “cyclic links” [5] to encourage enterprises and industries to establish circular economic complexes of material flow, capital flow, and product links, to promote circular linking and symbiotic coupling among industry, agriculture and service industry, and to realize resource recycling across enterprises, industries, and regions. In the era of environmental protection, developing a green supply chain is a necessary requirement [6]. The combination of environmental protection and resource conservation greatly promotes the development of a green supply chain, which offers the basic principles of the cyclic economy [7,8,9].
China’s meat-consumption structure features a proportional relation of 64:19:9:6:2 for pork, poultry, beef, lamb, and other livestock meat, of which pork consumption accounts for the largest proportion. Its demand is large and persistent, and the breeding technology is relatively simple with relatively stable production. Therefore, the development of the pig-industry chain has been rapid. However, there is serious pollution in the live pig-industry chain. During the large-scale pig-breeding process, the manure, sewage, and noise produced from pigs and the sewage, dust, and odor produced from pig cleaning, breeding sites and utensils may cause cross-compound damage and destruction to the atmosphere, water, soil and organism layers, exerting an interactive influence on the pig-farming system and the ecological system. Determining how to solve the pollution problem generated in pig breeding and slaughtering to promote the economic prosperity of the pig industry while preserving the local ecological environment is an important issue for realizing sustainable pig-industry development [10,11]. A realistic and effective way is to develop a circular economy of the pig industry and to construct a circular economic development model that adapts to local conditions. Closely linked with animal husbandry is the upstream planting industry, both of which are two extremely important parts of agriculture. The two industries are mutually connected and promoted. On one hand, the planting industry provides essential feed for the development of animal husbandry, and it is regarded as the basis for the development of animal husbandry. On the other hand, the development of animal husbandry provides the fertilizer, motive and money needed for the development of the planting industry [12]. Therefore, the route from planting to pig breeding and then to pig slaughtering is the core route for the development of the circular pig economy. Mao Lairong (2009) noted that the development of animal husbandry under a circular economy is the best development mode for realizing a benign interaction between the economy and the environment and for the harmony of man and nature; moreover, it is the strategic choice for building a resource-saving and environmentally friendly society and for promoting sustainable development. He proposed three types of circular economic modes: ecological, infrastructural and environmental [13]. Zhang Ouxiang and Li Wei (2010) put forward sustainable circular economic development modes for animal husbandry suitable for different industrial belts of husbandry based on problems in the husbandry development of Anhui Province. They argued that the development of animal husbandry should follow scientific development and the “3R” principles; in practice, attention should be paid to the demonstration and promotion of typical patterns and the formation of industrial chains of circular economy while focusing on conventional problems of overall planning, rational layout, institutional strengthening and the cultivation of operational mechanisms [14]. In view of the development of the pig-industry chain, many related scholars studied this topic from two angles: the green supply chain and sustainable development [15,16,17]. Nevertheless, quantifiable solutions in sustainable development will be advanced through research for the present-day world [18,19].
It is obvious that most current research on circular economies is concerned with the exploration of relevant paths and is oriented toward technology. Less research has been conducted on specific applications of existing recycling technology in the construction of the circular economy system [20], and studies on the quantitative effect of market demand change on the construction of the circular economy system are rare [21]. This paper attempts to build a quantitative optimization model for the pig-industry chain link based on the uncertainty of market demand.

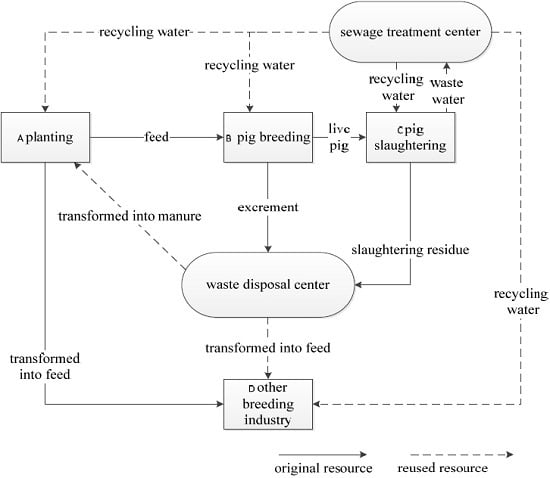
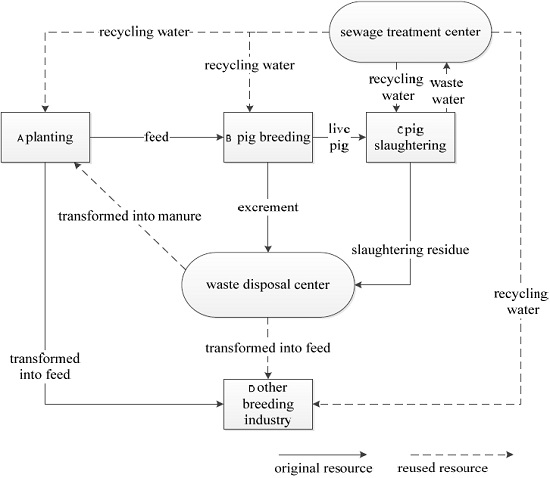
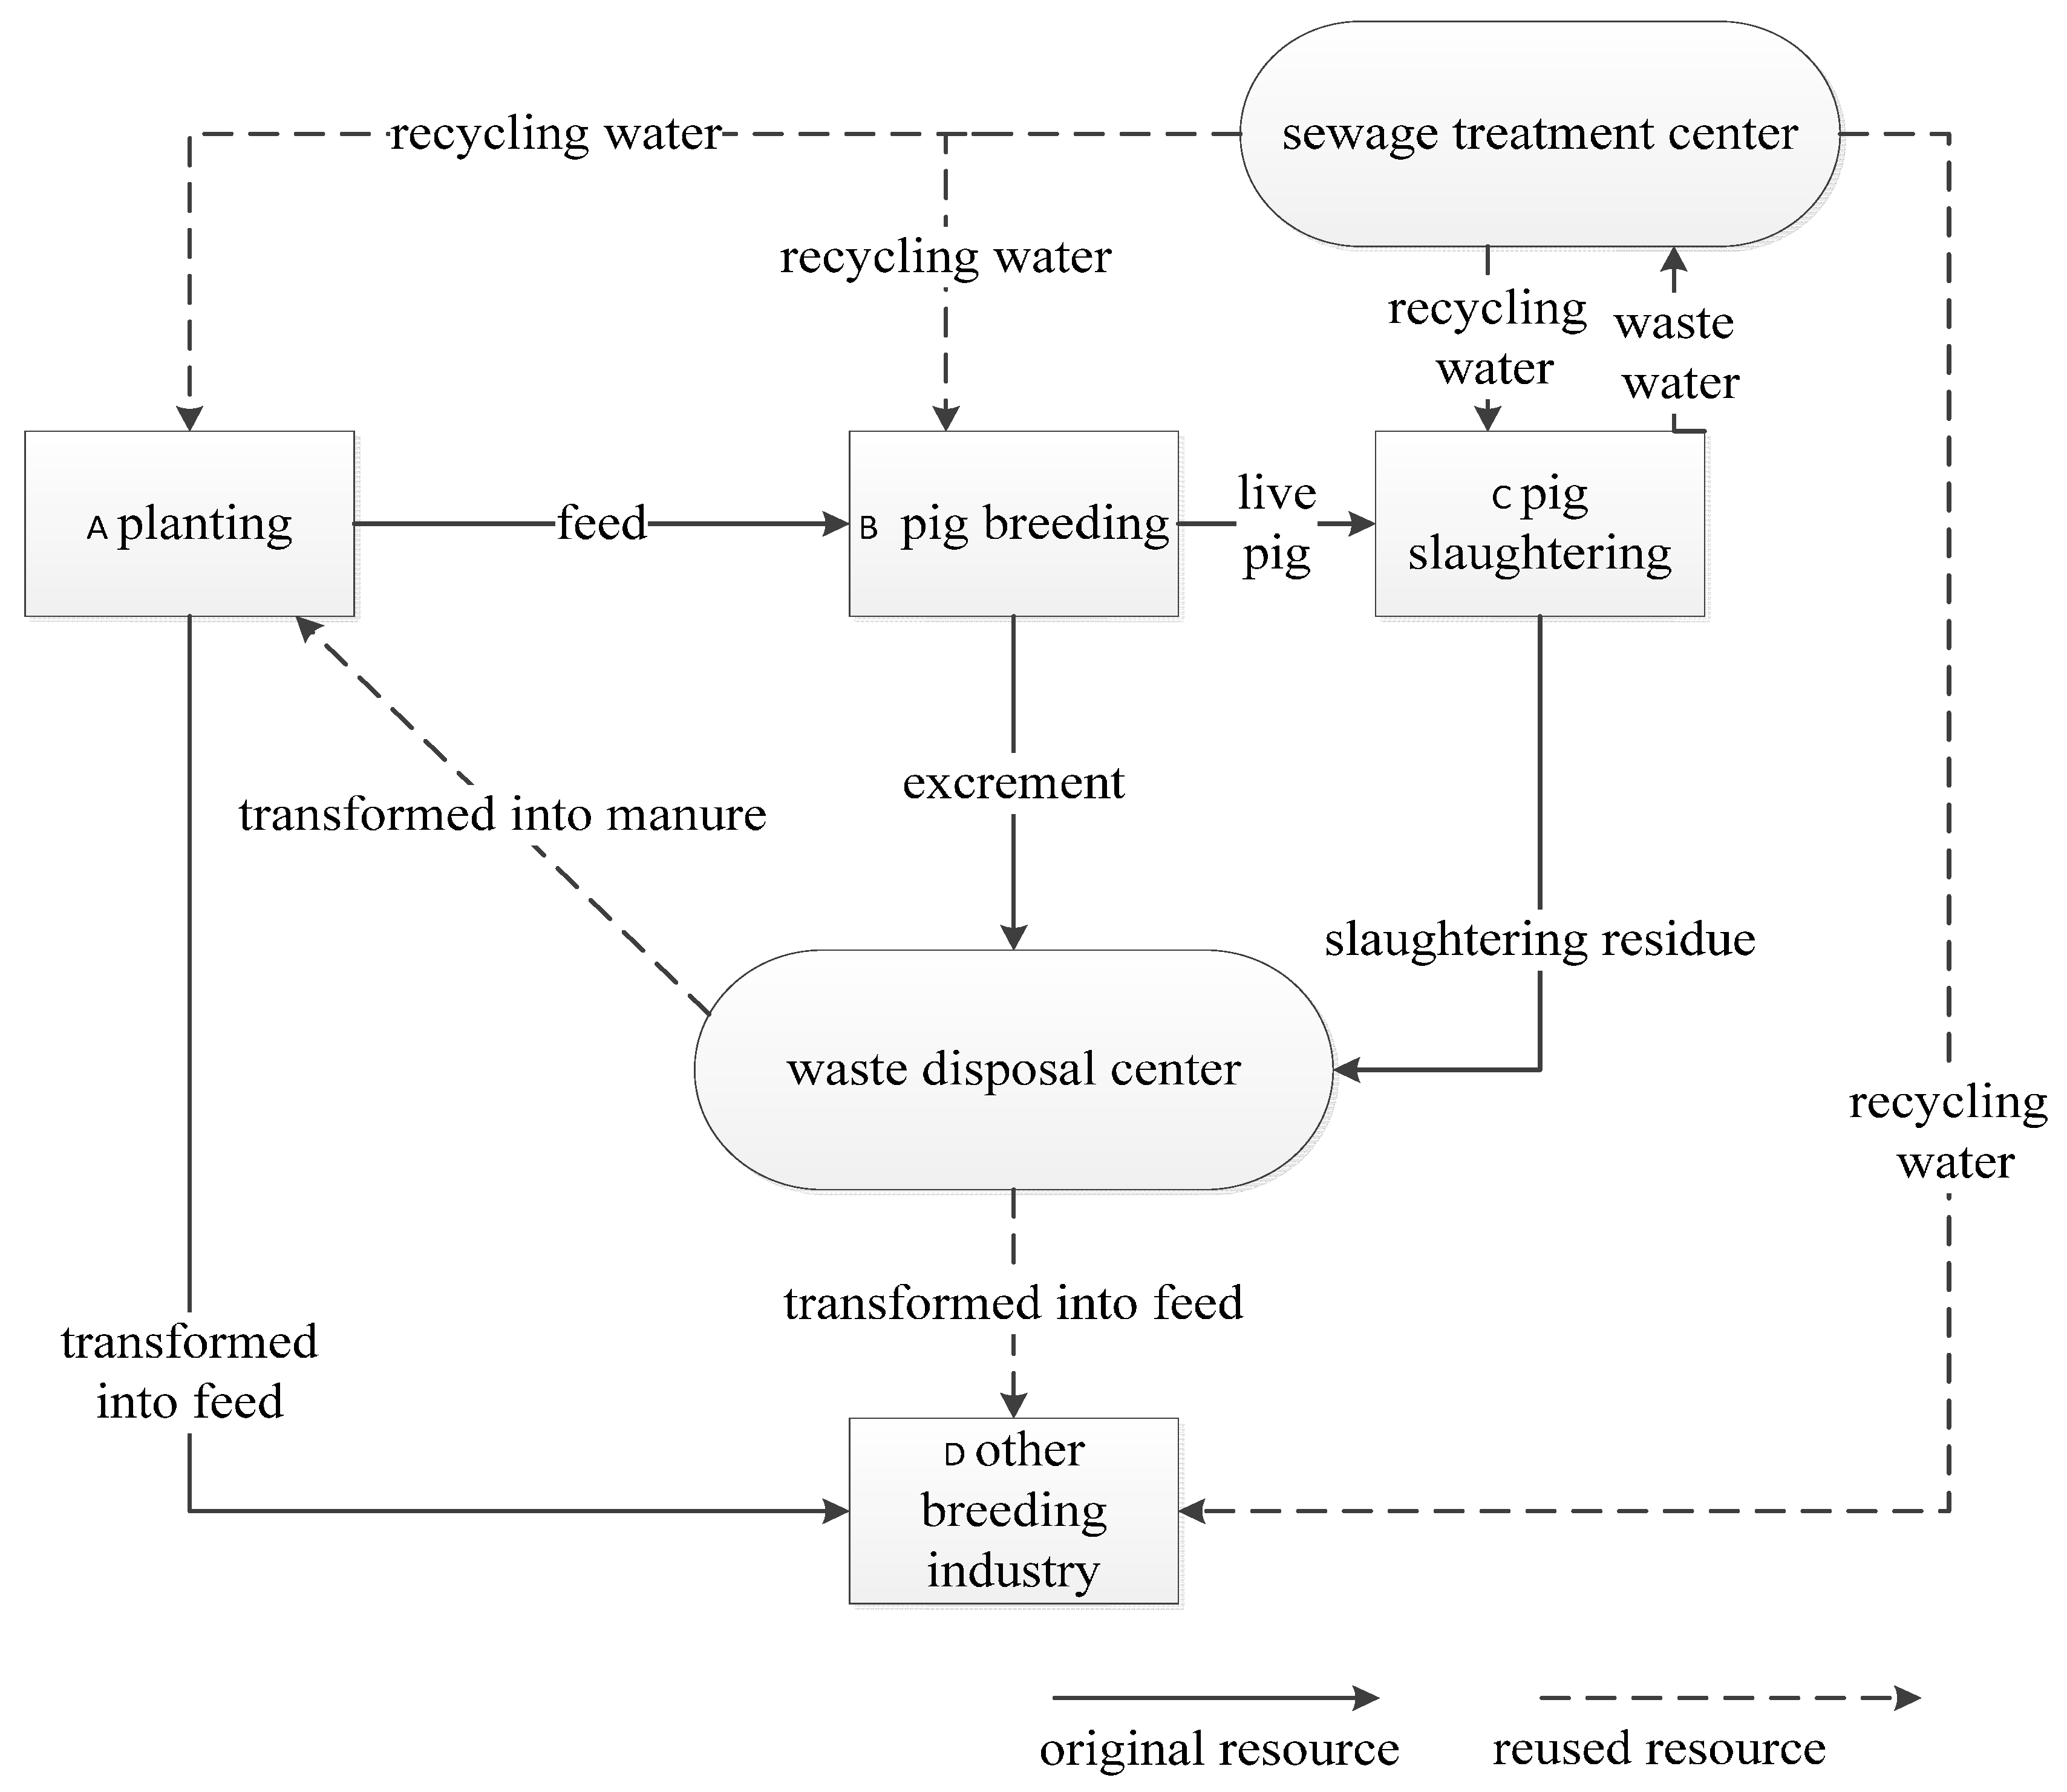
2. Circular Economic System for Live Pig Industry

Pollution in massive pig breeding: During the massive pig-breeding and -cleaning process, pig manure, sewage, noise, sewage, dust and odor from breeding sites and instruments may cause cross-compound damage and destruction to the atmosphere, water, soil and organism layers, exerting an interactive influence on the pig-farming system and the ecological system. Gan Lu et al. (2006) argued that pollution from large-scale livestock and poultry industries have two characteristics. One is the large amount of animal excrement produced; for example, in 1999, the livestock and poultry excrement production in China was 2.4 billion tons, and the organic pollutant COD in these excrement was 8118 tons, far greater than the sum of CODs in industrial and domestic sewage and other pollutants. The second is the very serious pollution of livestock excrement in environment. The authors noted that more than 98% of farms in China directly discharge excrement and wastewater without any treatment. Excrement and sewage are home to mosquitoes and bacteria, which contribute to the spread of diseases and affect residents’ life and health through polluting the surrounding surface water and groundwater [22].
Circular economic development requires a vigorous increase in resource-comprehensive development and the recycling-utilization rate in the resource-exploitation step, a vigorous increase in resource-utilization efficiency in the resource-consumption step, a vigorous comprehensive utilization of resources in the waste-generation step, the vigorous recycling and reuse of various wastes in the renewable resource-production step, and a vigorous promotion of green consumption in the consumption step [23]. This paper argues that in the circulation of solid materials, planting products, in addition to direct sale in the market, can be used for breeding pigs, poultry, fish and other animals as feed, and feces, offal and other waste produced from pig breeding and slaughtering can be used in planting, poultry and aquaculture as manure and feed [24]. In the circulation of liquid materials, large amounts of water are needed for slaughtering pigs, which will produce a large amount of polluted water. The existing purification technology is able to treat this type of waste water to be used for irrigation, cleaning and other household uses; therefore, it is possible to realize the recycling utilization of water resources in farming, pig breeding, pig slaughtering, poultry and fish breeding [25]. To sum up, this paper focuses on the live pig industry to establish a circular economic system of the pig industry, as shown in Figure 1.
Figure 1. The circular economic system of the live pig industry.
Sustainability 08 00026 g001

3. Cyclic Model for Live Pig-Industry Chain

3.1. Problem Description

The main purpose of this paper is to optimize the cyclic links for the live pig industry and to reasonably determine the wastewater-treatment capacity and waste-disposal capacity according to the market demand for the entire cycle. The specific issues are as follows: to reduce the pollution of the pig-industry chain and to improve the efficiency of the resource-utilization rate, the development of the pig-industry chain under a circular economy will determine reasonable wastewater and waste-processing capabilities [26]. Based on the demand distribution of each terminal product in the cyclic system, which fits with the historical data of regional market demand, we can make optimal decisions based on the production capacity, the waste-disposal capacity, and the distribution of the recycling materials of each link in the cyclic industrial chain to ensure that the production and waste-disposal capacity of the cyclic industrial chain can not only meet market demand but also maximize resource reuse and minimize investment. This problem is a multi-objective optimization problem that contains uncertain constraint conditions. Therefore, it is possible to construct a multi-objective uncertainty-planning model to solve the optimization problem.

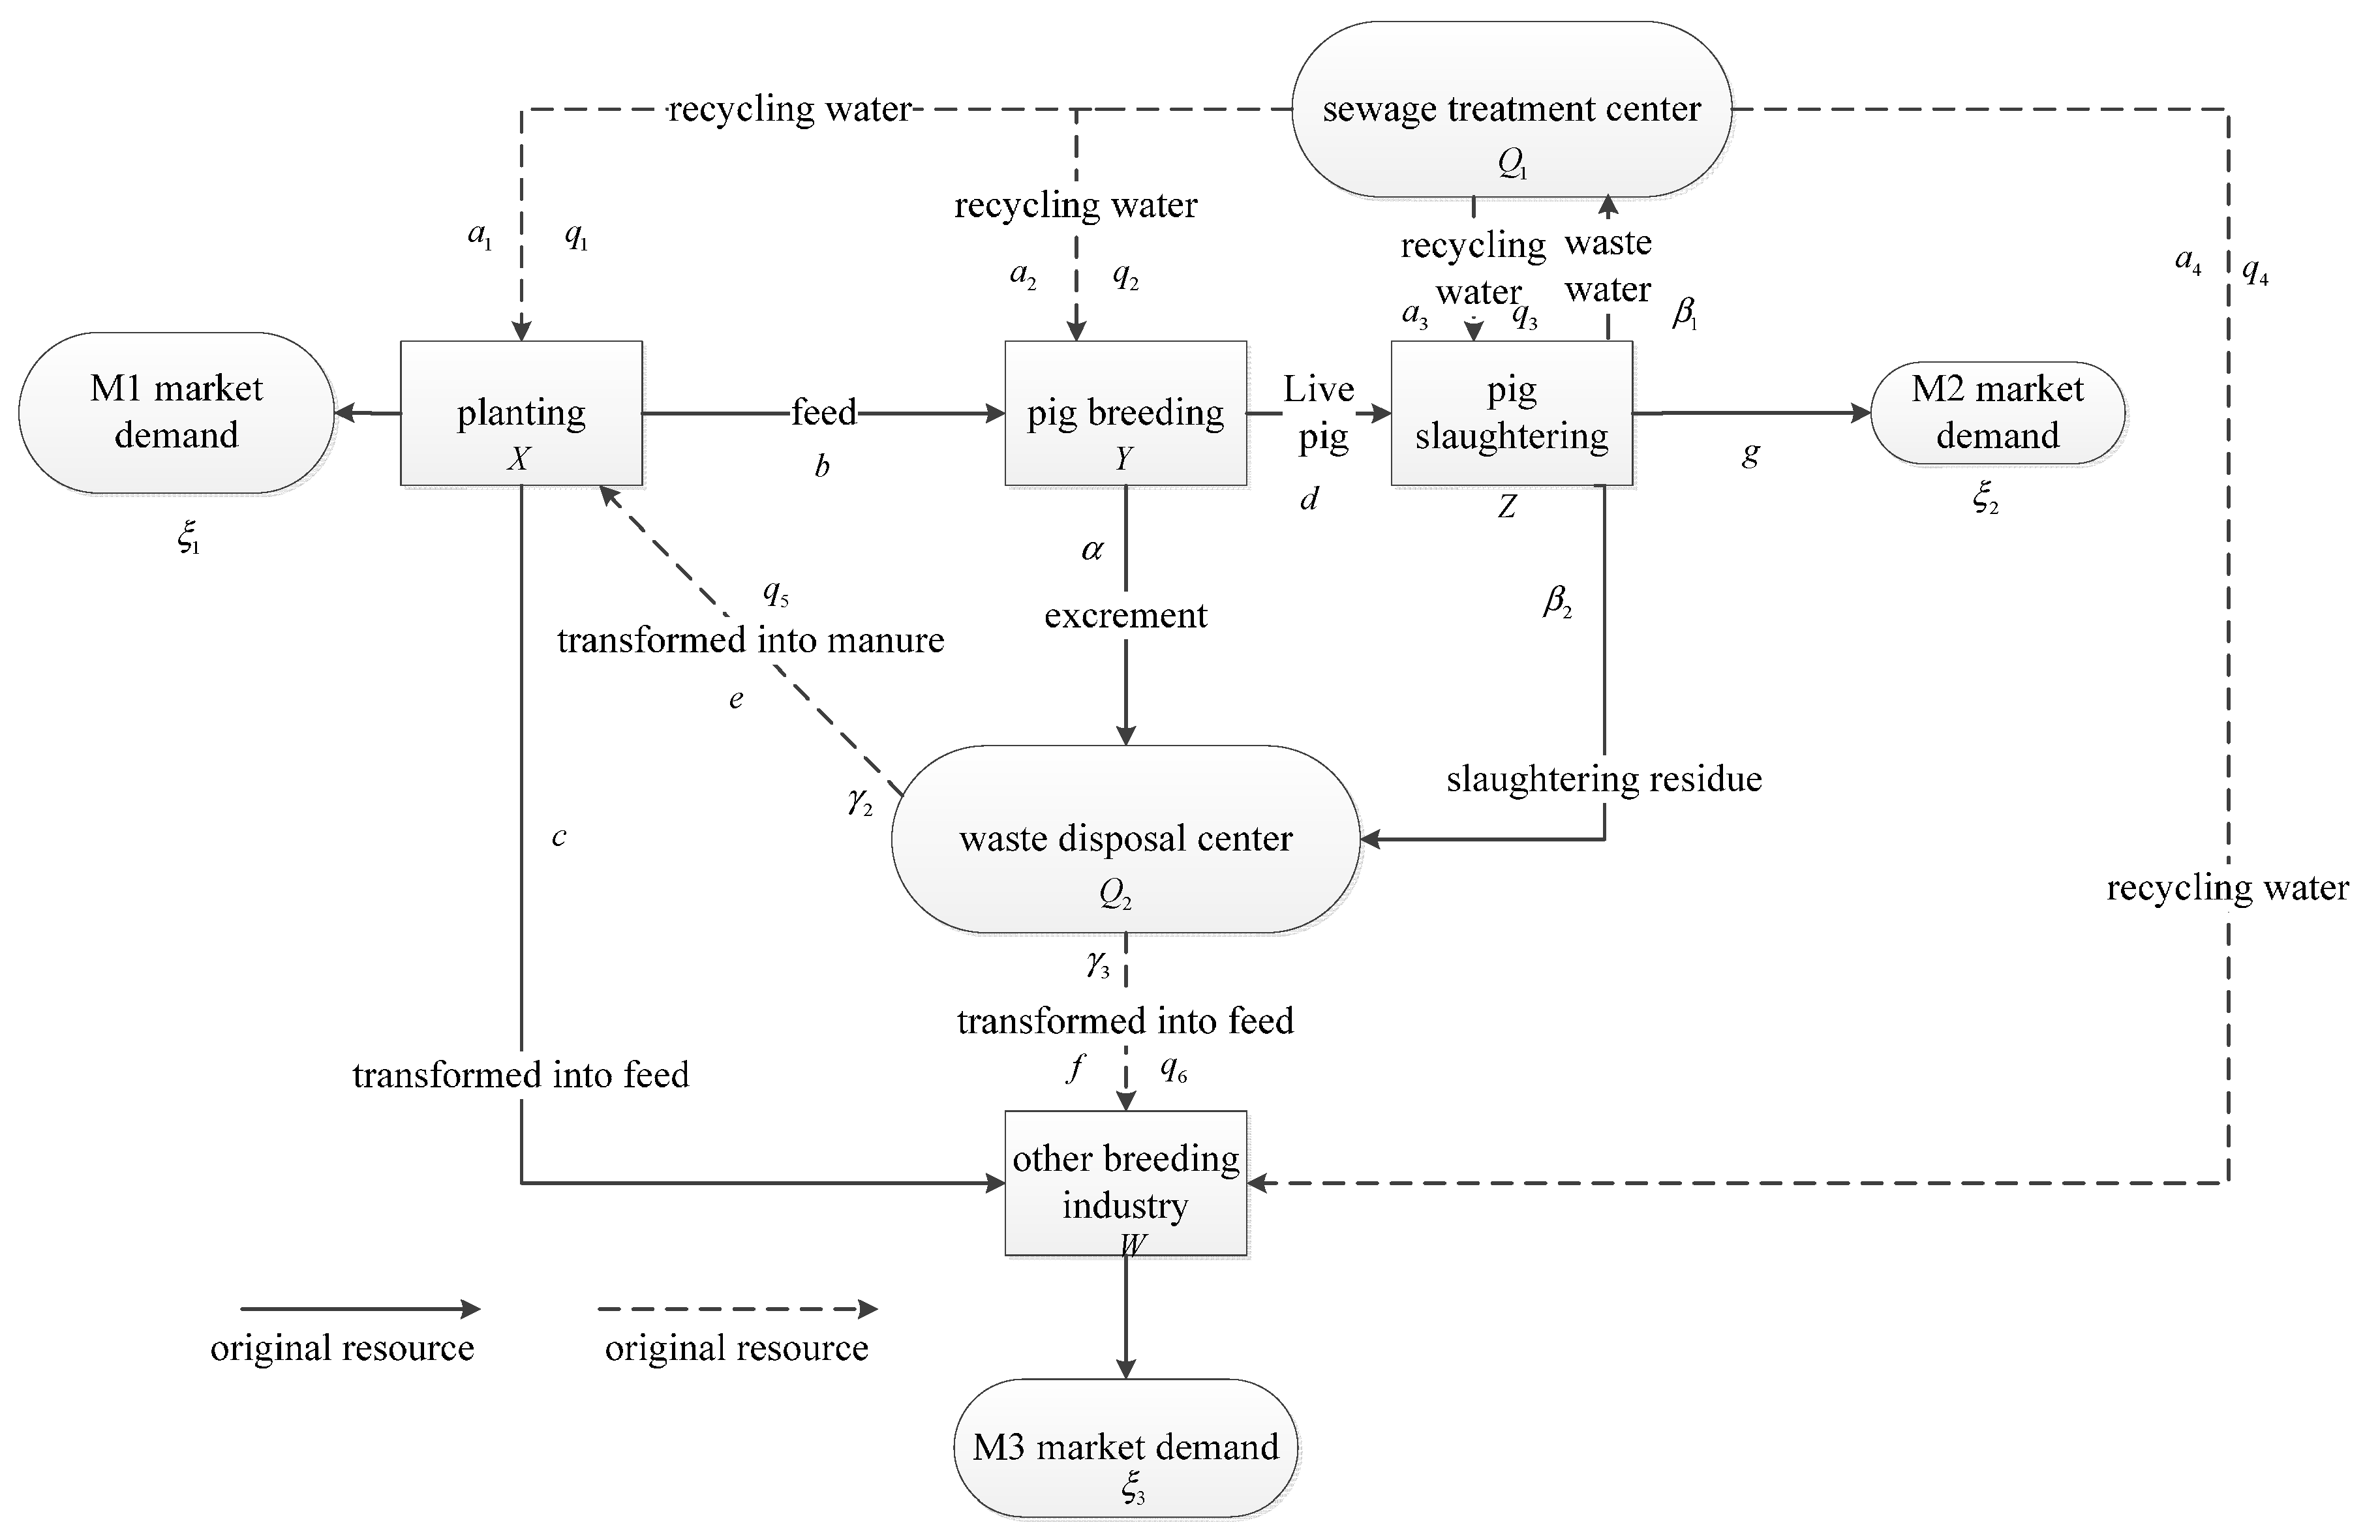
3.2. Symbol Description

Because the pig-industry chain cycle contains many different enterprises engaging in different operations and their correlation is complicated, we start our research with an explanation of the variables and parameters that will be used in the model. Following Figure 2, the meanings of variables and parameters are defined as follows:
Figure 2. The relationship of each parameter in the circular system of the live pig-industry chain.
Sustainability 08 00026 g002
X Planting capacity (The unit is kg.)
Y Production capacity of pig-breeding industry. (The unit is kg.)
Z Production capacity of pig-slaughtering industry. (The unit is kg.)
W Capacities of other related breeding industries. (The unit is kg.)
a 1 Water demand of agricultural products in planting industry. (The unit is liter per kg.)
a 2 Water demand of pig-breeding units. (The unit is liter per kg.)
a 3 Water demand of pig-slaughtering units. (The unit is liter per kg.)
a 4 Water demand of other related breeding units. (The unit is liter per kg.)
b Feed demand of pig-breeding units, that is, the pig-breeding coefficient after planted products become feed. (The unit is kg.)
c Feed demand of other breeding units, that is, the other breeding coefficient after planted products become feed. (The unit is kg.)
d Pig demand of slaughtering units to produce pork products. (The unit is kg.)
e Manure demand of planting units to produce agricultural products, that is, the input/output coefficient of waste manure to planting industry. (The unit is kg.)
f Feed demand of other breeding units, that is, the breeding coefficient of other breeding industries after the waste becomes feed. (The unit is kg.)
g Pig-slaughter capacity needed to meet the market demands. (The unit is kg.)
α Average amount of excrement produced by pig-breeding units. (The unit is kg.)
β 1 Average amount of wastewater produced by pig-slaughtering units. (The unit is liter.)
β 2 Average amount of waste produced by pig-slaughtering units. (The unit is kg.)
γ 1 Conversion rate of wastewater treated to become reclaimed water.
γ 2 Conversion rate of waste treated to become manure.
γ 3 Conversion rate of waste treated to become feed.
Q 1 Wastewater-treatment capacity. (The unit is liter.)
Q 2 Waste-disposal capacity. (The unit is kg.)
v 1 Construction cost of wastewater-treatment unit capacity. (The unit is yuan per liter.)
v 2 Construction cost of waste-disposal unit capacity. (The unit is yuan per kg.)
η 1 Rated target utilization rate of wastewater-treatment capacity.
η 2 Rated target utilization rate of waste-disposal capacity.
q 1 Use amount of circulating water in planting industry. (The unit is liter.)
q 2 Use amount of circulating water in pig-breeding industry. (The unit is liter.)
q 3 Use amount of circulating water in pig-slaughtering industry. (The unit is liter.)
q 4 Use amount of circulating water in other livestock-breeding industries. (The unit is liter.)
q 5 Use amount of recycling manure in planting industry. (The unit is kg.)
q 6 Use amount of recycling feed in other breeding industries. (The unit is kg.)
ξ 1 Market demand for agricultural products. The random variables and distribution function can be determined by the empirical distribution of historical data.
ξ 2 Market demand for pig-slaughtering products. The random variables and distribution function can be determined by the empirical distribution of historical data.
ξ 3 Market demand for other breeding industries. The random variables and distribution function can be determined by the empirical distribution of historical data.
We assume that the products of the planting industry are the products of consumers’ direct demand; that is, the products of the planting industry are converted into market-demanded products with an effective rate of 100%. Products of other breeding industries are also consumers’ directly demanded products converted into market-demanded products with an effective rate of 100%.

3.3. Model Construction

Optimization problems often involve the need to solve several objectives; therefore, many studies focus on the processing method and algorithm of multi-objective optimization problems [27]. Because the supply-chain design often involves multiple parts, multiple subjects and multiple perspectives, multiple-objective optimization is commonly adopted in green supply-chain design [28,29,30]. In cases of uncertainty or randomness in supply-chain products or raw material demand, the uncertainty programming approach is usually used to obtain more meaningful results in the closed-loop supply chain [31,32,33].
According to the approach of constructing a circular economy model for the pig-industry chain, the main task in this article is to rationally determine wastewater treatment capacity Q 1 and waste disposal capacity Q 2 under the probabilities ( p 1 , p 2 , p 3 , p 4 ) satisfied for each condition and the recycling water allocation among each subject ( q 1 , q 2 , q 3 and q 4 ), recycling manure distribution q 5 , and recycling feed distribution q 6 . To this end, the multiple-objective uncertainty-planning model is proposed as follows:
max F 1 = q 1 + q 2 + q 3 + q 4 X a 1 + Y a 2 + Z a 3 + W a 4
min F 2 = v 1 Q 1
max F 3 = q 5 + q 6 X e + W f
min F 4 = v 2 Q 2
s . t .
Pr { Z β 1 Q 1 } p 1
Pr { Y α + Z β 2 Q 2 } p 2
Pr { X a 1 + Y a 2 + Z a 3 + W a 4 Q 1 γ 1 η 1 } p 3
Pr { X e γ 2 + W f γ 3 Q 2 η 2 } p 4
q 1 + q 2 + q 3 + q 4 Q 1 γ 1
q 5 γ 2 + q 6 γ 3 Q 2
q i 0   ,   i = 1 , 2 , ... , 6
Q 1 > 0 , Q 2 > 0 , X > 0 , Y > 0 , Z > 0 , W > 0
Formula (1) shows the objective of the efficiency of the circular economy, which indicates that one of the goals of the optimized pig-industry chain cycle is the maximized use of the recycling water in the system. Formula (2) indicates that in optimizing the pig-industry chain cycle, the construction cost of the wastewater-treatment center should be as low as possible, which means that the scale of the wastewater-treatment center should be reasonable. Formula (3) is also used with the objective of an efficient circular economy, which means that in optimizing the pig-industry chain cycle, the use proportion of recycling waste in the system should be maximized. Formula (4) indicates that in optimizing the pig-industry chain cycle, the construction cost of the waste-disposal treatment center should be as low as possible, which means that the scale of the waste-disposal treatment center should be reasonable.
The random vectors included in Formulas (5)–(8) belong to random constrained functions. There is no determined feasible set; the normal practice is to set up a certain confidence level [34,35]. Formula (5) expresses the constraint condition on the capability of the wastewater-treatment center, which requires the probability that the wastewater-treatment center can handle all wastewater produced by pig slaughtering to be greater than or equal to p 1 . As wastewater treatment capacity Q 1 increases, so does the probability that it can handle all wastewater produced by pig slaughtering. Formula (6) expresses the constraint condition on the capability of the waste-disposal center, which requires that the probability that the waste-disposal center can handle all waste produced by pig slaughtering and breeding be greater than or equal to p 2 . As wastewater treatment capacity Q 2 increases, so does the probability that it can handle all wastewater produced by pig slaughtering. Formula (7) expresses the constraint condition for the recycling efficiency. The probability that the use rate of recycled water after treatment in the wastewater-treatment center is not less than η 1 is greater than or equal to p 3 . As wastewater treatment capacity Q 1 decreases, the likelihood increases that the recycled water after treatment will be used in full, and the efficiency of the treatment center increases. Formula (8) expresses that the probability in which the total use rate of recycling manure and feed after treatment in the waste-disposal center is not less than η 2 is greater than or equal to p 4 . As waste-disposal capacity Q 2 decreases, the likelihood increases for the recycled manure and feed after treatment to be used in full, and the efficiency of the disposal center increases. Formula (9) indicates that the total use amount of recycled water is smaller than the supply amount after wastewater treatment. Formula (10) expresses that the total use amount of recycling manure and feed is smaller than the supply amount after waste disposal.
Formula (11) expresses the range constraint on recycling resources, and Formula (12) is the basic constraint on capacity, including that the sewage treatment capacity should be greater than 0, the waste-disposal capacity should be greater than 0, and the production capacity of other pig industry-chain subjects should be greater than 0.

3.4. Model Solution

The model proposed in this paper is a multi-objective model, and the key to the solution is the tradeoff between multiple objectives and the approximation of uncertain constraints. In the tradeoff between multiple objectives, this paper aims to find the optimal solution of each objective one by one [36,37] and then to construct a comprehensive evaluation formula, as in Formula (13):
max F = ω 1 F 1 F 1 * + ω 2 F 2 * F 2 + ω 3 F 3 F 3 * + ω 4 F 4 * F 4
where F 1 * , F 2 * , F 3 * and F 4 * represent the optimal solution obtained when only the single objective is considered. ω 1 , ω 2 , ω 3 , ω 4 are weights for the different objective to reflect decision-makers’ preference between cost control and cyclic economic level and to avoid a solution that is heavily skewed. 0 ω i 1 , i = 1 , 2 , 3 , 4 . ω 1 + ω 2 + ω 3 + ω 4 = 1 . When the recycling water needed by all subjects in the cycling system can be provided by the recycling water, the objective Formula (1) reaches its maximum, F 1 * = 1 . Similarly, when the manure and feed needed by all subjects in the cycling system can be provided by the recycled manure and feed, objective Formula (3) reaches its maximum, F 3 * = 1 . When each objective can achieve its optimal value, F = 4 . A reverse relationship exists among objective functions; for example, as the recycling resource-utilization rate increases, so do the wastewater-treatment, the waste-processing capabilities, and the cost. Therefore, our solution objective is to make the comprehensive evaluation index approach 1 as much as possible. That is to say, F 1 and F 3 should be as large as possible, approximating to F 1 * and F 3 * , whereas F 2 and F 4 should be as small as possible, approximating F 2 * and F 4 * . However, in case there is a contradiction between objectives, weight parameters ω i ( i = 1 , 2 , 3 , 4 ) will determine the preference level to satisfy the objectives.
In the approximation of uncertainty constraints, this paper primarily adopts the random simulation and neural network intelligent algorithm methods to approximate the uncertainty constraints. First, through the conversion rates, it is possible to calculate planting capacity X , pig-breeding capacity Y , pig-slaughtering capacity Z , other related capacity W and the market random demand, as shown below:
Z = ξ 2 g
W = ξ 3
Y = d Z = ξ 2 g d
X = c W + b Y + ξ 1 = c ξ 3 + b ξ 2 g d + ξ 1
Putting these equations into constraint conditions Formulas (5)–(8), the uncertainty constraints with random variables can be obtained as follows:
Pr { ξ 2 g β 1 Q 1 } p 1
Pr { ξ 2 g d α + ξ 2 g β 2 Q 2 } p 2
Pr { ( c ξ 3 + b ξ 2 g d + ξ 1 ) a 1 + ( ξ 2 g d ) a 2 + ( ξ 2 g ) a 3 + ξ 3 a 4 Q 1 γ 1 η 1 } p 3
Pr { ( c ξ 3 + b ξ 2 g d + ξ 1 ) e γ 2 + ξ 3 f γ 3 Q 2 η 2 } p 4
The total solution is divided into three processes. First, find a sufficient wastewater-treatment capacity Q 1 and waste-disposal capacity Q 2 that satisfy the constraints. Then, find the distribution schemes ( q 1 , q 2 , q 3 , q 4 , q 5 , q 6 ) with a maximum resource-utilization rate under Q 1 and Q 2 and calculate the corresponding optimal solutions. Finally, optimize these schemes to produce new solutions, and evaluate corresponding objective values to the solutions; after a sufficient number of optimization processes, display the obtained optimal solution. The hybrid genetic algorithm is a global optimization probabilistic algorithm that can handle all types of linear and nonlinear objective functions. Its optimization ability is powerful with good adaptability and generality [38,39,40]. Therefore, this paper constructs an inner and outer double-layer genetic algorithm and a neural network algorithm for a comprehensive solution.
The concrete process is as follows:
The first step: Determine the input and output variables of the uncertainty function. According to constraints in Formulas (5)–(8) associated with the processing capacity, construct the uncertainty function as follows [41]:
U 1 : Q 1 Pr { ξ 2 g β 1 Q 1 }
U 2 : Q 2 Pr { ξ 2 g d α + ξ 2 g β 2 Q 2 }
U 3 : Q 1 Pr { ( c ξ 3 + b ξ 2 g d + ξ 1 ) a 1 + ( ξ 2 g d ) a 2 + ( ξ 2 g ) a 3 + ξ 3 a 4 Q 1 γ 1 η 1 }
U 4 : Q 2 Pr { ( c ξ 3 + b ξ 2 g d + ξ 1 ) e 2 γ 2 + ξ 3 f γ 3 Q 2 η 2 }
The second step: Generate the input and output samples of the uncertainty function. By random simulation, generate input and output data for the uncertain function and form the training sample. The specific process is as follows: According to the largest values of market demand in previous years, determine the value ranges of Q 1 and Q 2 ; by random simulation, generate input and output data for the uncertain function within their value ranges. Take Q 1 as an example: After randomly generating Q 1 , generate random simulation values according to market-demand distribution ξ 1 , ξ 2 , and ξ 3 ; place them into the uncertainty function to calculate ξ 2 g β 1 and to compare it with Q 1 ; count the ratio of the Q 1 ξ 2 g β 1 times in total simulations; and take this ratio as the corresponding output result of input Q 1 .
The third step: Train the neural network to approximate each uncertainty function. According to the training sample generated, train a neural network to approximate the above uncertain function.
The fourth step: Produce the initial population of the outer genetic algorithm. Initially generate N chromosomes ( Q 1 , Q 2 ) as the initial population, and use the trained neural network to test the feasibility of the chromosome. Calculate each viable F 2 and F 4 corresponding to the chromosome, and take the smallest F 2 and F 4 of all chromosomes as the initial F 2 * and F 4 * .
The fifth step: Calculate the corresponding objective function values of each chromosome of the initial population by constructing an inner random expectation model. For each feasible chromosome ( Q 1 , Q 2 ) , solve the random expectation planning. Taking Q 1 as an example, construct the random expectation planning as follows:
max E ( q 1 + q 2 + q 3 + q 4 X a 1 + Y a 2 + Z a 3 + W a 4 )
s.t. q 1 + q 2 + q 3 + q 4 Q 1 γ 1
(1)
Construct the uncertainty function as follows:
U 5 : ( q 1 , q 2 , q 3 , q 4 ) E ( min ( q 1 + q 2 + q 3 + q 4 ( c ξ 3 + b ξ 2 g d + ξ 1 ) a 1 + ( ξ 2 g d ) a 2 + ( ξ 2 g ) a 3 + ξ 3 a 4 , 1 ) )
(2)
Generate input and output data for the uncertainty function. Generate the input and output data, of which the input data are produced as below: Randomly generate q 1 in accordance with the uniform distribution in [ 0 , Q 1 γ 1 ] . Then, randomly generate q 2 in accordance with the uniform distribution in [ 0 , Q 1 γ 1 q 1 ] . Similarly, randomly generate q 3 in accordance with the uniform distribution in [ 0 , Q 1 γ 1 q 1 q 2 ] , and finally, calculate q 4 = Q 1 γ 1 q 1 q 2 q 3 . The corresponding output data are the expectations for the resource-utilization rate. Generate random samples according to market-demand distribution; then, calculate the corresponding uncertain function values of these samples. Finally, average the values according to the number of samples to obtain the output data of the input data under the group.
(3)
Use the input and output data to train the neural network to approximate U 5 . Utilize the input and output data to train the neural network.
(4)
Randomly generate the initial population of the genetic algorithm in the inner layer. Randomly generate sub-chromosomes to form the initial population according to step (2), and use the trained neural network to test its feasibility.
(5)
Crossover and mutation operation of inner-layer genetic algorithm. Conduct cross-operation and mutation operation on dub-chromosomes, generate new chromosomes, and use the trained neural network to test its feasibility.
(6)
Calculate the target value of the genetic algorithm in the inner layer. Calculate the corresponding objective value of each sub-chromosome, and calculate the fitness of each sub-chromosome according to the objective value.
(7)
Roulette selection of sub-chromosome for inner-layer optimization and iteration. Select the sub-chromosomes with roulette. Repeat (5)–(6) until the pre-set optimal number of cycles is reached.
(8)
Output the optimal solution of the inner genetic algorithm. Obtain the corresponding sub-chromosome of the optimal objective values.
The sixth step: Calculate the final objective function value. After obtaining the optimal recycling resource-distribution schemes of given Q 1 and Q 2 , combine them with the results of the fourth step to calculate the fitness of the comprehensive evaluation, that is, Formula (13).
The seventh step: Calculate the target value of the genetic algorithm in the outer layer: Conduct cross-operation and mutation operation to produce new chromosomes, and use a trained neural network to test the feasibility of chromosomes. Cross-operation operators are composed of (1) the summation of two corresponding chromosomes to produce new chromosomes; (2) the averaging of two corresponding chromosomes to produce new chromosomes; (3) the differential of two corresponding chromosomes to produce new chromosomes; and (4) the alternation of two corresponding chromosomes to produce new chromosomes. The four types of operations are random. The mutation operation is (1) add or subtract a small random number on each part of a chromosome; and (2) add or subtract a larger random number on each part of a chromosome. The mutation operations are also random.
The eighth step: Calculate the fitness function of the outer genetic algorithm. Calculate the objective values of all chromosomes, and according to the objective values, calculate the fitness.
The ninth step: Roulette selection of sub chromosome for outer-layer optimization and iteration. Choose the chromosomes with roulette to repeat steps five to eight, until the pre-set optimal number of cycles is reached.
The tenth step: Output the optimal solution and the optimal objective function value. Output the corresponding chromosomes of the optimal objective value.

4. Case Analysis

4.1. Case Design

To realize sustainable economic development, a region plans to build a cycle system for the pig-industry chain to reduce pollution in the environment by wastewater and waste generated from pig breeding and slaughtering and to treat the wastewater and waste for reusing, thus saving resources. Because wastewater treatment and waste disposal are a systematic project, it is first necessary to determine the processing capacities of the wastewater-treatment center and waste-disposal center according to the market demand. The subjects involved in the pig-industry chain in this region primarily include corn planting, pig breeding, pig slaughtering, and poultry and fish integrated breeding. The setting of parameters depends on the analysis of the practical data of the pig breeding-industry chain and on the data of the circulation processing-technology efficiency [42,43,44]. The supply and demand relationship between each subject and its conversion coefficients are as follows:
Planting: Take corn as an example. Because the product is primarily used to meet regional needs, this paper assumes that the planting output can be completely converted into market-demand products; that is, cases such as rotten products are not considered. After related products become feed, the feed coefficient for pigs is b = 2.5 , and the feed coefficient for poultry and fish is c = 3 . In the process of planting, the irrigation water needed per mu per day is 4 m3, and the yield per mu is approximately 600 kg. Therefore, the average water use for the production of one kg of corn is a 1 = 1 150 . Because the cycle of corn planting is approximately 100 days, to ensure that there is enough feed for pig breeding, the planting scale should be 100 × daily supply. In terms of manure, a complete cycle of planting requires approximately 40 kg of manure for each mu, with an average daily manure amount per kilogram of e = 40 600 × 100 = 1 1500 .
Pig breeding: During the pig-breeding process, including cleaning, pig drinking, and living water for workers, the average daily water consumption for feeding 100 pigs is 1.27 m3. Calculated as 120 kg per live pig, the average water demand per kg per pig is a 2 = 127 1 , 200 , 000 . The pig-breeding cycle is approximately 150 days to ensure that a sufficient number of pigs be supplied daily to the slaughterhouses. The feeding size should be a 150 × daily supply. Each pig can produce 2.17 kg of excrement per day. Calculated as 120 kg per pig, the pig breeding can produce an average of α = 217 12 , 000 per kilogram. There exists a certain rate of incidence and mortality in the pig-breeding process, so the real ratio of supply to slaughterhouses is approximately 96%, that is, d = 1 96 % = 25 24 .
Pig-slaughtering industry: Among the live pigs slaughtered daily in the slaughterhouse, approximately 100 are from nearby areas. The part of pig breeding can be involved in the design of the circular economy system. The average water needed per each slaughtered pig is approximately 0.6 m3. Calculated by the weight of 120 kg per live pig, the average wastewater coefficient produced per kg is β 1 = 1 200 . After slaughtering, approximately 80% can eventually become consumer products; that is, to provide 1 unit of product to the market, the slaughtered pig amount is g = 1.25 . The proportion of waste generated in the process of slaughtering is approximately 20%, that is β 2 = 1 5 . In the process of pig slaughterhouse operation, the ratio of using recycling water is approximately 40%, the average recycling water demand for each slaughtered pig is 0.48 m3, and the average recycling water available per kg for pig slaughtering is a 3 = 1 625 .
Other poultry- and fish-breeding industries: Assume that the products of poultry and fish breeding are sold locally with a conversion rate of 100%. The feed coefficient from waste treatment is higher than that from the planting industry, f = 2.2 . The average recycling water per kilogram in the process of poultry and fish breeding is a 4 = 1 180 .
The effective conversion rate of the wastewater-treatment center is γ 1 = 80 % ; that is, after treatment, 1 unit of wastewater can be converted into 0.8 units of standard recycling water. In the waste-disposal center, the efficiency rate of transformation into manure is γ 1 = 80 % , and the efficiency rate of transformation into feed is γ 3 = 56 % .
According to the historical data of corn-market demand, the historical data of pig demand in the market associated with the slaughterhouse and the historical data of the relevant market demand for poultry and fish, the distributional function of market demand can be determined. Take kg as the unit, and assume that the market demand for the three types of products is subject to a normal distribution, of which ξ 1 N ( 8000 , 120 ) , ξ 2 N ( 96000 , 500 ) , and ξ 3 N ( 6000 , 138 ) .
So far, we have determined the related subjects and parameters of the paths of the circular economy system, as shown in Table 1.
Table 1. Relevant parameters of the case.
ParameterValueParameterValueParameterValue
a11/150g1.25p10.95
a2127/1,200,000α217/12,000p20.95
a31/625β11/200p30.90
a41/180β21/5p40.90
b2.5γ10.80ξ1N(8000,128)
c3γ20.90ξ2N(96000,500)
d25/24γ30.56ξ3N(6000,138)
e1/1500η10.95
f2.2η20.90

4.2. Results

According to the solution given above, the genetic algorithm and neural network are used to find the solution. In constructing the neural network, the number of input neurons is determined by the number of decision-making variables, the number of output neurons is determined by the number of objective functions, and the number of the middle hidden-layer neurons can be calculated with Kolmogorov’s Theorem [45]. In the process of determining the processing ability in the first layer, we trained a neural network of two input neurons, four hidden neurons, and four output neurons to approximate the uncertainty function. In identifying the optimal distribution scheme q 1 , q 2 , q 3 and q 4 with given processing capacity Q 1 , we trained a neural network of four input neurons, 10 hidden neurons, and one output neuron to approximate the uncertainty function. In solving q 5 and q 6 with given processing capacity Q 2 , we trained a neural network of two input neurons, four hidden neurons, and one output neuron to approximate the uncertainty function. Each time we used the neural network to approximate the uncertainty function, each sample was simulated 3000 times, generating 2000 training samples. In the genetic algorithm of the external and internal cycles, the iteration number was set to 500 times. Using MATLAB R2015a [46] for programming and solutions, the results were obtained as follows:
Table 2. Results of case solution.
VariableValueVariableValue
Q 1 591.73 m3 Q 2 23,155.90 kg
q 1 186.34 m3 q 2 71.12 m3
q 3 207.25 m3 q 4 45.33 m3
q 5 83.62 kg q 6 9639.10 kg
Using the model and algorithm proposed in this paper, we optimize the capacity of sewage treatment and waste disposal and the supply paths of the cyclic water, feeds, and manures while satisfying a series of decision-makers’ requirements on the utilization rates of the sewage treatment center and waste disposal center and satisfying the probability of market demand. The calculation results indicate that a designed sewage treatment capacity of 591.73 m3 and waste disposal capacity of 23,155.90 kg can meet the needs of water recycling, recycling feeds and manures. After treatment, 186.34 m3 of the recycled water will be assigned to the planting industry, 71.12 m3 will be assigned to the pig-breeding industry, 207.25 m3 will be assigned to the pig-slaughtering industry, and 45.33 m3 will be assigned to other livestock-breeding industries. After treatment the waste will be converted to 83.62 kg manures to be used in the planting industry, the others will be converted into 9639.10 kg feeds, for use in other breeding industries.

5. Conclusions

As an important agricultural base, the pig-industry chain features large, durable and stable market demand. However, some links of the chain produce a large quantity of waste and wastewater, causing serious pollution to the environment. The traditional mode of operation has been verified to affect sustainable development. In the circular economy, waste and wastewater are treated through advanced environmental protection technology, which can not only reduce the pollution of pig industry-chain emissions but also realize resource reuse, thus providing an important means for the sustainable development of the pig-industry chain. This article started with the capacities of each subject in the pig-industry chain, discussed relevant products and demands among subjects, determined the path of the development of the pig-industry chain under a circular economy, and proposed a circular economy system for the pig-industry chain. The construction of the circular economy is primarily targeted at reducing pollution, increasing resource utilization efficiency, and saving cost. If the size of wastewater and waste disposal centers is improper, pollution may persist because of insufficient processing capacity, or resources are wasted because of excessively high treatment capacity. Therefore, a reasonable determination of the waste and wastewater treatment capacities within the circulation system and the destination of processed output are the key to optimizing and building a pig-industry chain under the circular economy system. Considering the fluctuation of market demand, this paper introduced the uncertainty function to characterize the processing capacities and the possibility of processing efficiency to meet requirements and proposed multi-objective uncertainty planning with the highest resource reuse efficiency and the lowest construction cost. In this paper, we designed a hybrid intelligent algorithm to find the solution, used the neural network to approximate the uncertainty function, and adopted the genetic algorithm to find the optimal solution. In the process of case design, we discussed the specific justifications for setting up each parameter, and we obtained specific values. Finally, the optimal solution was obtained by programming. The results show that compared to the subjective data determination using only historical experience, using this model to construct the pig-industry chain under the circular economy system can effectively utilize the lowest cost to make the waste, wastewater treatment scale and efficiency achieve the standard required by management. Moreover, this model can give the specific direction and flow of circular resources, which makes the operation of the circular economy clearer and therefore conducive to the sustainable development of the pig-industry chain.
Although in the construction of the model we considered as many factors as possible that affect the cyclic economy of the pig-industry chain, there are still some factors that are not taken into account in the study due to the difficulty in quantifying them and due to the remarkable increase in the complexity of the system, such as the time-variant characteristics of pig weights in the whole process, the transport-cost variations that may be produced in distributing the cyclic material in different themes, the matching between wastewater and waste-processing time and their demand. These factors will also affect the effectiveness of the pig-industry recycling economy. In further research, we will focus on the variations of each chain theme in a spatial location and capacity and the dynamic change characteristics of the paths in practice to optimize the cyclic pig-economy system and to obtain more practicable and effective results.

Acknowledgments

The authors gratefully acknowledge the support provided by the National Social Science Foundation in China and the ”Twelfth Five-year” key constructive disciplines of Hunan Province, China. The authors also would like to thank Central South University (China) and Hunan International Economics University (China) for research grants.

Author Contributions

The paper represents the effort of both authors. Xing Liu drafted this manuscript, established the research paper design and paper methodology, conducted the policy analysis, and prepared the figures. Xu Xiao supervised and assisted with the editing and co-authorship of the manuscript. Both authors have read and approved the final manuscript.

Conflicts of Interest

The authors declare no conflict of interest.

References

  1. Zhu, D.; Zhu, Y. Deepen Theoretical Studies of Circular Economy under the Background of Eco-Civilization. Bull. Chin. Acad. Sci. 2013, 2, 207–218. (In Chinese) [Google Scholar]
  2. Boulding, K.E. The Economies of the Coming spaceship Earth. In Environmental Quality in a Growing Eeonomy; Jarrett, H., Ed.; Resources for the Future, Johns HoPkins University Press: Baltimore, MD, USA, 1966. [Google Scholar]
  3. Mathews, J.A.; Tang, Y.M.; Tan, H. China’s Move to a Circular Economy as a Development Strategy. Asian Bus. Manag. 2011, 10, 463–484. [Google Scholar] [CrossRef]
  4. Su, B.; Heshmati, A.; Geng, Y.; Yu, X. A Review of the Circular Economy in China: Moving from Rhetoric to Implementation? J. Clean. Product. 2013, 42, 215–227. [Google Scholar] [CrossRef]
  5. The State Council of China. Notice of Issuing the Recycle Economy Development Strategy & Immediate Plan of Action by the State Council of China; The State Council of China: Beijing, China, 2013. [Google Scholar]
  6. Green, K.W., Jr.; Zelbst, P.J.; Meacham, J.; Bhadauria, V.S. Green supply chain management practices: Impact on performance. Supply Chain Manag. Int. J. 2012, 17, 290–305. [Google Scholar] [CrossRef]
  7. Ying, J.; Zhou, L. Study on green supply chain mangement based on circular economy. Phys. Procedia 2012, 25, 1682–1688. [Google Scholar] [CrossRef]
  8. Zhu, Q.; Geng, Y.; Lai, K. Environmental Supply Chain Cooperation and Its Effect on the Circular Economy Practice Performance Relationship Among Chinese Manufacturers. J. Ind. Ecol. 2011, 15, 405–419. [Google Scholar] [CrossRef]
  9. Tukker, A. Product services for a resource-efficient and circular economy—A review. J. Clean. Prod. 2015, 97, 76–91. [Google Scholar] [CrossRef]
  10. Topp, E.; Scott, A.; Lapen, D.R.; Lyautey, E.; Duriez, P. Livestock Waste Treatment Systems for Reducing Environmental Exposure to Hazardous Enteric Pathogens: Some Considerations. Bioresour. Echnol. 2009, 100, 5395–5398. [Google Scholar] [CrossRef] [PubMed]
  11. Fu, X. Circular treatment and utilization of wastes from breeding. Beijing Agric. 2011, 134–135. (In Chinese) [Google Scholar]
  12. Dasheng, L.; Davis, J.; Wang, L. Industrialisation and the Sustainability of China’s Agriculture. Econ. Plan. 1998, 31, 213–230. [Google Scholar] [CrossRef]
  13. Mao, L. The development mode of circular economy for the husbandry industry. Feed Expo. 2009, 48–50. (In Chinese) [Google Scholar]
  14. Zhang, O.; Li, W. A study on the circular economic mode for a sustainable development of husbandry in Anhui Province. Ecol. Econ. 2010, 56–58. (In Chinese) [Google Scholar]
  15. Tan, D. Developing agricultural products logistics in China from the perspective of green supply chain. Int. J. Bus. Manag. 2012, 7, 106–112. [Google Scholar] [CrossRef]
  16. East, I.J.; Davis, J.; Sergeant, E.S.G.; Garner, M.G. Structure, dynamics and movement patterns of the Australian pig industry. Aust. Vet. J. 2014, 92, 52–57. [Google Scholar] [CrossRef] [PubMed]
  17. Coleman, G.J.; McGregor, M.; Hemsworth, P.H.; Boyce, J.; Dowline, S. The relationship between beliefs, attitudes and observed behaviours of abattoir personnel in the pig industry. Appl. Anim. Behav. Sci. 2003, 82, 189–200. [Google Scholar] [CrossRef]
  18. Jawahir, I.S.; Rouch, K.E.; Dillon, O.W.; Holloway, L.E.; Hall, A. Design for sustainability (DFS): New challenges in developing and implementing a curriculum for next generation design and manufacturing engineers. Int. J. Eng. Educ. 2007, 23, 1053–1064. [Google Scholar]
  19. Bonneau, M.; Klauke, T.N.; Gonzàlez, J.; Rydhmer, L.; Ilari-Antoine, E.; Dourmad, J.Y.; de Greef, K.; Houwers, H.W.; Cinar, M.U.; Fàbrega, E.; et al. Evaluation of the sustainability of contrasted pig farming systems: Integrated evaluation. Animal 2014, 8, 2058–2068. [Google Scholar] [CrossRef] [PubMed]
  20. Jarrett, H. Environmental Quality in a Growing Economy; The Johns Hopkins University Press: Baltimore, MD, USA, 1966. [Google Scholar]
  21. Yang, W. The Research of Agricultural Development of Cyclic Economy in Ningxia Province. Ph.D. Thesis, Northwest Sci-Tech University of Agriculture and Forestry, Xi’an, China, 2008. [Google Scholar]
  22. Gan, L. Environmental pollution of massive livestock nad poultry breeding and prevention measures. Stud. Farming Mach. 2006, 22–24. (In Chinese) [Google Scholar]
  23. Mc Donough, W.; Braungart, M. A world of abundance. Interfaces 2000, 30, 55–65. [Google Scholar] [CrossRef]
  24. He, J.; Zheng, J. Study on the recycling and utilization of excrement of livestock and poultry. Jiangsu Agric. Sci. 2011, 487–488. (In Chinese) [Google Scholar]
  25. Wang, J.; Chen, R. The industrialization strategy of ecological agriculture and sustainable urban/rural development in China. Environ. Sustain. Dev. 2007, 92, 46–48. (In Chinese) [Google Scholar]
  26. Teira-Esmatges, M.R.; Flotats, X. A method for livestock waste management planning in NE Spain. Waste Manag. 2003, 23, 917–932. [Google Scholar] [CrossRef]
  27. Zinflou, A.; Gagne, C.; Gravel, M. GISMOO: A new hybrid genetic/immune strategy for multiple-objective optimization. Comput. Oper. Res. 2012, 39, 1951–1968. [Google Scholar] [CrossRef]
  28. Wang, F.; Lai, X.; Shi, N. A multi-objective optimization for green supply chain network design. Decis. Support Syst. 2011, 51, 262–269. [Google Scholar] [CrossRef]
  29. Pishvaee, M.S.; Razmi, J. Environmental supply chain network design using multi-objective fuzzy mathematical programming. Appl. Math. Model. 2012, 36, 3433–3446. [Google Scholar] [CrossRef]
  30. Pinto-Varela, T.; Barbosa-Póvoa, A.P.F.D.; Novais, A.Q. Bi-objective optimization approach to the design and planning of supply chains: Economic versus environmental performances. Comput. Chem. Eng. 2011, 35, 1454–1468. [Google Scholar] [CrossRef]
  31. Pishvaee, M.S.; Torabi, S.A. A possibilistic programming approach for closed-loop supply chain network design under uncertainty. Fuzzy Sets Syst. 2010, 161, 2668–2683. [Google Scholar] [CrossRef]
  32. Pishvaee, M.S.; Rabbani, M.; Torabi, S.A. A robust optimization approach to closed-loop supply chain network design under uncertainty. Appl. Math. Model. 2011, 35, 637–649. [Google Scholar] [CrossRef]
  33. Kenne, J.P.; Dejax, P.; Gharbi, A. Production planning of a hybrid manufacturing–remanufacturing system under uncertainty within a closed-loop supply chain. Int. J. Prod. Econ. 2012, 135, 81–93. [Google Scholar] [CrossRef]
  34. Chankong, V.; Cooper, W.W. Chance-constrained programming. Manag. Sci. 1969, 6, 73–79. [Google Scholar]
  35. Liu, B. Theory and Practice of Uncertain Programming; Physica-Verlag: Heidelberg, Germany, 2015. [Google Scholar]
  36. Jaszkiewicz, A. Genetic local search for multi-objective combinatory optimization. Eur. J. Oper. Res. 2002, 137, 50–71. [Google Scholar] [CrossRef]
  37. Liu, B.; Chen, X.W. Uncertain multi-objective programming and uncertain goal programming. J. Uncertain. Anal. Appl. 2015, 3, 10. [Google Scholar] [CrossRef]
  38. Javadi, A.A.; Farmani, R.; Tan, T.P. A hybrid Genetic Algorithm, Advanced Engineering. Informatics 2005, 19, 255–262. [Google Scholar]
  39. Faramarzi, A.; Alani, A.M.; Harireche, O. A Hybrid Approach to Design Materials with Negative Linear Compressibility. Comput. Mater. Sci. 2013, 79, 971–976. [Google Scholar] [CrossRef]
  40. Faramarzi, A.; Alani, A.M.; Javadi, A.A. An EPR-based self-learning approach to material modelling. Comput. Struct. 2014, 137, 63–71. [Google Scholar] [CrossRef]
  41. Yao, K.; Chen, X.W. A numerical method for solving uncertain differential equations. J. Intell. Fuzzy Syst. 2013, 25, 825–832. [Google Scholar]
  42. He, K.-L.; Peng, T. Green Supply Chain Management Model and Its Implementation Strategy for Pig Industry—A Case of Pig Industry in Chongqing City. Res. Agric. Mod. 2011, 32, 440–444. [Google Scholar]
  43. Wang, Z.; Liu, M.; Feng, Z.; Hua, L.; Xie, J.; Shao, G. A New Model of Recycling Agricultural Production. Agric. Sci. Technol. 2013, 14, 466–469, 537. [Google Scholar]
  44. Wang, Z.; Liu, Z.; Yang, T.; Fu, Q.; Ji, D. Engineering examples of high concentration livestock wastewater recycling system. J. Anhui Agric. Sci. 2013, 41, 6297–6299. [Google Scholar]
  45. Kůrková, V. Kolmogorov’s theorem and multilayer neural networks. Neural Netw. 1992, 5, 501–506. [Google Scholar] [CrossRef]
  46. Venkataraman, P. Applied Optimization with MATLAB Programming; Wiley Publishing: Hoboken, NJ, USA, 2009. [Google Scholar]

