
Analysis of the Influence of the Stability Factors of PV/T-SAHP on the Performance of the System


Abstract
:1. Introduction
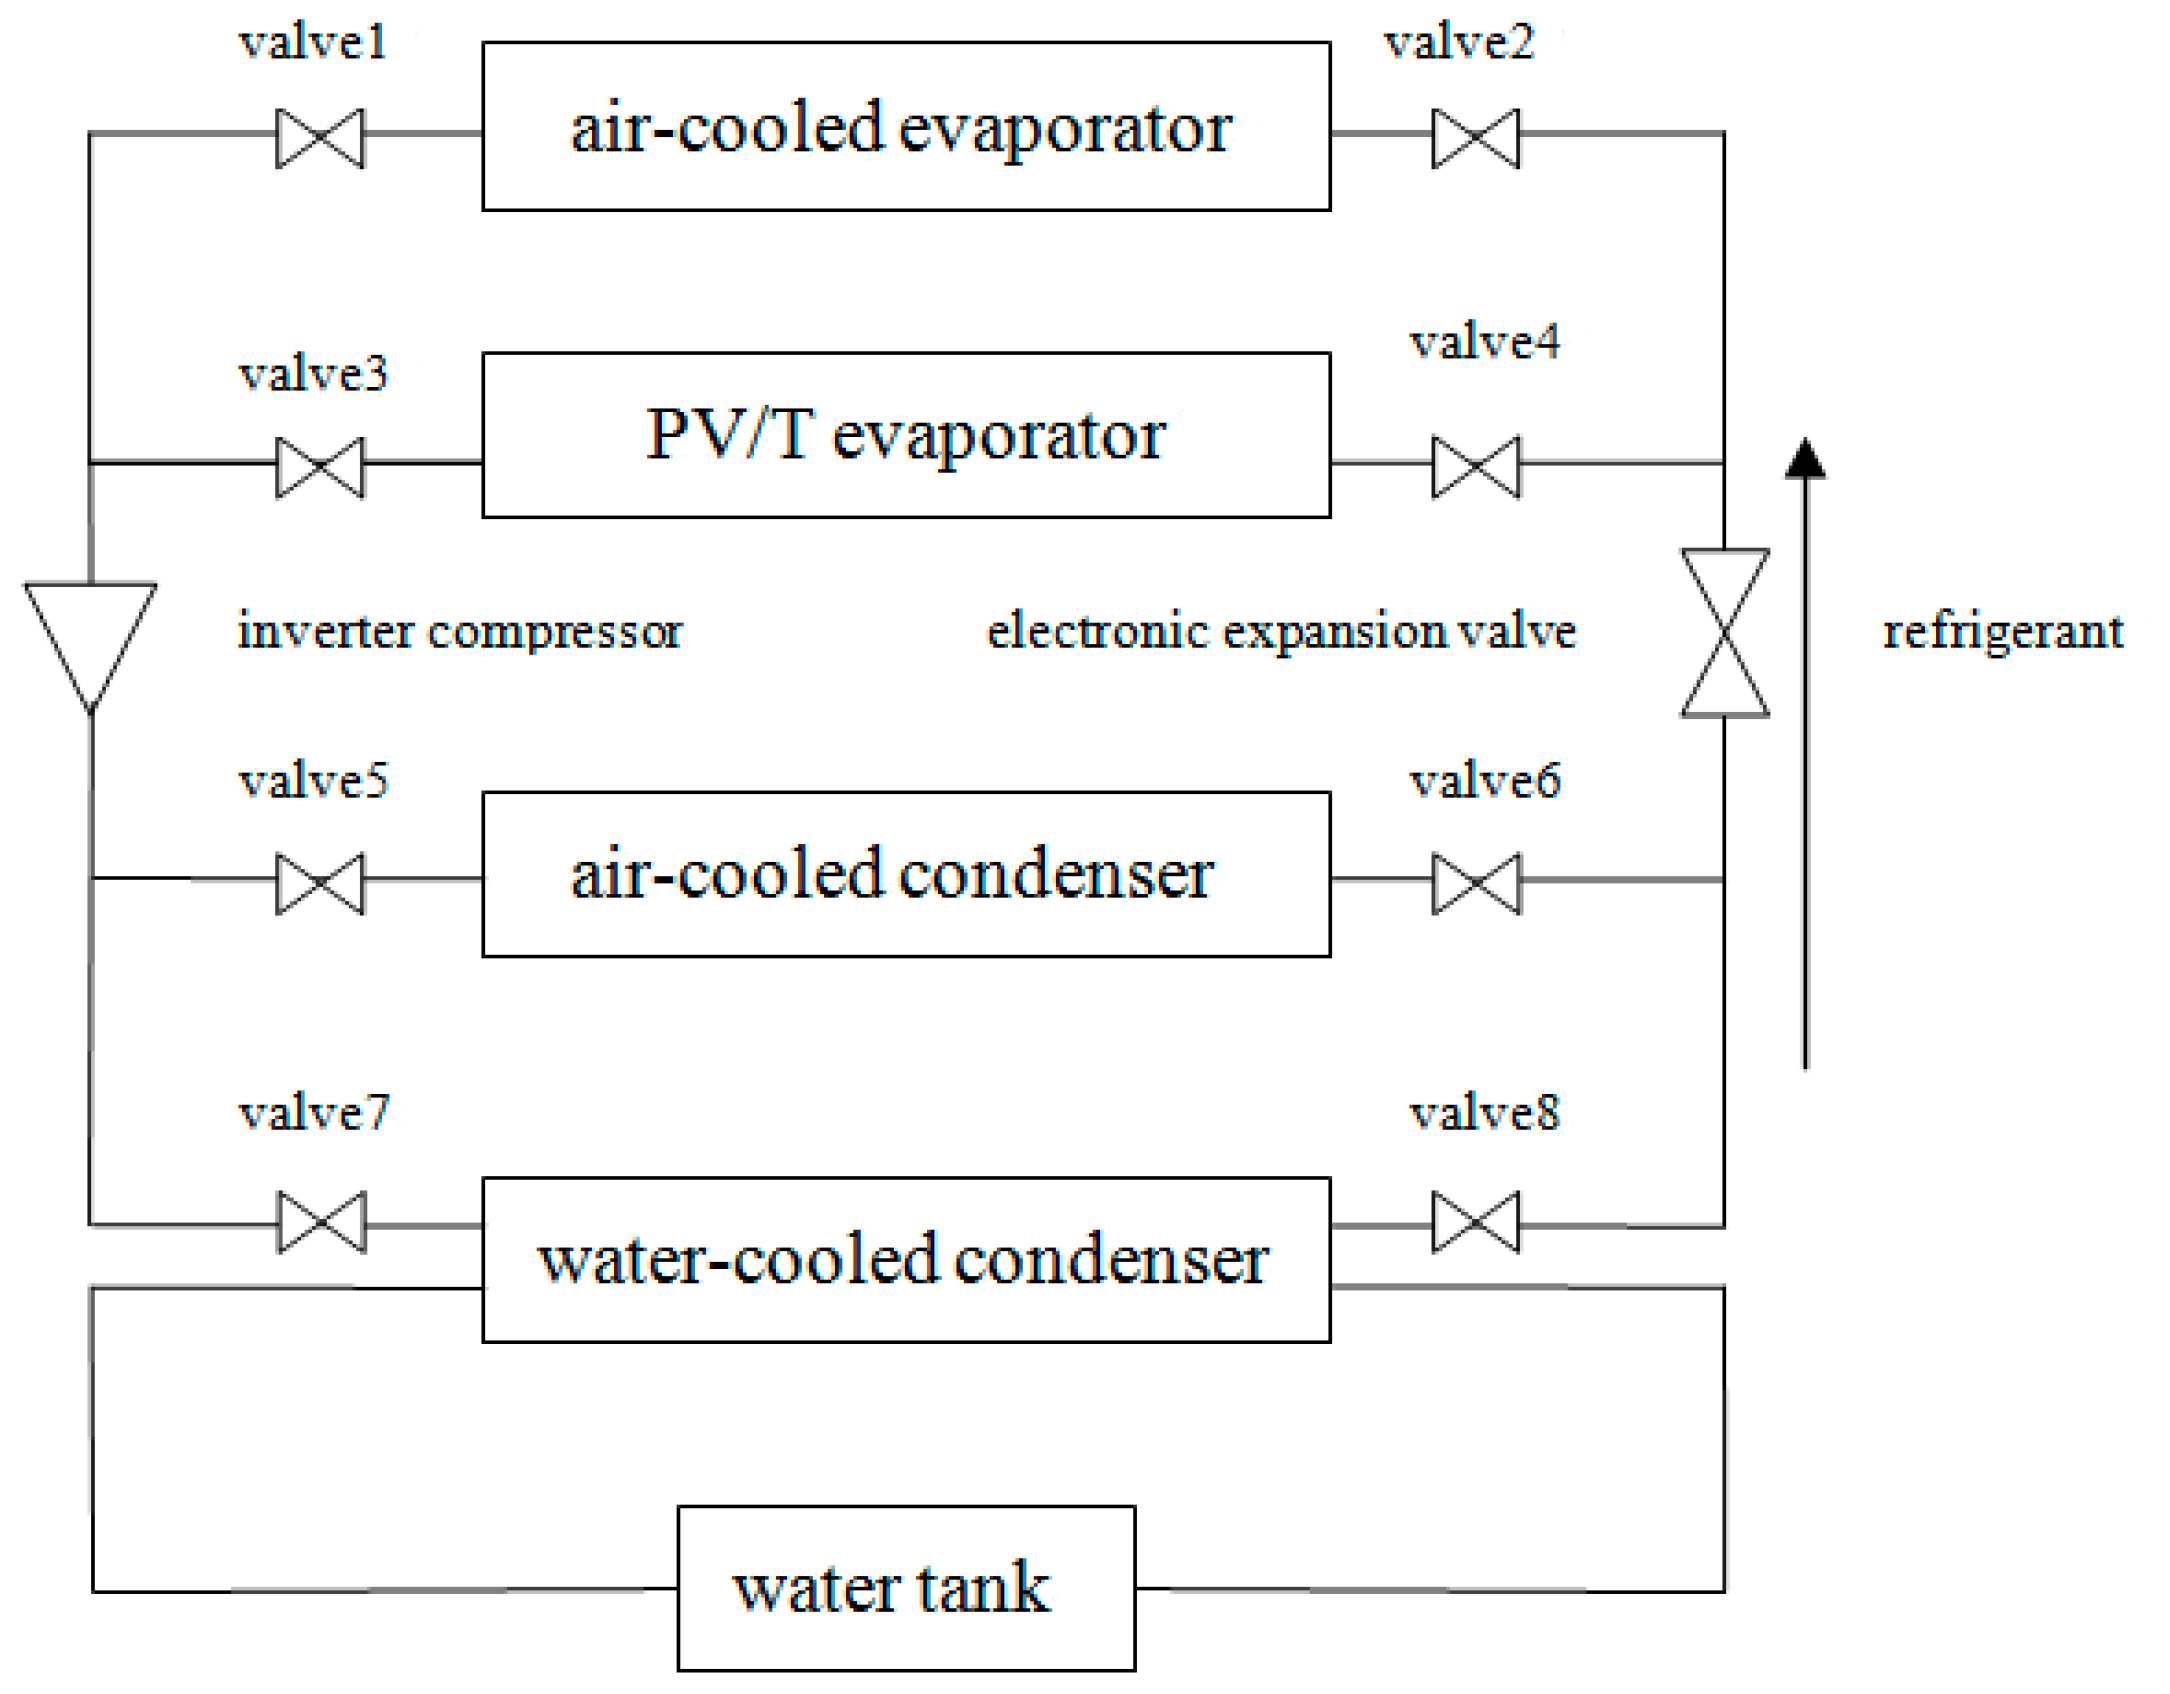
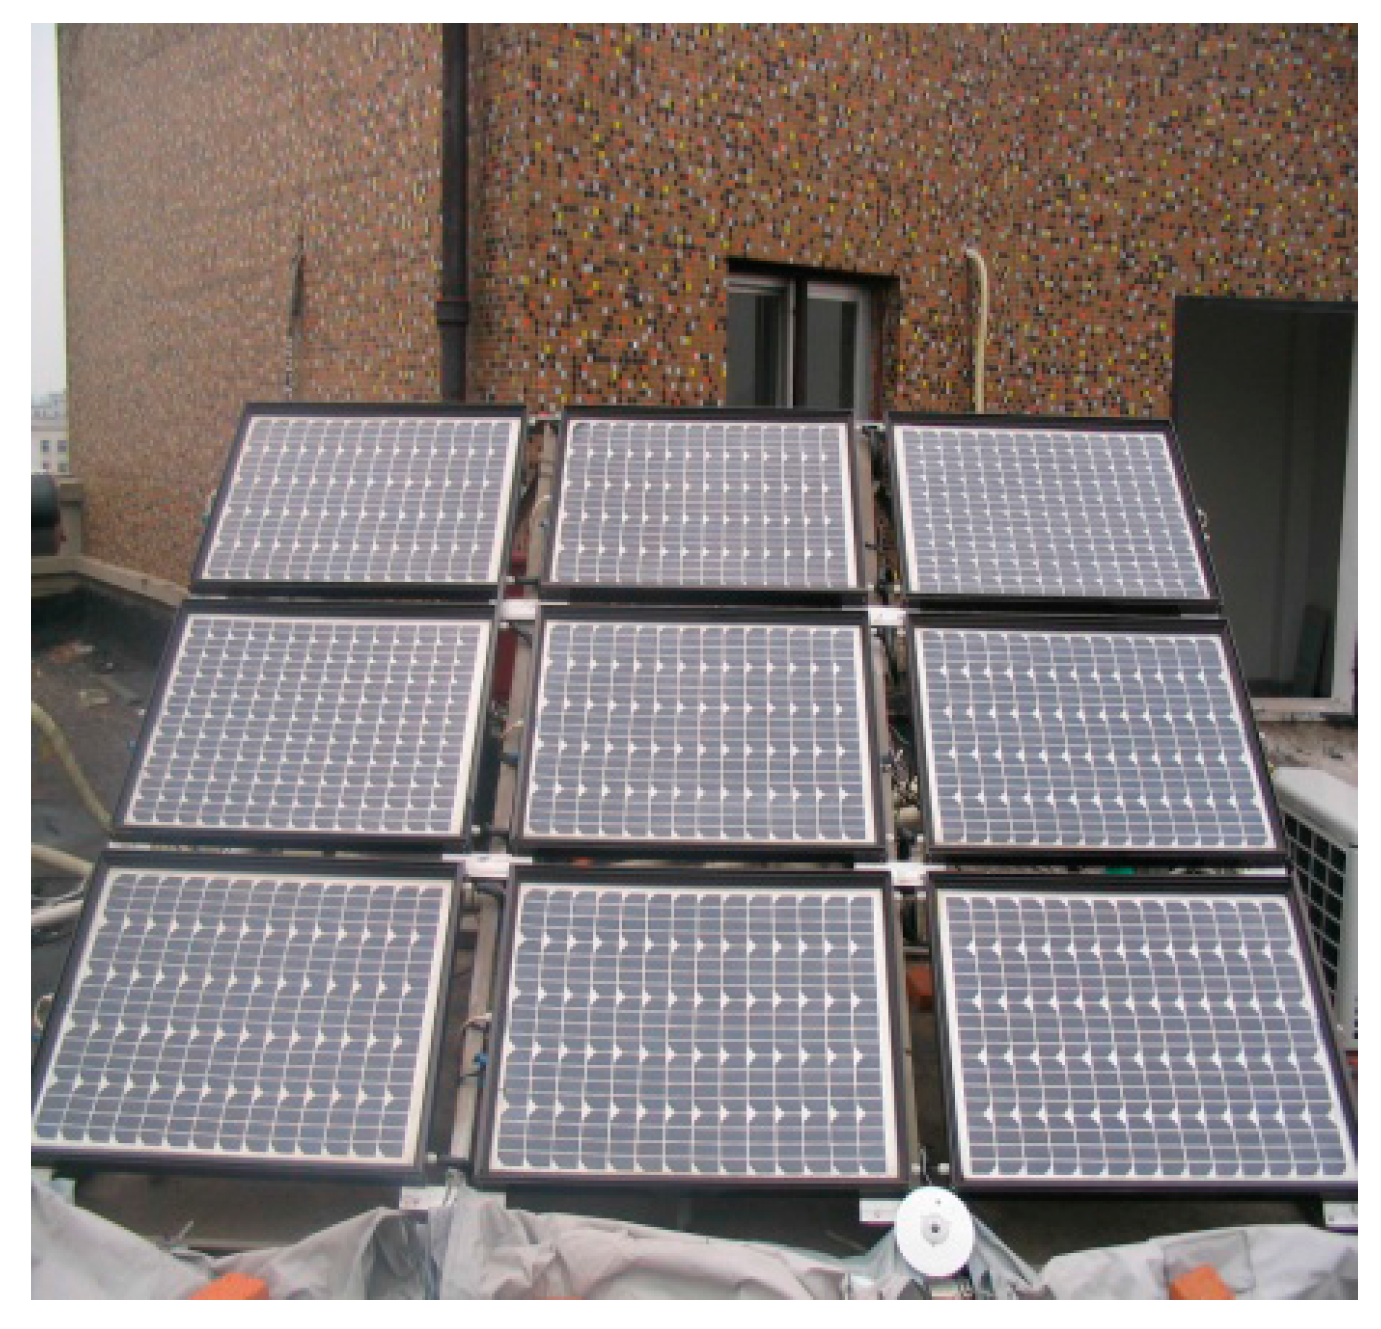
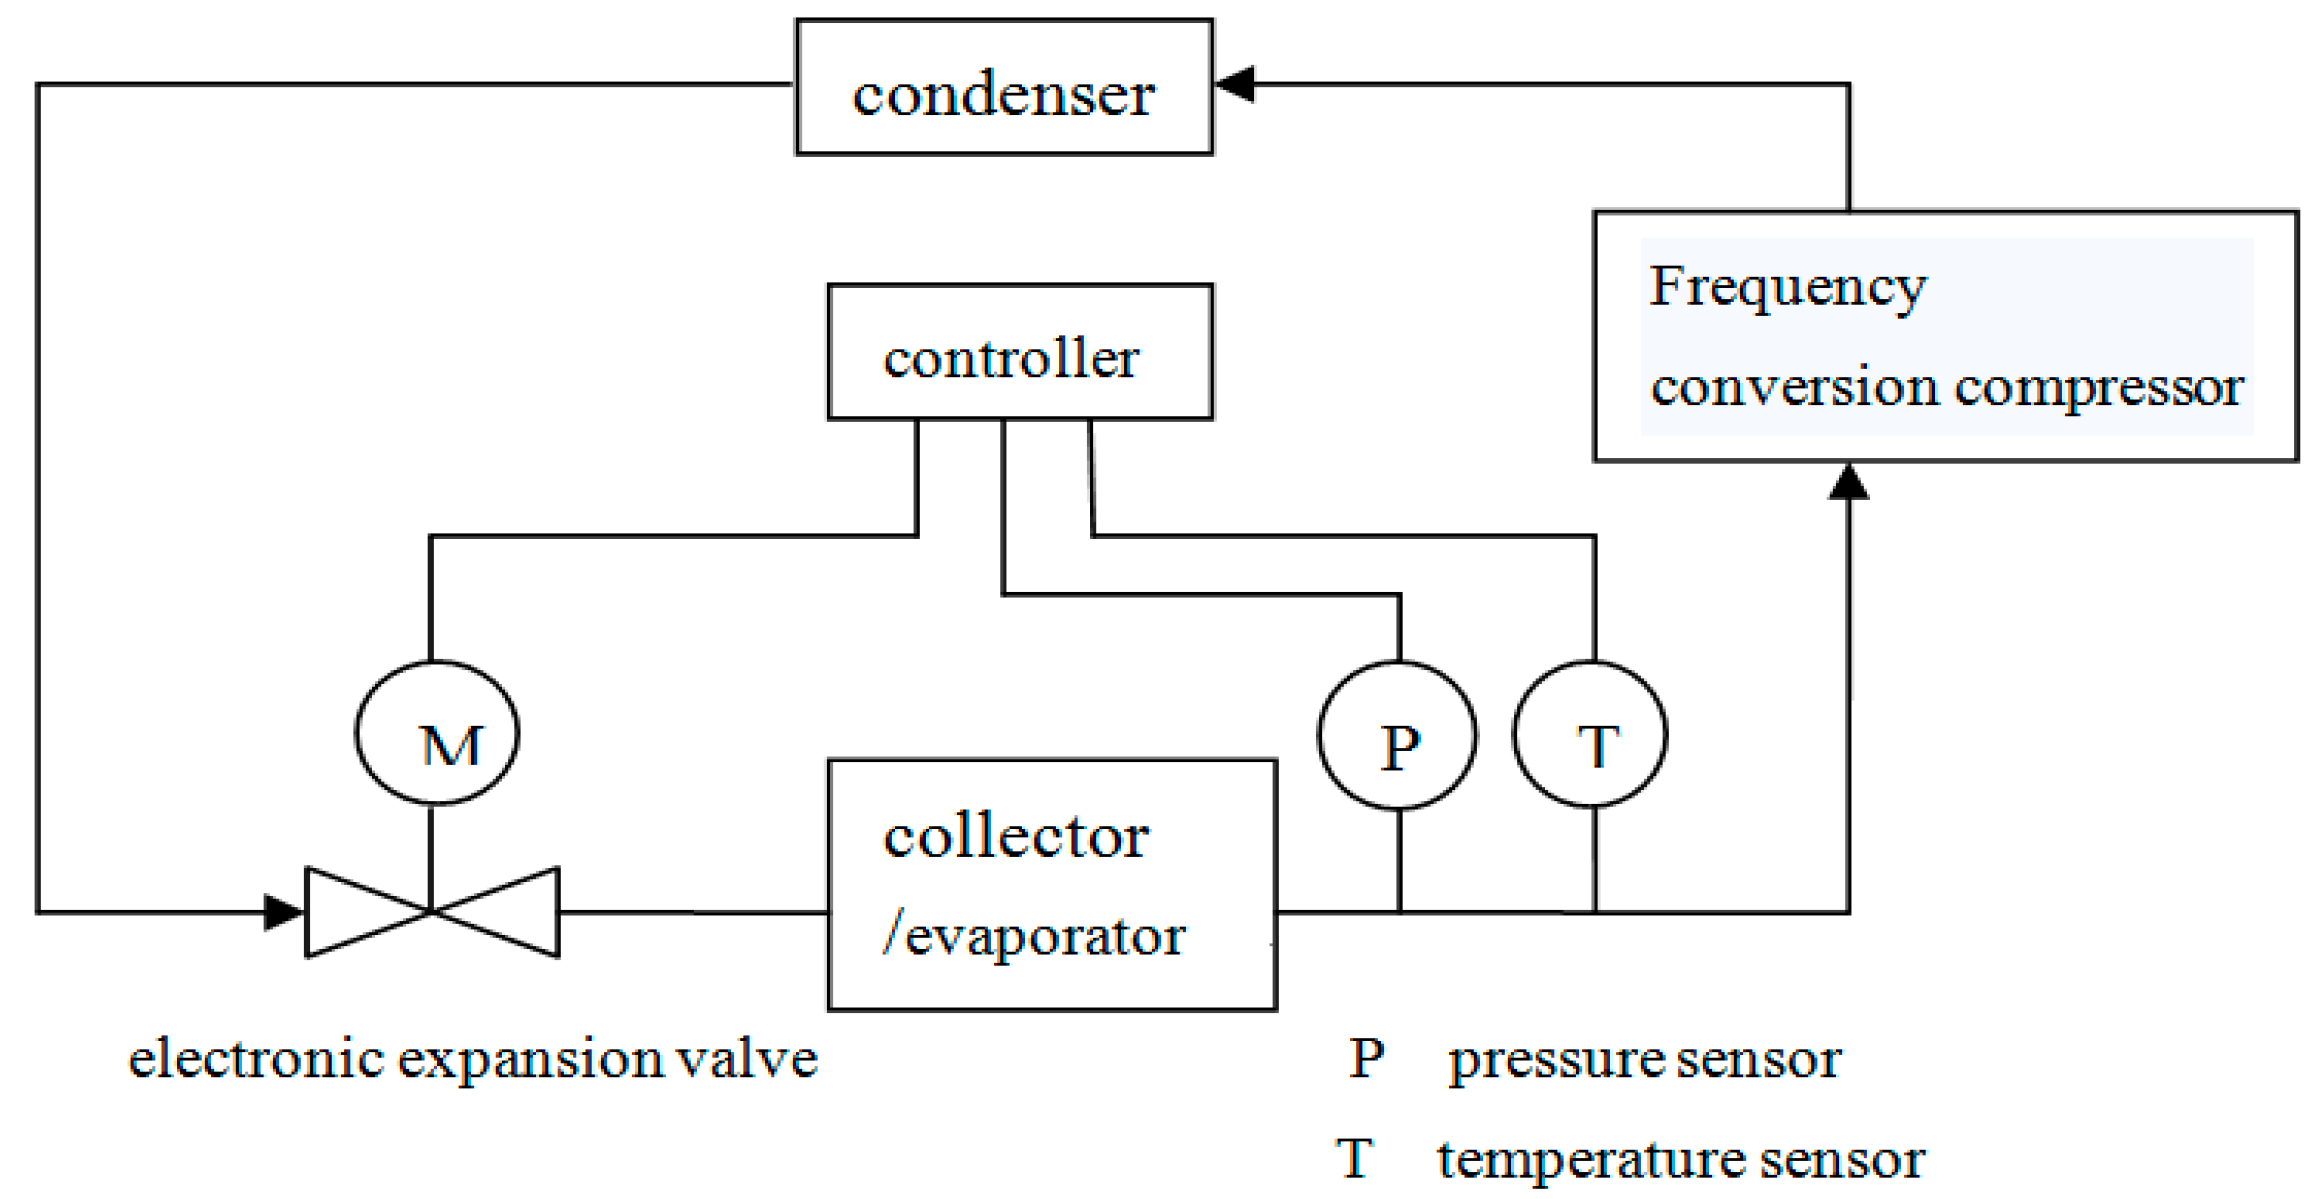
2. System Design
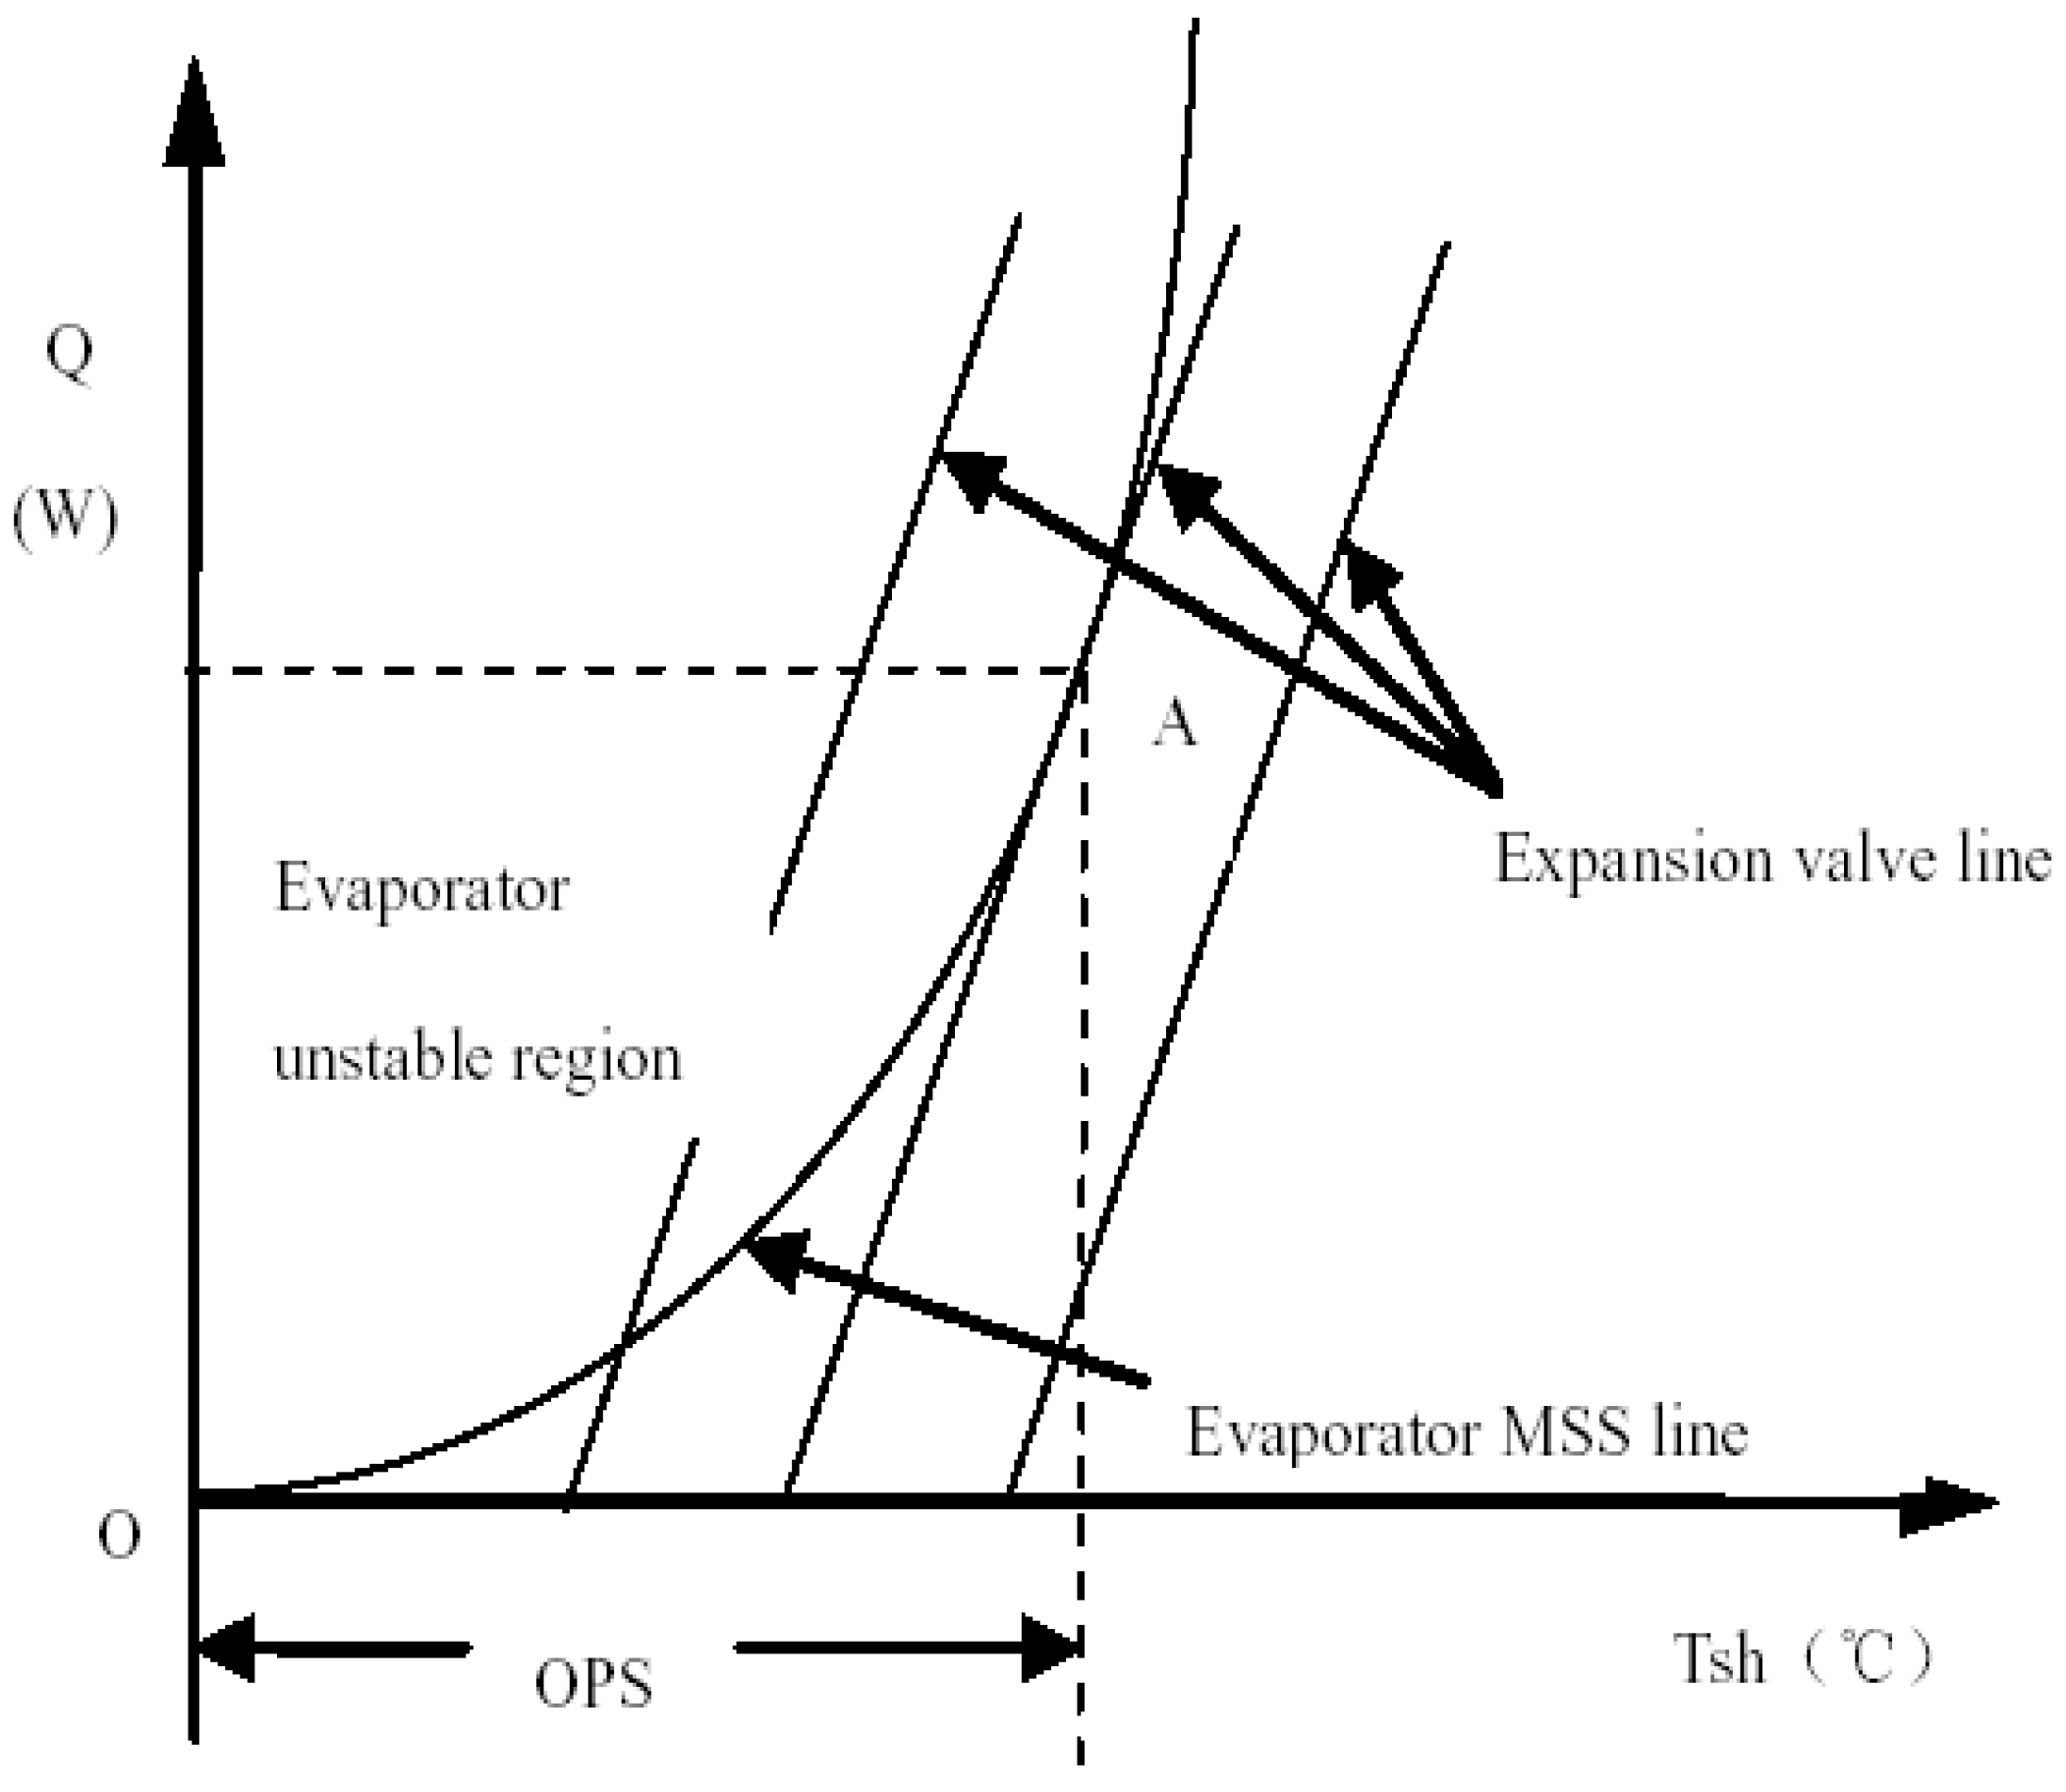
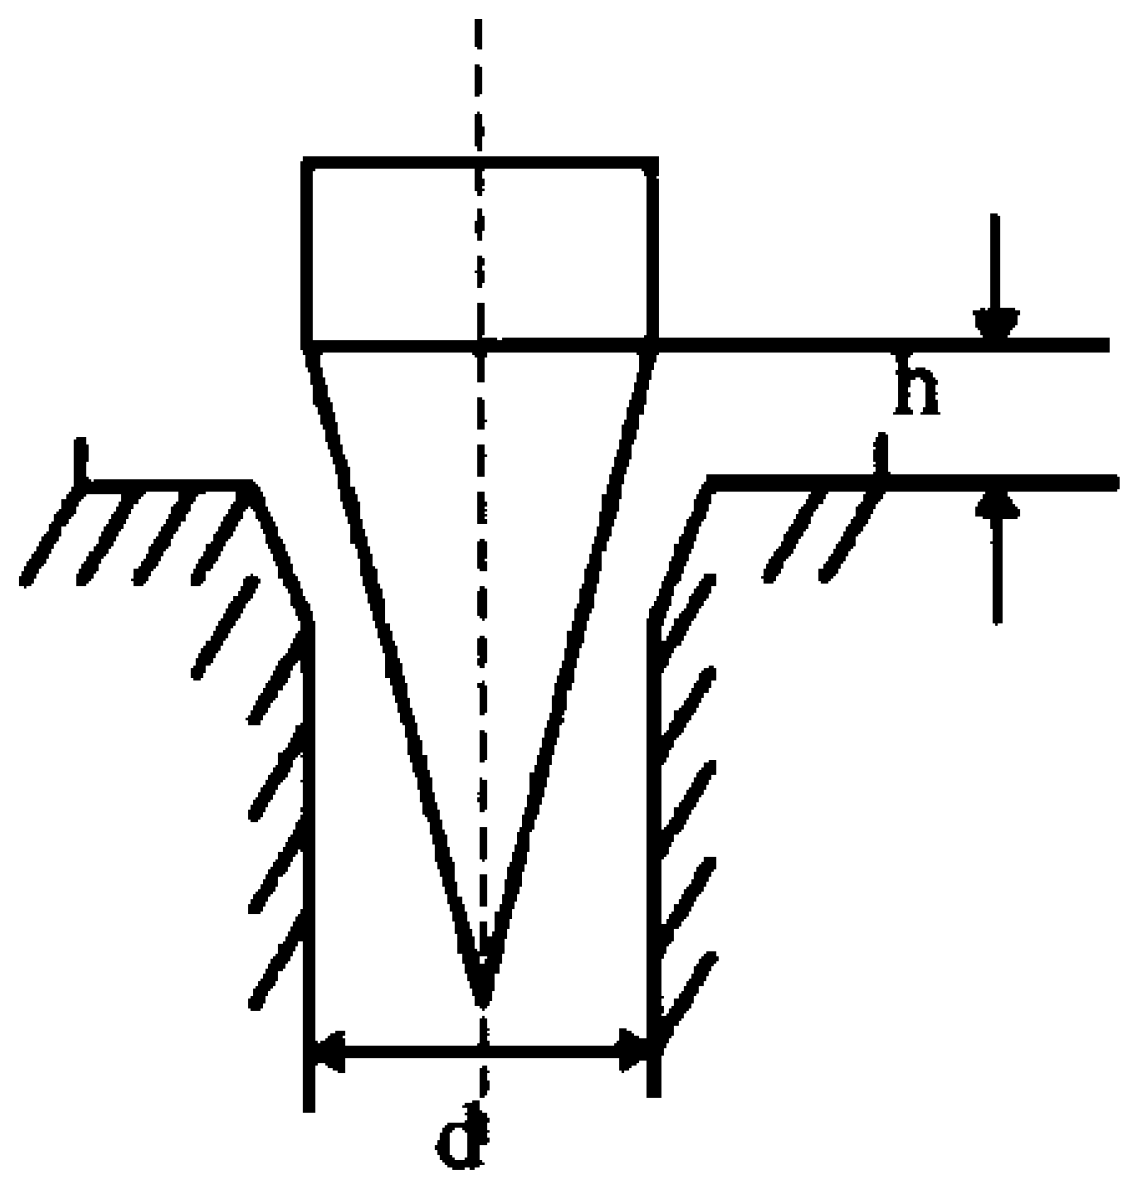
3. Matching Relations between the EEV and the Evaporator
4. System Simulation
4.1. Mathematical Models for System Apparatus
4.1.1. Mathematical Models for Compressor
4.1.2. Mathematic Model for Photovoltaic Evaporator
- is the heat loss of collector’s top ()
- is the thermal conductivity of heat insulating layer at the bottom of the collector (W/m·K)
- is the thickness of heat insulating layer at the bottom of the collector (mm)
- is the thermal conductivity of lamination layer at the bottom of the collector (W/m·K)
- is the thickness of lamination layer at the bottom of the collector (mm)
- is the space between heat-absorbing tubes (mm)
- is the diameter of heat-absorbing tubes (mm)
- is the collector’s efficiency factor
- is the collector’s heat transfer factor
- is the coefficient of heat convection between refrigerant within the tube and the tube wall (W/m2·K)
- is collector’s effective yield (W)
- is the solar panel area (m2)
- is the product of penetration rate and absorption rate of solar perpendicular incidence and diffuse radiation against the solar panel
- is the photoelectric conversion efficiency
- is solar irradiation intensity
- is the average temperature of refrigerants within tubes of the collector (°C)
- is the environment temperature (°C)
- is refrigerants’ mass flow (kg/s)
- is the specific heat capacity under a constant pressure (kJ/(kg·k))
- is the number of overlying layers
- is the temperature of heat-collection plates (°C)
- is the coefficient of heat convection caused by wind (W/m2·K)
- is the emissivity of heat-collection plates
- is the emissivity of the glass layer
- is collector’s inclination angle
- is the wind speed (m/s)
4.1.3. Mathematical Model for EEV

4.1.4. Mathematical Model for Heat Exchanger in Water Tank
4.1.5. Thermophysical Model for Refrigerating Medium within the Heat Hump
- (1)
- Vapor space state equation:
- (2)
- Saturated vapor pressure equation:
- (3)
- Saturated liquid density equation:
- (4)
- Specific heat equation of ideal gas at a constant volume:
- (5)
- Specific enthalpy equation of ideal gas at a constant volume:
- (6)
- Specific entropy equation of ideal gas at a constant volume:
- (7)
- Enthalpy equation of saturated liquid:
- (8)
- Entropy equation of saturated liquid:
- (9)
- Enthalpy and entropy equation of wet vapor:
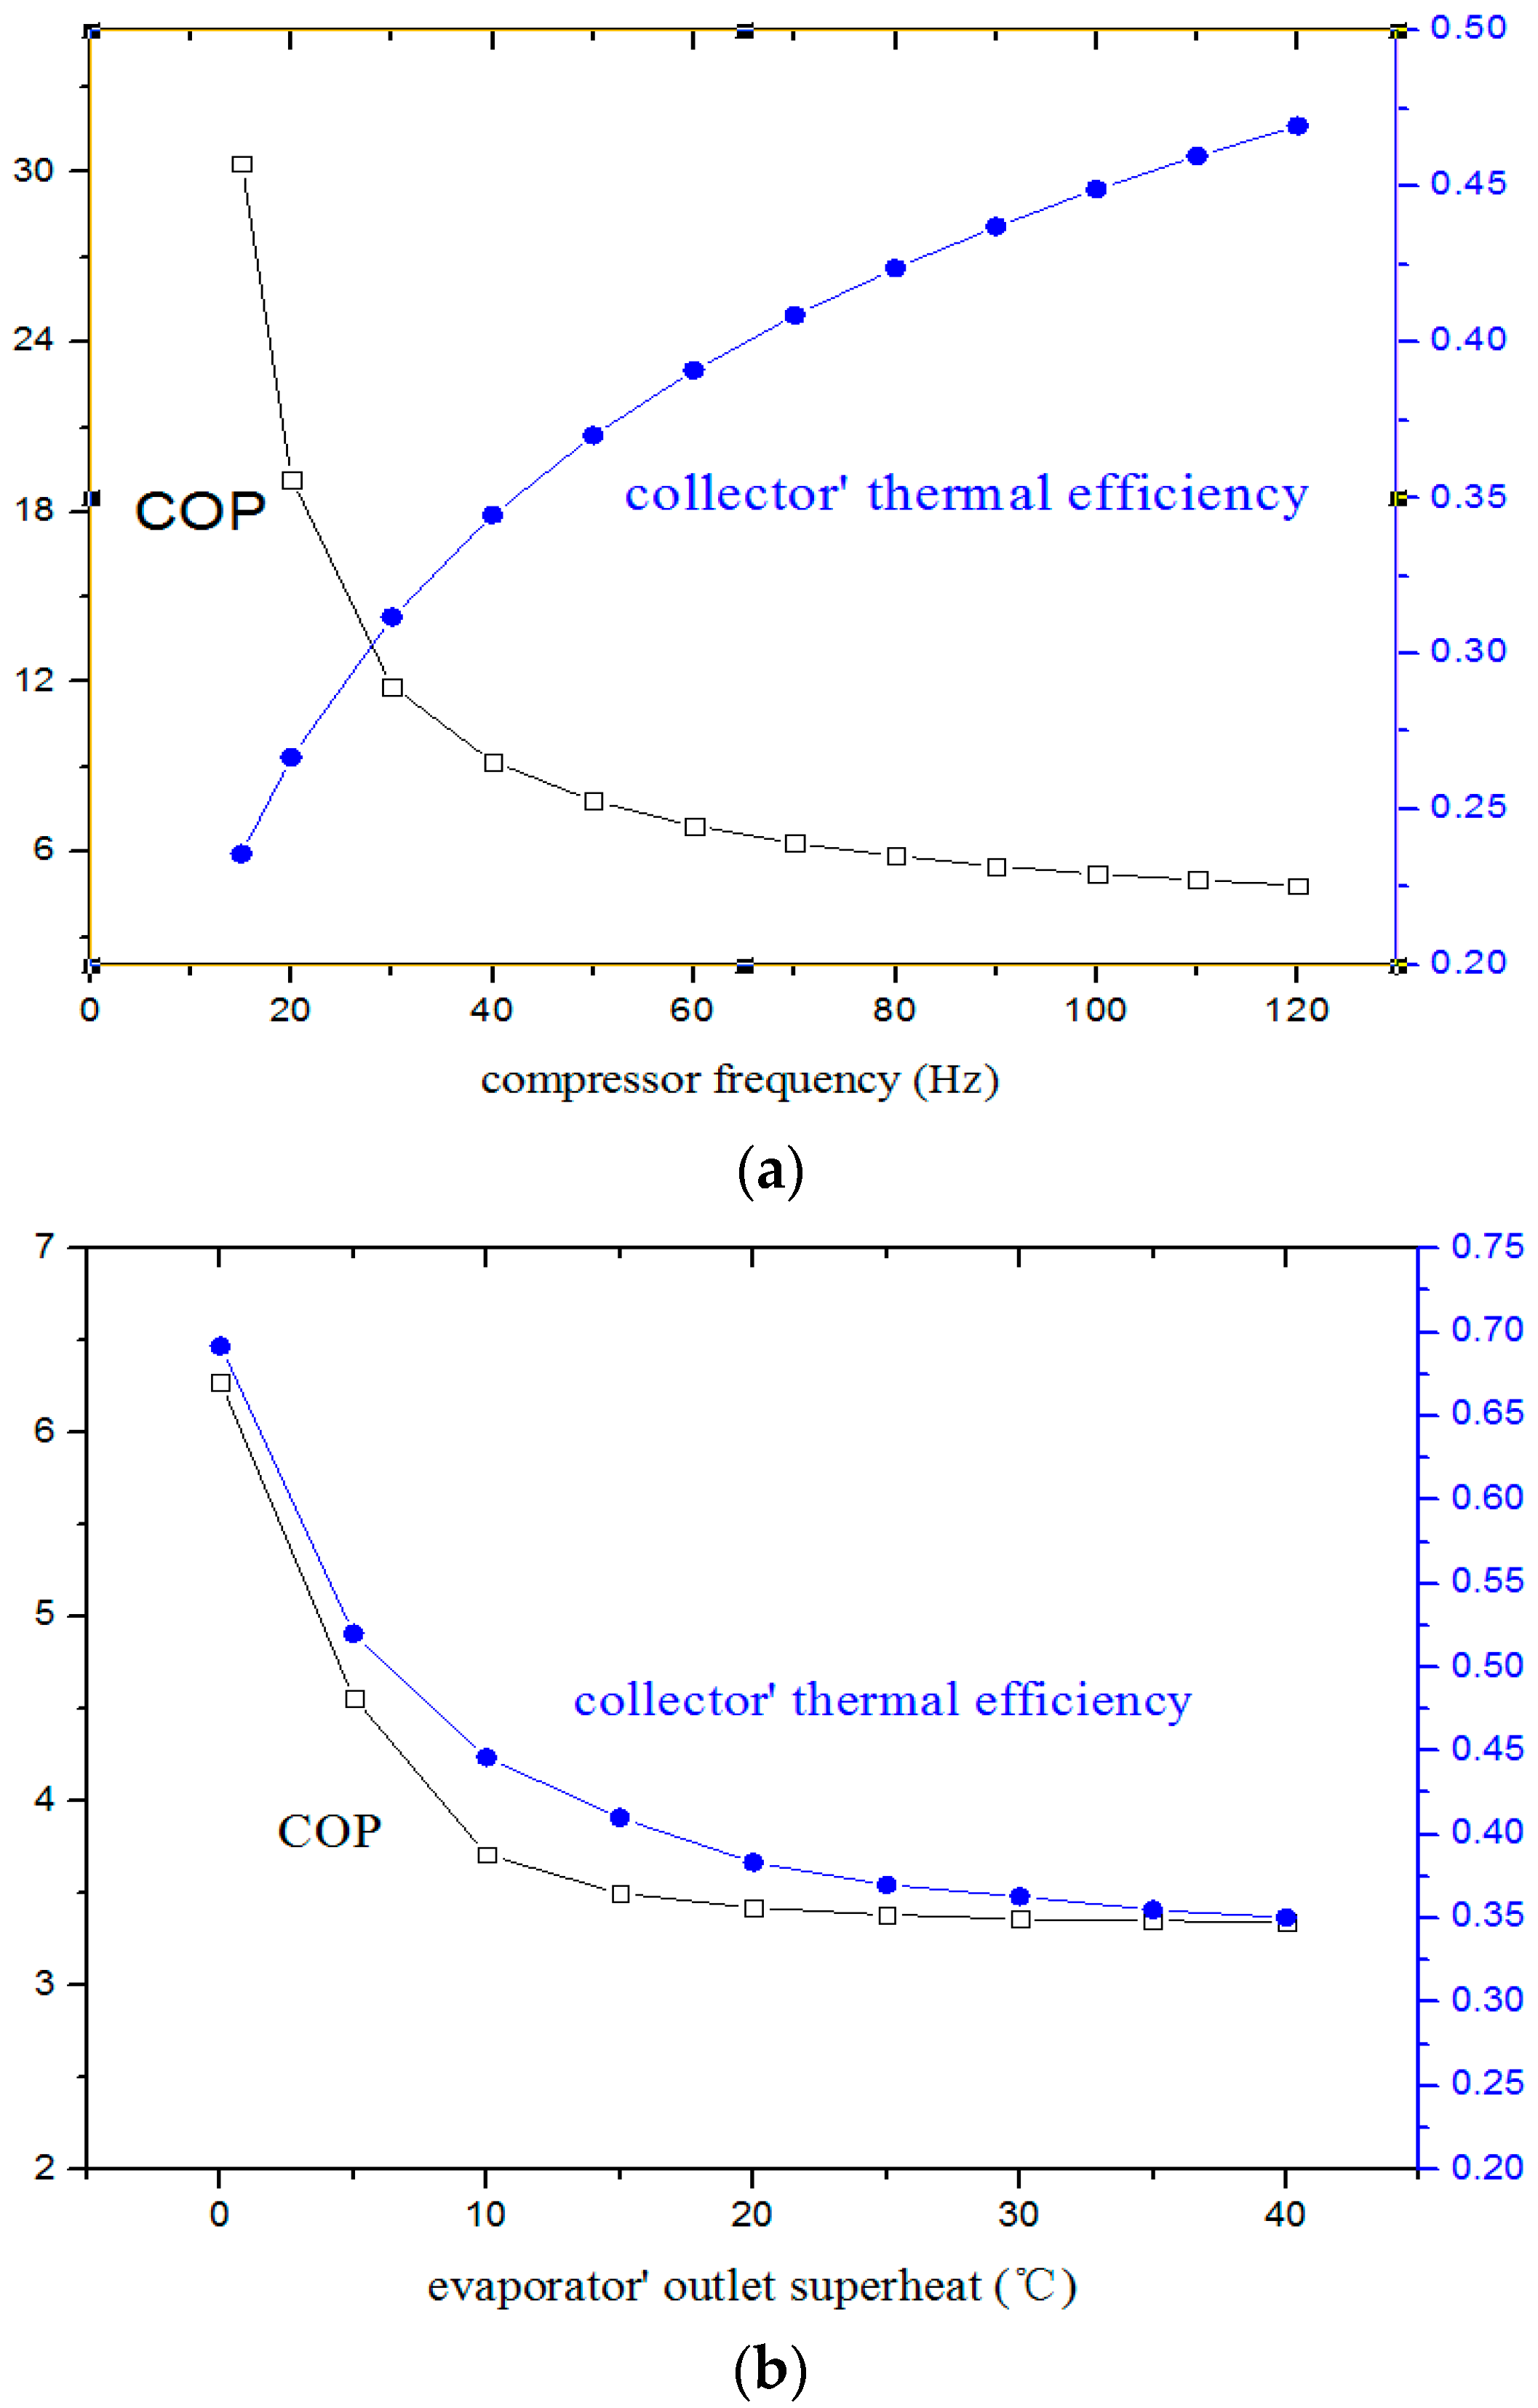
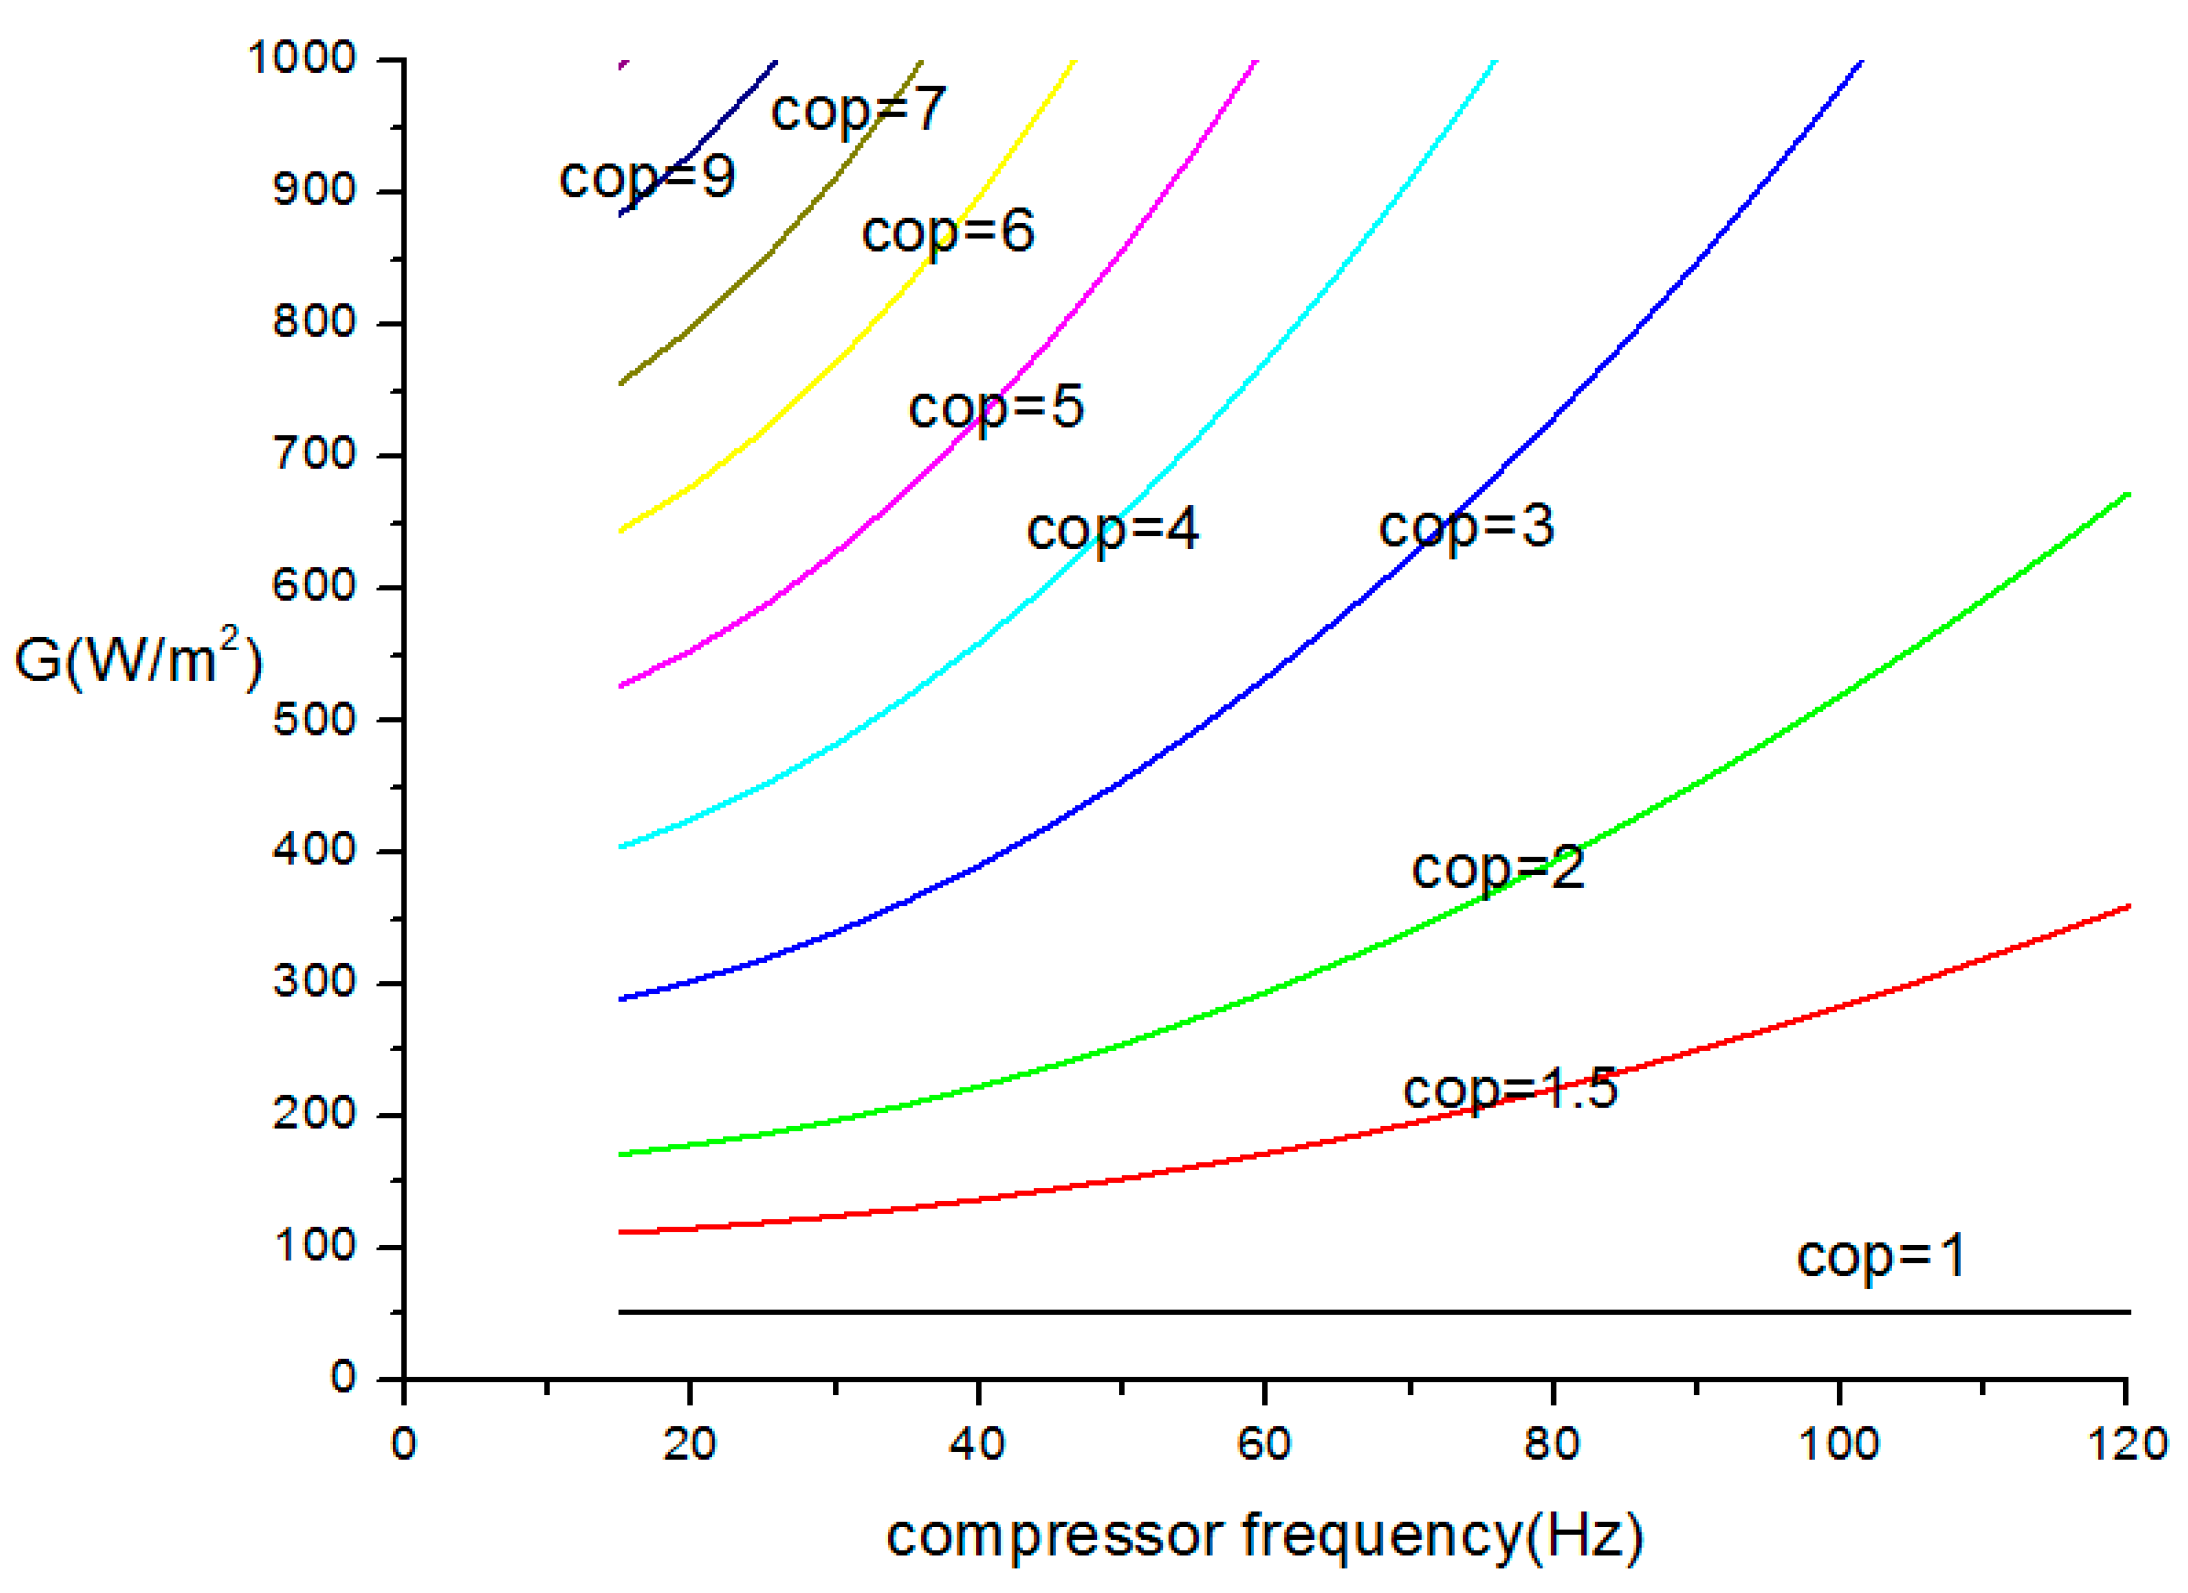
4.2. Simulation Results and Discussion


5. Test on System
5.1. Test with Increasing Condensing Water Temperature and Varying EEV Opening Pulse
5.1.1. Test Conditions

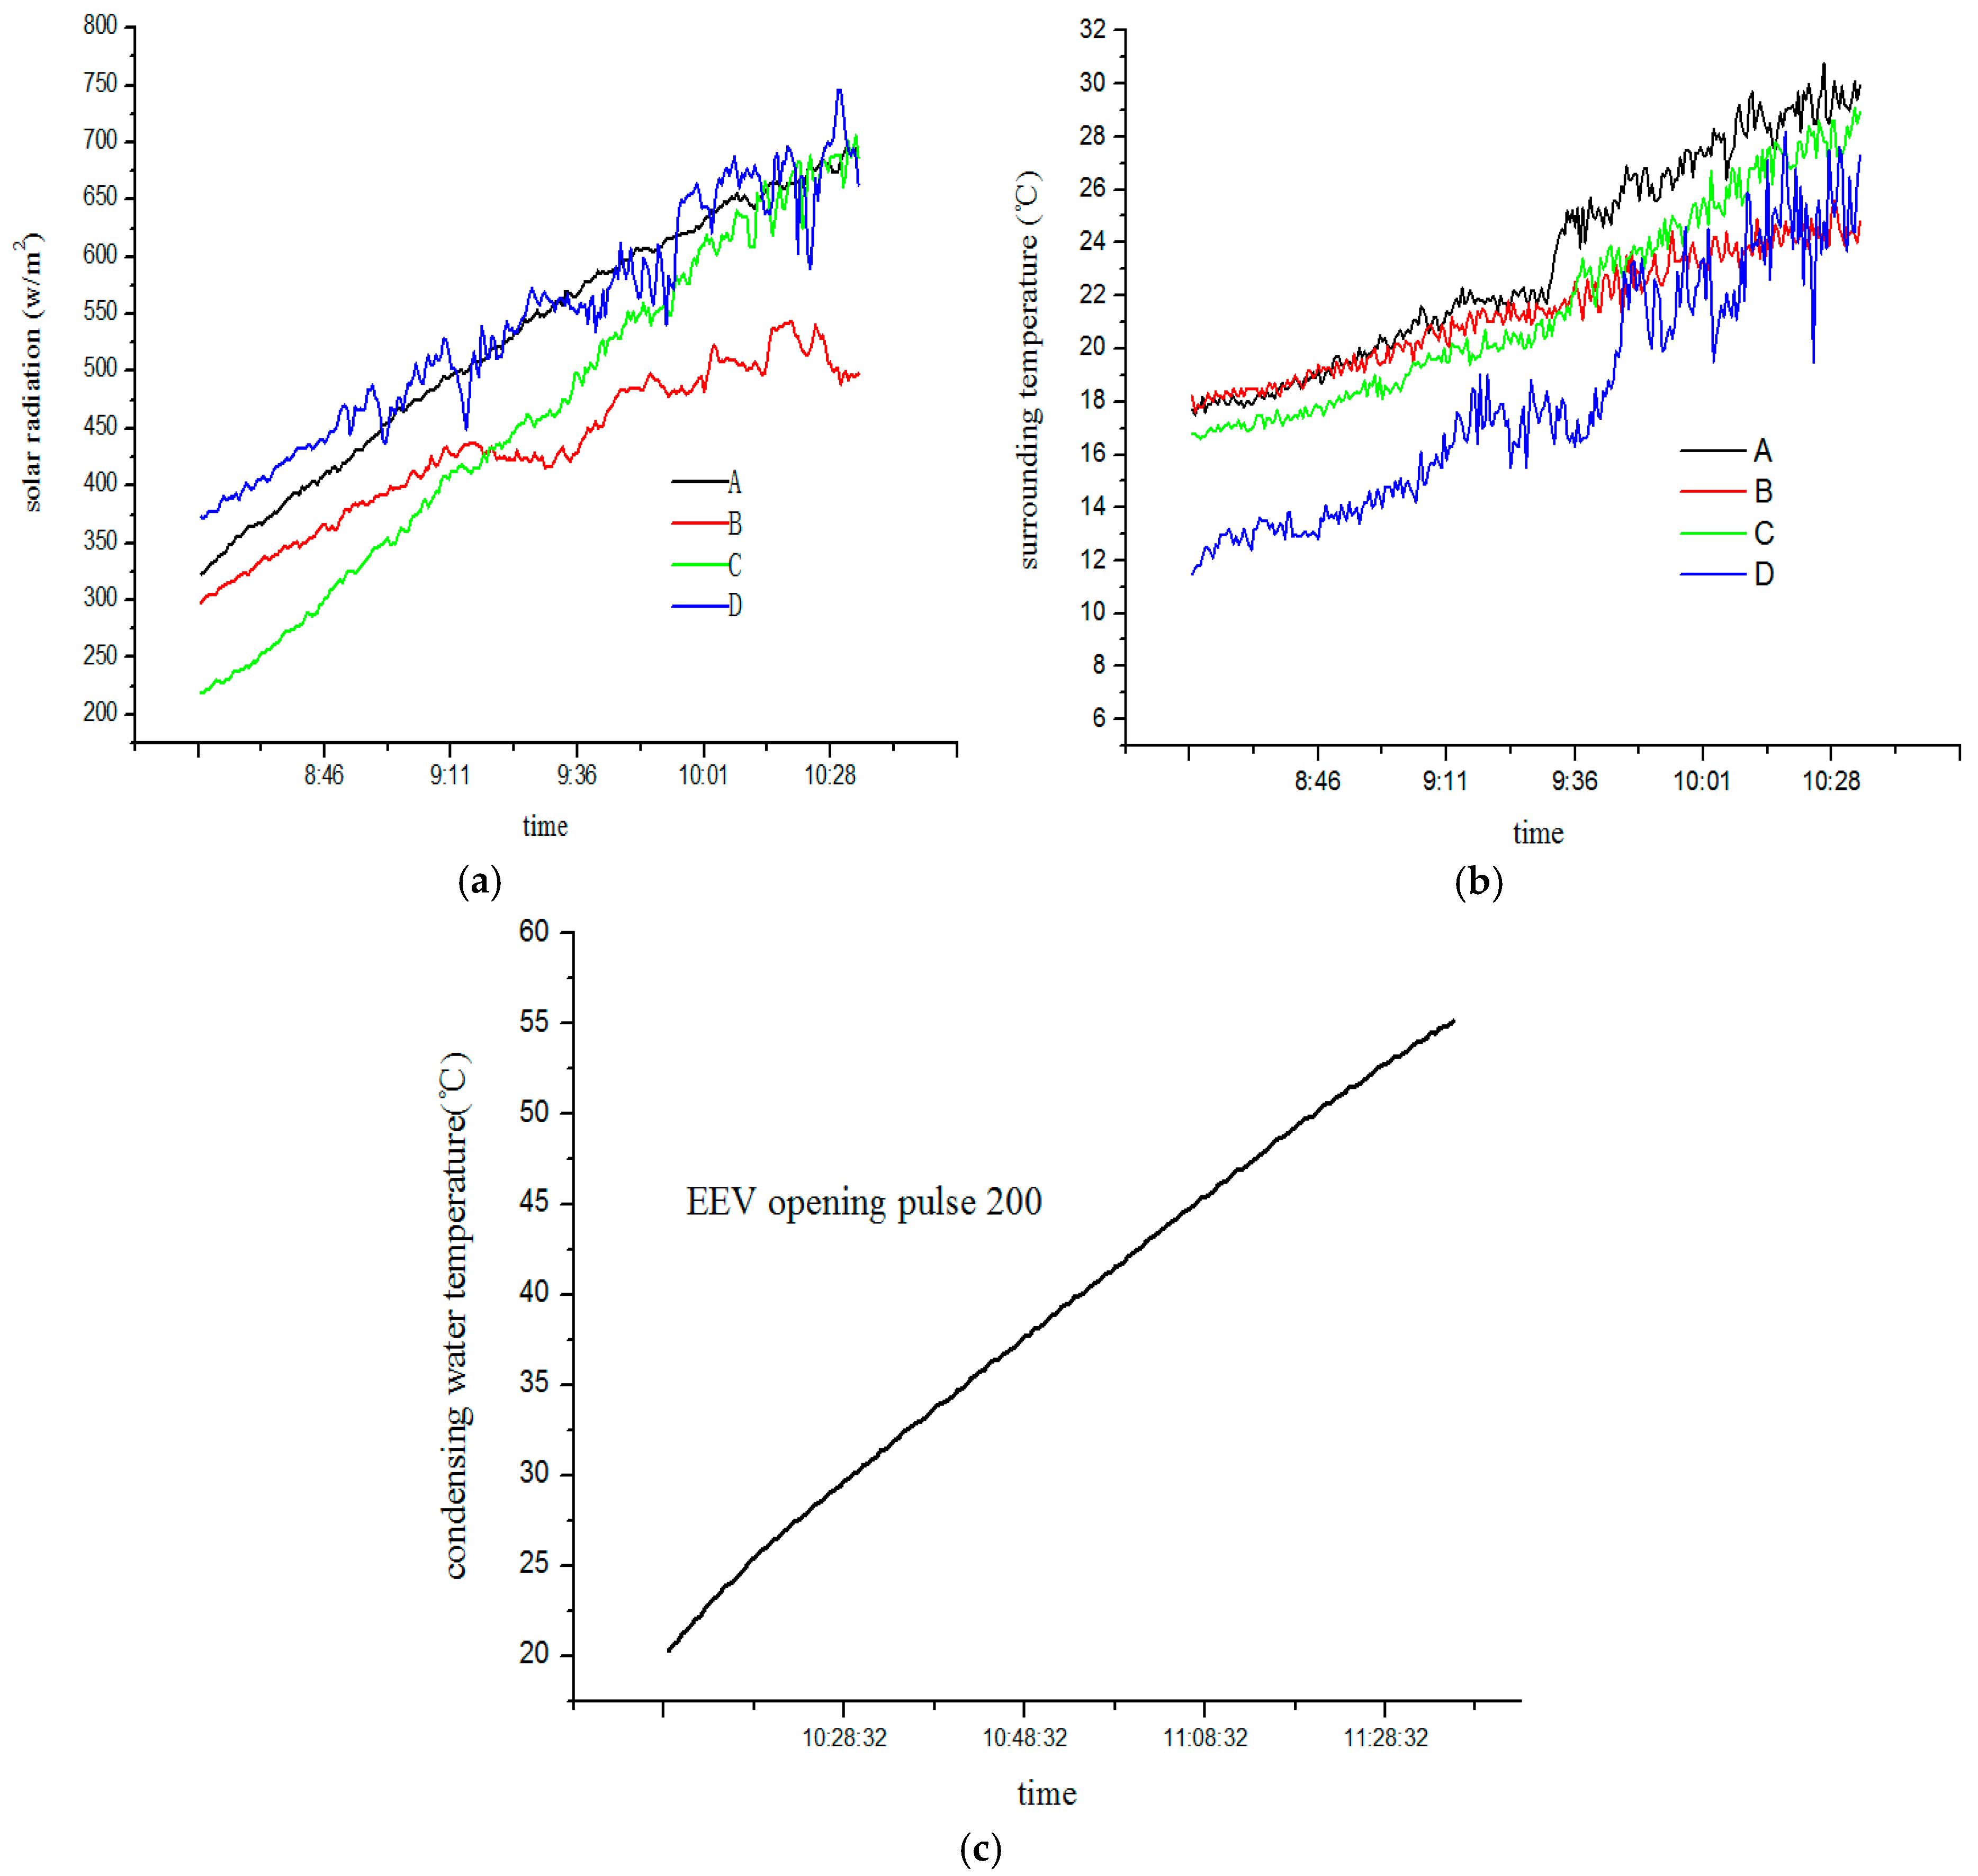
| EEV Opening Pulse | Inlet Water Temperature (°C) | Time for Test | Sign as |
|---|---|---|---|
| 100 | 20 ± 0.2 °C | 2 November 2014 | A |
| 200 | 20 ± 0.2 °C | 31 October 2014 | B |
| 300 | 20 ± 0.2 °C | 1 November 2014 | C |
| 400 | 20 ± 0.2 °C | 23 October 2014 | D |

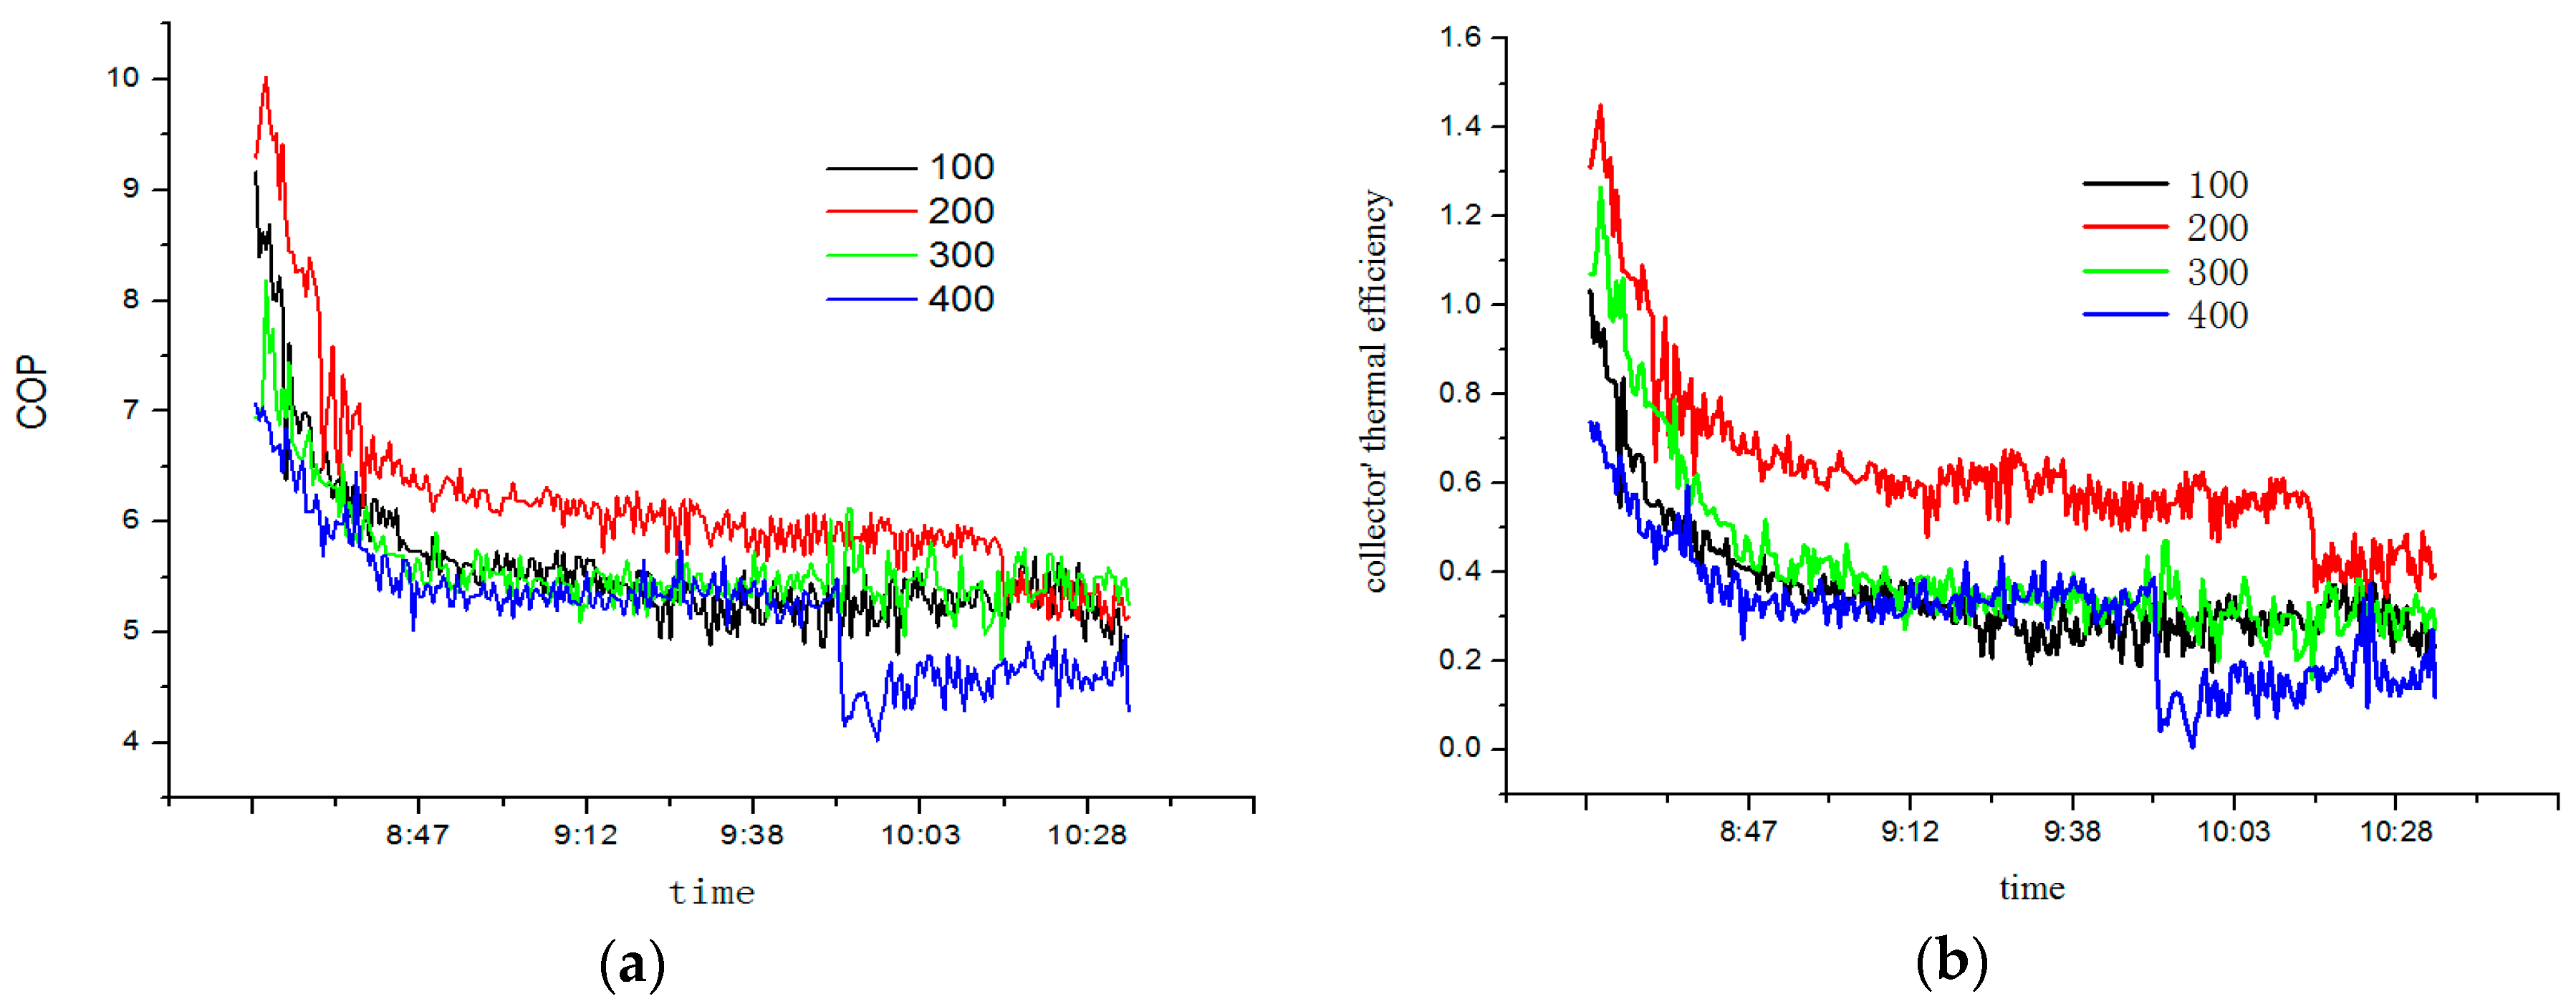
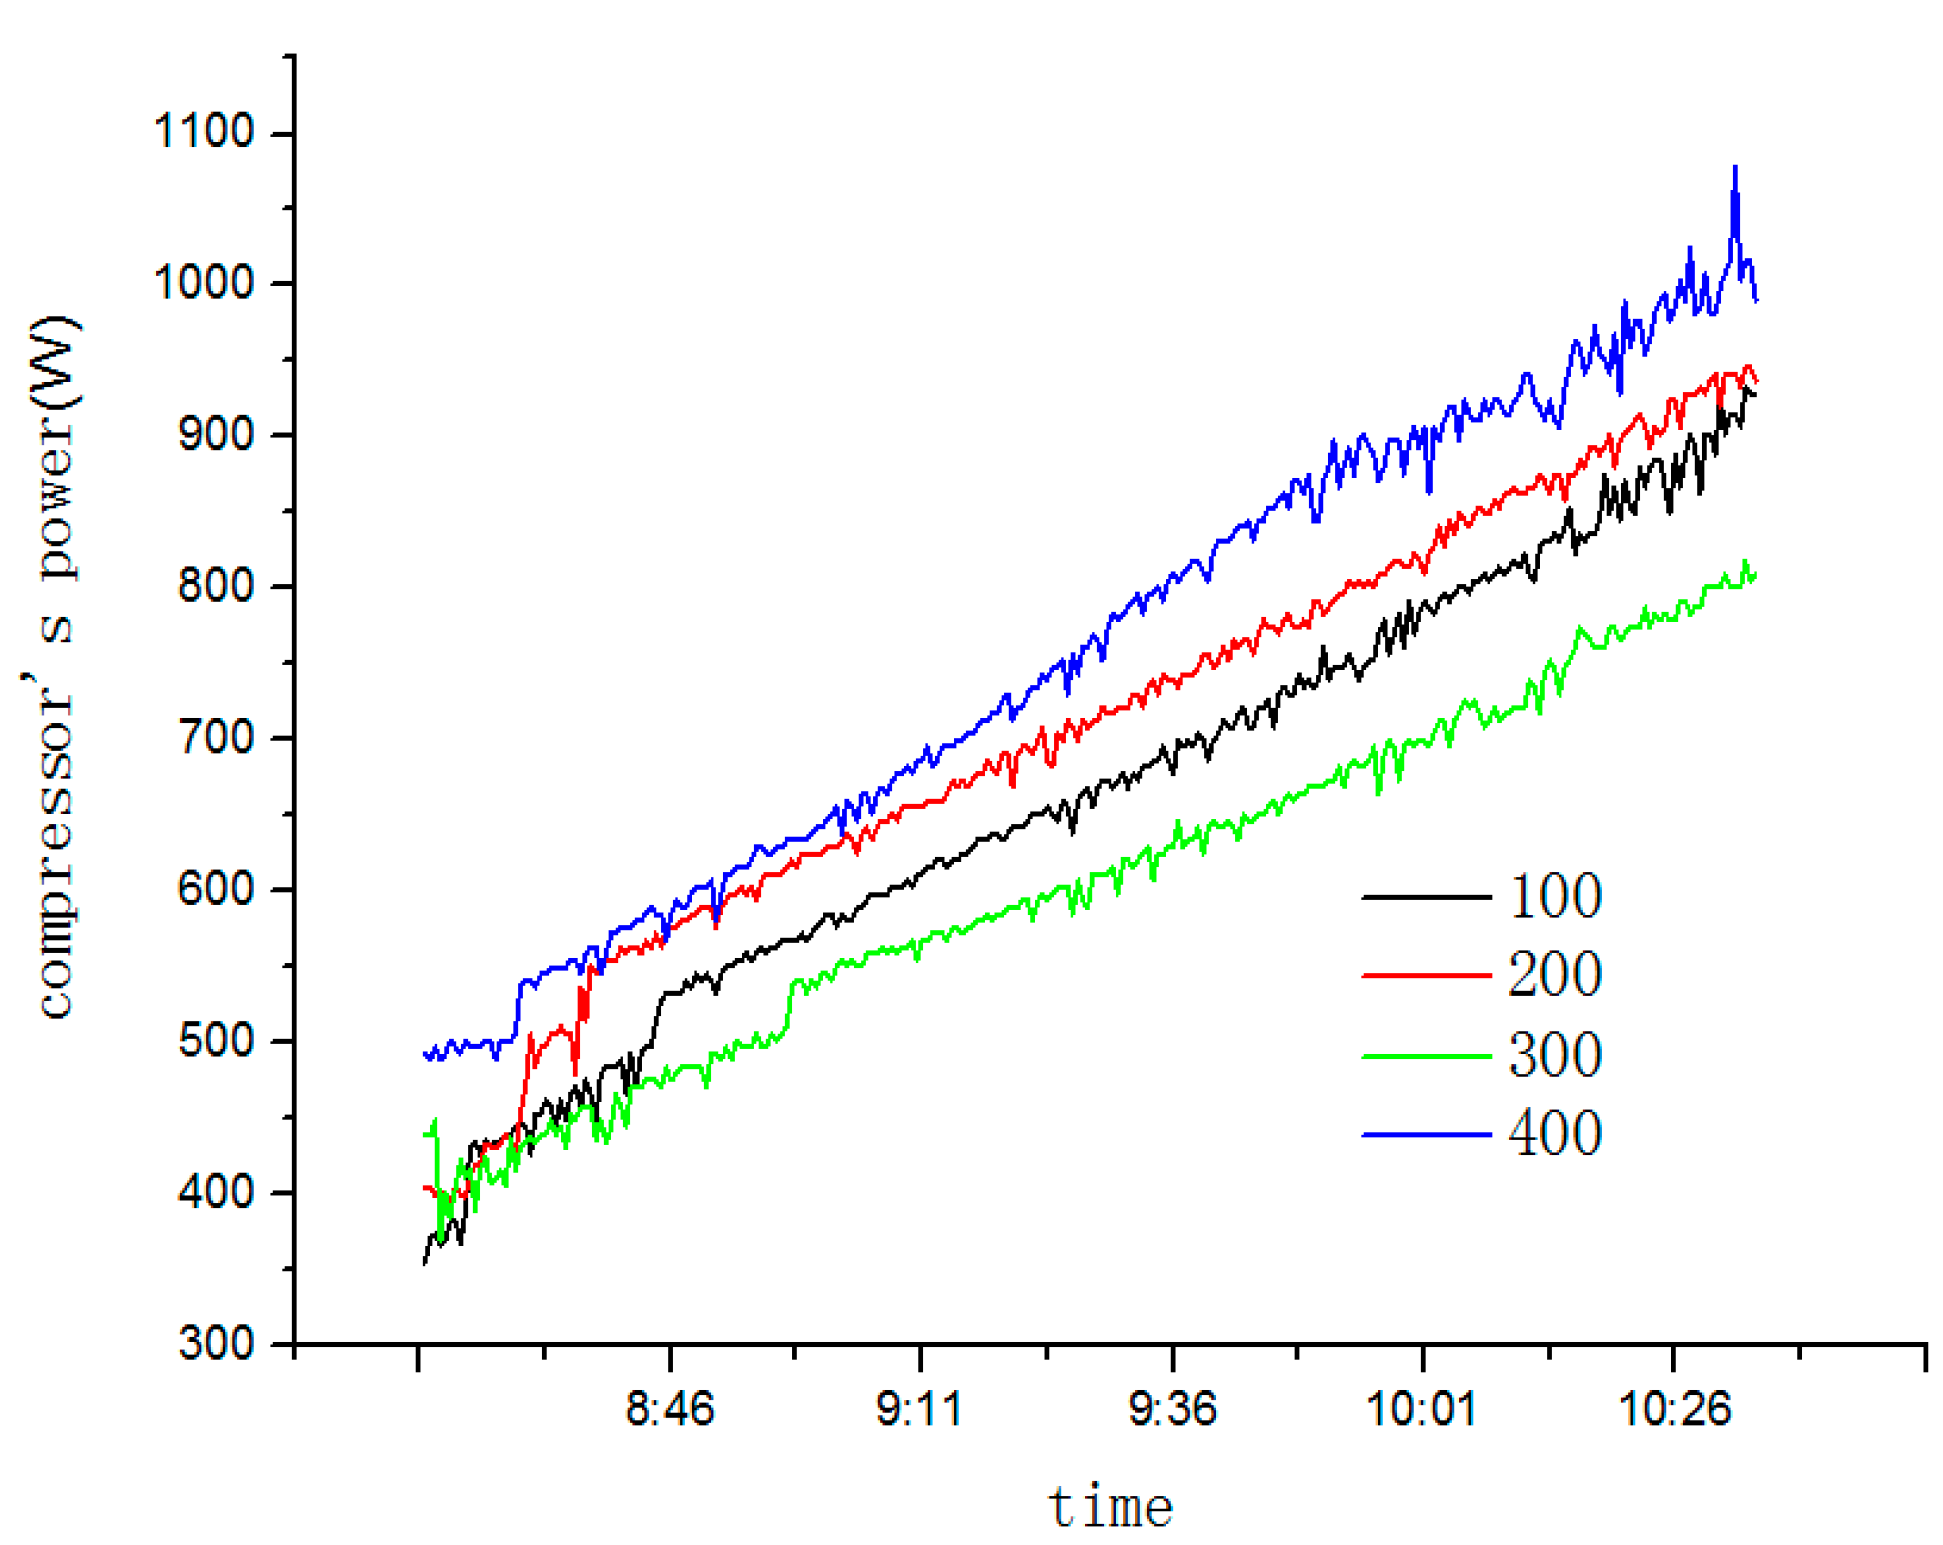
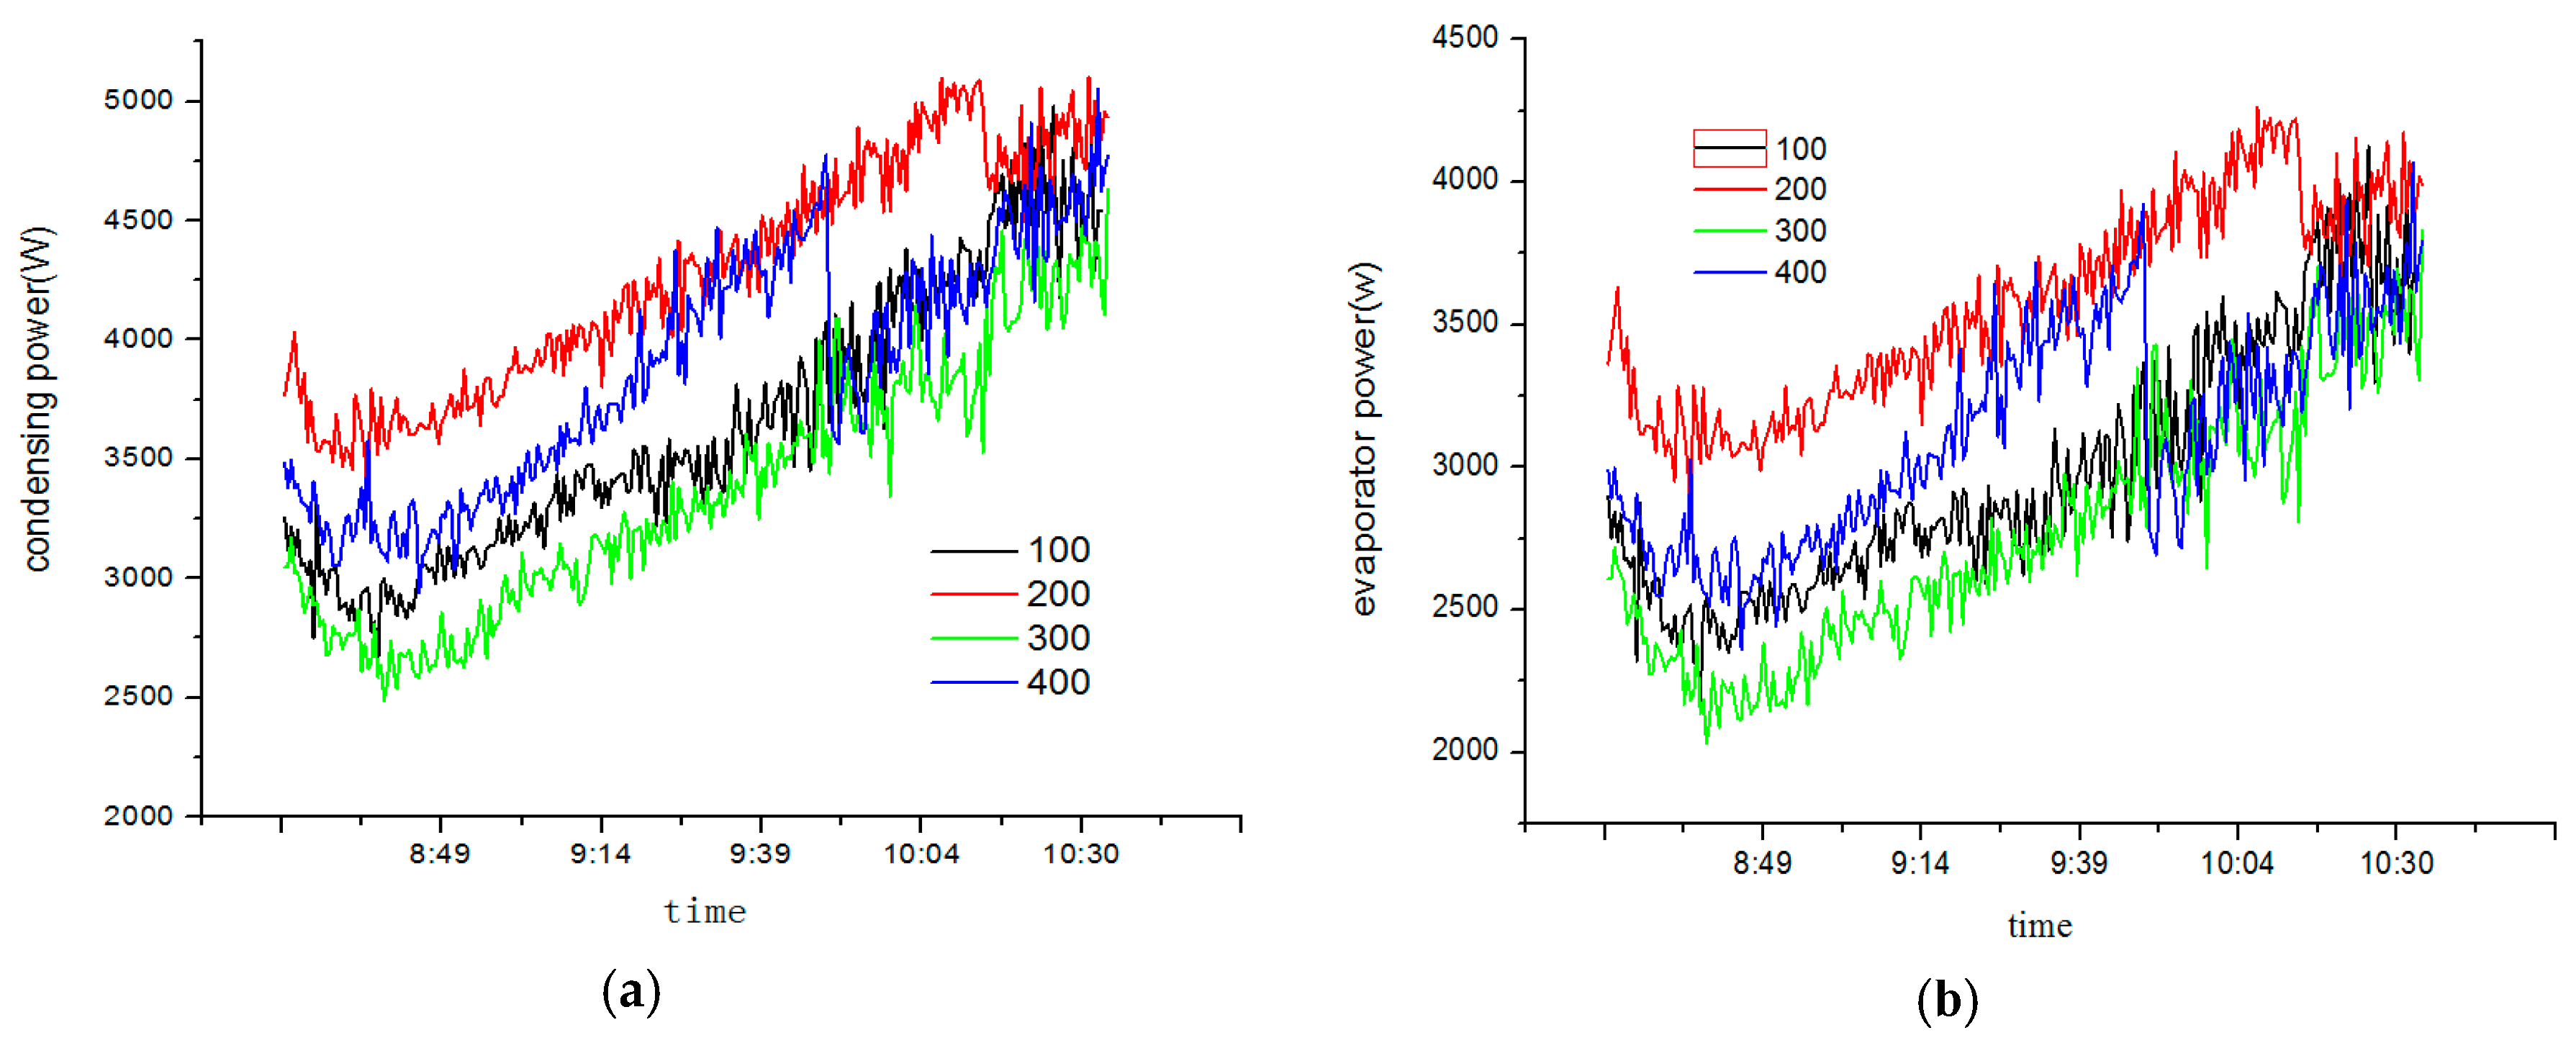
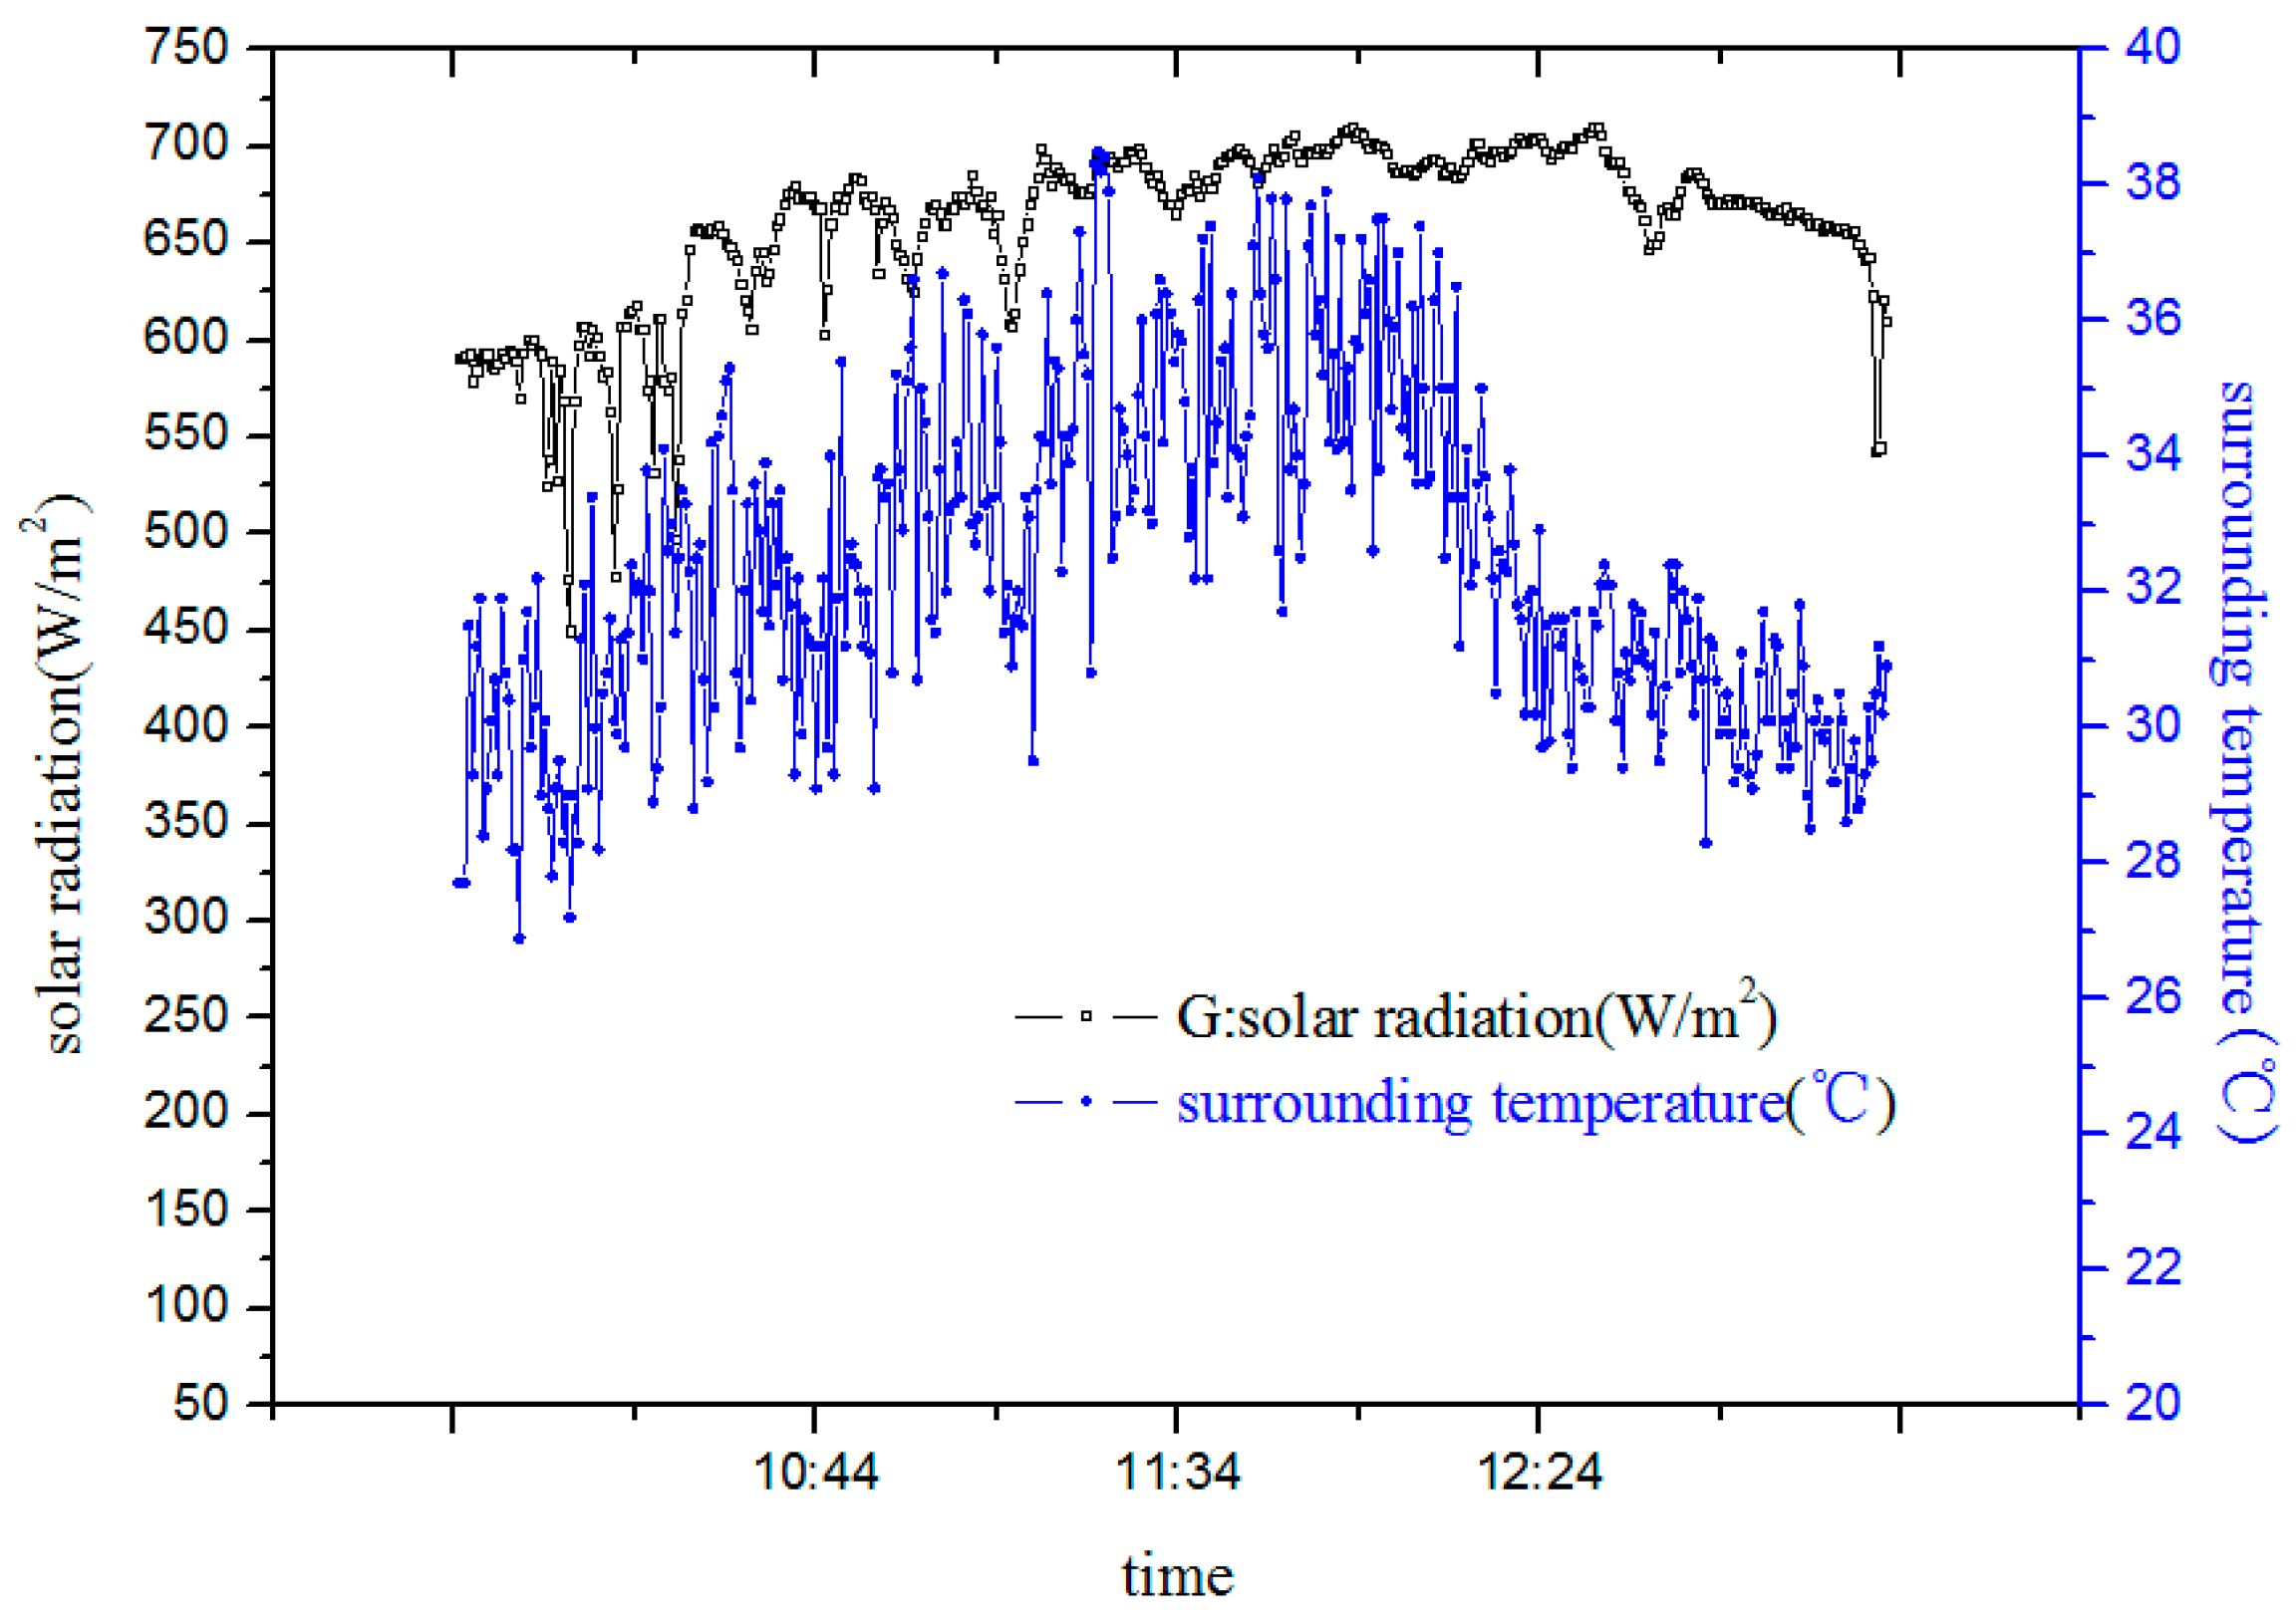
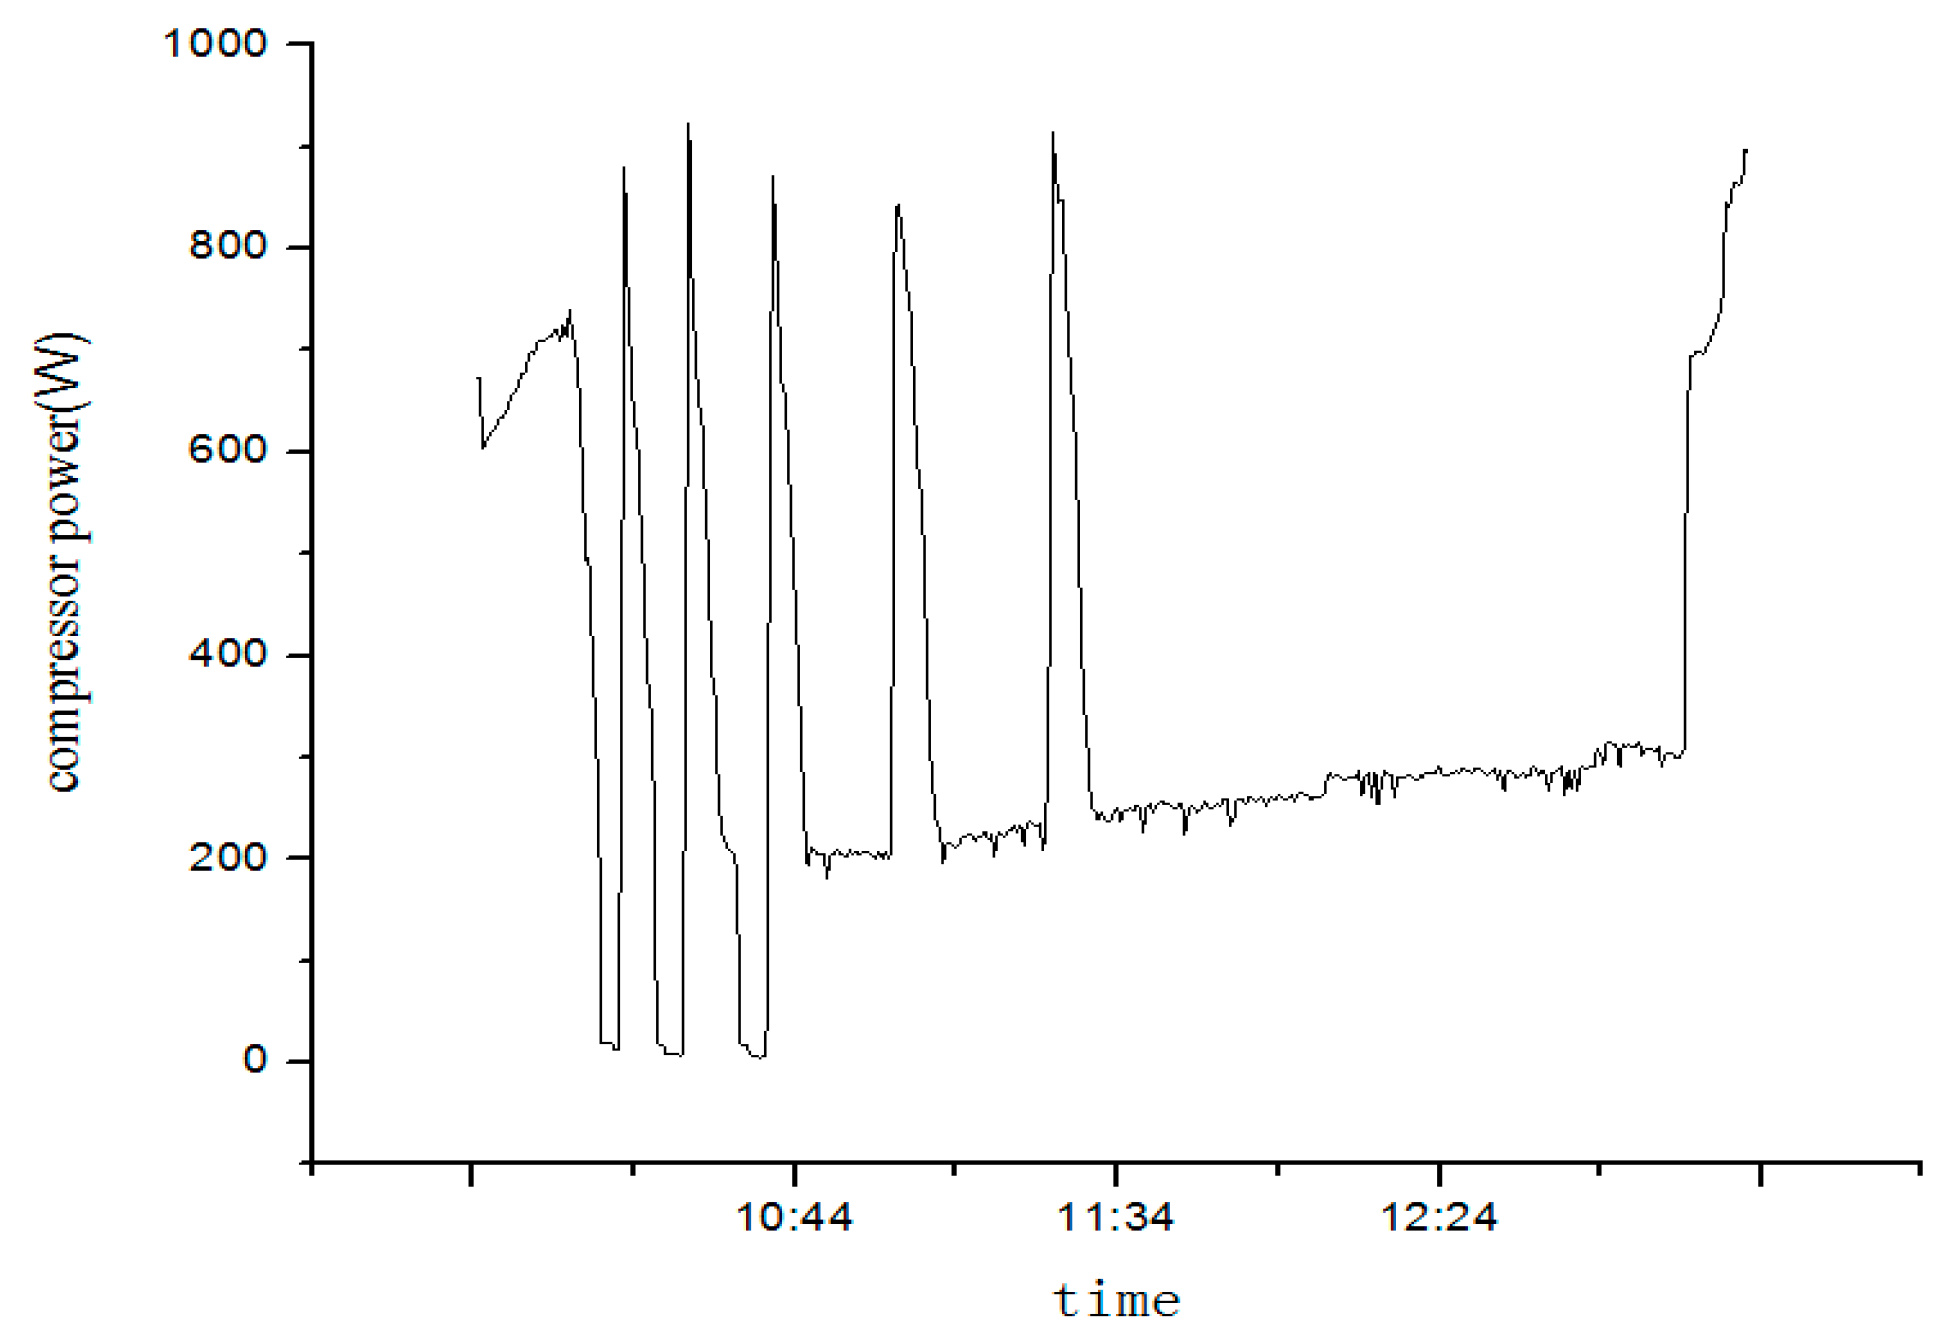
5.1.2. Test Results and Discussion
- (1)
- At an opening pulse of 100, 200, 300 or 400


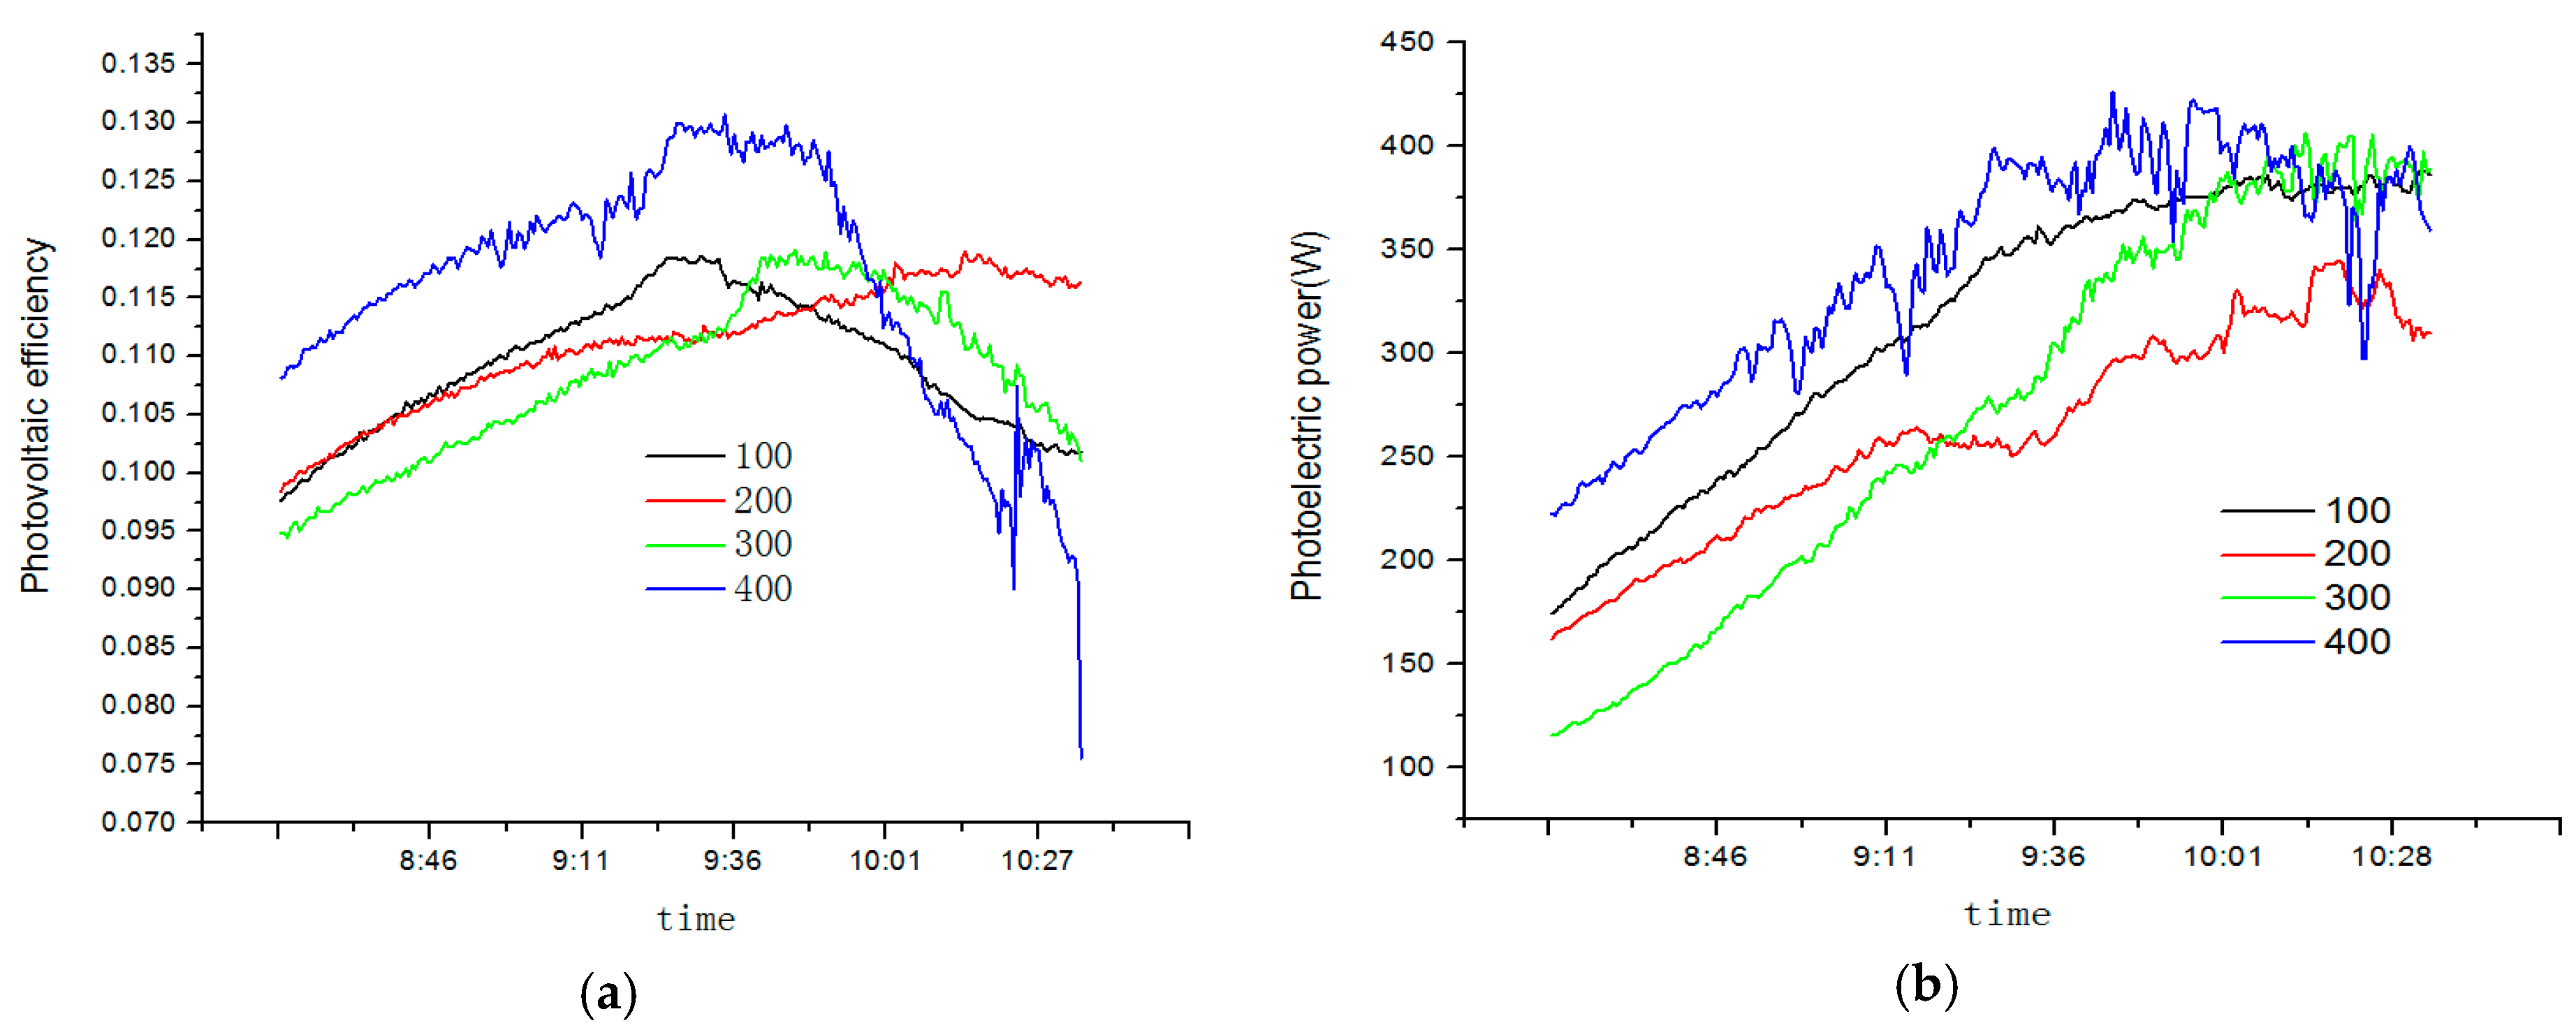
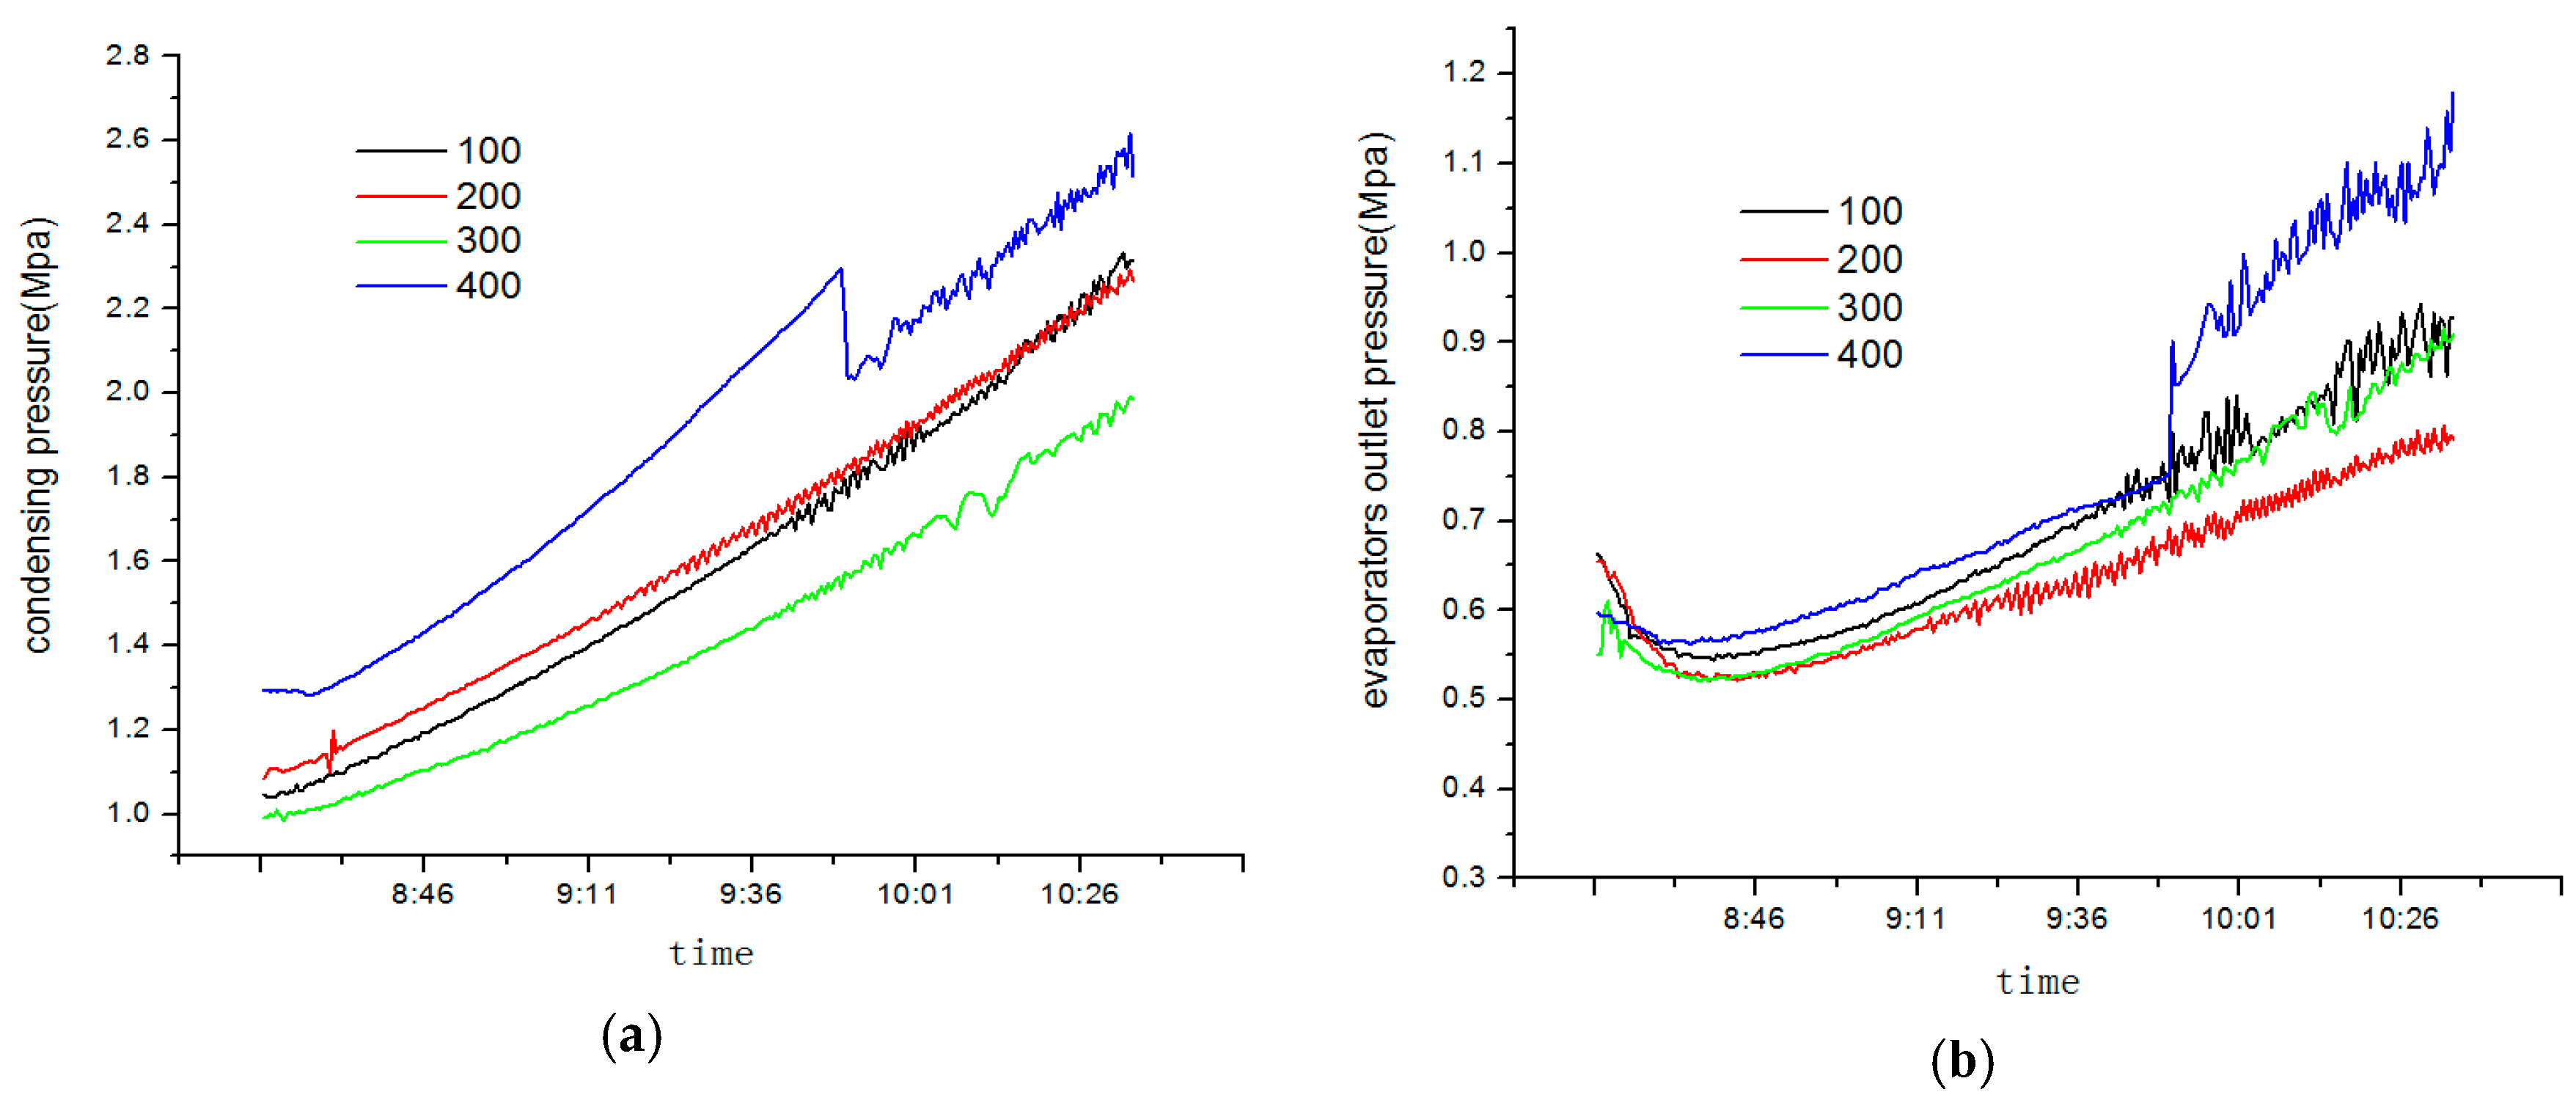

- (2)
- At a EEV opening pulse is 500


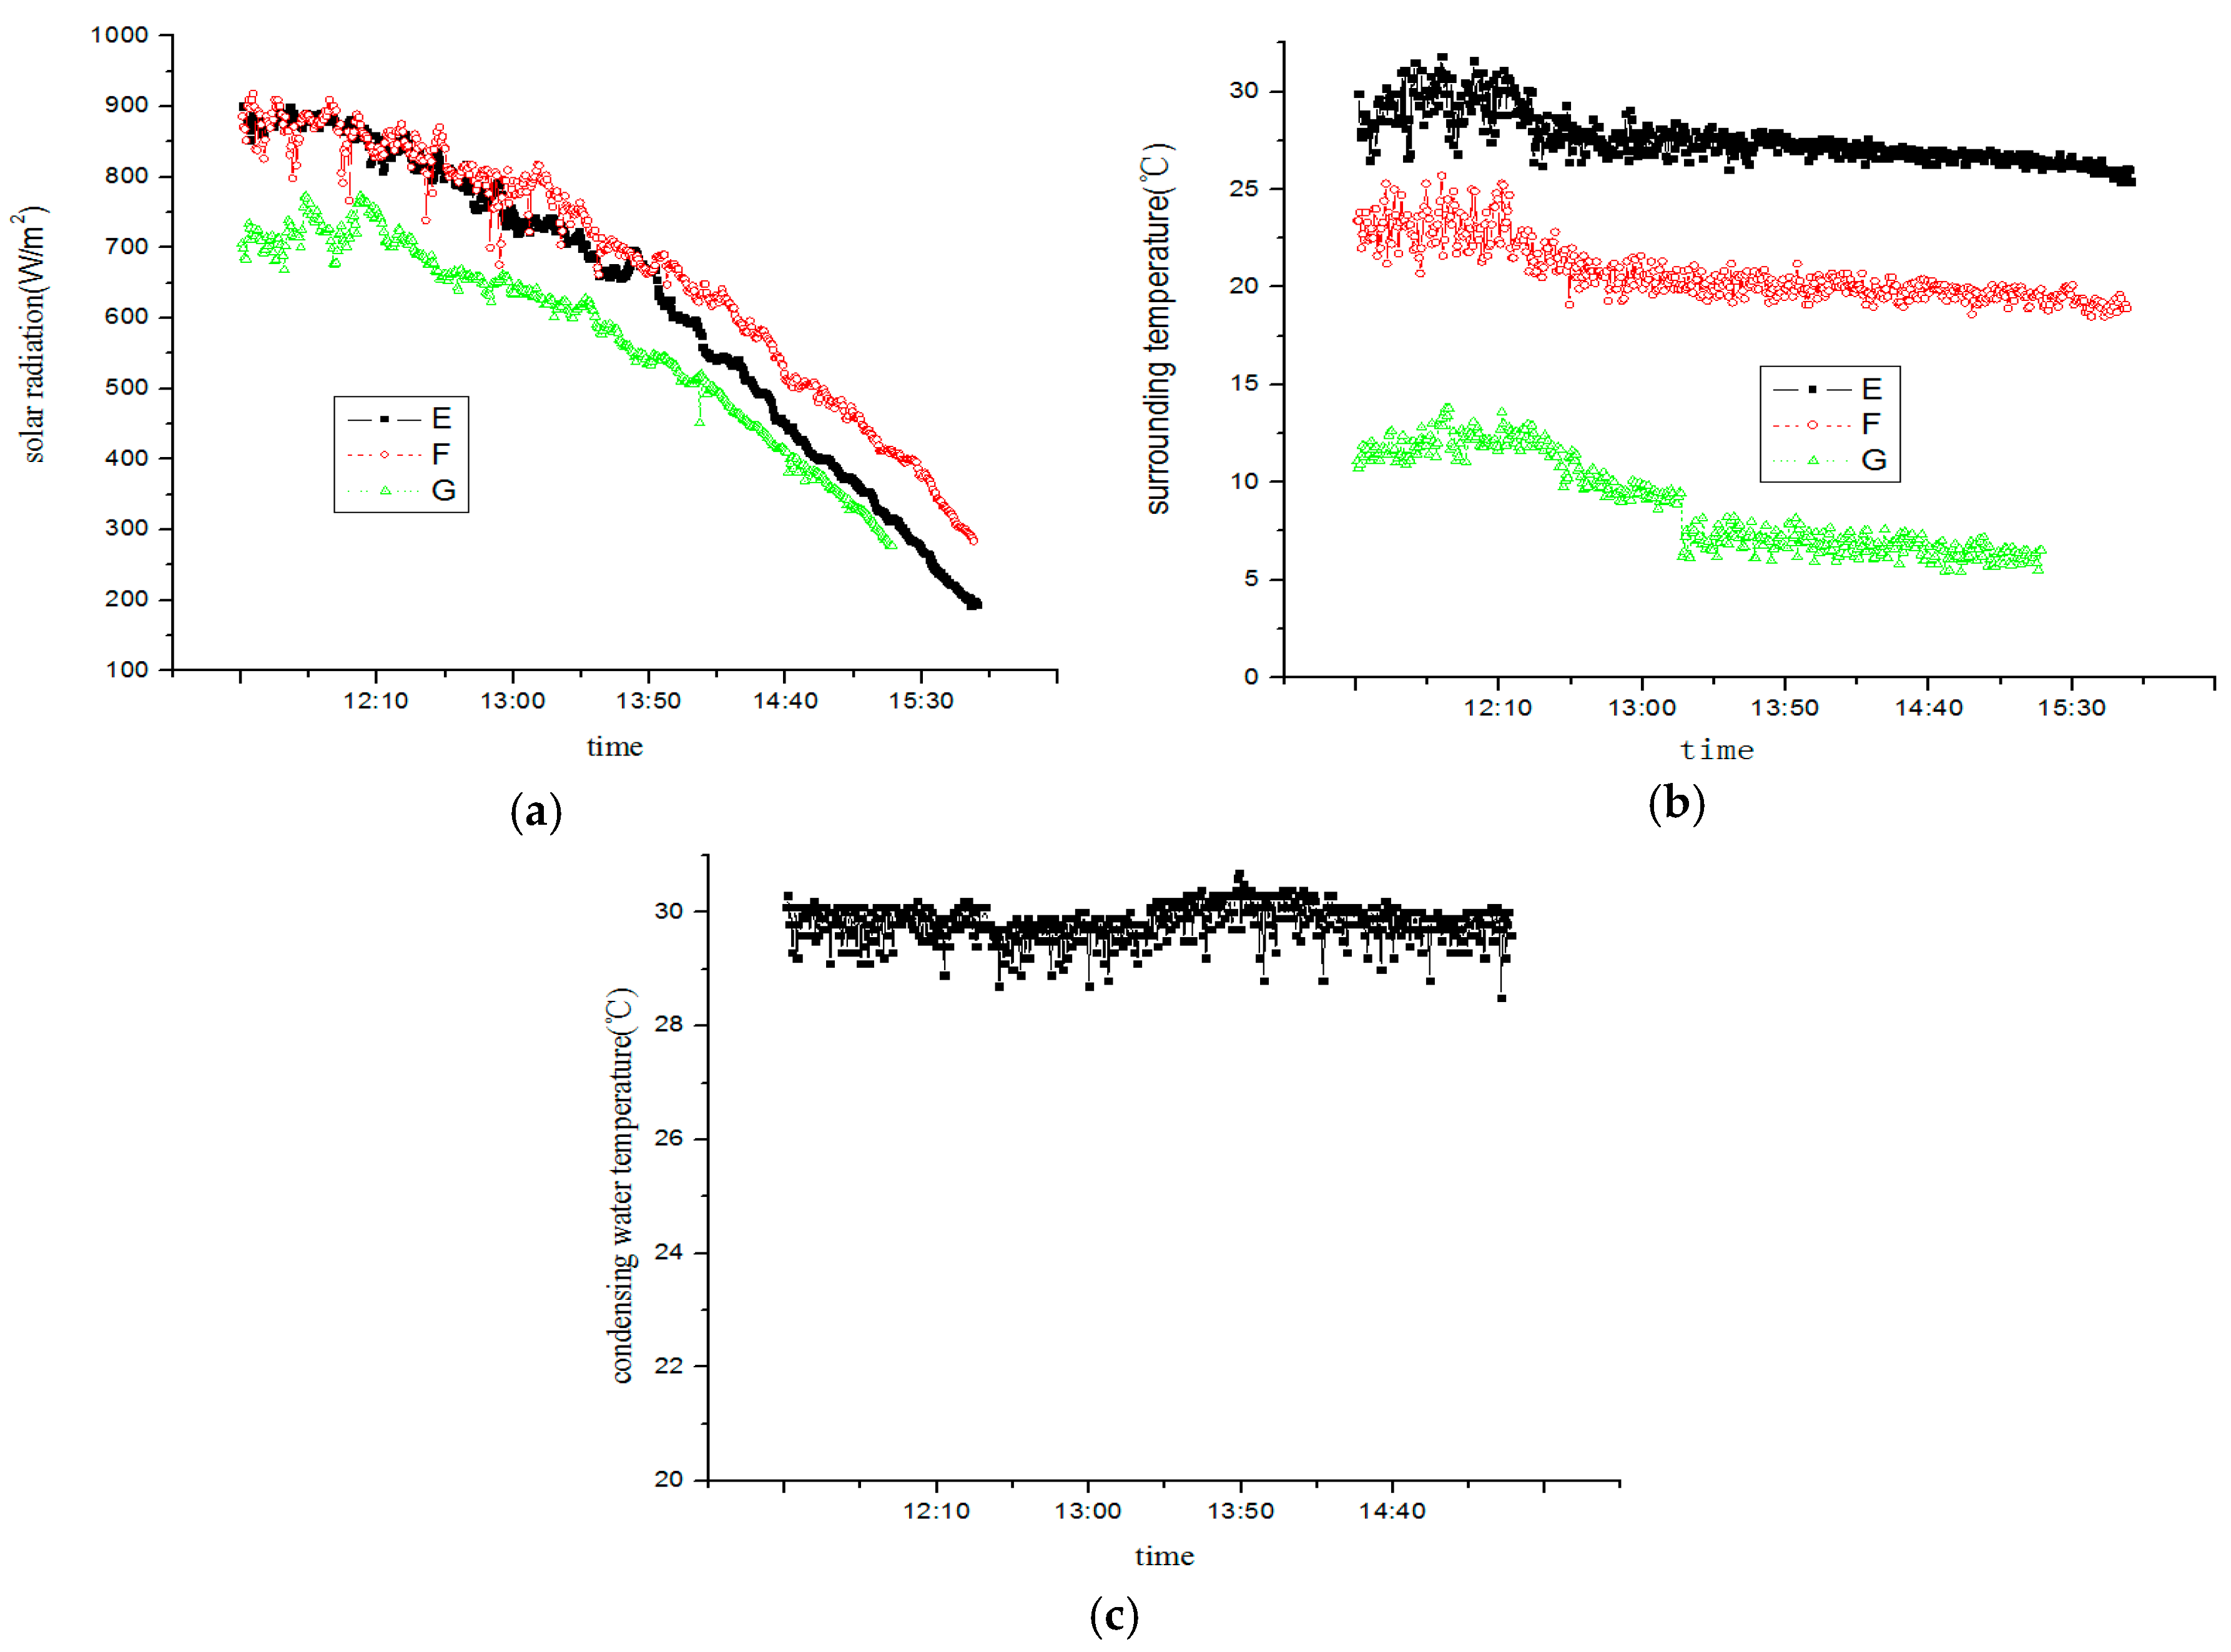
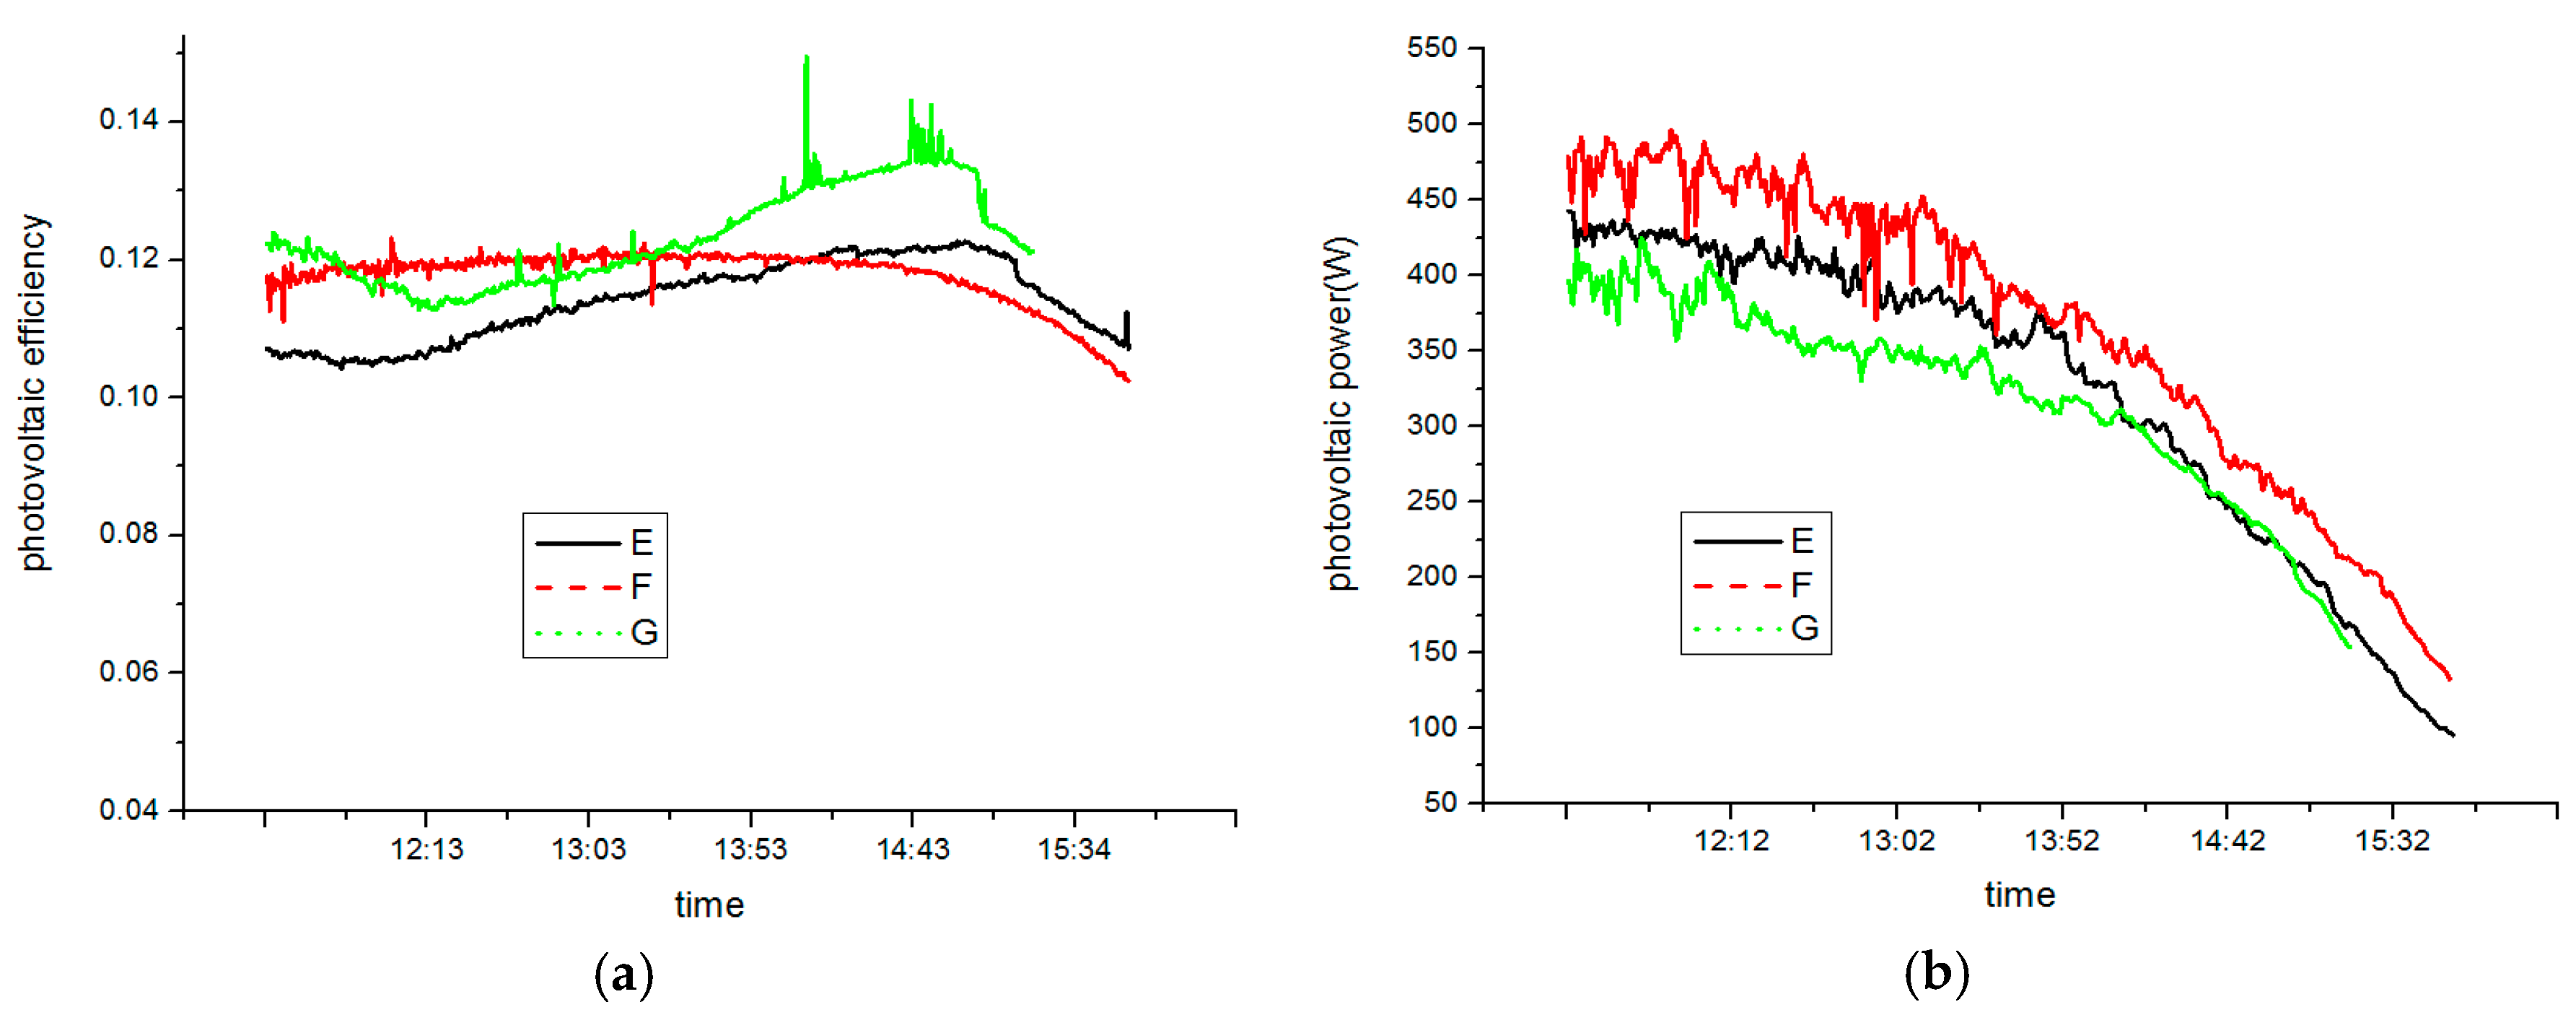
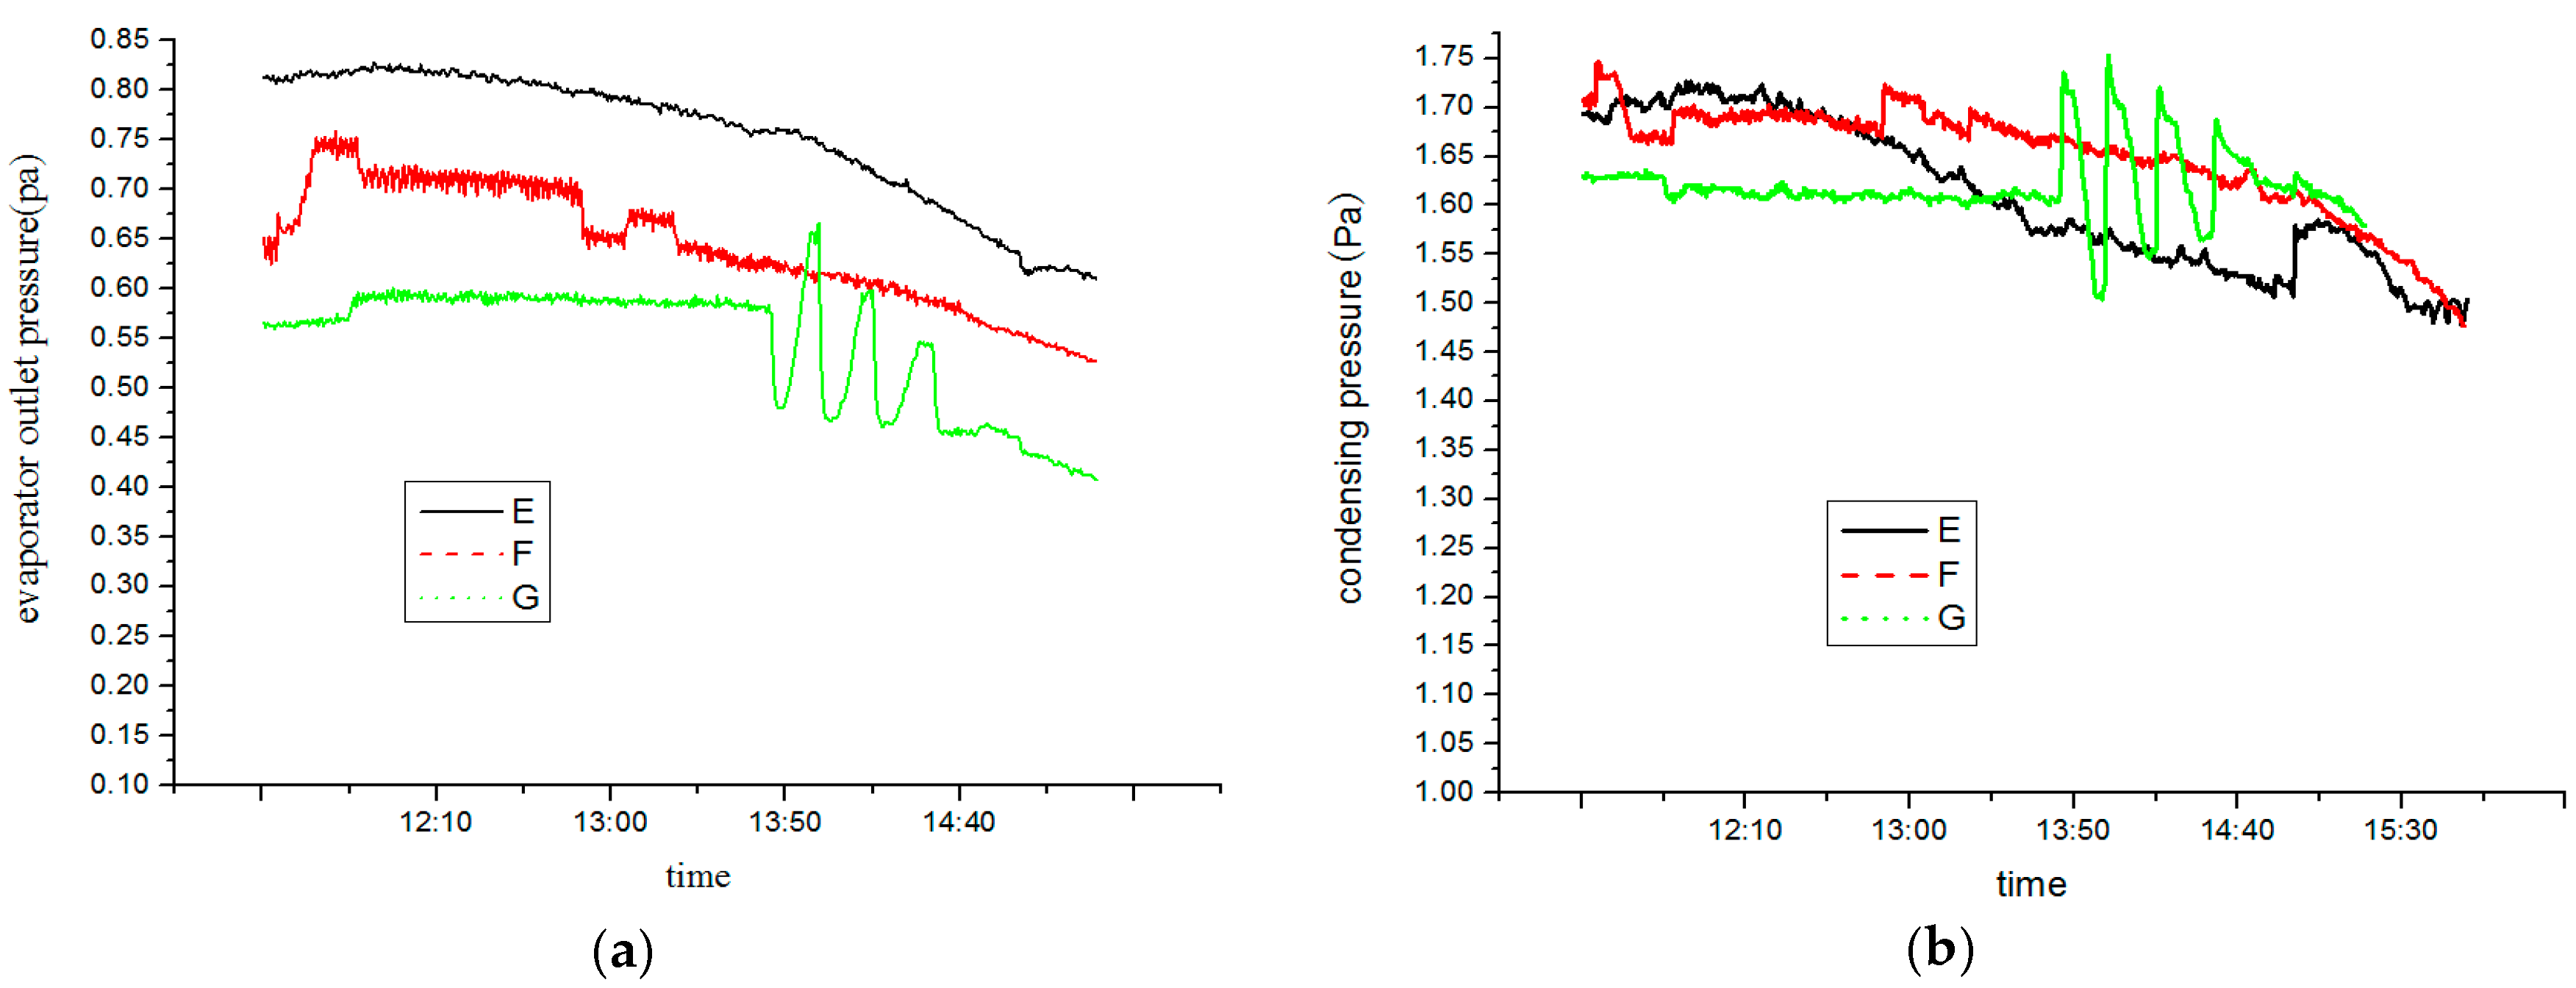
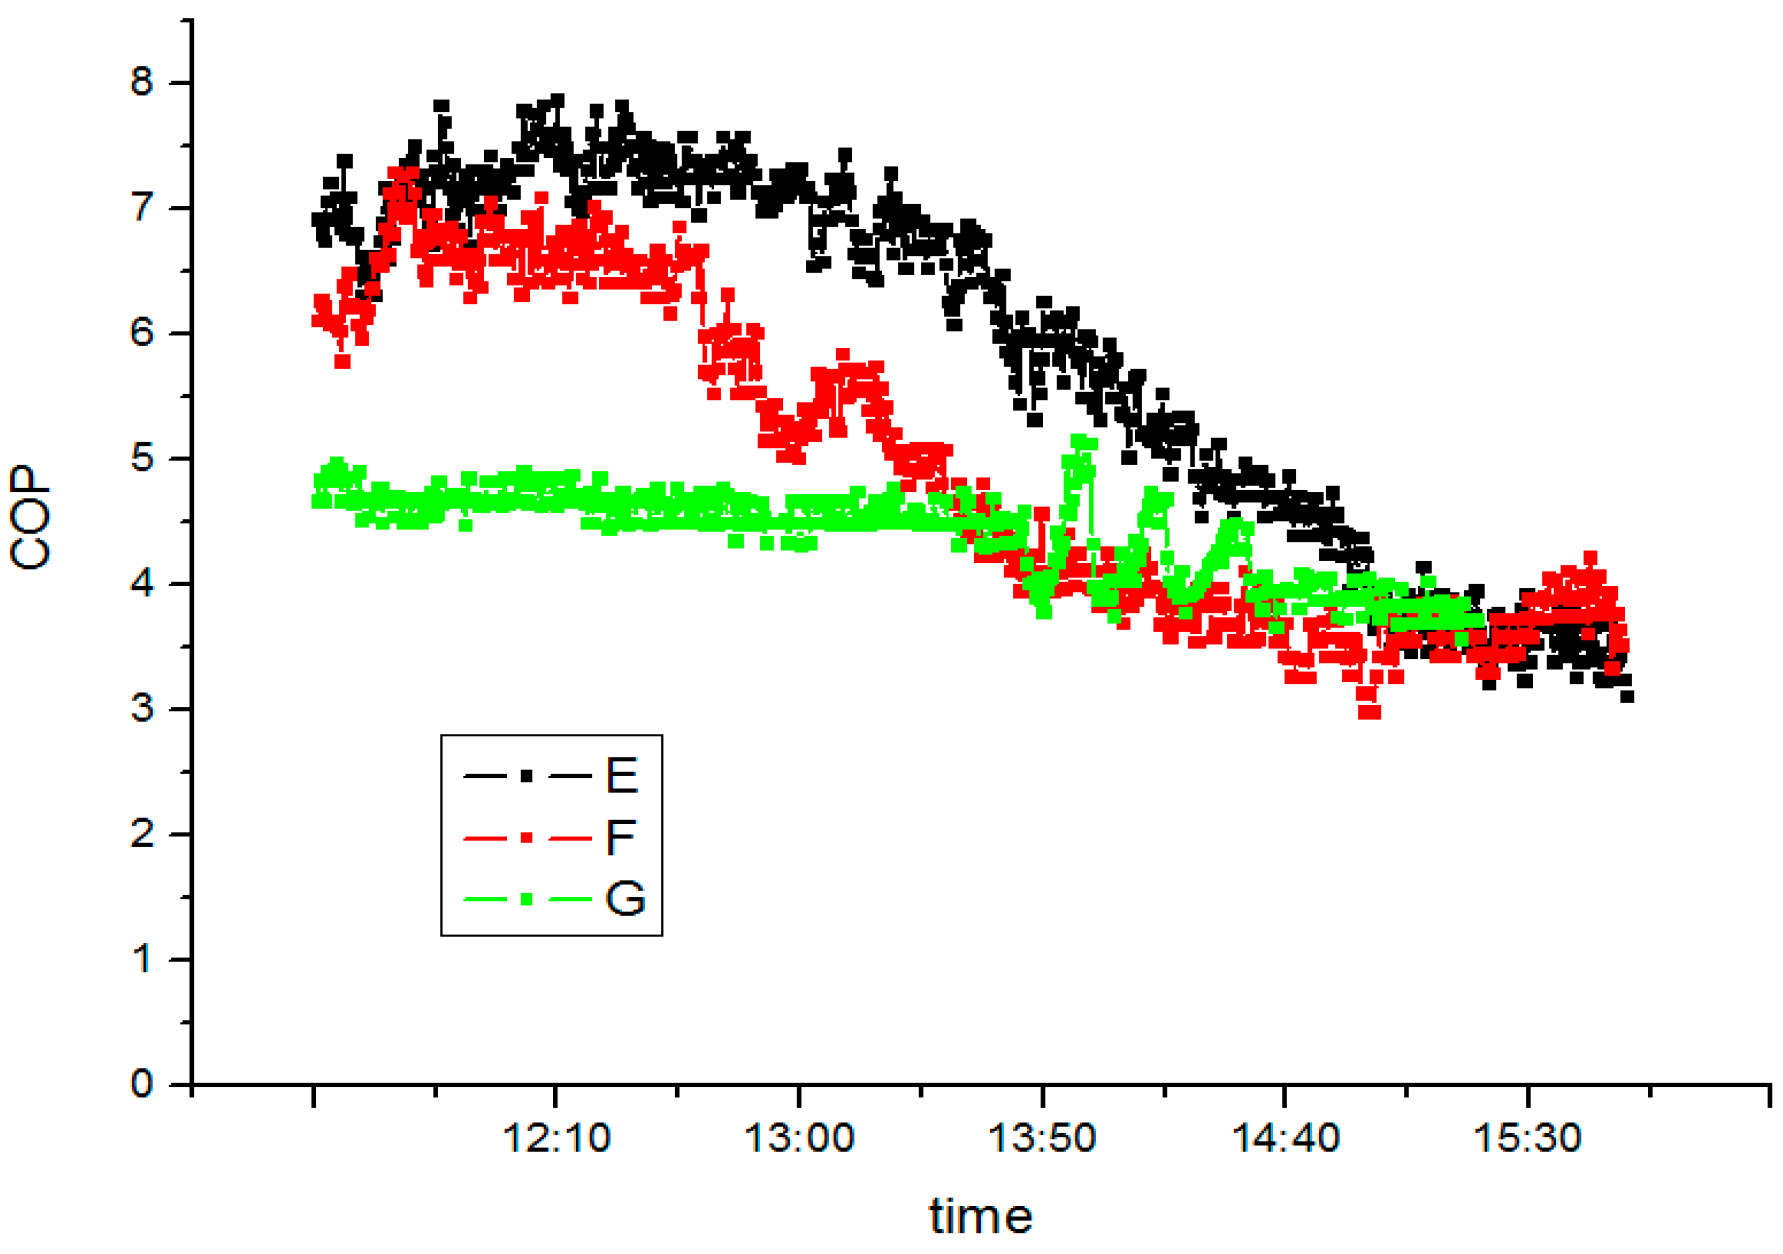
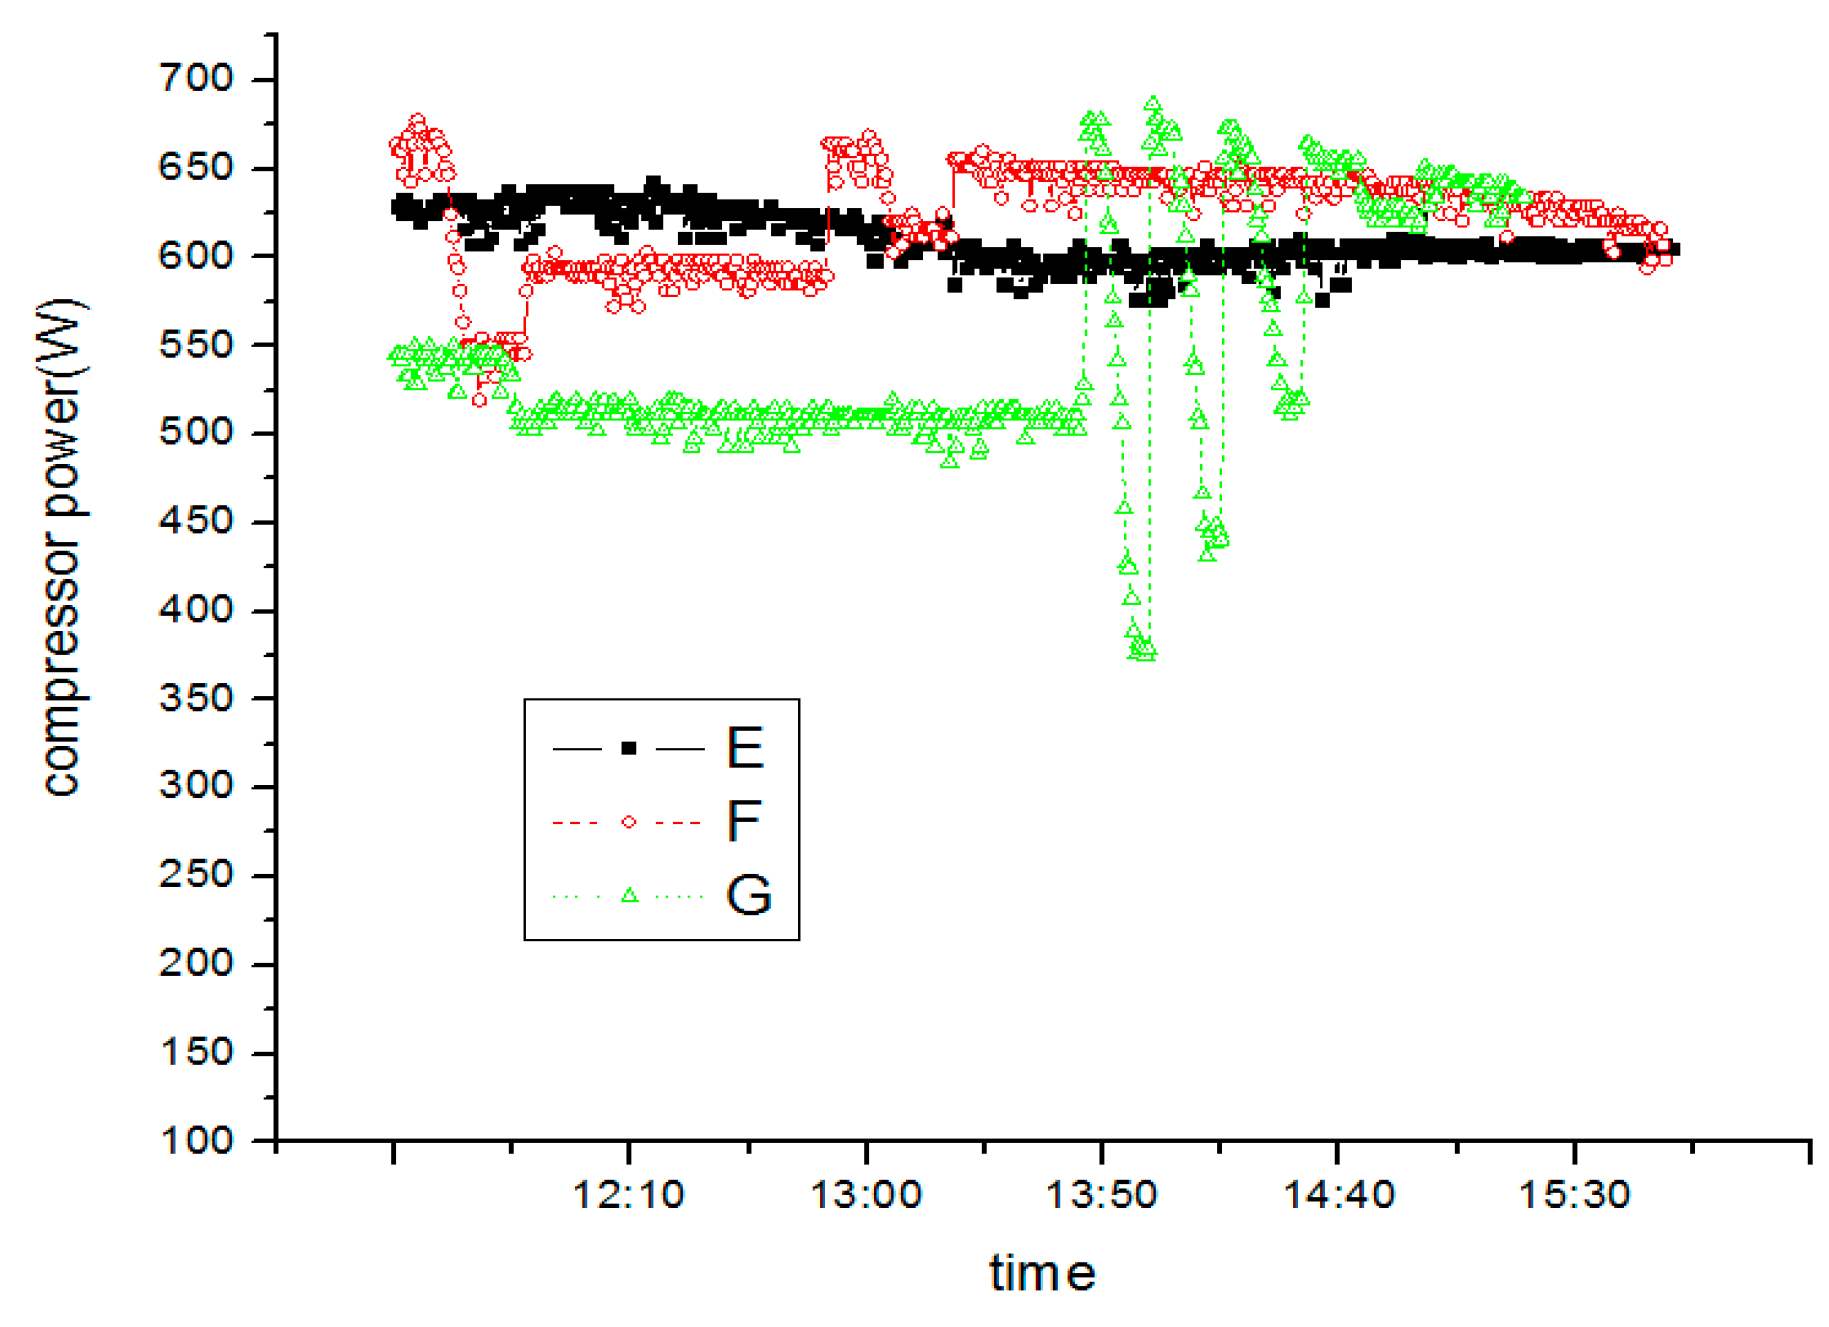
5.2. At a Constant Condensing Water Temperature and EEV Opening Pulse
5.2.1. Test Conditions
| EEV Opening Pulse | Condensing Water Temperature (°C) | Time for Test | Sign as |
|---|---|---|---|
| 400 | 30 ± 0.2 °C | 14 October 2014 | E |
| 400 | 30 ± 0.2 °C | 6 November 2014 | F |
| 400 | 30 ± 0.2 °C | 2 December 2014 | G |

5.2.2. Test Results and Analysis

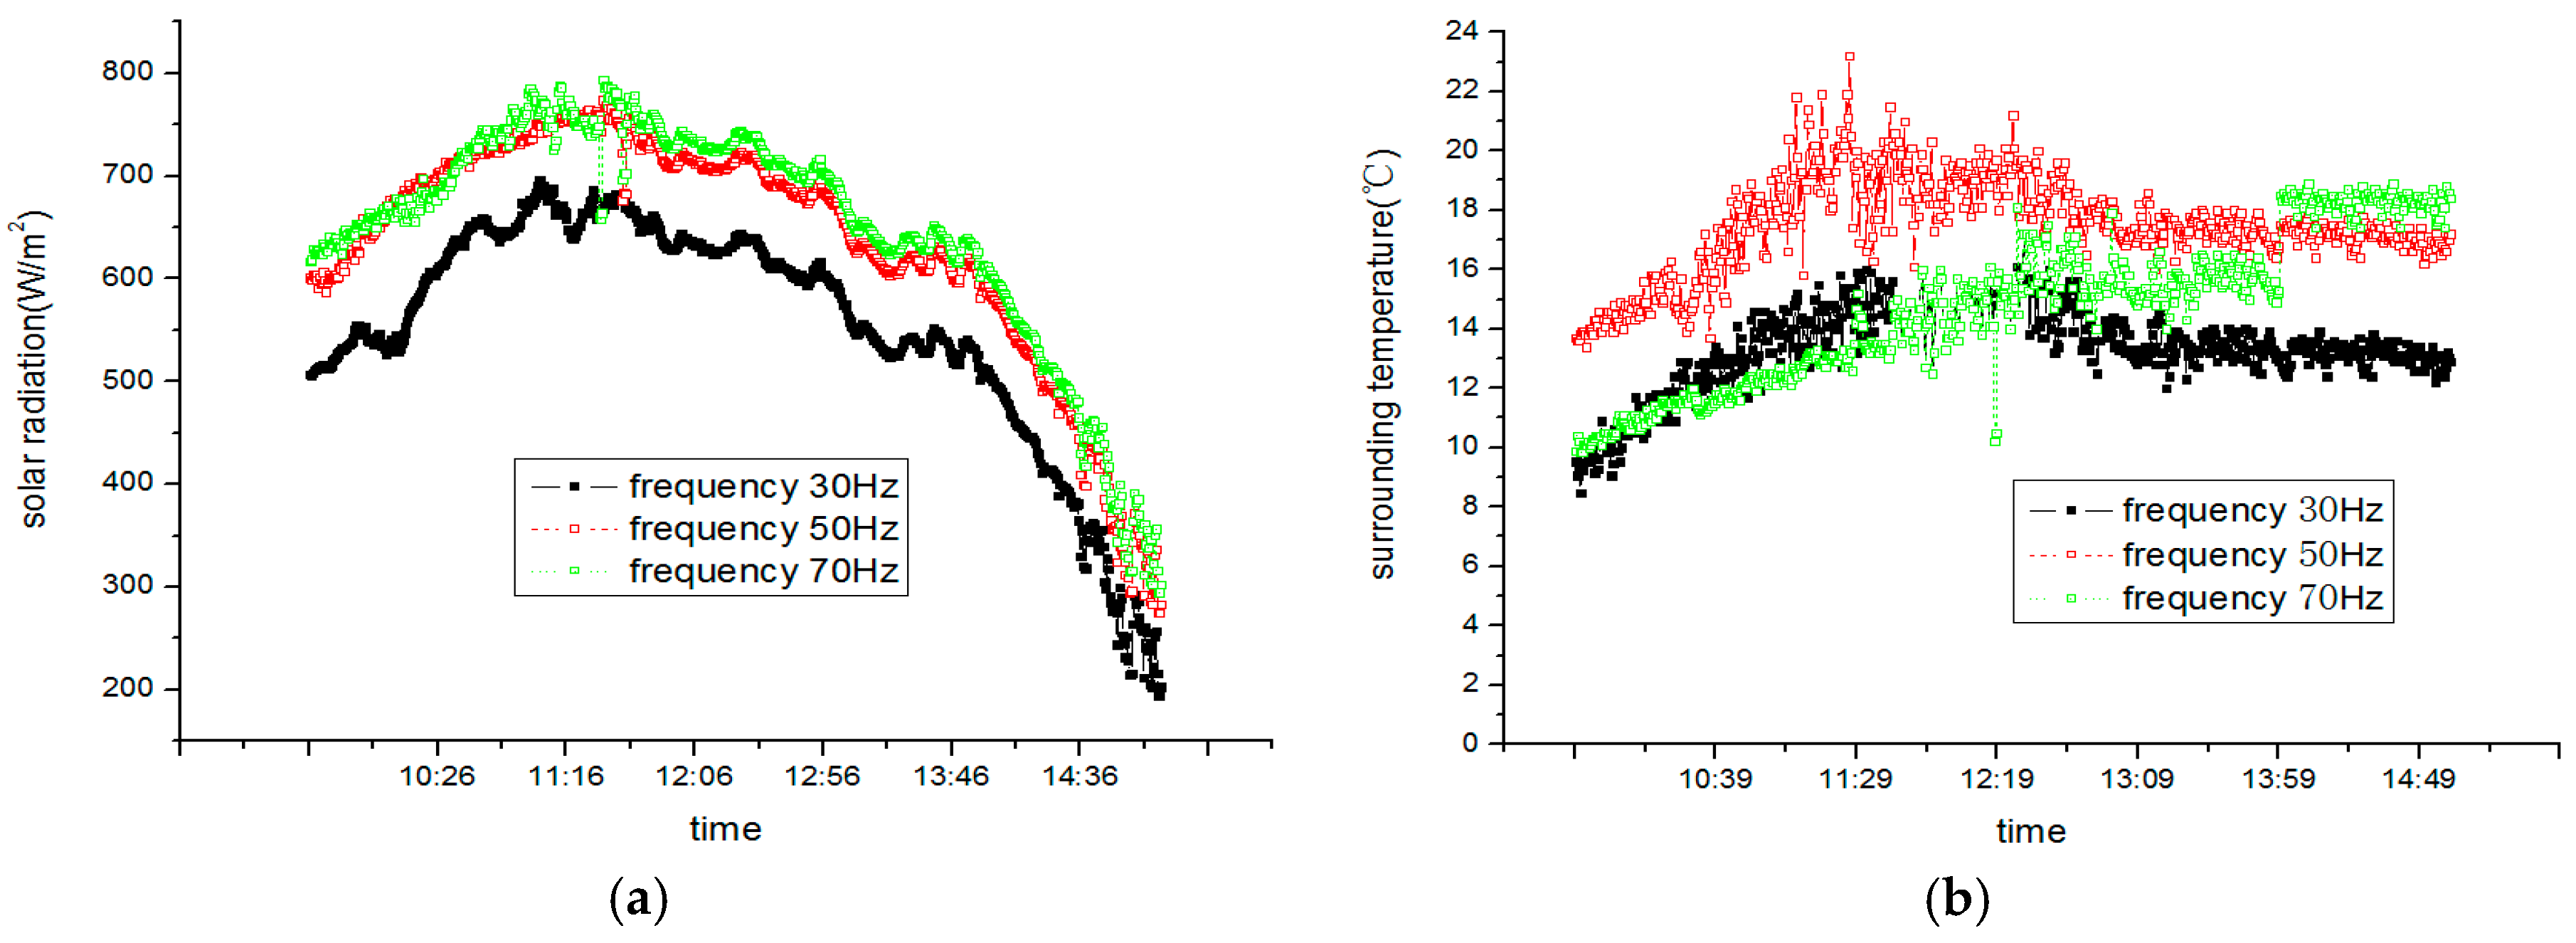
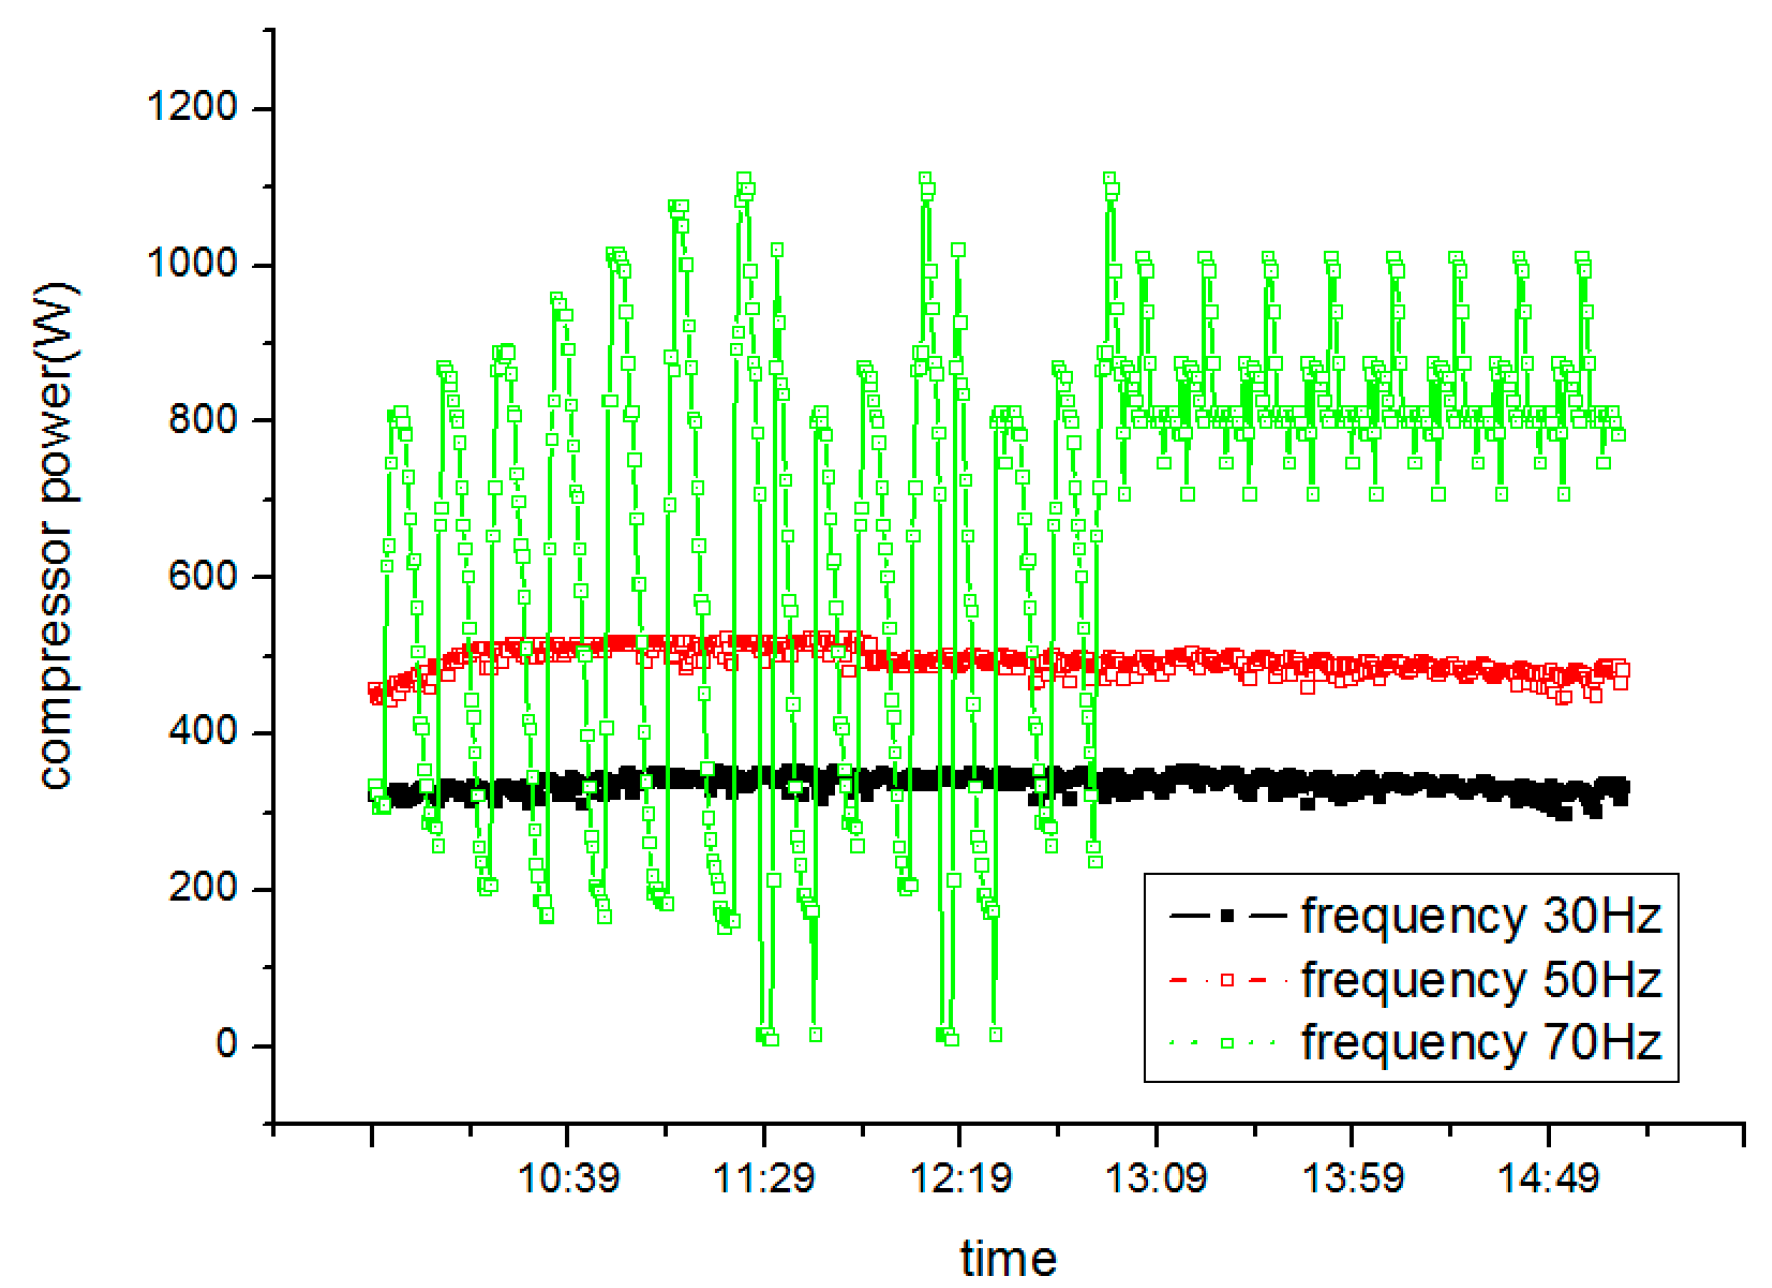
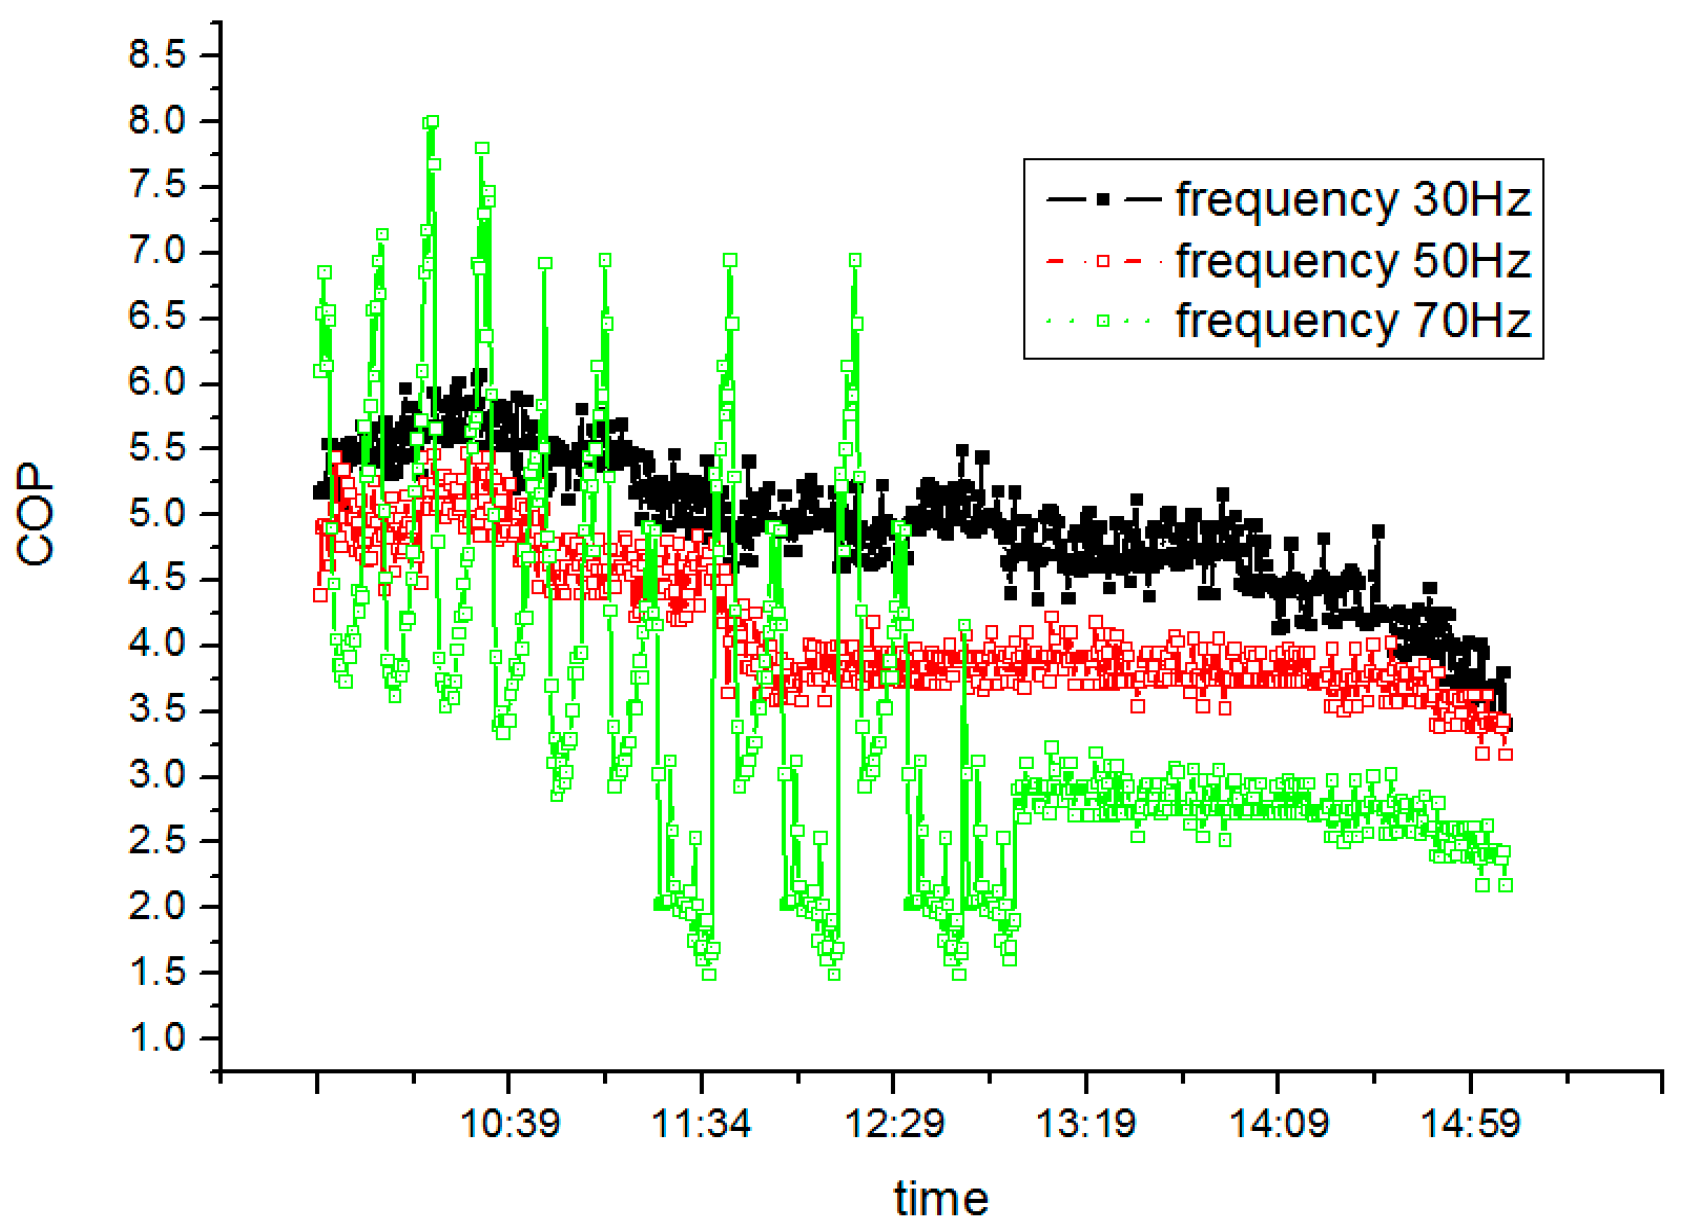
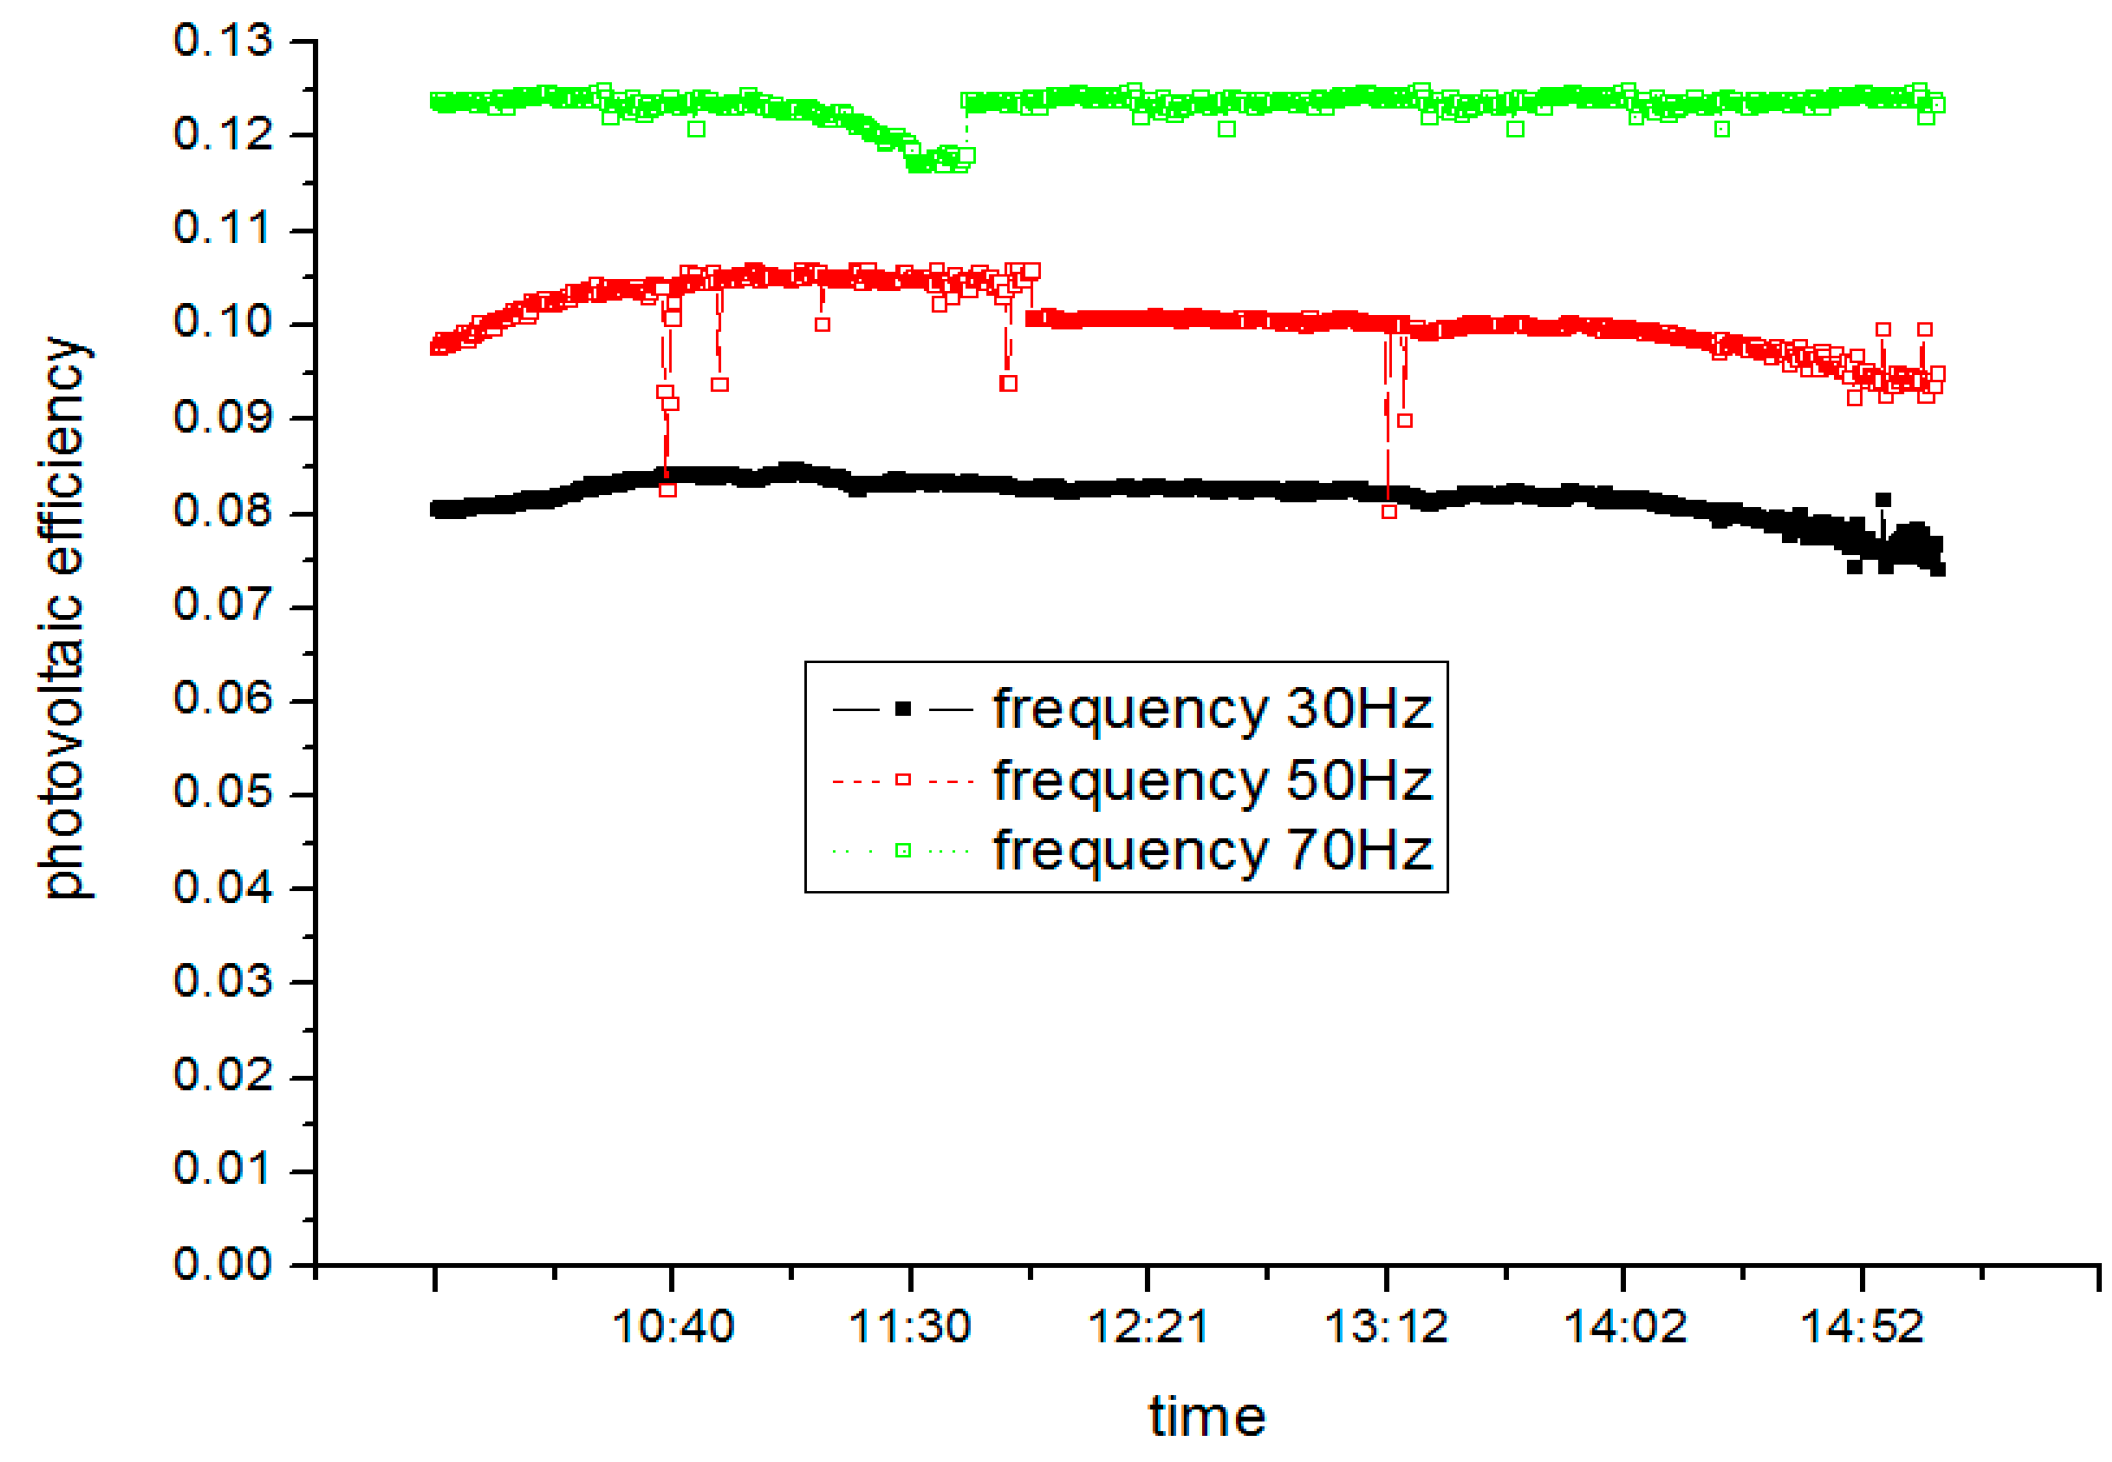
5.3. Test on SAHP System at Different Frequencies
5.3.1. Test condition

5.3.2. Test Results and Analysis

6. Theory of SAHP System Stability
7. Conclusions
- (1)
- MSS theory is able to account for system instabilty in the research of the match between EEV and evaporators.
- (2)
- As system load varies, compressor rotating speed should be accordingly tuned to meet the demand of evaporator load; and then the opening of EEV should also be changed to make sure that evaporator outlet refrigerants superheat is optimal.
- (3)
- The crux of optimizing SAHP system is to determine the evaporator superheat under the circumstance of specified loads and its corresponding EEV opening, which means establishing the MSS line.
Acknowledgments
Author Contributions
Conflicts of Interest
Nomenclature
| A | area (m2) |
| Cp | specific heat of fluid at constant pressure (J·kg−1·K−1) |
| c | specific heat of solid (J·kg−1·K−1) |
flow coefficient of expansion valve | |
| d | diameter (m) |
| f | voltage frequency () |
| G | intensity of solar radiation (W·m−2); the vapor flow rate |
| h | specific enthalpy of fluid (kJ·kg−1); convective heat transfer coefficient (W·m−2·K−1); the high degree of the valve |
| k | thermal conductivity (W·m−1·K−1); the adiabatic compression index |
| mr | mass flow rate (kg·s−1) |
| n | rotating speed (rpm);the opening pulse of EEV |
| N | electric power (W) |
| P | refrigerant pressure (Pa); motor’ pole number |
| Q | heat flux (W) |
| t | time (s) |
| T | temperature (K) |
| u | flow velocity (m·s−1) |
| U | total coefficient of heat transfer of panel heat exchanger |
| V | voltage (V); volume (m3) |
the latent heat of refrigerants’ vaporization (kJ·kg−1) | |
| Nu | Nusselt number |
| Pr | Prandtl number |
| Re | Reynolds number |
| β | the valve angle |
| η | efficiency |
| µ | dynamic viscosity (Pa·s) |
| ρ | density (kg·m−3) |
specific volume, m3/Kg |
Subscripts
| a | air; ambient |
| c | condenser |
| com | compressor |
| d | discharge |
| e | evaporator; electrical |
| EEV | electronic expansion valve |
| EX | heat exchanger |
| in | inlet |
| l | liquid |
| out | outlet |
| pv | photovoltaic |
| r | refrigerant |
| s | simulation; suction |
| t | thermal |
| th | theory |
| v | volumetric; vopor |
| w | wall; water |
References
- Chaturvedi, S.K.; Chiang, Y.F.; Roberts, A.S., Jr. Analysis of two-phase flow solar collectors with application to heat pumps. J. Sol. Energy Eng. 1982, 104, 358–365. [Google Scholar] [CrossRef]
- Chaturvedi, S.K.; Roberts, A.S.; Mei, V. Solar collector as heat pump evaporator. In Proceedings of the 13th Intersociety Energy Conversion Conference, San Diego, CA, USA, 20–25 August 1978; pp. 286–297.
- Chaturvedi, S.K.; Chen, D.T.; Kheireddine, A. Thermal performance of a variable capacity direct expansion solar-assisted heat pump. Energy Convers. Manag. 1998, 39, 181–191. [Google Scholar] [CrossRef]
- Hawlader, M.N.A.; Chou, S.K.; Ullah, M.Z. The performance of a solar assisted heat pump water heating system. Appl. Therm. Eng. 2001, 21, 1049–1065. [Google Scholar] [CrossRef]
- Huang, B.J.; Chyng, J.P. Performance characteristic of integral type solar-assisted heat pump. Sol. Energy 2001, 71, 403–414. [Google Scholar] [CrossRef]
- Scarpa, S.; Tagliafico, L.A.; Bianco, V. A novel steady-state approach for the analysis of gas-burner supplemented direct expansion solar assisted heat pumps. Sol. Energy 2013, 96, 227–238. [Google Scholar] [CrossRef]
- Scarpa, F.; Tagliafico, L.A.; Bianco, V. Inverse cycles modeling without refrigerant property specification. Int. J. Refrig. 2013, 36, 1716–1729. [Google Scholar] [CrossRef]
- Rossi, C.; Tagliafico, L.A.; Scarpa, F.; Bianco, V. Experimental and numerical results from hybrid retrofitted photovoltaic panels. Energy Convers. Manag. 2013, 76, 634–644. [Google Scholar] [CrossRef]
- Xu, N.; Ji, J.; Sun, W.; Han, L.; Chen, H.F.; Jin, Z. Outdoor performance analysis of a 1090x point-focus Fresnel high concentrator photovoltaic/thermal system with triple-junction solar cells. Energy Convers. Manag. 2015, 100, 191–200. [Google Scholar] [CrossRef]
- Guo, C.; Ji, J.; Sun, W.; Ma, J.W.; He, W.; Wang, Y.Q. Numerical simulation and experimental validation of tri-functional photovoltaic/thermal solar collector. Energy 2015, 87, 470–480. [Google Scholar] [CrossRef]
- Ji, J.; Guo, C.; Sun, W.; He, W.; Wang, Y.Q.; Li, G.Q. Experimental investigation of tri-functional photovoltaic/thermal solar collector. Energy Convers. Manag. 2014, 88, 650–656. [Google Scholar] [CrossRef]
- Chen, H.F.; Ji, J.; Wang, Y.F. Thermal analysis of a high concentration photovoltaic/thermal system. Sol. Energy 2014, 107, 372–379. [Google Scholar] [CrossRef]
- Li, G.Q.; Pei, G.; Yang, M. Optical evaluation of a novel static incorporated compound parabolic concentrator with photovoltaic/thermal system and preliminary experiment. Energy Convers. Manag. 2014, 85, 204–211. [Google Scholar] [CrossRef]
- He, W.; Zhou, J.Z.; Chen, C. Experimental study and performance analysis of a thermoelectric cooling and heating system driven by a photovoltaic/thermal system in summer and winter operation modes. Energy Convers. Manag. 2014, 84, 41–49. [Google Scholar] [CrossRef]
- Fu, H.D.; Pei, G.; Ji, J.; Long, H.; Zhang, T.; Chow, T.T. Experimental study of a photovoltaic solar-assisted heat-pump/heat-pipe system. Appl. Therm. Eng. 2012, 40, 343–350. [Google Scholar] [CrossRef]
- Pei, G.; Fu, H.D.; Ji, J. Annual analysis of heat pipe PV/T systems for domestic hot water and electricity production. Energy Convers. Manag. 2012, 56, 8–21. [Google Scholar]
- Pei, G.; Fu, H.D.; Zhang, T. A numerical and experimental study on a heat pipe PV/T system. Sol. Energy 2011, 85, 911–921. [Google Scholar]
- Hulle, Z.R. The MSS Line—A New Approach to Hunting Problem. ASHRAE J. 1972, 10, 43–46. [Google Scholar]
- Shao, S.; Shi, W.; Li, X. Simulation Modeling for Inverter Compressor Performance. Acad. J. Tsinghua Univ. 2004, 44, 362–365. [Google Scholar]
- Duffie, J.A.; Beckman, W.A. Solar Engineering of Thermal Processes, 2nd ed.; John Willy& Sons, Inc.: Hoboken, NJ, USA, 1991. [Google Scholar]
- While, D.D. The measurement of expansion valve capacity. Refrig. Eng. 1935, 8, 108–112. [Google Scholar]
- Wang, L.; Young, J. Features of Heat Transfer of Devaporation within Panel Heat Exchanger. Acad. J. Shanghai Jiaotong Univ. 1998, 32, 18–22. [Google Scholar]
- Liu, Z.; Liu, X.; Zhao, G. Programming of Thermal Physical Property of Refrigerating Medium; Science Press: Marrickville, Australia, 1991. [Google Scholar]
- Chen, W.; Chen, Z.; Zhu, R.; Wu, Y. Experimental Investigation of a Minimum Stable Superheat Control System of an Evaporator. Int. J. Refrig. 2002, 25, 1137–1142. [Google Scholar] [CrossRef]
© 2015 by the authors; licensee MDPI, Basel, Switzerland. This article is an open access article distributed under the terms and conditions of the Creative Commons by Attribution (CC-BY) license (http://creativecommons.org/licenses/by/4.0/).
Share and Cite
Wang, H.; Yuan, J.; Wang, R.; He, W. Analysis of the Influence of the Stability Factors of PV/T-SAHP on the Performance of the System. Sustainability 2016, 8, 22. https://doi.org/10.3390/su8010022
Wang H, Yuan J, Wang R, He W. Analysis of the Influence of the Stability Factors of PV/T-SAHP on the Performance of the System. Sustainability. 2016; 8(1):22. https://doi.org/10.3390/su8010022
Chicago/Turabian StyleWang, Haitao, Jie Yuan, Ren Wang, and Wei He. 2016. "Analysis of the Influence of the Stability Factors of PV/T-SAHP on the Performance of the System" Sustainability 8, no. 1: 22. https://doi.org/10.3390/su8010022