3.2. Life Cycle Inventory Analysis
The inventory data covers crop cultivation, mat and composite manufacturing, energy saving during the use phase, and incineration with electricity and heat recovery.
Flax cultivation and fibre production in France/China: Detailed LCI information for French fibre production is comprehensively documented in [
11,
26]. The Chinese flax cultivation and fibre production can be found in the supporting information (SI) of this paper.
Linseed cultivation: The LCI for linseed cultivation reflects the situation in three major producing provinces in Canada. A modified IPCC method is applied to simulate the field emissions in Canada. Detailed information on LCI of linseed cultivation is provided in the SI.
Jute cultivation: Jute fibre production in India is readily available in the Ecoinvent database. Jute sticks are co-generated with jute fibres in ripping. In the Ecoinvent dataset, jute sticks are partitioned out of the system boundary by economic allocation. To maintain the uniformity in the applied methodology of system expansion, the Ecoinvent data are modified accordingly. Jute sticks are a wood substitute for energy that farmers use for cooking or as fencing or thatching material [
32,
33]. Thus jute sticks are modelled to displace fuel wood in the jute fibre LCA for system expansion.
Industrial wood for particleboard: wood chips from industrial softwood residues are the most important source in particleboard manufacturing [
34]. The Ecoinvent dataset “industrial residue wood, mix, softwood, and plant/RER U” data are applied [
34]. Only the conversion process from wood residues to chips are considered in this dataset.
Composite fabrication: Le Duigou
et al. [
11] documented the LCA of the flax mat manufacturing from hackled long fibre. The long fibres are first cut into a uniform length and then fabricated into a randomly oriented mat. Glass mat data were obtained from Stiller [
35], where a detailed energy profile for glass fibre tissue fabrication is documented. The material efficiency for mat production can reach a very high level; no material loss was assumed in Le Duigou
et al. [
11] for flax mat manufacturing. The compression moulding manufacturing technique can be employed to produce flax or glass mat reinforced polymer and the energy consumption for compression moulding is 11.4 MJ per kg composite product [
36]. The material loss during compression moulding process is 2.5%. Waste composite materials are disposed by incineration [
37].
Use phase: The fuel savings in the use phase, which is incurred by weight reduction when shifting from glass mat/PP composite to flax mat/PP, is associated with the CLCA study. The fuel reduction coefficient for a gasoline car under the New European Driving Cycle (NEDC) regulations is 0.33 litre fuel saving per 100 kg weight reduction per 100 km driving distance [
38]. Considering the 1.2kg mass reduction triggered by using flax mat-PP and the overall 200,000 km driving distance, the fuel savings for replacing glass mat-PP with flax mat-PP is calculated to be 4.6 litre petrol.
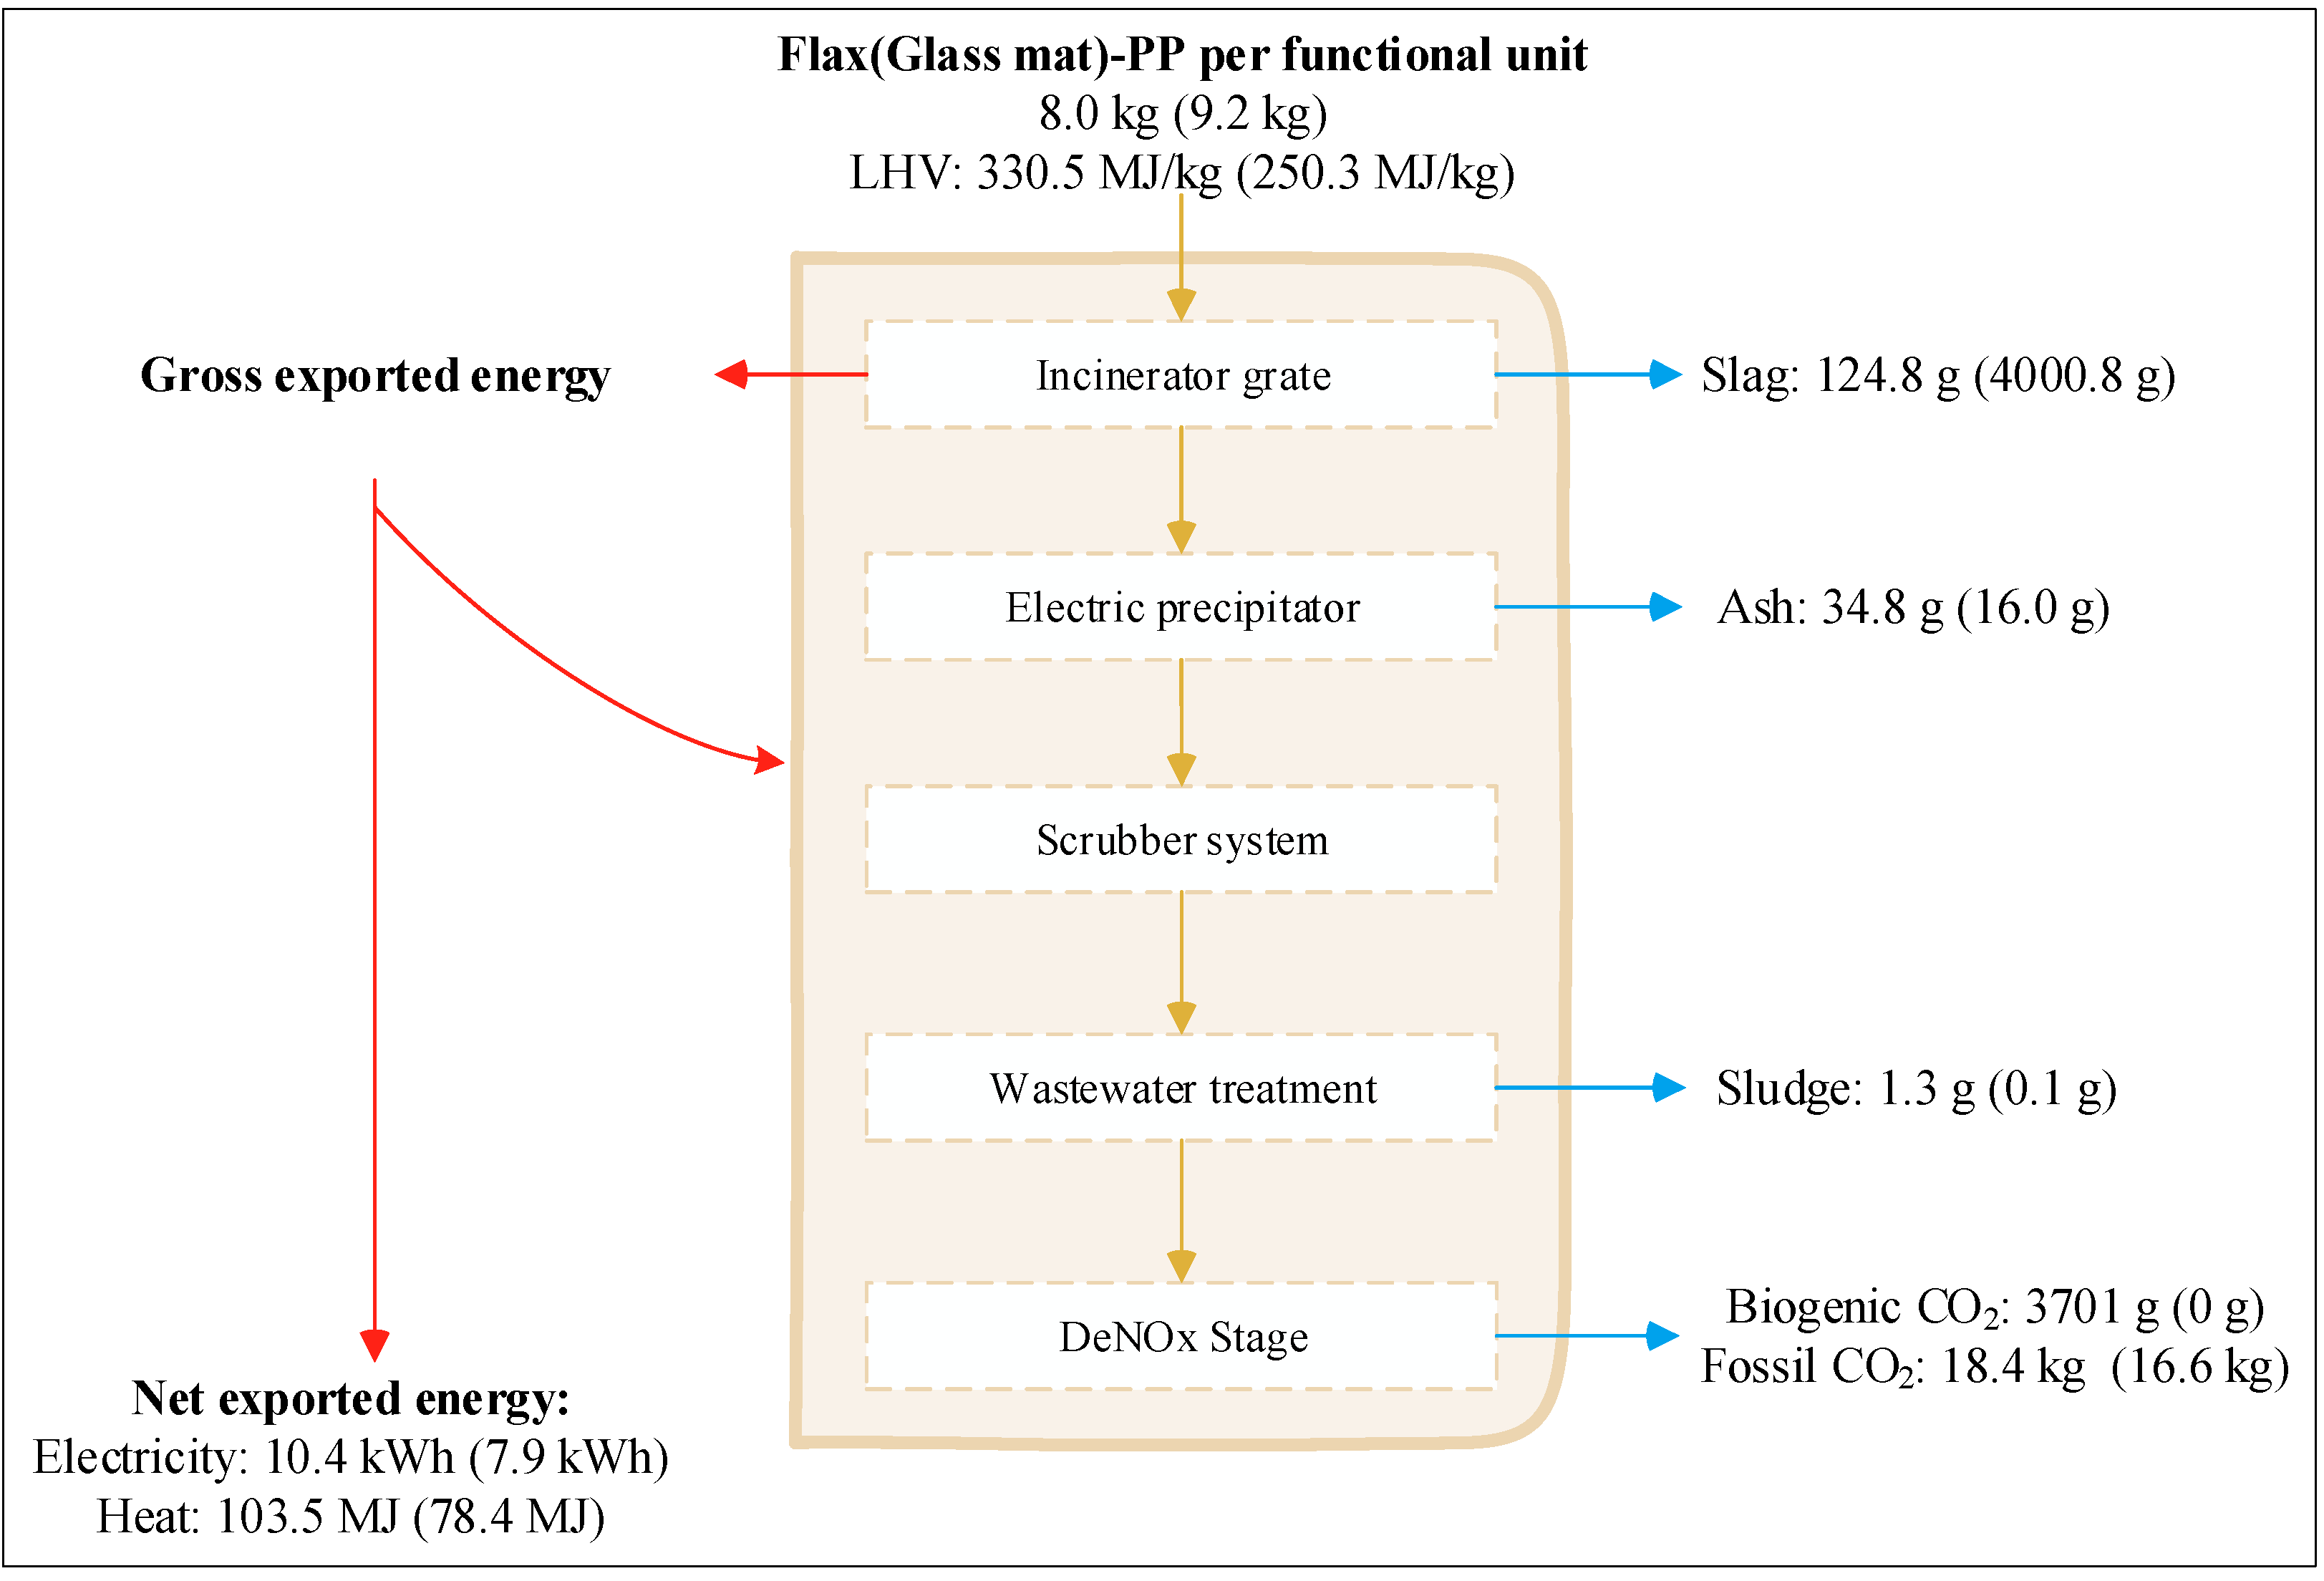
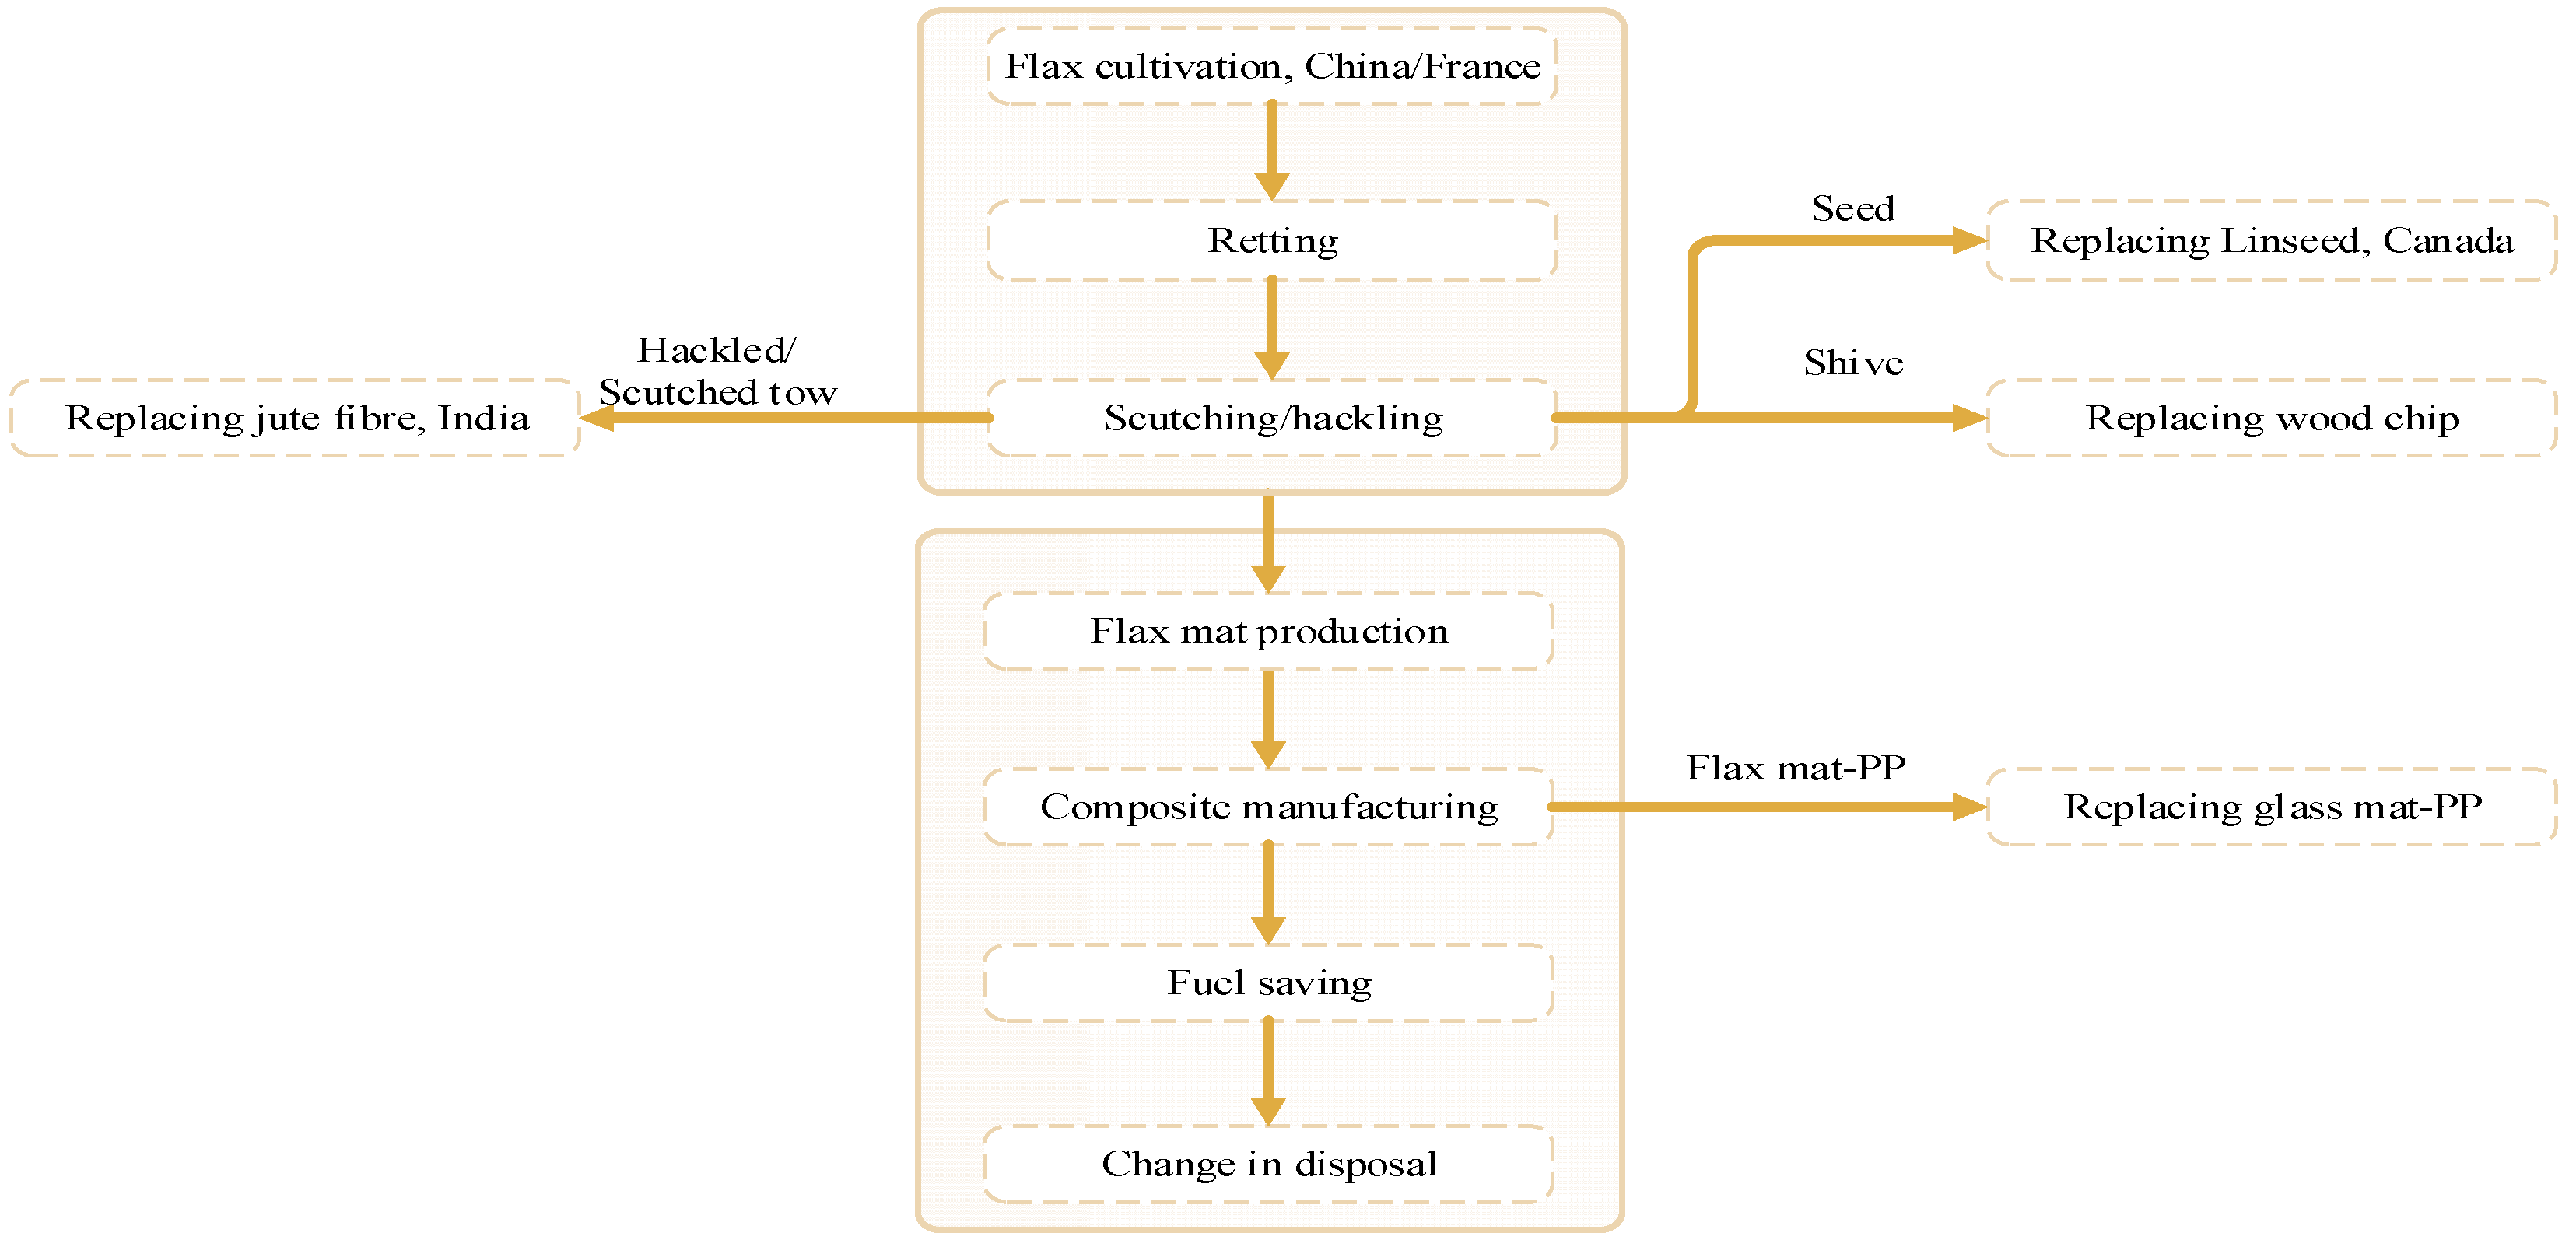
Incineration with energy recovery: The disposal scenario,
i.e., incineration with energy recovery by CHP technology, is modelled based on the methodology documented in Doka (2003) [
39] (
Figure 3). Total mass of the two types of components include 2.5% material loss from the compression mounding process. The lower heating values (LHV) applied here are 48.9 MJ/kg for PP, 20 MJ/kg for flax fibres, and −1.7 MJ/kg for glass fibres [
37]. The negative LHV value of glass fibre denotes that glass fibre is an inert material and served as burden during incineration. The transfer coefficients for specific elements are used to calculated end outlets including slag, sludge, ash, and airborne emissions (see
Figure 4). Since PP and flax fibre are mainly composed of carbon, oxygen, and hydrogen elements. Only CO
2 emissions, including both the biogenic carbon and fossil carbon, are calculated. Trace elements are omitted from the inventory. As shown in
Figure 3, part of the recovered energy are internally utilised to sustain the waste incineration system [
39]. The average net recovery efficiency for electricity and heat are 11.3% and 31.3%, respectively [
39]. These data are averages and are assumed not to differ from the marginal data.
Background LCIs: The Ecoinvent database is used to support the inventory modelling. Consequential electricity mixes are also modelled according to the Ecoinvent data by selecting corresponding electricity generation pathways. Other involved energy carriers, including natural gas, diesel, fuel oil, are sourced from the Ecoinvent database.
Figure 3.
Schematic flow of incineration with energy recovery for flax/glass mat-PP composites.
Figure 3.
Schematic flow of incineration with energy recovery for flax/glass mat-PP composites.
3.3. Life Cycle Impact Assessment Analysis
The evaluated impact categories are based on ReCiPe method (ReCiPe Midpoint (H)). The assessment is implemented in Simapro® software version 7.2.4. The carbon accounting principle in the cradle-to-grave life cycle assessment is that all biogenic carbon is considered to be global warming potential (GWP) neutral. The consequential supply mix ratio (70% Chinese flax fibre source and 30% French fibre source) is applied as the baseline scenario. Subsequently, the three alternative supply mix scenarios are evaluated and compared to the baseline results to provide implications for policy making.
3.3.1. Midpoint Environmental Impact Results
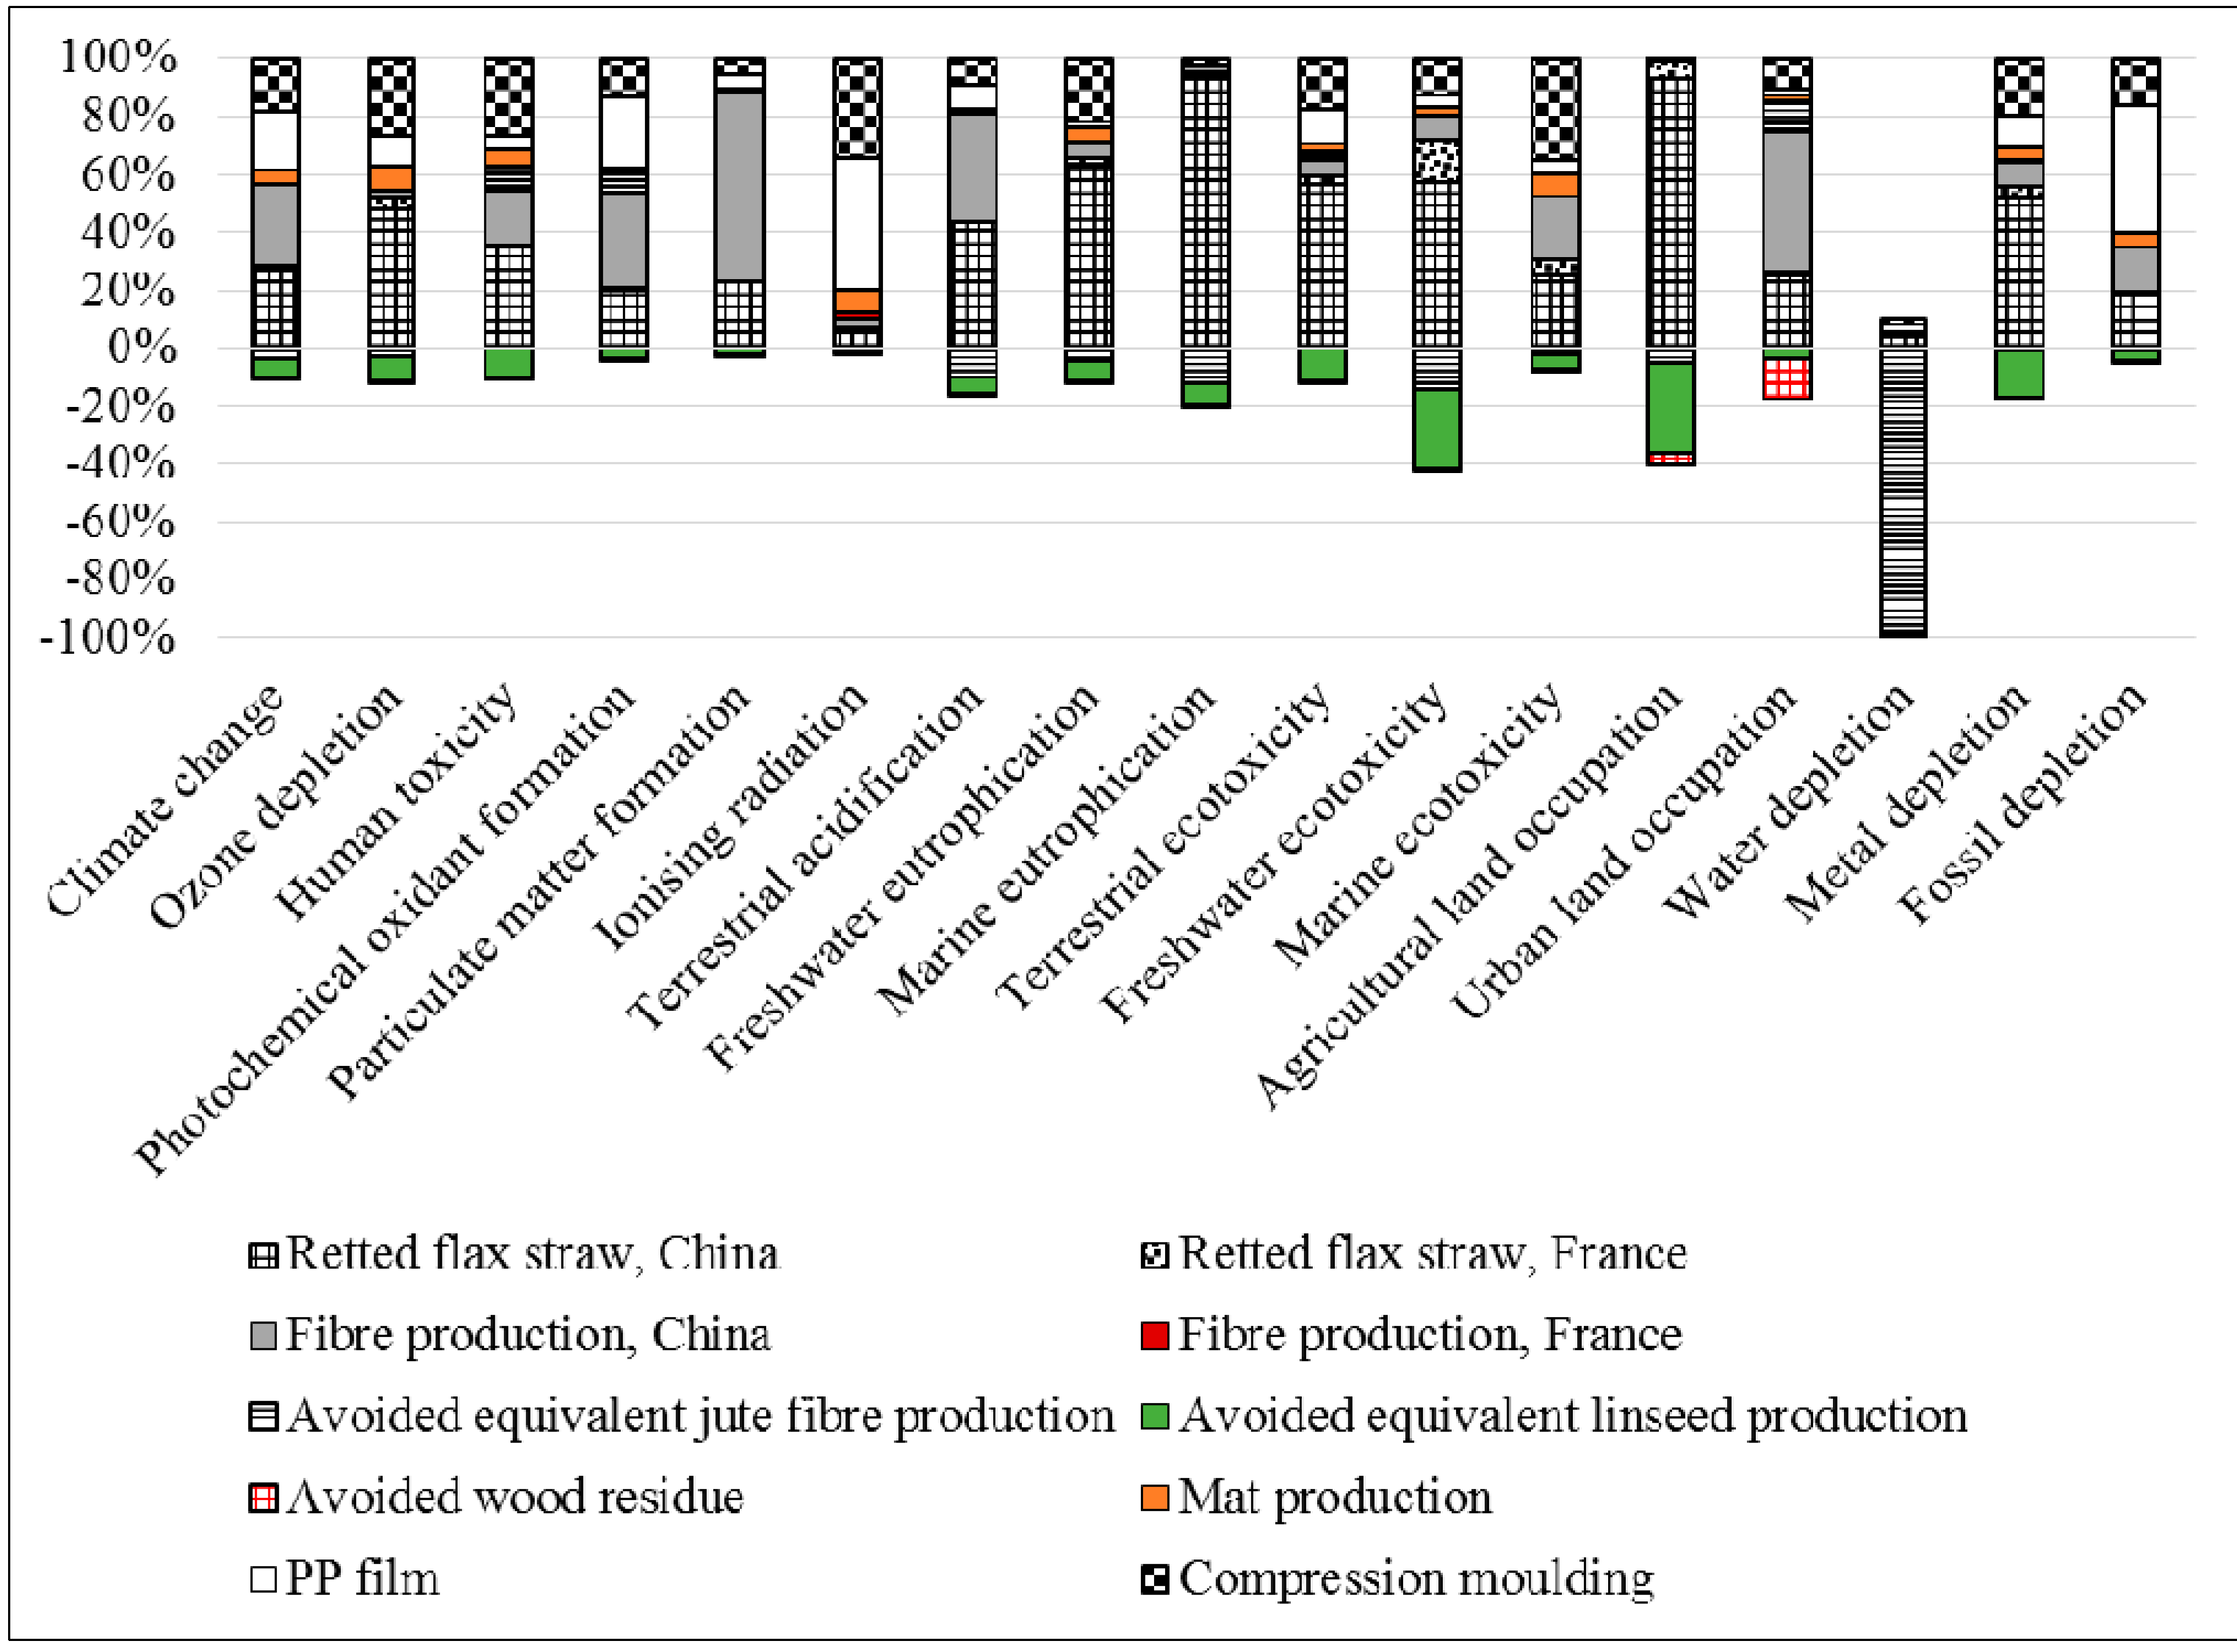
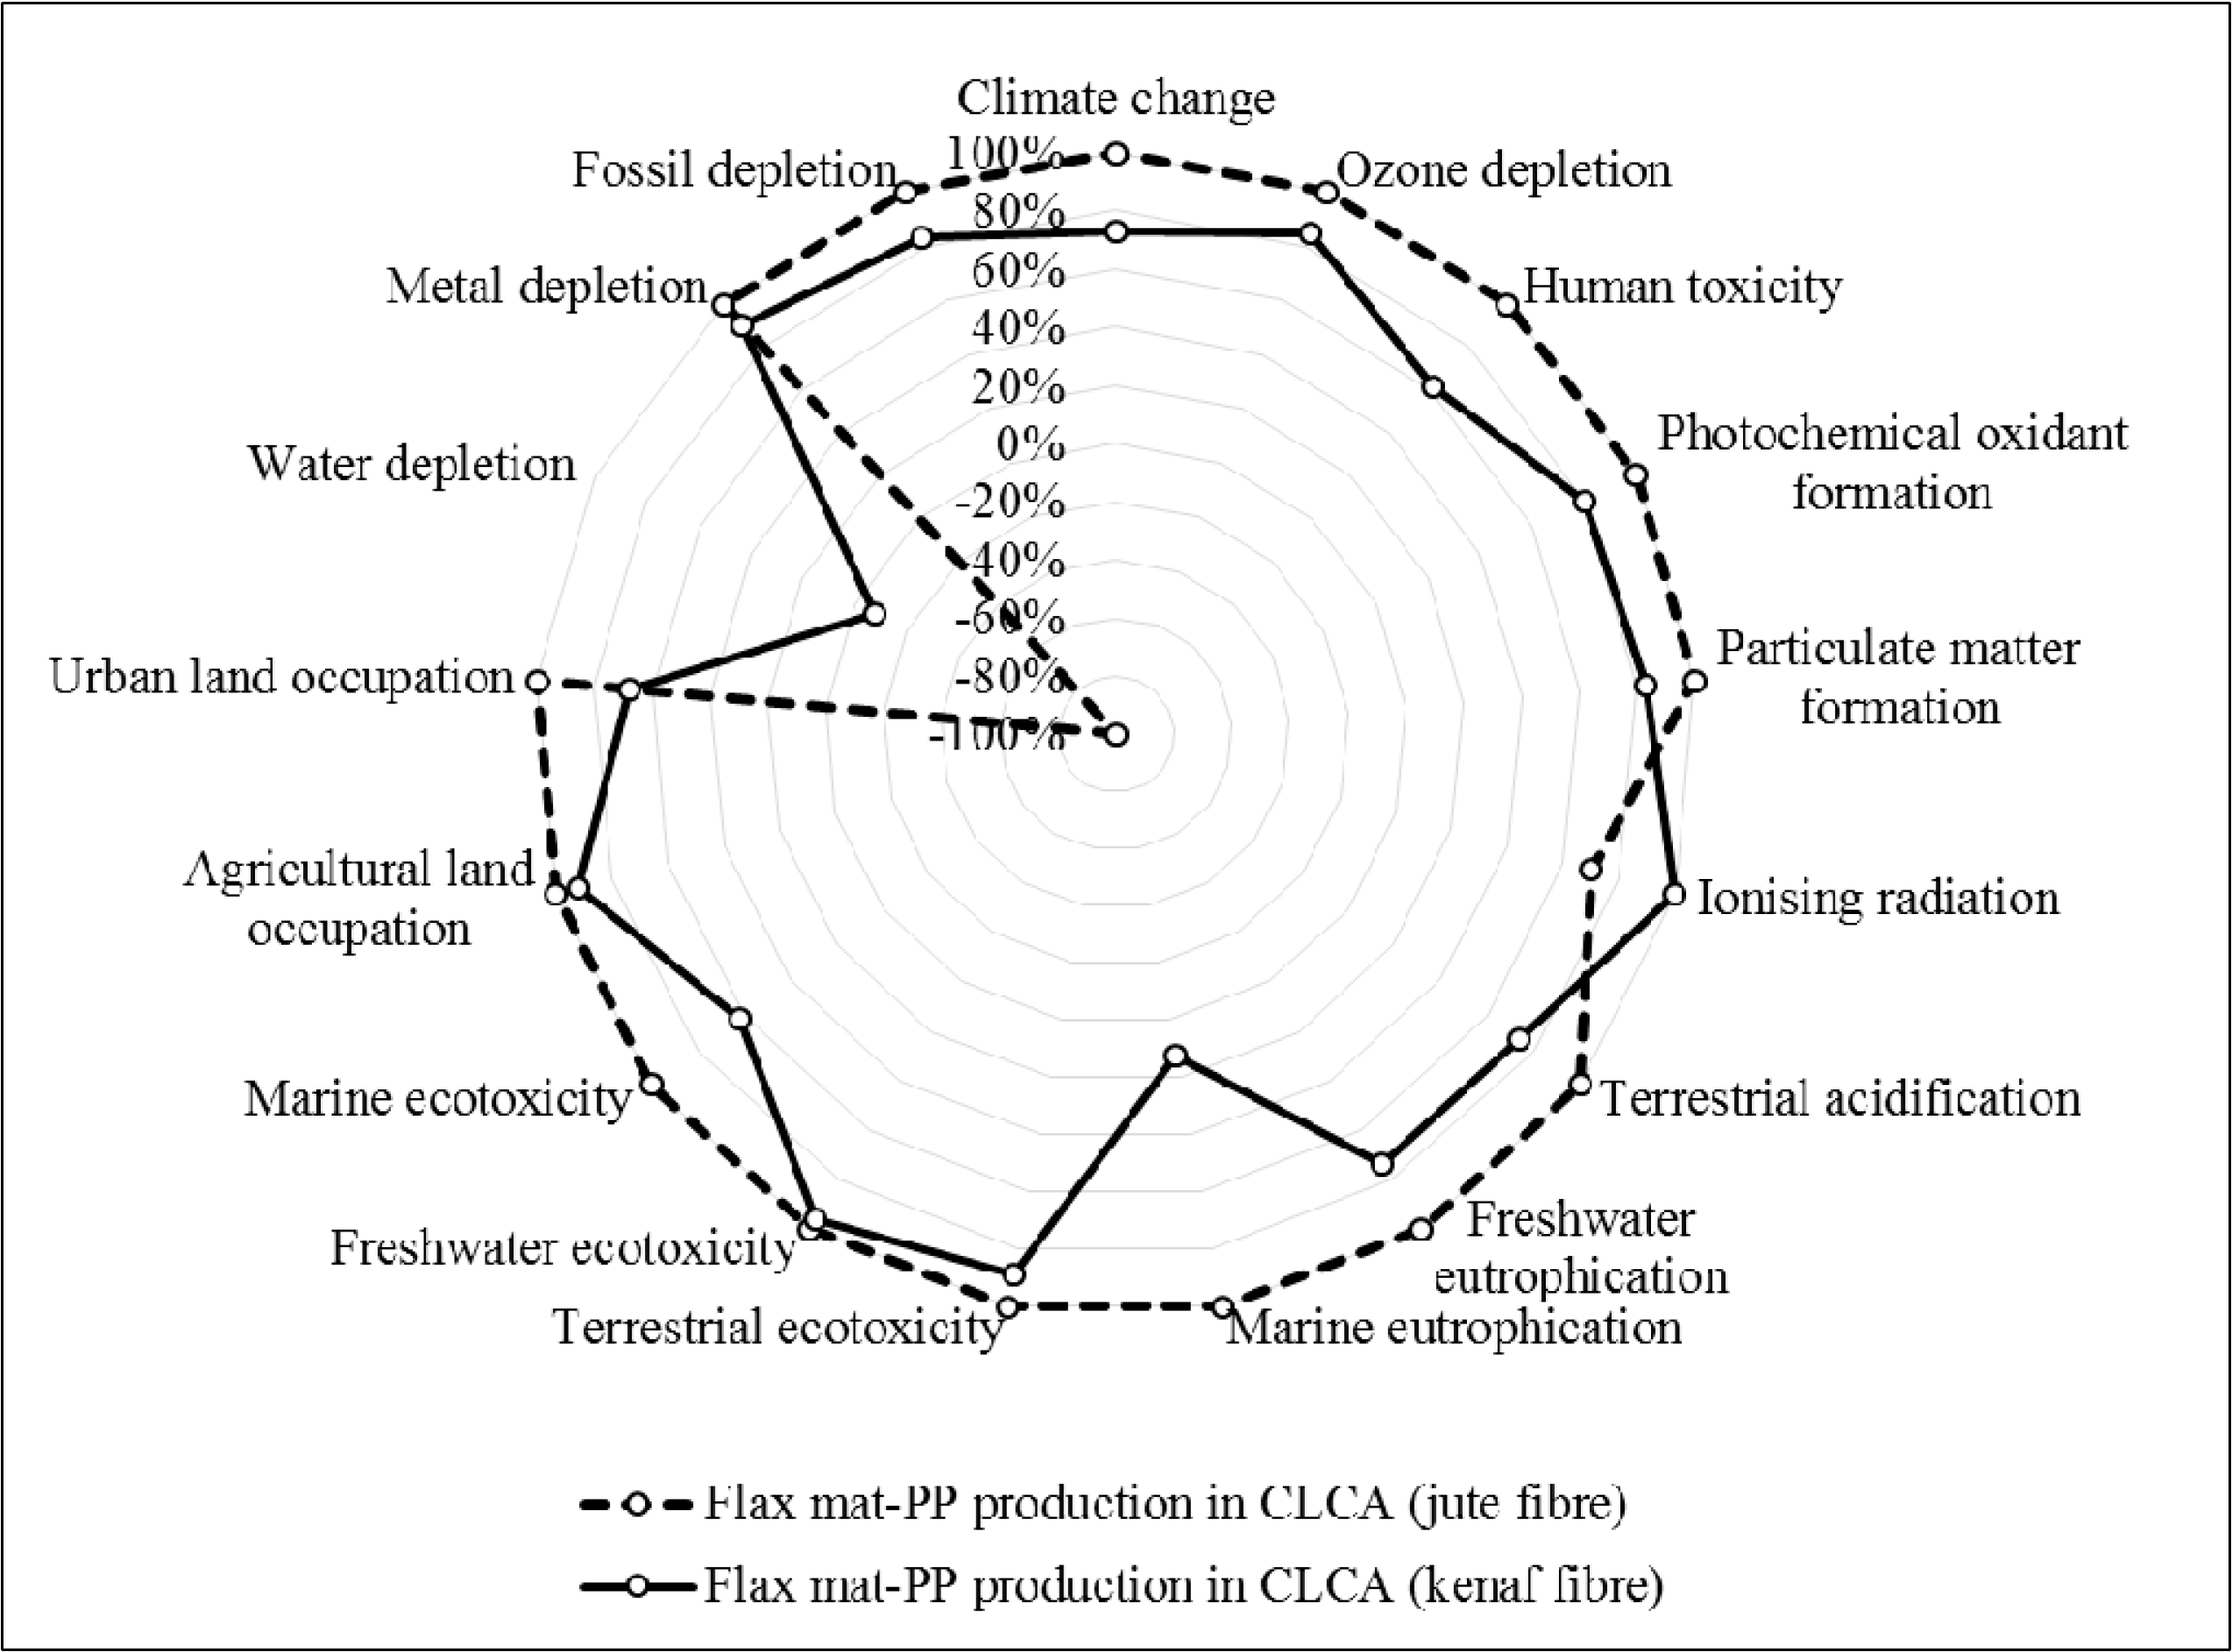
The environmental midpoint results for marginal flax mat-PP composite production of are shown in
Figure 4.
The retted flax straw production in China is found to be the most influential factor (average of 40%) on the environmental impact of marginal flax mat-PP composite production compared to a much smaller 2.7% fraction for retted flax straw production in France. Due to inferior flax cultivars applied in Chinese flax cultivation, the unretted flax straw yield in China (Heilongjiang province) remains around 3750 kg ha
–1, which is half the yield in France. Moreover, Chinese flax straw contains only 11% fibre content, and the hackling efficiency is 45% [
40]. Both of these values are much lower than those of France flax fibre and fibre extraction, which are 22% and 60%, respectively. Besides, warm-water retting, which is the most common technology used in China, increases the environmental burden compared to dew retting in France because more energy is required to dry the flax straw after retting. In addition, particularly high burden intensity of Chinese flax fibre production is recorded in the categories of particulate matter formation and terrestrial acidification categories due to coal-fired electricity generation in China (
Table 5).
The extruded PP film has an average environmental burden share of 13.4% among these impact categories. A particularly high share is observed in fossil depletion (~50%), which is because PP is conventionally derived from crude oil. The mat manufacturing process causes negligible environmental impacts in most categories. The last step in composite fabrication, i.e., compression moulding, is more noticeable than the mat manufacturing process in terms of the environmental burden. The environmental impact of the two manufacturing processes reflects their electricity consumption levels.
Another important finding is that a net negative impact value is recorded for water depletion in flax mat-PP production. The equivalent jute fibre production involves irrigation during the cultivation stage. Given that jute fibres are displaced by a co-product from flax fibre production, i.e., flax tows, a significant reduction in water is realised.
Figure 4.
Midpoint results for the marginal production of per kg flax mat-PP composites using consequential LCA.
Figure 4.
Midpoint results for the marginal production of per kg flax mat-PP composites using consequential LCA.
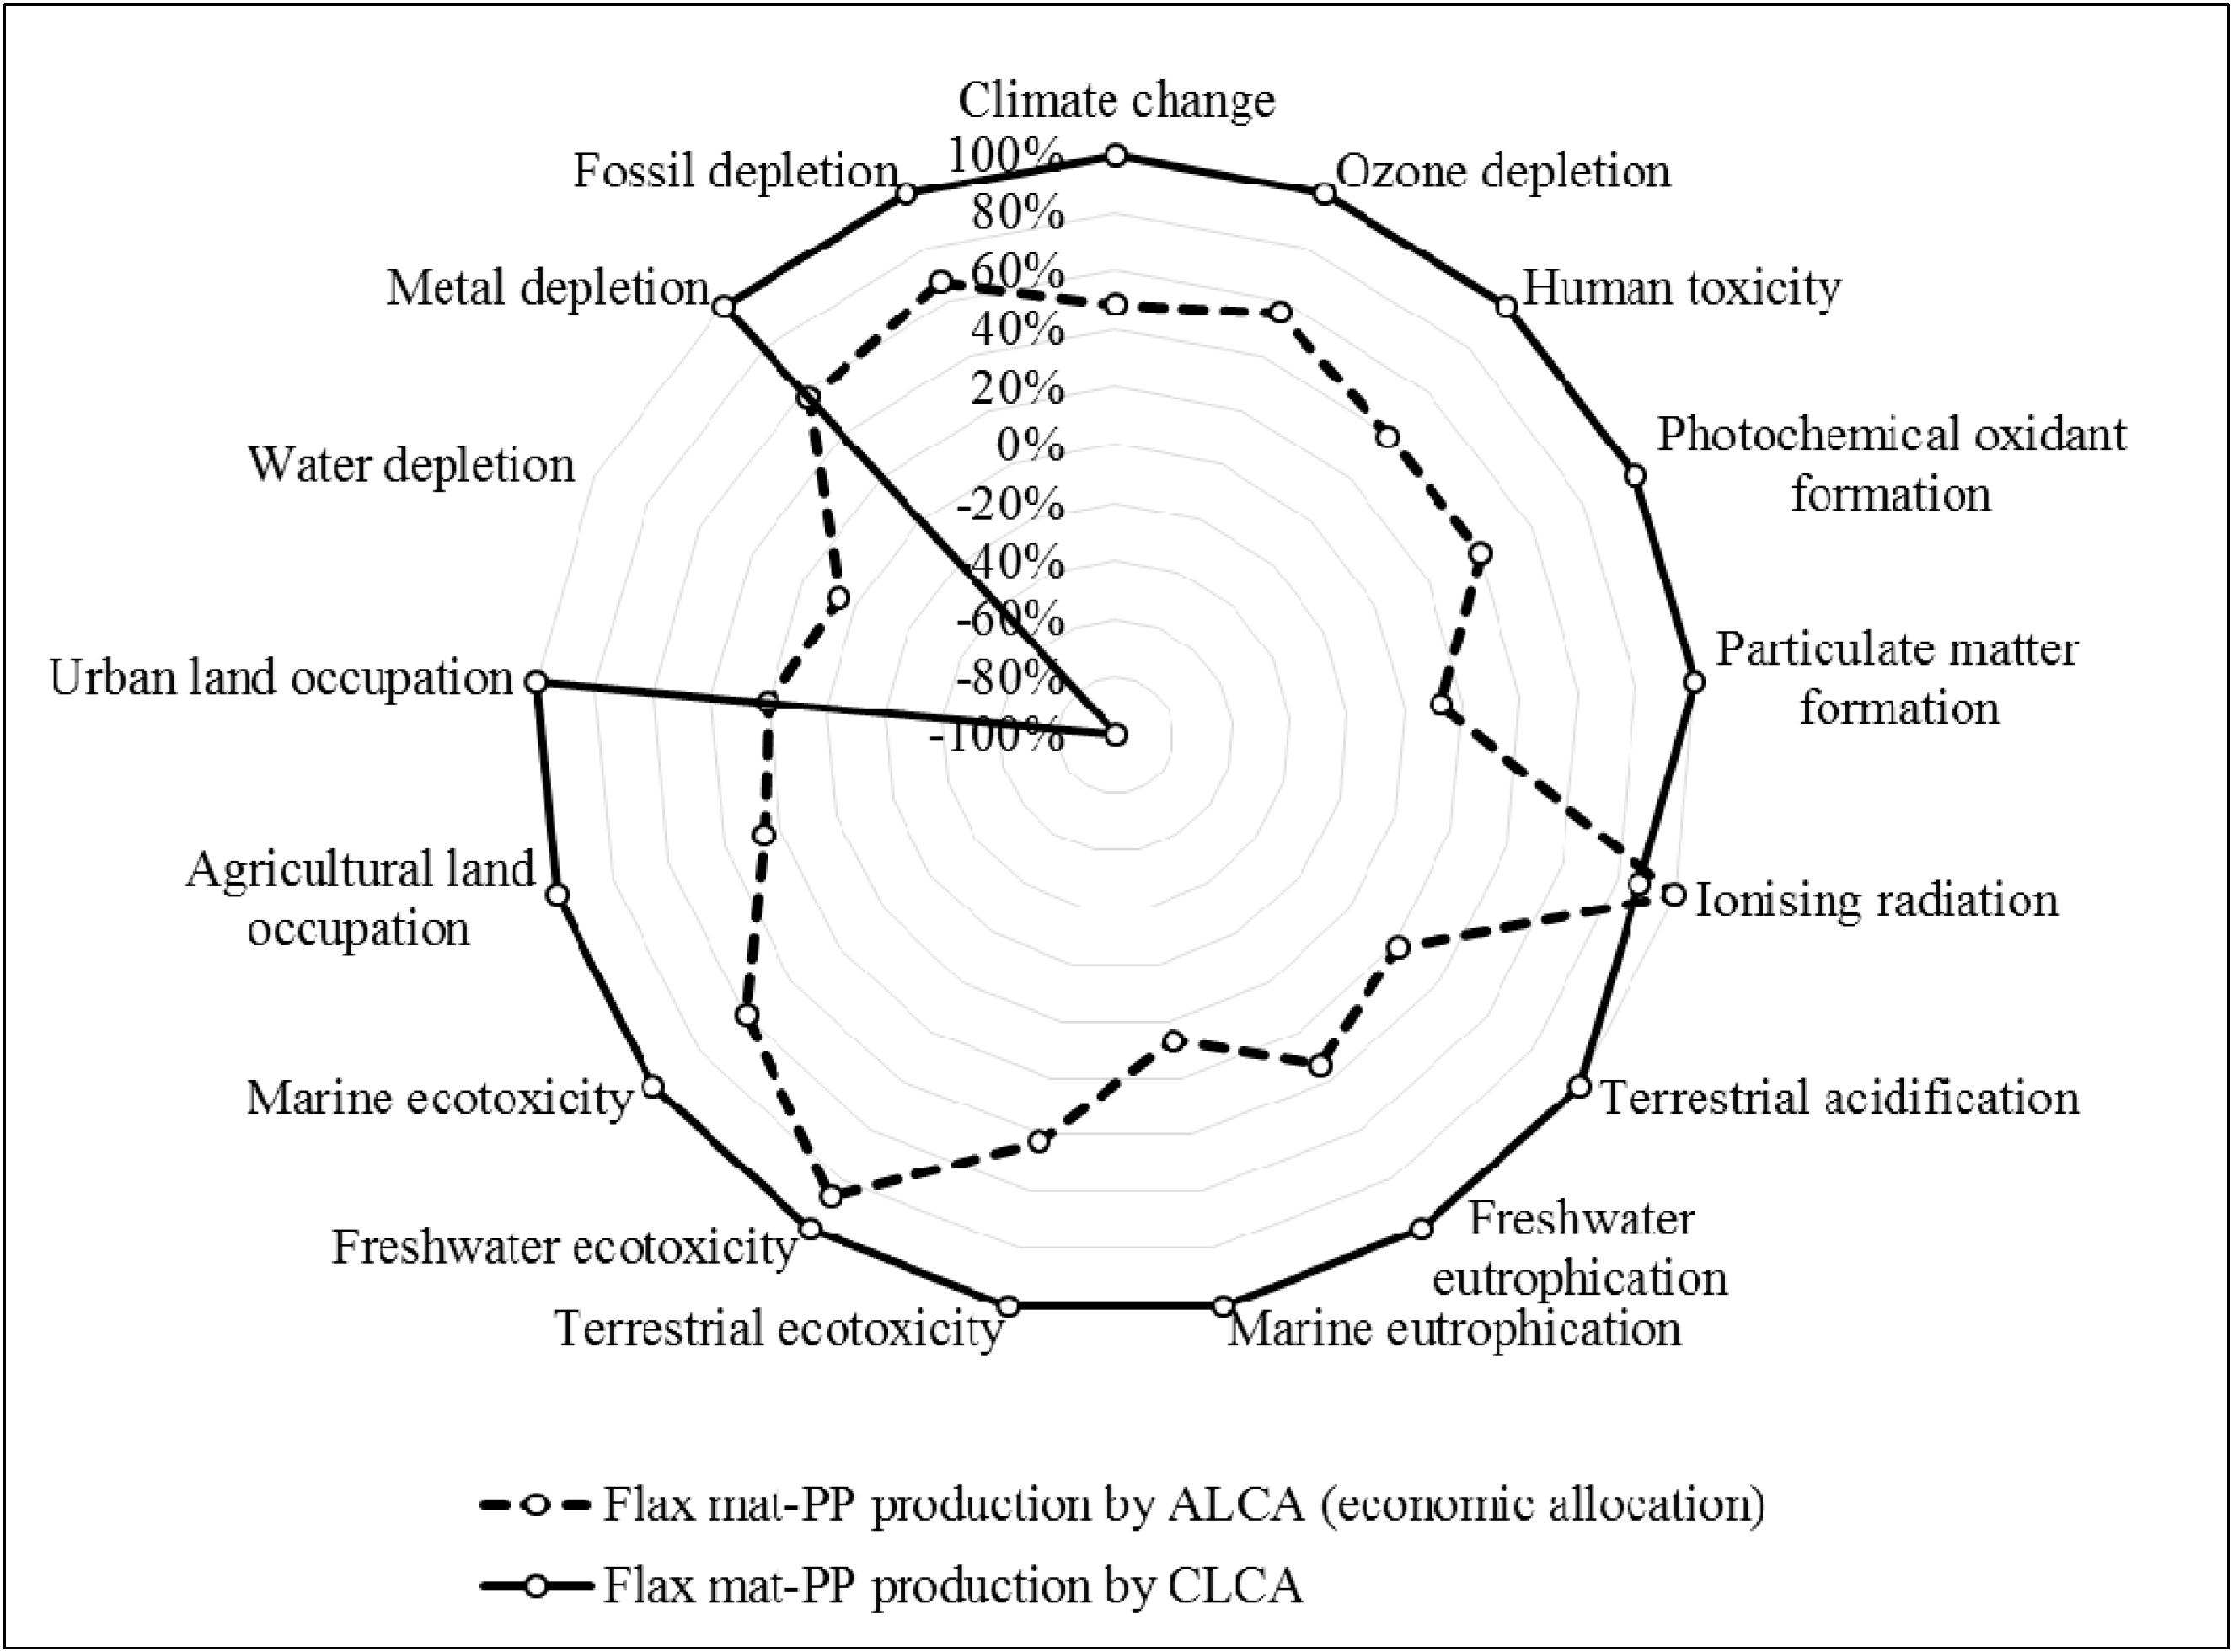
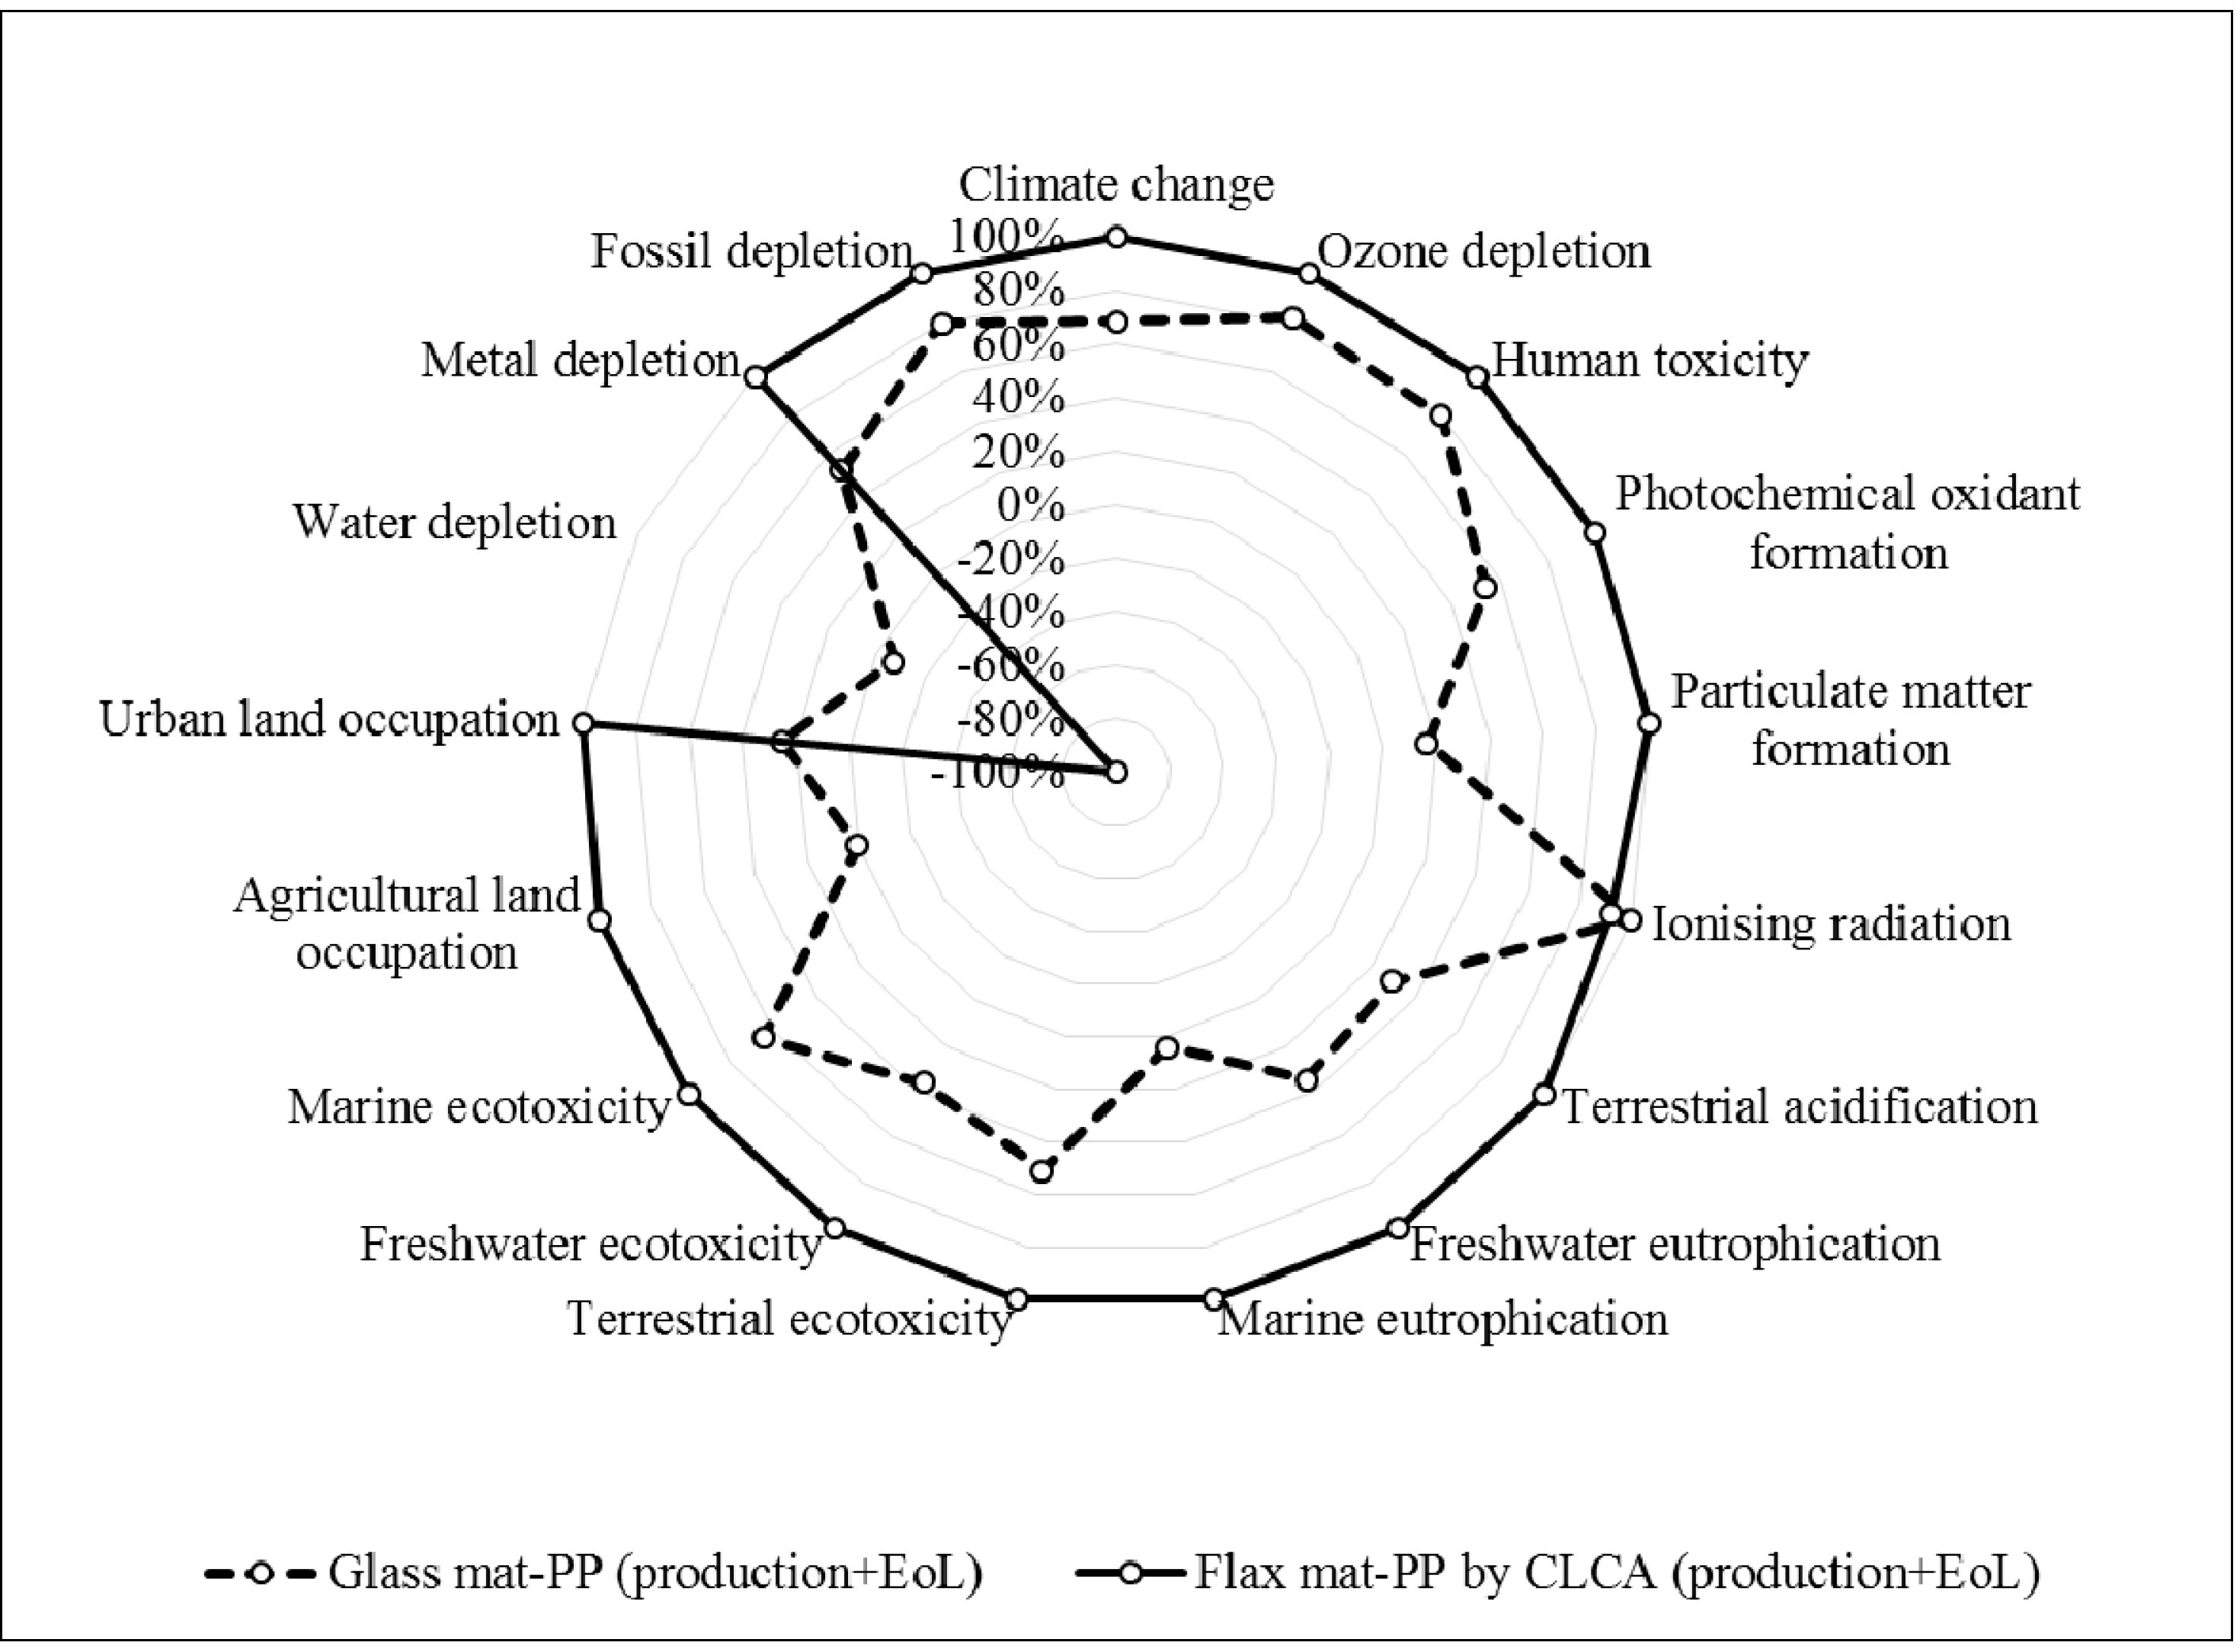
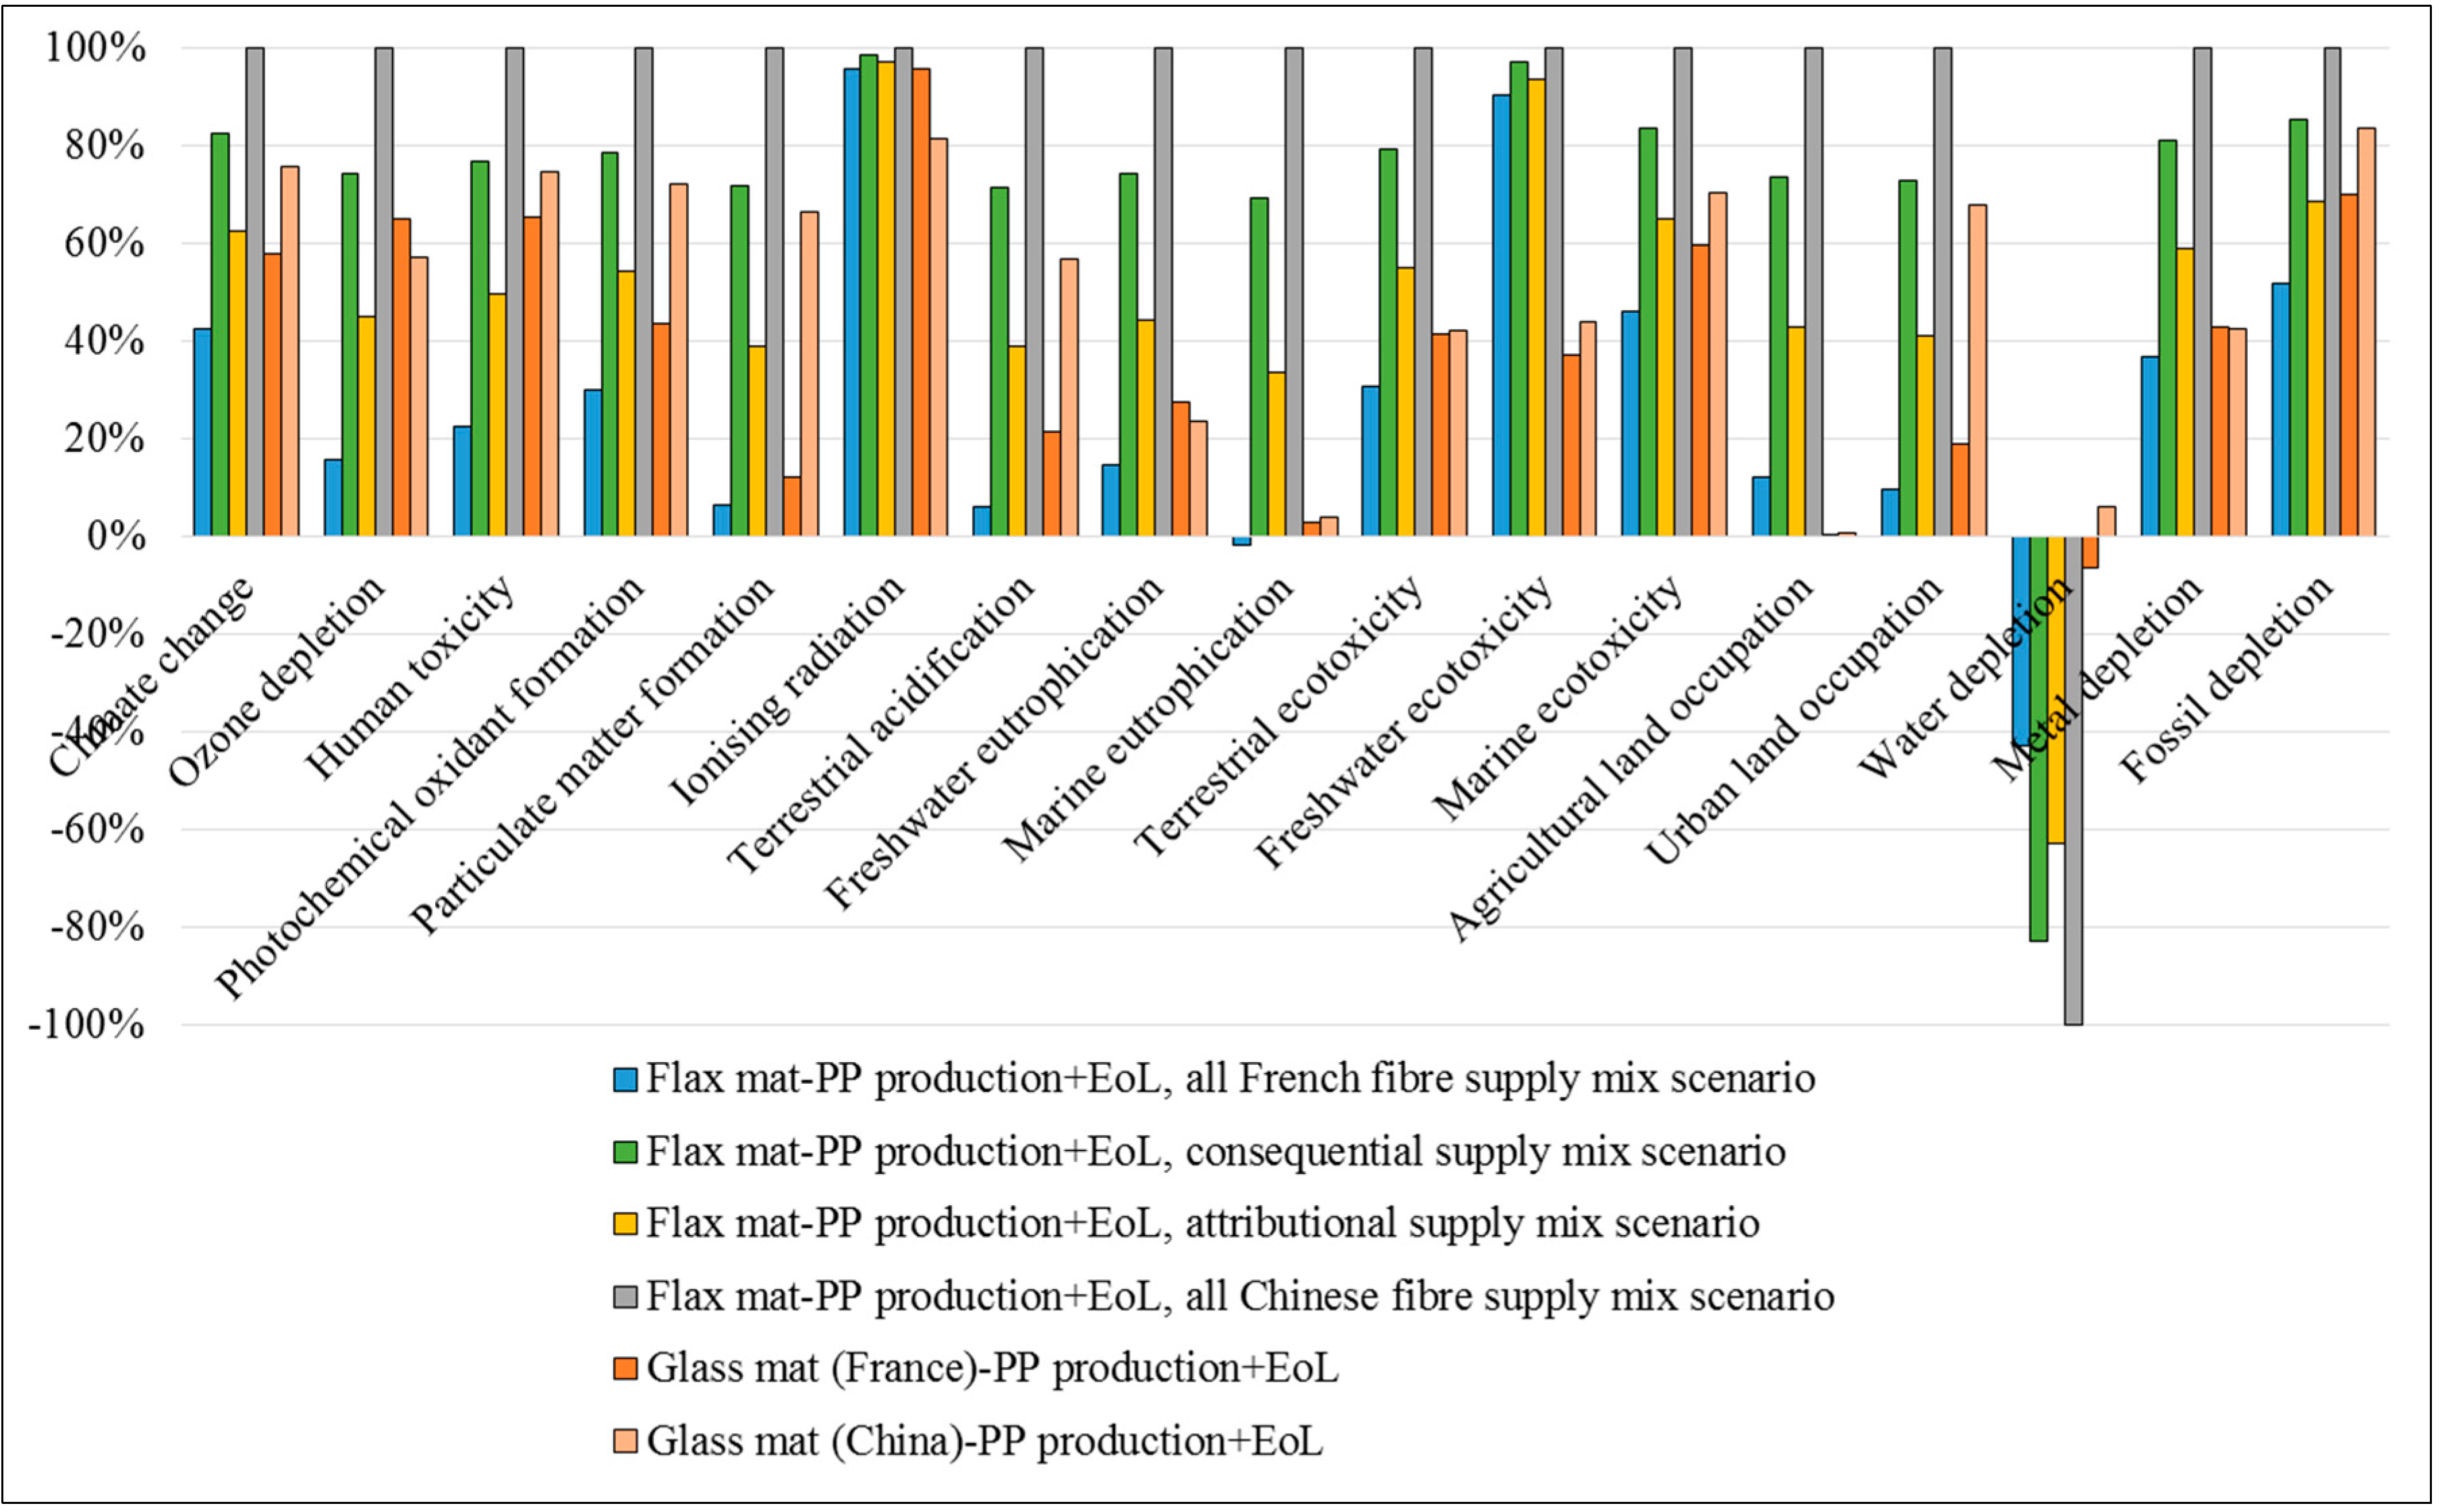
3.3.2. Comparison between Flax Mat-PP and Glass Mat-PP in the Production and end-of-life (EoL) Stages
The effect from the combined production and EoL stages is separately evaluated because it can represent the environmental profile of applications where no significant energy or materials are invested during the use phase (
Figure 5).
Figure 5.
Environmental impact comparison between flax mat-PP and glass mat-PP during production and end-of-life (EoL) phases.
Figure 5.
Environmental impact comparison between flax mat-PP and glass mat-PP during production and end-of-life (EoL) phases.
The most pronounced finding from the comparison is that in most impact categories, including climate change and fossil depletion, the flax mat-PP impact values are larger than the glass mat-PP values using the CLCA approach. The high impact of flax fibre production relative to glass fibre production is related to the following:
- (1)
Inferior flax cultivars produce lower flax fibre yield efficiencies in China. In France, a cultivated flax hectare produces approximately 1000 kg hackled long flax fibres. On the same basis, only 150 kg of hackled flax long fibres are obtained in China.
- (2)
The Chinese electricity mix depends heavily on coal (
Table 5). Moreover, coal-fired electricity is particularly detrimental to the environment in terms of terrestrial acidification and particulate matter formation.
3.3.3. Life Cycle Environmental Impact Changes
Environmental impact changes are assessed using the difference in impact values between flax mat/PP and glass mat/PP for each life cycle stage (
Table 6). The use phase contributes most to the impact reduction. The EoL stage constituents a much smaller fraction of the impact reduction. Moreover, the production phase incurs positive environmental impact changes in most impact categories because the primary component of the marginal flax supply mix,
i.e., Chinese flax fibre production, is environmentally burdensome. In 10 of the 17 impact categories, net positive values are obtained for a full life cycle. It indicates that, when shifting to flax mat-PP, the large impact increase in the production stage overrides the impact reduction in both the use and EoL stages.
Table 6.
Impact changes induced by flax mat-PP replacing glass mat-PP.
Table 6.
Impact changes induced by flax mat-PP replacing glass mat-PP.
| | Unit | Production | Use | End-of-life (EoL) | Total |
|---|
| Climate change | kg CO2 eq | 23.8 | −22.5 | −1.6 | −0.4 |
| Ozone depletion | mg CFC−11 eq | 0.7 | −3.1 | −0.3 | −2.7 |
| Human toxicity | kg 1,4−DB eq | 4.7 | −0.9 | −1.0 | 2.8 |
| Photochemical oxidant formation | g NMVOC | 95.2 | −109.4 | −4.5 | −18.7 |
| Particulate matter formation | g PM19 eq | 214.2 | −22.6 | −2.2 | 189.5 |
| Ionising radiation | g U235 eq | −177.7 | −508.7 | −1053.2 | −1739.6 |
| Terrestrial acidification | g SO2 eq | 299.3 | −65.6 | −6.8 | 226.8 |
| Freshwater eutrophication | g P eq | 22.4 | −0.6 | −1.4 | 20.3 |
| Marine eutrophication | g N eq | 121.0 | −2.7 | −0.4 | 117.9 |
| Terrestrial ecotoxicity | g 1,4−DB eq | 3.4 | −3.2 | −0.2 | 0.1 |
| Freshwater ecotoxicity | g 1,4−DB eq | 366.6 | −20.3 | −20.2 | 326.2 |
| Marine ecotoxicity | g 1,4−DB eq | 121.1 | −33.5 | −20.6 | 67.1 |
| Agricultural land occupation | m2a | 72.3 | 0.0 | 0.0 | 72.2 |
| Urban land occupation | m2a | 0.2 | 0.0 | 0.0 | 0.2 |
| Water depletion | litre | −3428.4 | −27.4 | −11.1 | −3466.9 |
| Metal depletion | g Fe eq | 786.0 | −102.8 | −64.2 | 619.0 |
| Fossil depletion | kg oil eq | 5.1 | −7.7 | −1.0 | −3.6 |
3.3.4. Implication for Policy Making
In general, together with the consequential mix evaluated before, the four scenarios constituent a set of “what-if” analysis, which provides insights under the assumptions used and indications for policy making in terms of the environmental impact.
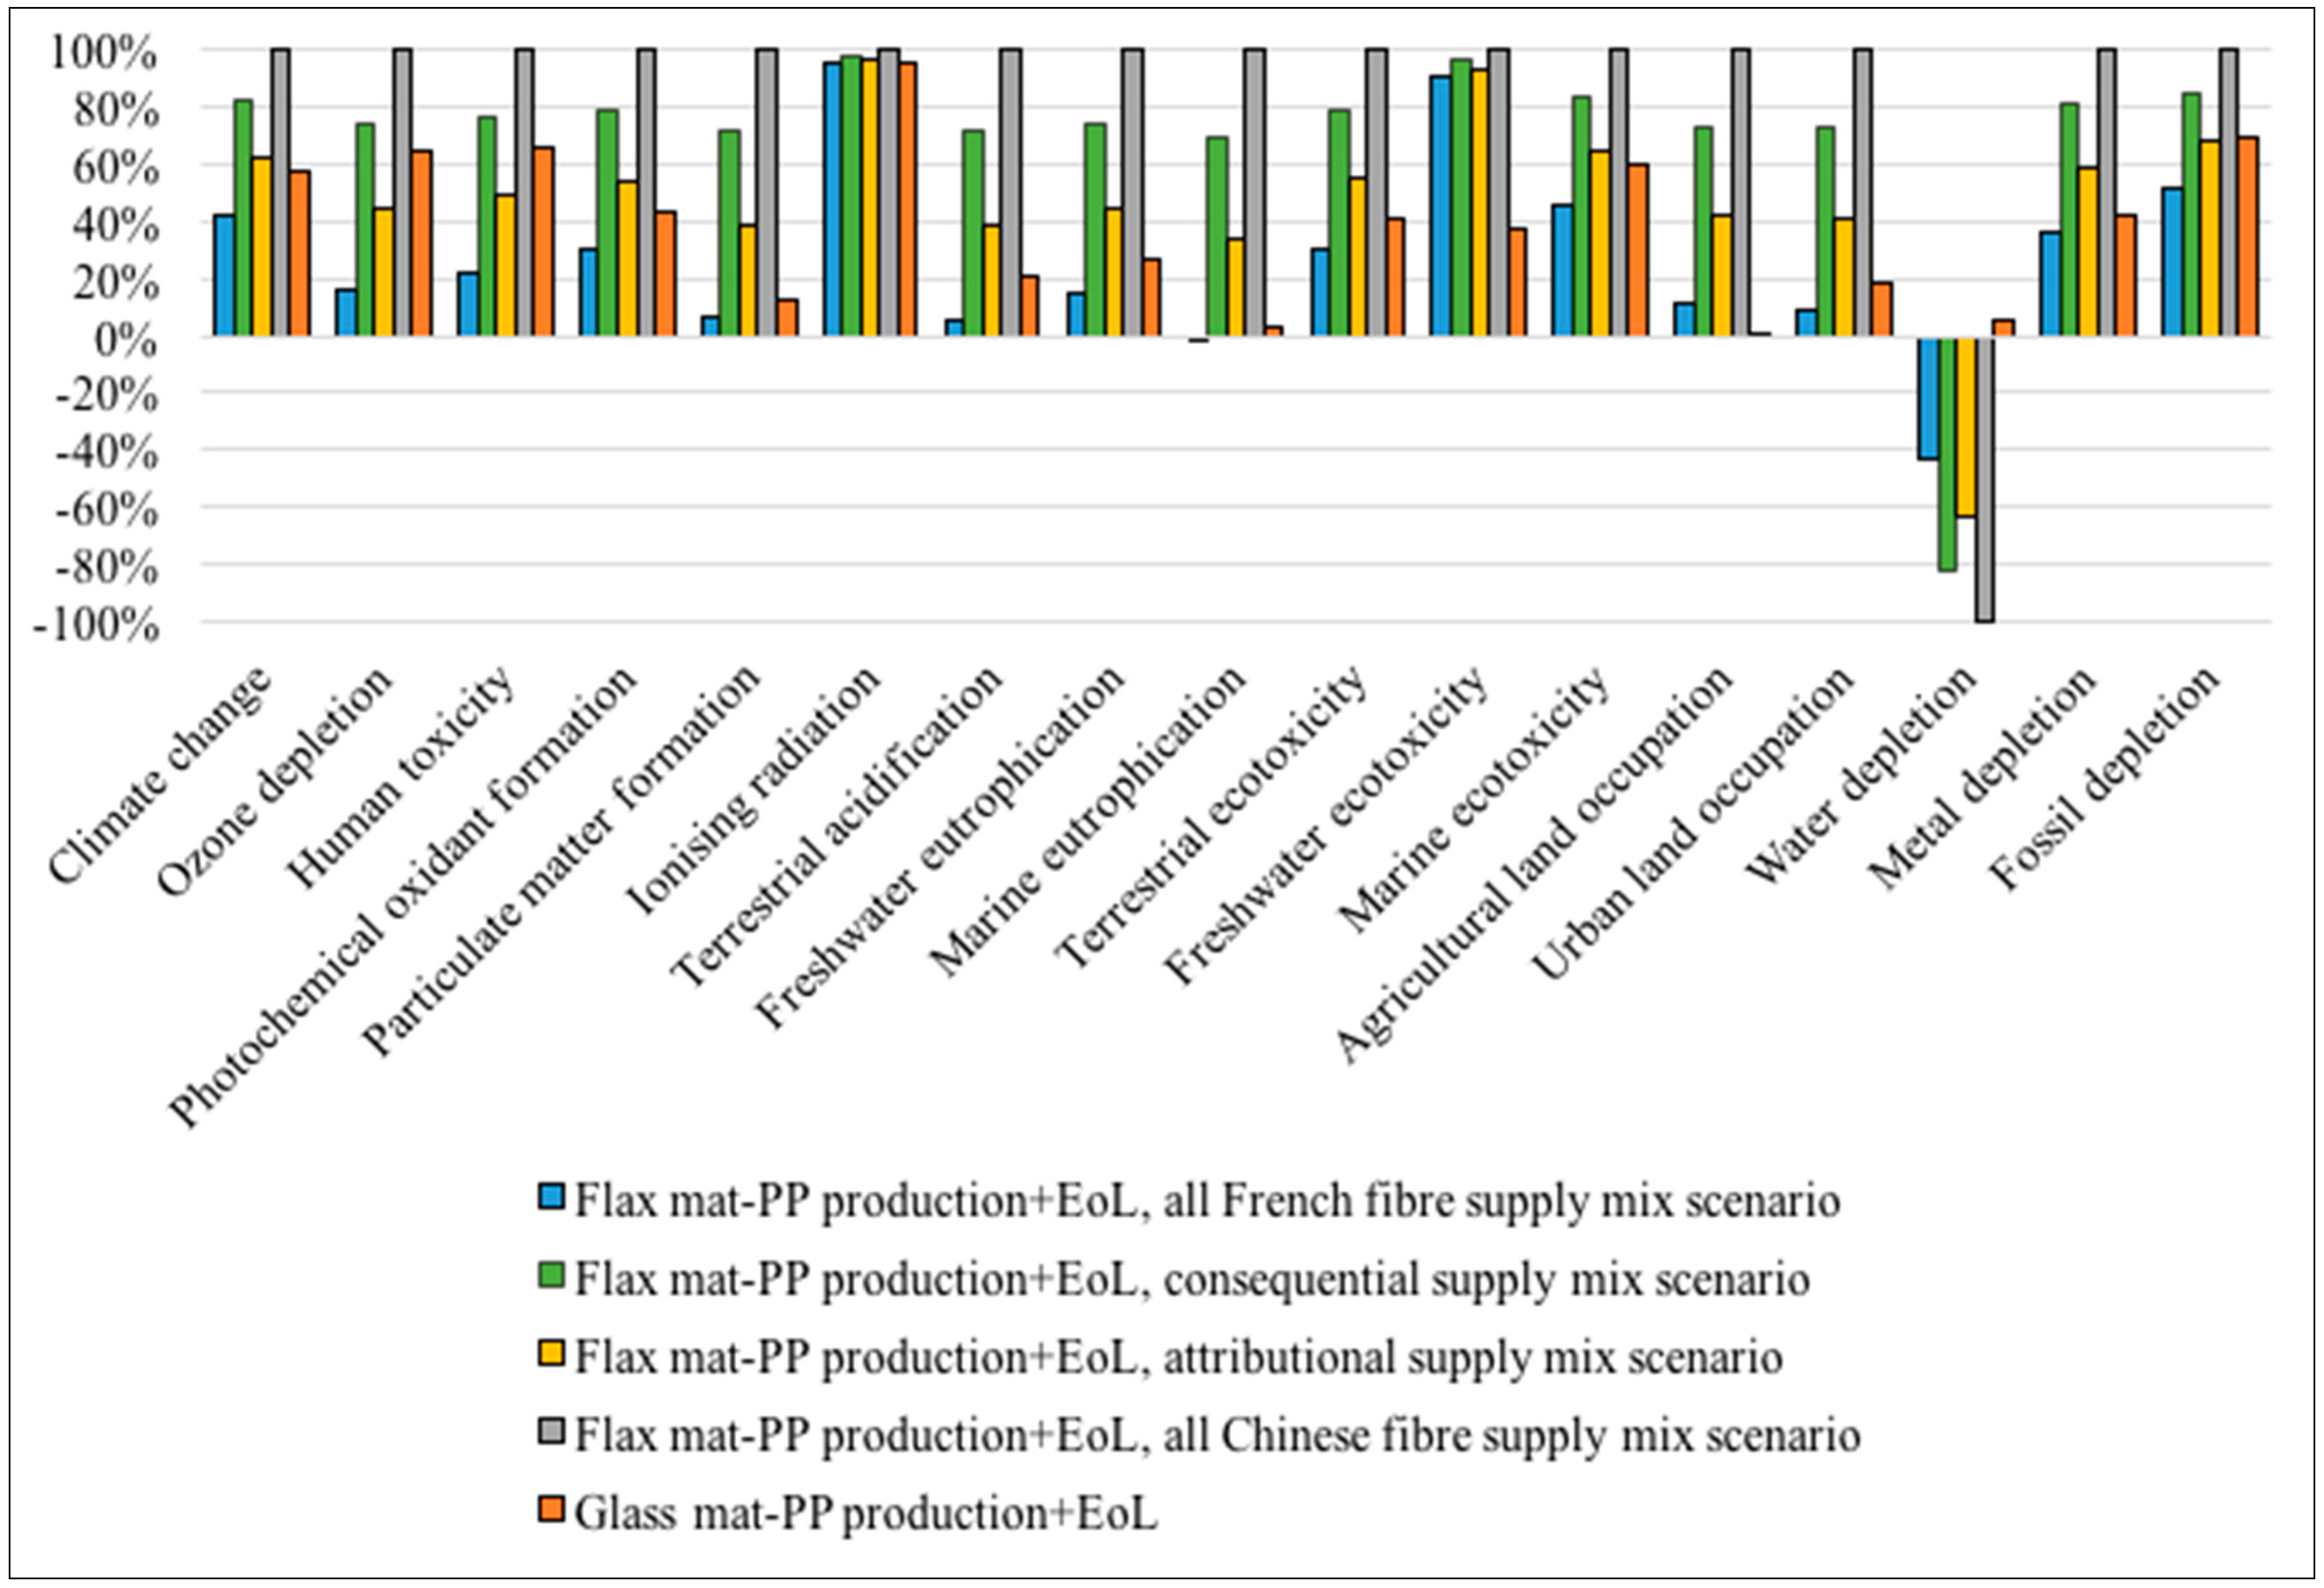
If switching from the already applied consequential marginal supply mix to “all French fibre supply mix” scenario, significant reductions are achieved in most impact categories. The “all French flax fibre” scenario largely represents the situation of a pure ALCA study. Thus smaller environmental impact values are obtained compared to glass mat-PP under such marginal supply scenario (
Figure 6). On the contrary, the “all Chinese fibre supply mix” scenario proposes significant increases in multiple categories in reference to the “all French fibre” scenario (100% French flax fibre source). In most impact categories, the “all Chinese fibre” scenario (100% Chinese flax fibre source) leads to 2–4 times higher impact values including categories of climate change, photochemical oxidant formation, human toxicity, freshwater eutrophication, terrestrial ecotoxicity, marine ecotoxicity, metal depletion and fossil depletion. In some extreme cases of terrestrial acidification, particulate matter formation, agricultural land occupation and urban land occupation impact categories, 8–16 times higher impact values are recorded following the “all Chinese fibre” scenario.
Figure 6.
Environmental impact comparison for flax mat-PP with different scenarios of marginal flax fibre supply over production and EoL phases.
Figure 6.
Environmental impact comparison for flax mat-PP with different scenarios of marginal flax fibre supply over production and EoL phases.
Within the upper and lower boundaries of environmental impact from the “all Chinese fibre” scenario and “all French fibre” scenario, respectively, the additional “attributional supply mix” scenario shows global reductions among impact categories in reference to the presented “consequential supply mix” scenario. In this situation, it can be found that the environmental impact profile of flax mat-PP becomes comparable to the profile of glass mat-PP. Hence, the attributional share, which is 60% French flax fibre and 40% Chinese flax fibre, can be used as a break-even criterion.
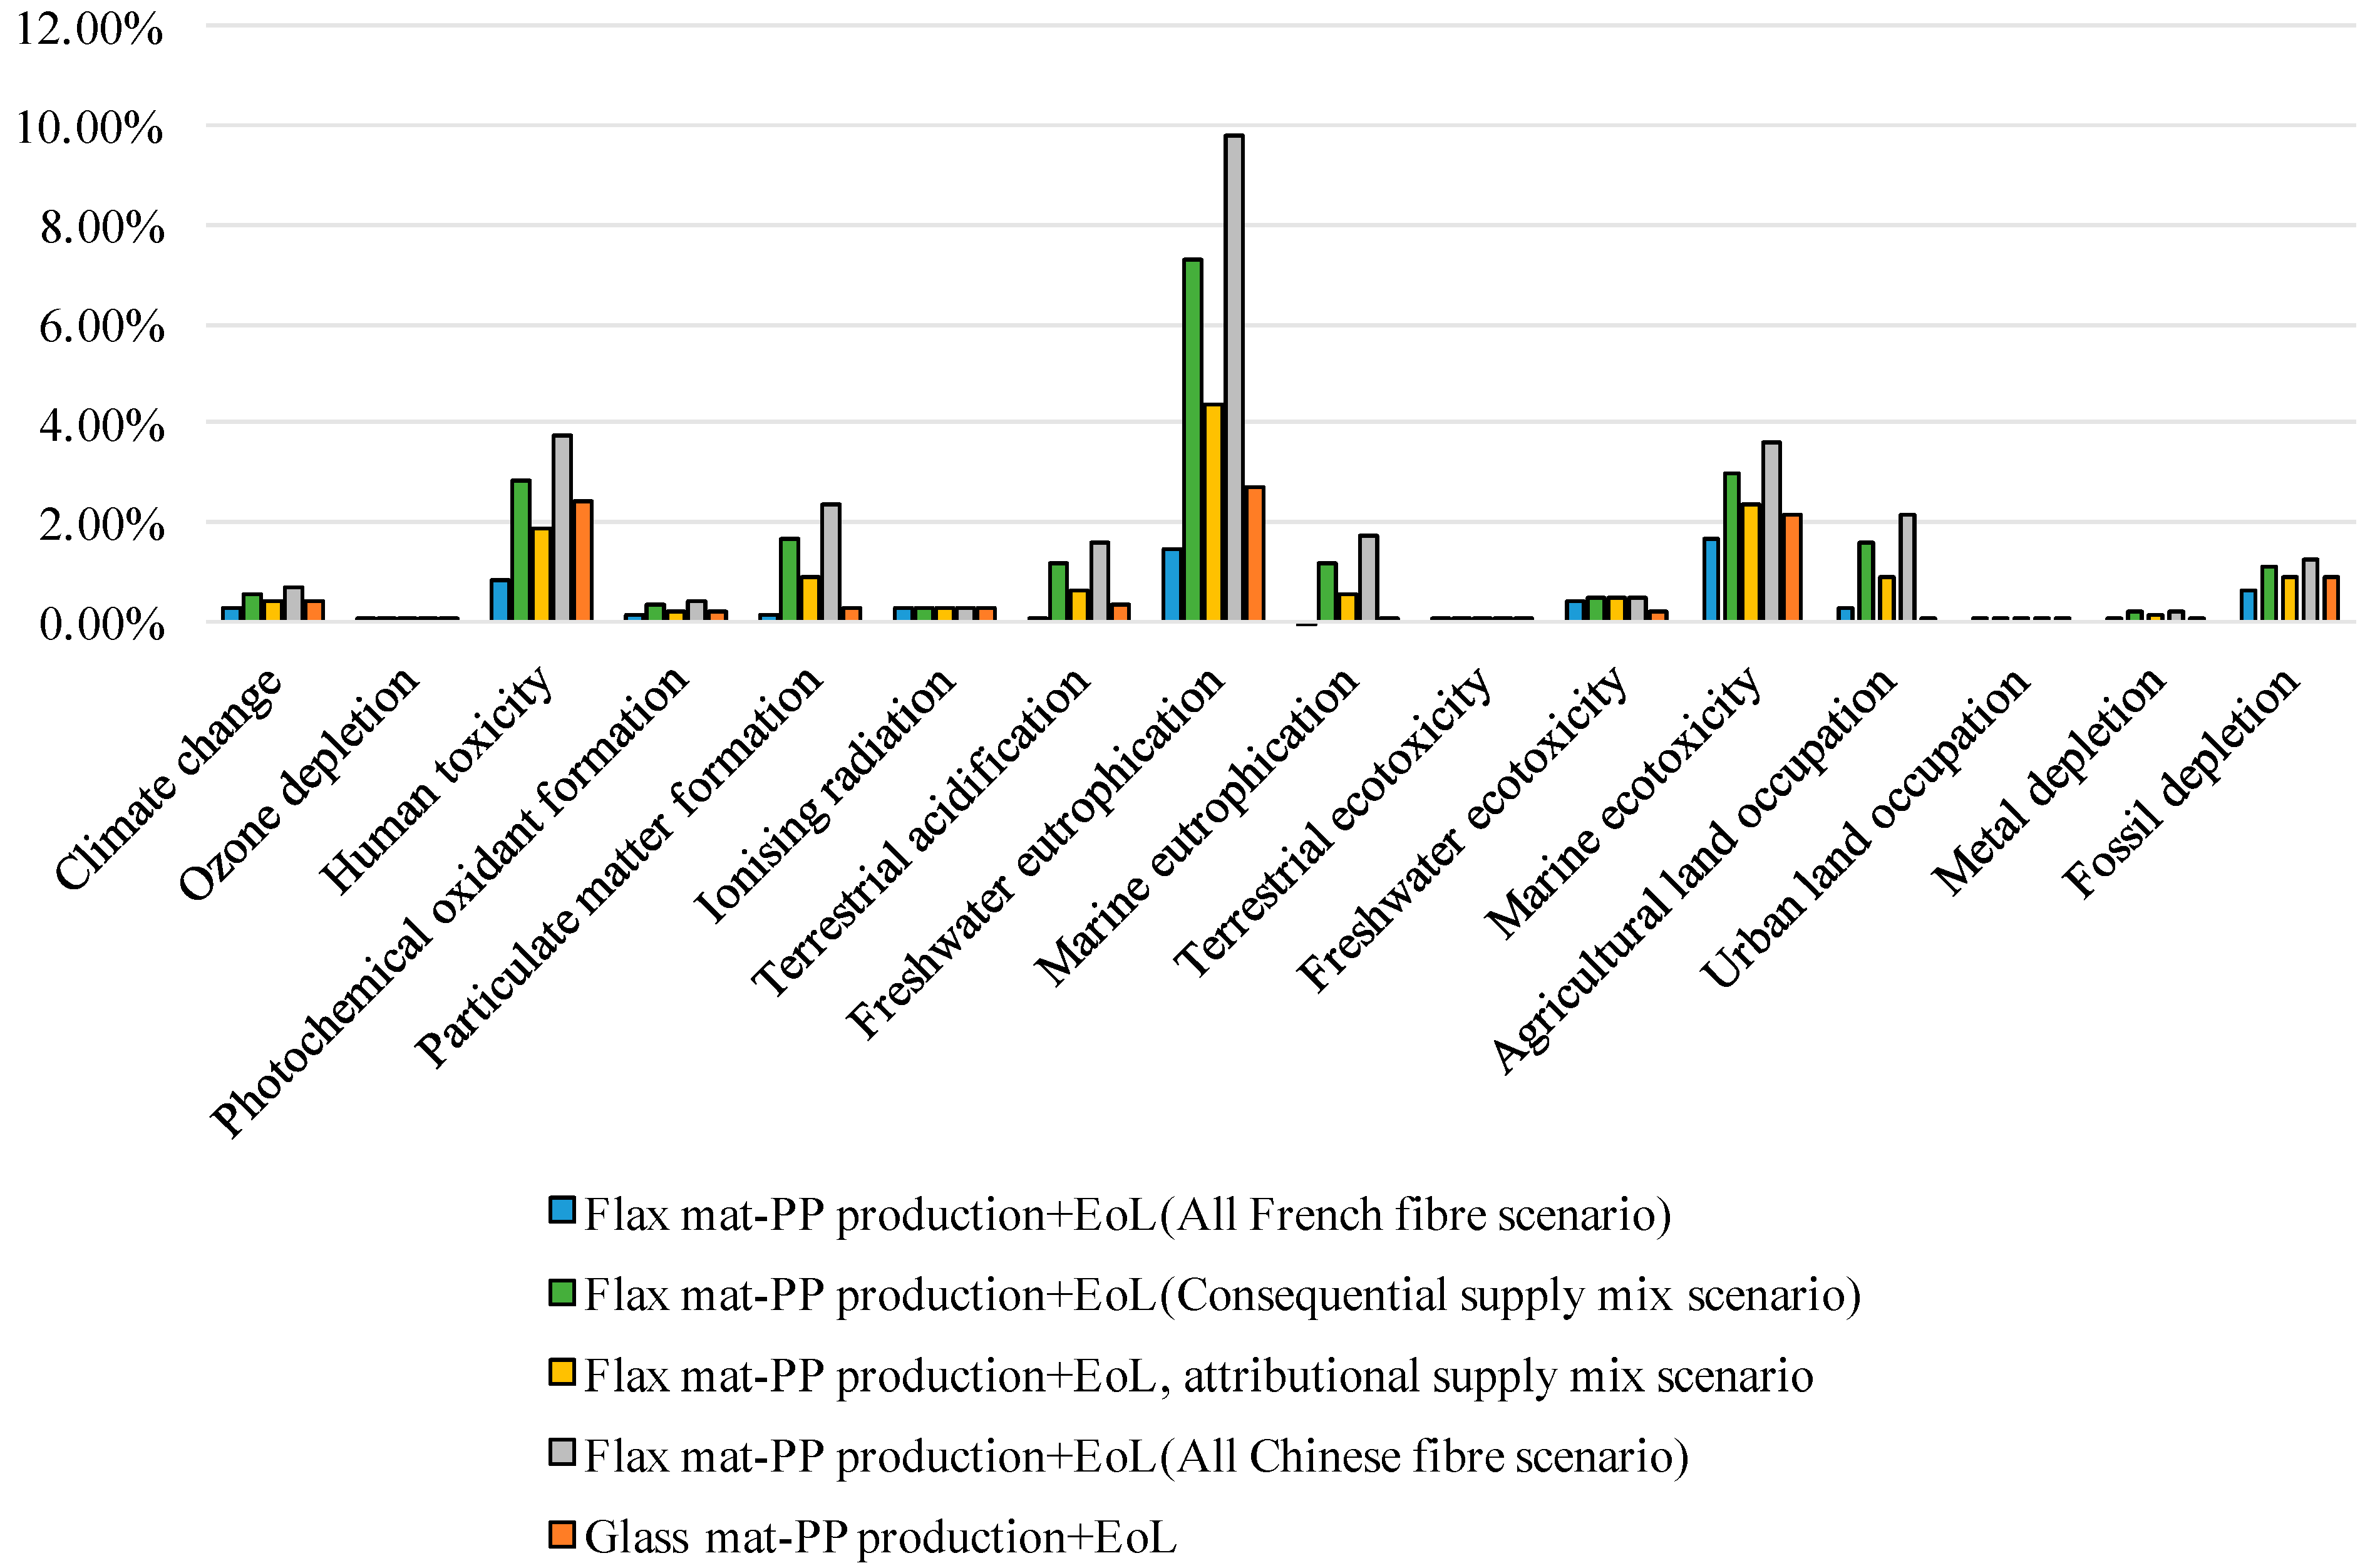
After normalisation, for scenarios incorporated with Chinese fibre source, the freshwater eutrophication impact category is found to be the most significant category followed by human toxicity, particulate matter formation, marine toxicity, and terrestrial acidification. The high level of significance in freshwater eutrophication is believed to be induced by a phosphorus fertiliser application against a very low yield of retted flax straw. The coal-fired electricity leads to burdens in other mentioned impact categories (
Figure 7).
Figure 7.
Normalised environmental impact profiles of flax mat-PP with different marginal flax fibre supply scenarios over production and EoL phases.
Figure 7.
Normalised environmental impact profiles of flax mat-PP with different marginal flax fibre supply scenarios over production and EoL phases.


