1. Introduction
The existing process of globalization is unsustainable in the long run unless we introduce innovative institutions and policies to oversee it [
1]. Antidumping plays an important role in sustaining trade liberalization and to maintain fair trade certification. As such, AD users’ attitudes differ towards trade opening of different products. Such a “safety valve” on consumer goods helped to eliminate the obstacles of trade liberalization and to avoid subsequent potential political crises in face of unfair trade practices.
Fair trade highlights the social-economic sustainability of production, such as, minimum or base prices for manufacturers, such as, to remain sustainable working conditions for waged labors. Fair trade sustains premium social-economic and environmental development under global competition. It requires that the marketing strategy for a multinational firm is sustainable, namely, if it has proven broad base foundations to gain market share and to increase profitability [
2]. In practice, dumping is a common marketing strategy for maximizing profits in foreign markets. Nevertheless, it is not sustainable in the import markets. For the importing countries, foreign dumping firms knock out the small-scale domestic producers with advantageous prices [
3]. As a result, dumping destabilizes the state regulations of the importing country. It increase the incentives for domestic producers to challenge the state regulations of labor and environmental conditions, so that they can better compete with foreign imports with minimized production costs. Such practices are detrimental to domestic social-economic welfare [
3]. For the dumping countries, such a profit maximizing strategy is not sustainable. Importing countries may initiate antidumping investigations against unfair practice. As such, dumping companies are expected to lose a great mass of market share or the entire market.
Nevertheless, not all foreign dumping is bad for the importing countries. Dumped intermediates may be welcomed by the non-import competing sectors, since they help to reduce input costs. Antidumping is often used as an administrative protective measure. Sometimes, foreign firms are charged with high dumping duties even if their domestic price is above fair value. Consequently, importing countries always differentiate dumped imports from foreign countries among different product types. This paper analyzes the different antidumping (AD) attitudes of the Mexican government towards the import of Chinese-made intermediate, capital and consumer goods.
Mexico has made great progress in trade liberalization, considering that the country had what was primarily a closed economy before 1986. Prior to liberalization, high tariffs, extensive import quotas and licenses protected domestic high-cost, inefficient local industries. These trade barriers effectively shielded Mexican domestic manufacturers from foreign competition. However, after joining General Agreement on Tariffs and Trade (GATT) in 1986, import restrictions were greatly reduced. For example, the proportion of domestic output protected by import licenses was reduced from 92% to 47% [
4]. From 1985 to 1992, maximum tariffs decreased from 100% to 20% [
5].
However, the rapid growth of imports under trade liberalization also triggered the implementation of antidumping regulations. Mexico granted all countries “Most Favorable Nation” (MFN) treatment, including China even though China was not a member of the World Trade Organization (WTO) before 2001. However, because domestic industries had been protected for a long time, it was difficult for them to adjust to competition from Chinese cheap manufactured goods. Domestic manufacturers needed relief from the pressure of foreign competition; AD thus became a natural choice for domestic industries because of its incomparable advantages.
The objective of this work is to differentiate the impacts of import surge on antidumping, including intermediates and capital goods (hereafter intermediates), and consumer goods. Mexico’s government shows different attitudes towards trade liberalization for two types of products.
Previous researches mainly focus on multilateral antidumping (AD) causes. That is, AD initiated by the developed countries against other countries; or AD of the developing countries against other countries. There is a gap in the literature about the economic consequences of AD initiated by one developing country against another developing country. This manuscript is meant to fill this gap by studying Mexico’s AD for China only; some researchers find AD hinders trade liberalization. On the contrary, we found empirical evidence that AD for consumer goods helps trade liberalization of capital and intermediate goods in the case of Mexico. Thus, it is an important addition to the literature. The data collecting method of this manuscript is different from the previous research on this topic. Previous research mostly uses the number of AD cases passed (or initiated) in every year (or half year) as the dependent variable. This manuscript is using the number of tariff lines under each AD case. It allows separating of AD between intermediates and consumption products. As such, we can consider the impacts of consumer goods and the impacts of intermediates on AD separately, since the number of observations of each dependent variable is enlarged.
The rest of this paper is organized as follows:
Section 2 presents a literature review for the impacts of trade liberalization on AD.
Section 3 describes the methodology.
Section 4 empirically estimates the different significance of AD towards intermediates and consumer products and presents the results.
Section 5 concludes.
3. Methodology
According to the Global Antidumping Database, among all the petitions brought by Mexico against China, 80% have been investigated. This is a much higher percentage than those directed against other countries (68%) [
14]. Once an investigation is resolved in the affirmative, it is likely to result in high AD duties against Chinese firms. All AD targets can be put into three categories. These are intermediate, capital and consumer goods. Intermediate and capital goods are inputs for eventual production. Consumer goods are the final goods purchased by ordinary consumers.
Table 1 shows two characteristics of Mexico’s AD actions. First, among all the initiated AD investigations against China from 1991 to 2012, consumer goods were the major targets. During the same period, Mexican companies paid little attention to consumer goods from other countries. This may indicate that in the Mexican domestic market, Mexican firms have stronger comparative advantage in the consumer goods sectors against products from most countries in the world except for those from China. Second, Mexico’s AD on Chinese intermediate products is only half of those from other countries. This implies that sourcing cheap intermediate goods made in China may help Mexican manufacturers to decrease production costs, and to better compete in the domestic and world market, considering that China is the second largest import source for Mexico after the United States. The following sections will analyze how Mexico’s AD policies are facilitating such “safety valve” demands from the private sector.
Table 1.
Share of antidumping (AD) investigations by sector (1991–2012).
Table 1.
Share of antidumping (AD) investigations by sector (1991–2012).
| Types of Goods | World Average (excluding China) | China |
|---|
| Intermediate goods | 72 | 33 |
| Capital goods | 7 | 18 |
| Consumer goods | 21 | 49 |
| Total | 100 | 100 |
Two types of dependent variables are used in this analysis. They are the total numbers of antidumping investigations in each year [
15,
16], and the numbers of positive antidumping finding results in every quarter [
17]. The methods used by previous researchers were improved on by using the number of tariff lines under successful AD findings in every quarter as a new dependent variable. Tariff lines are the names of products from the tariff rates. A Harmonized System (HS) code helps to subdivide and identify the details of the product [
18].
The new method has several advantages. First, by using tariff lines under AD, the number of observations is enlarged four times so that the regression result is more reliable than in previous research. If we follow the previous literature, Mexico started AD filing on China in 1991, continuing until 2011; therefore, we have a matrix of 20 sets of time series data if other independent variables are included. Now, if each dependent (tariff lines under AD each year) and independent variable (exchange rates, imbalance of trade, and so on each year) is divided into four quarters (according to the time serious data provided by the OECD and World Bank), there is a matrix of 84 sets of observations available.
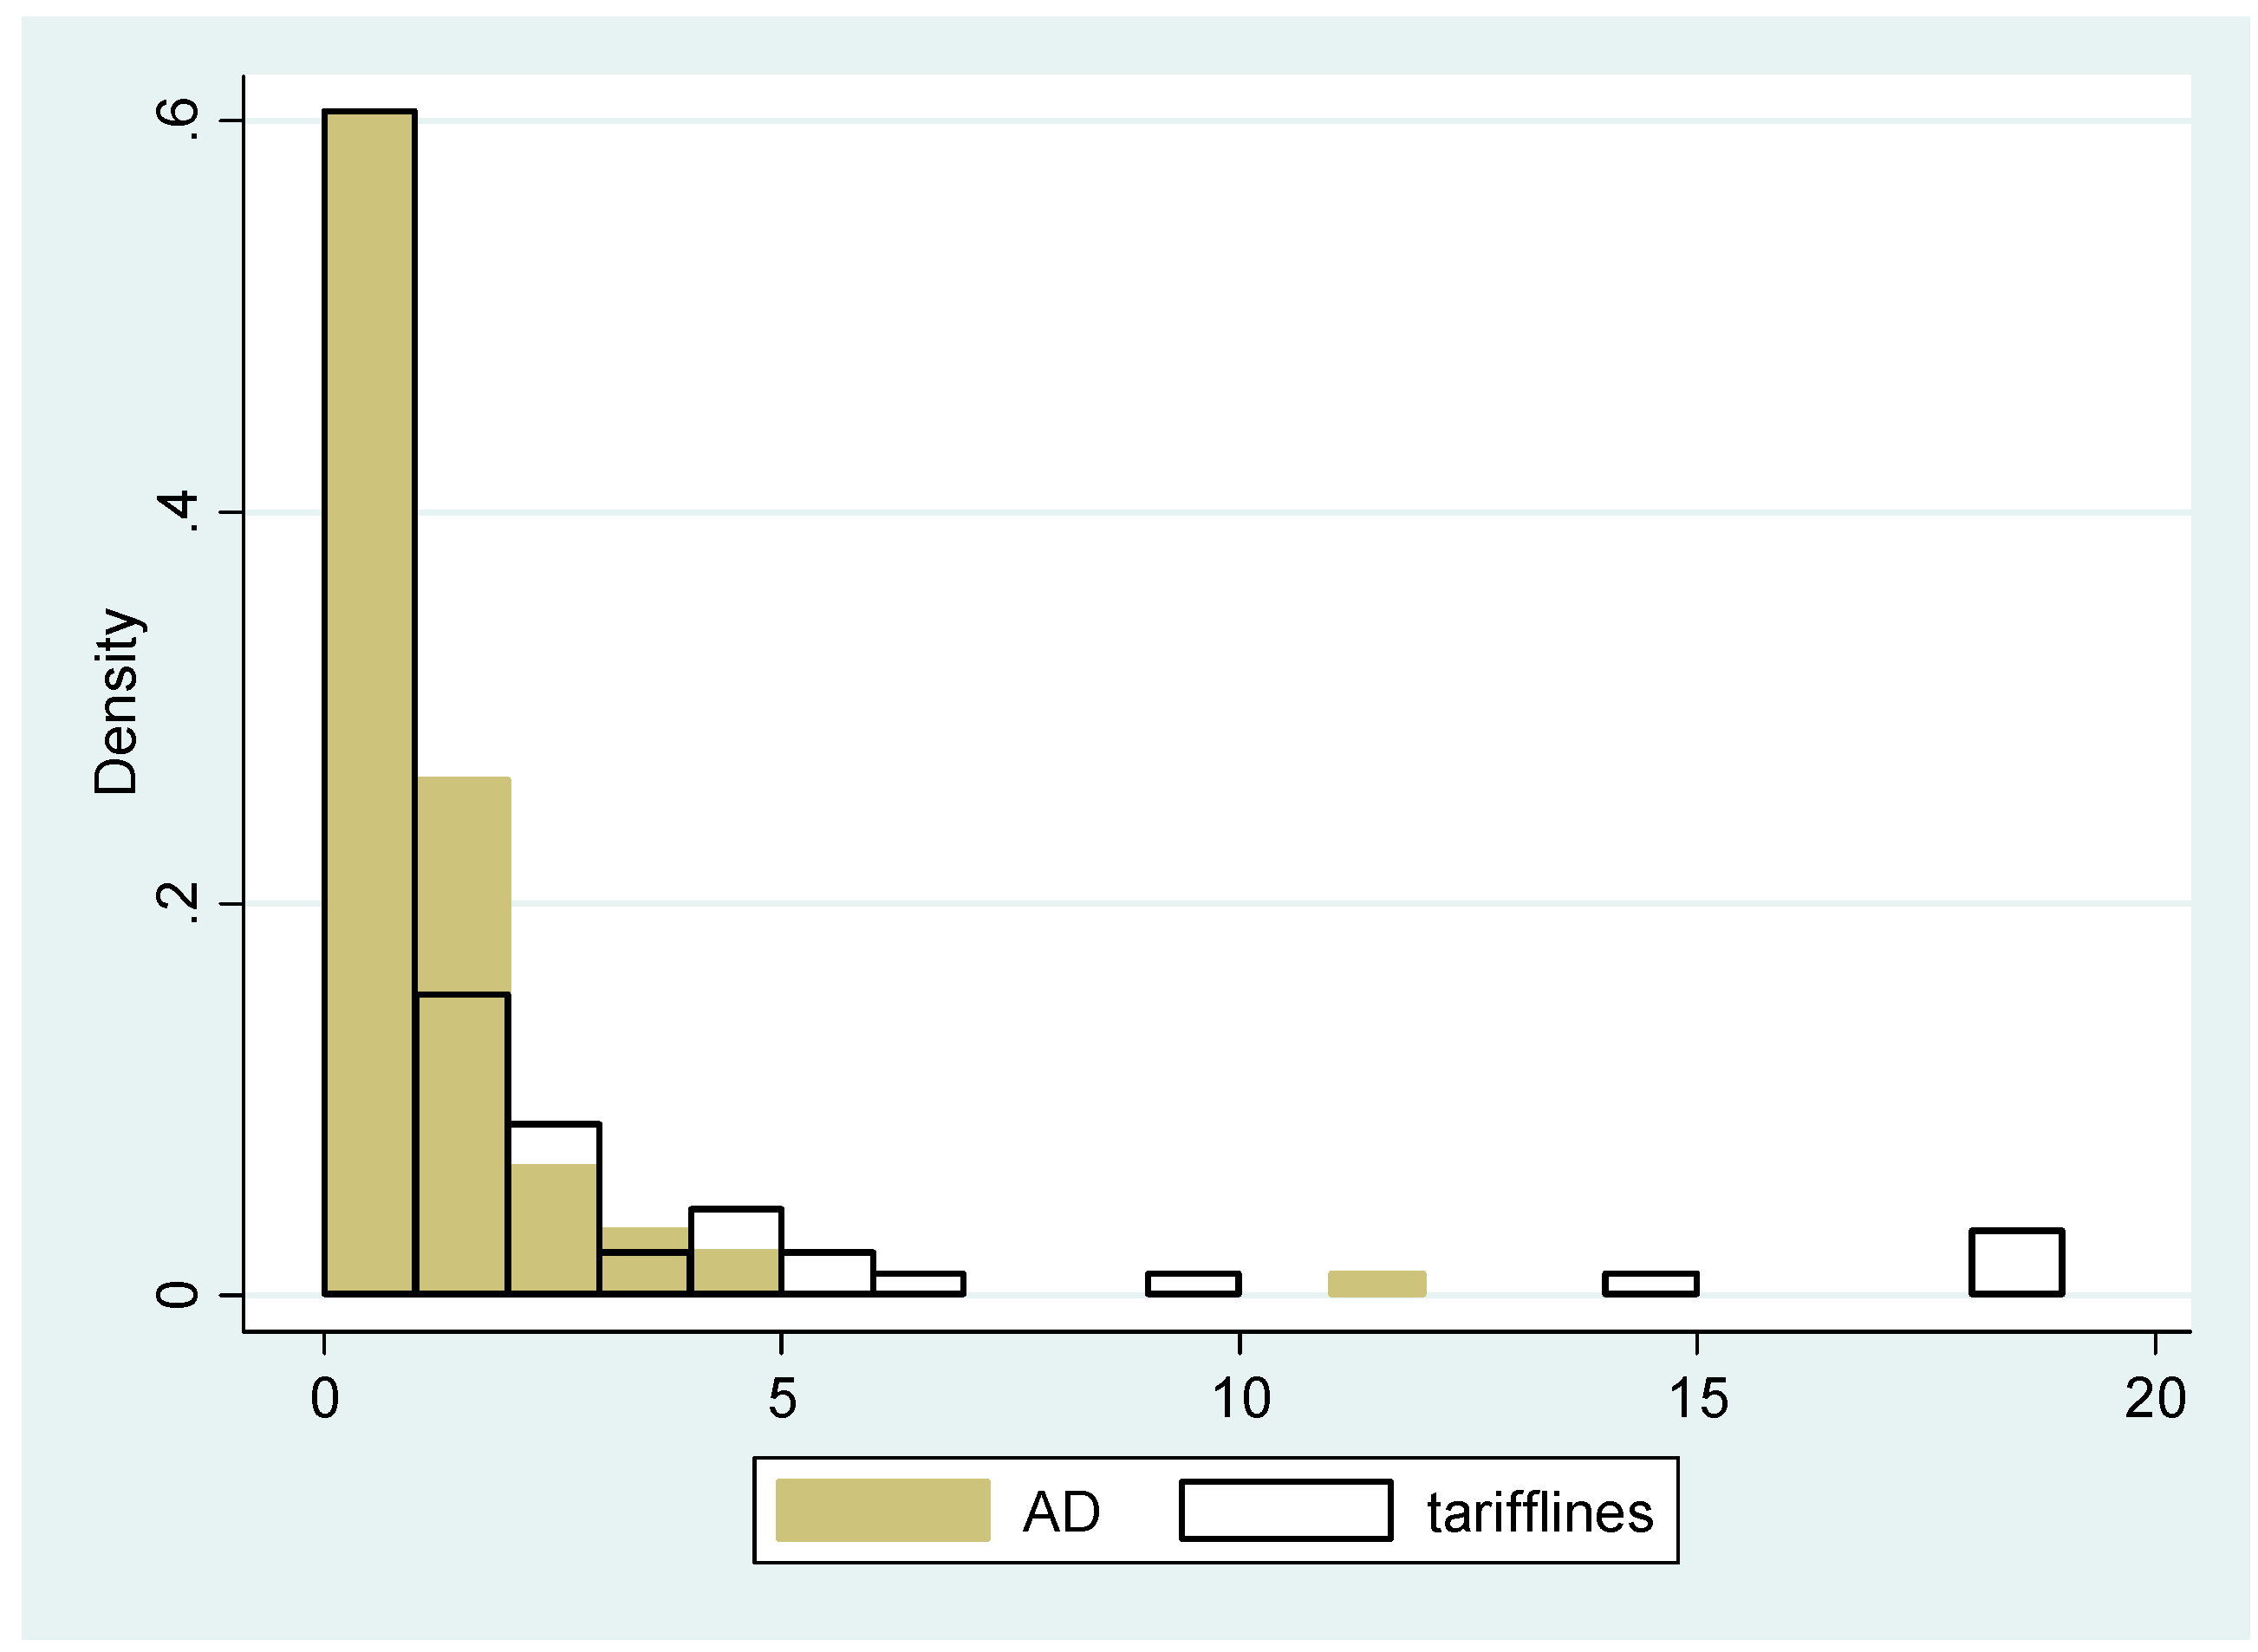
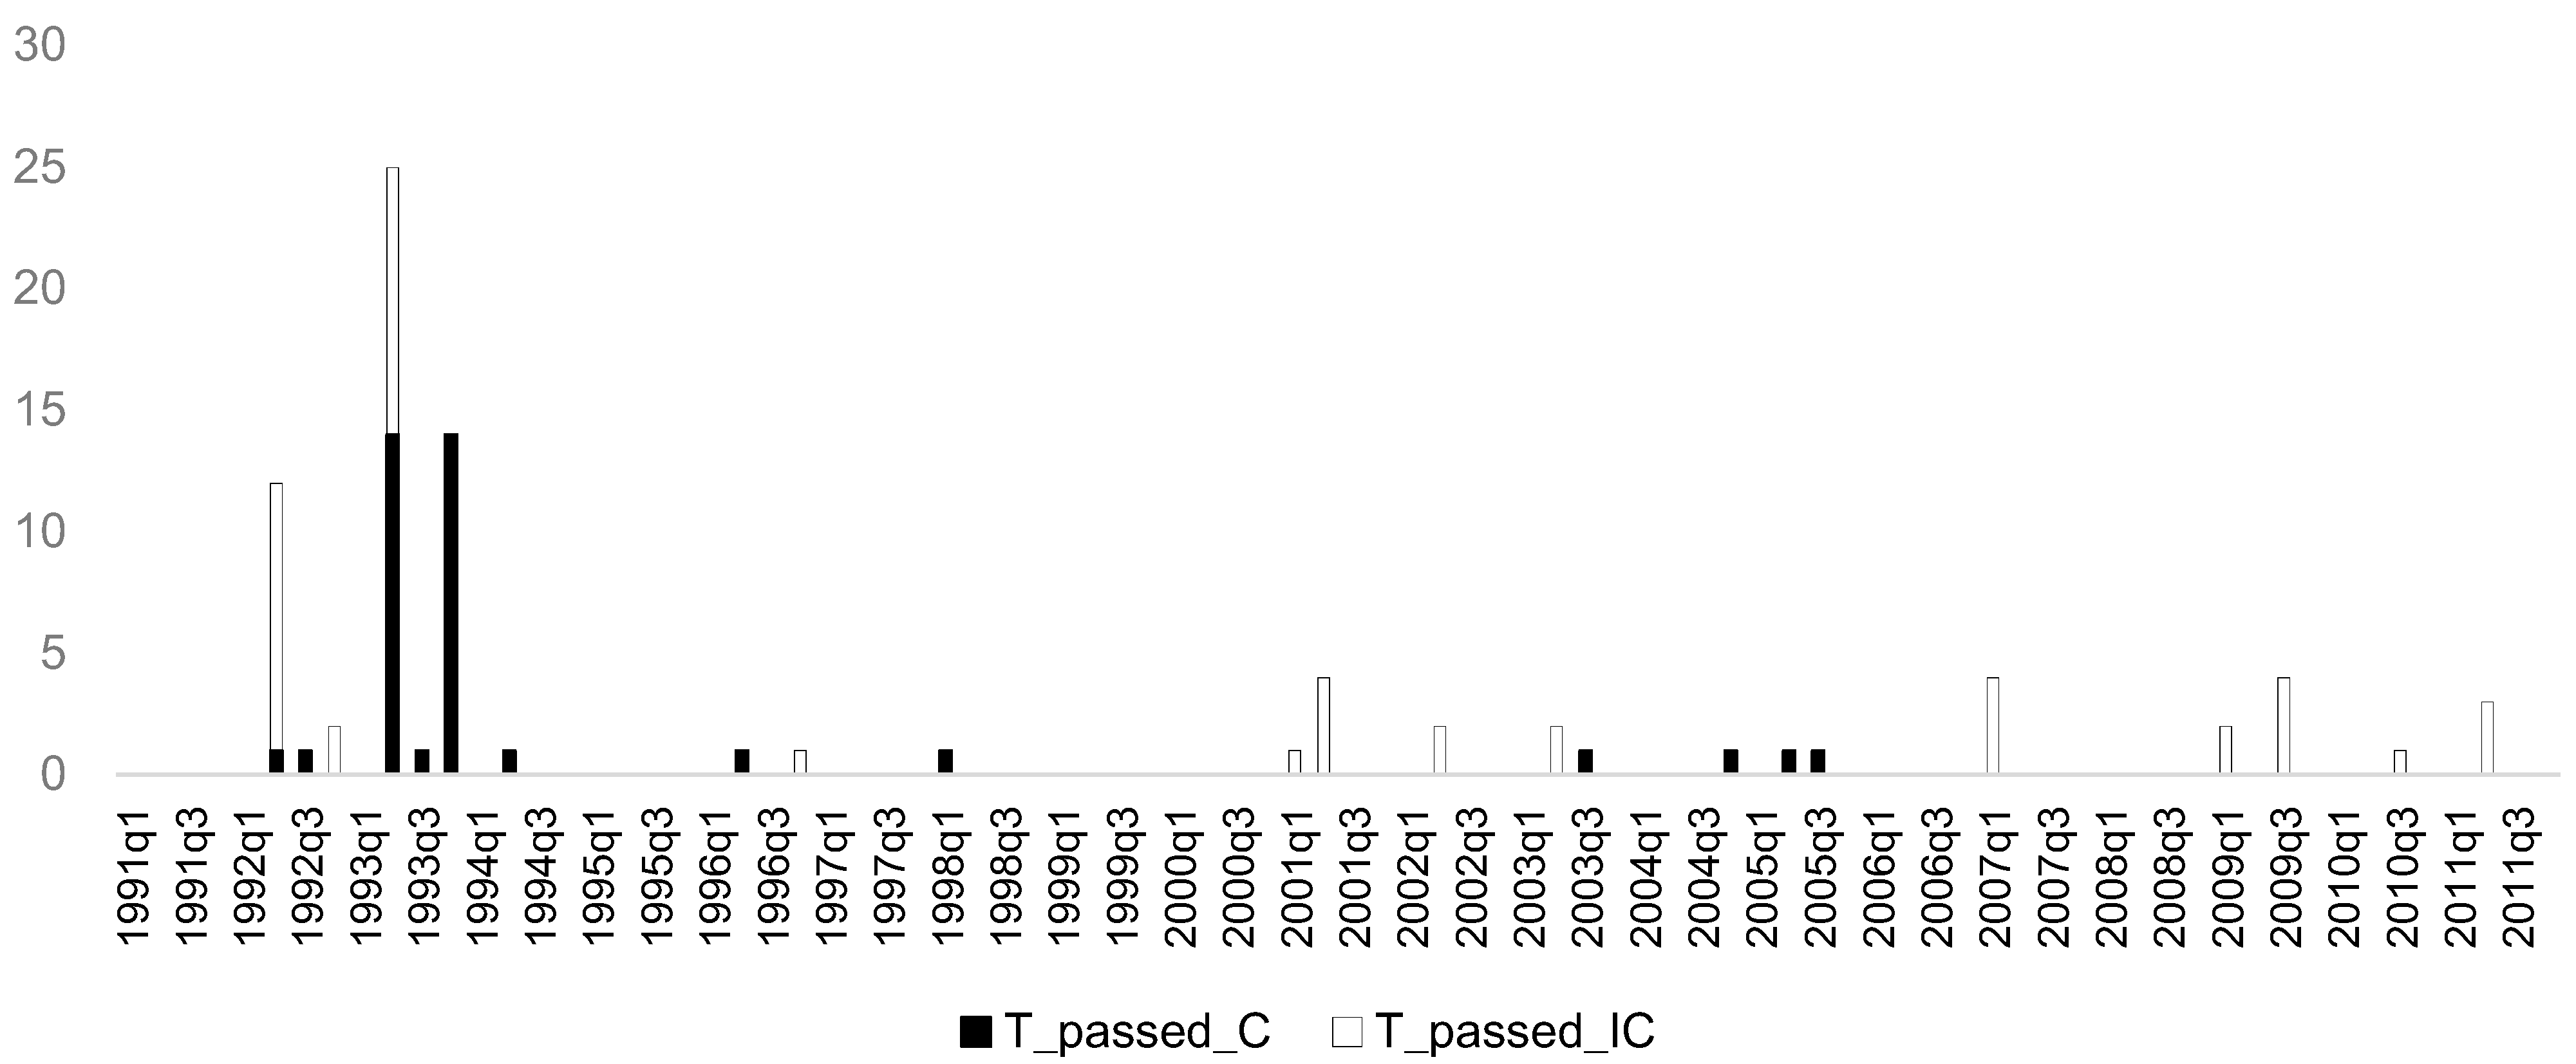
Second, tariff lines better reflect the real coverage of antidumping measures than does AD itself. As shown in
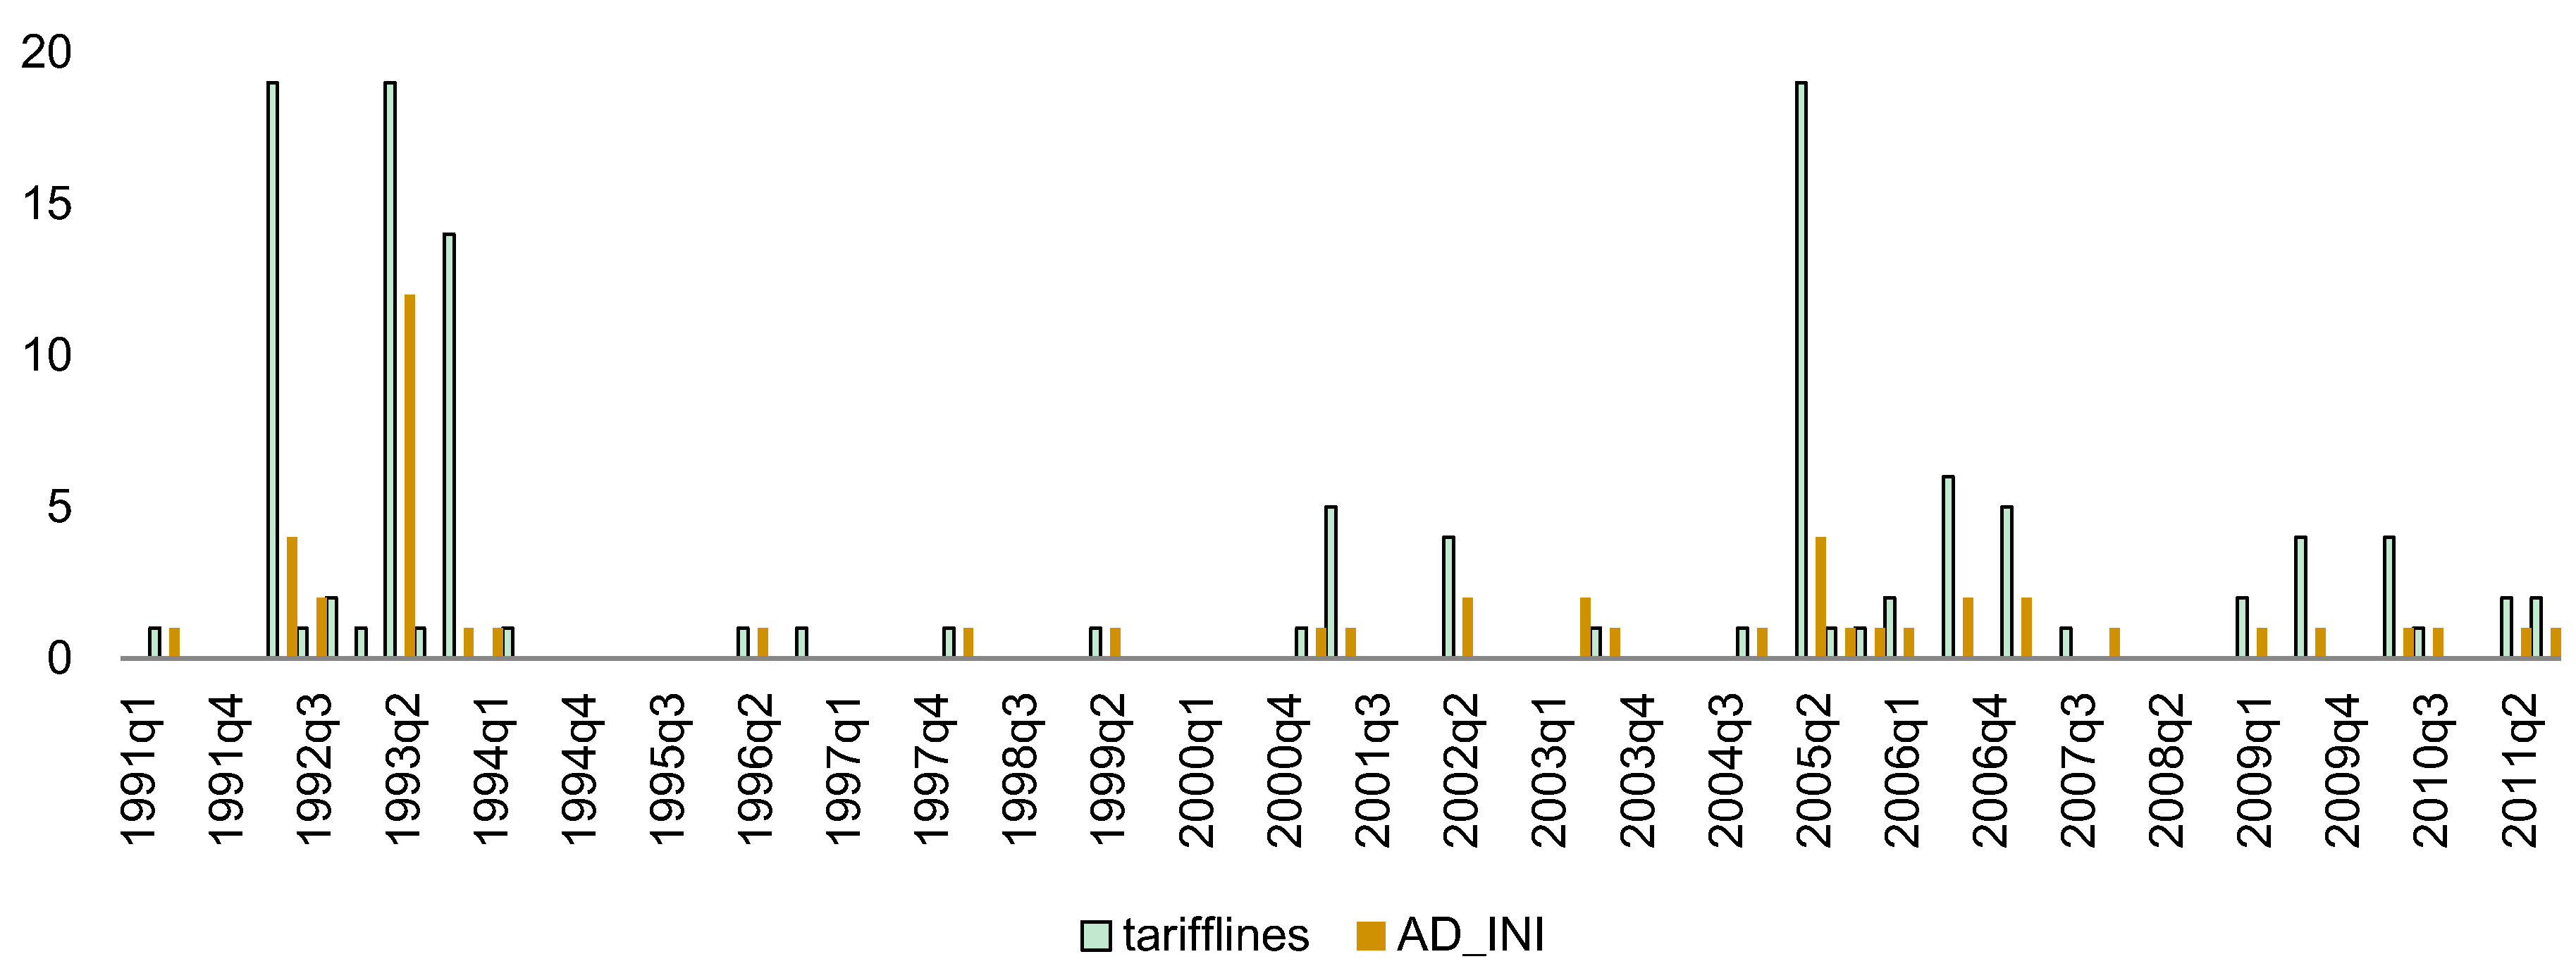
Figure 1, the frequency distribution of tariff lines is much better than that of AD, and this implies that tariff lines give more information than AD. Moreover, the number of tariff lines under antidumping examination in any one period can be different even though the number of cases does not vary. For example, in the fourth quarter of 1993 and the first quarter of 1994, there was one AD filing each quarter; however, in the former period, 14 tariff lines were covered, while in the latter only one tariff line was affected (
Figure 2).
Figure 1.
Frequency distribution of Mexican AD on China between AD and tariff lines (1991 to 2011) [
14].
Figure 1.
Frequency distribution of Mexican AD on China between AD and tariff lines (1991 to 2011) [
14].
Figure 2.
Tariff lines and AD initiation by quarter [
14].
Figure 2.
Tariff lines and AD initiation by quarter [
14].
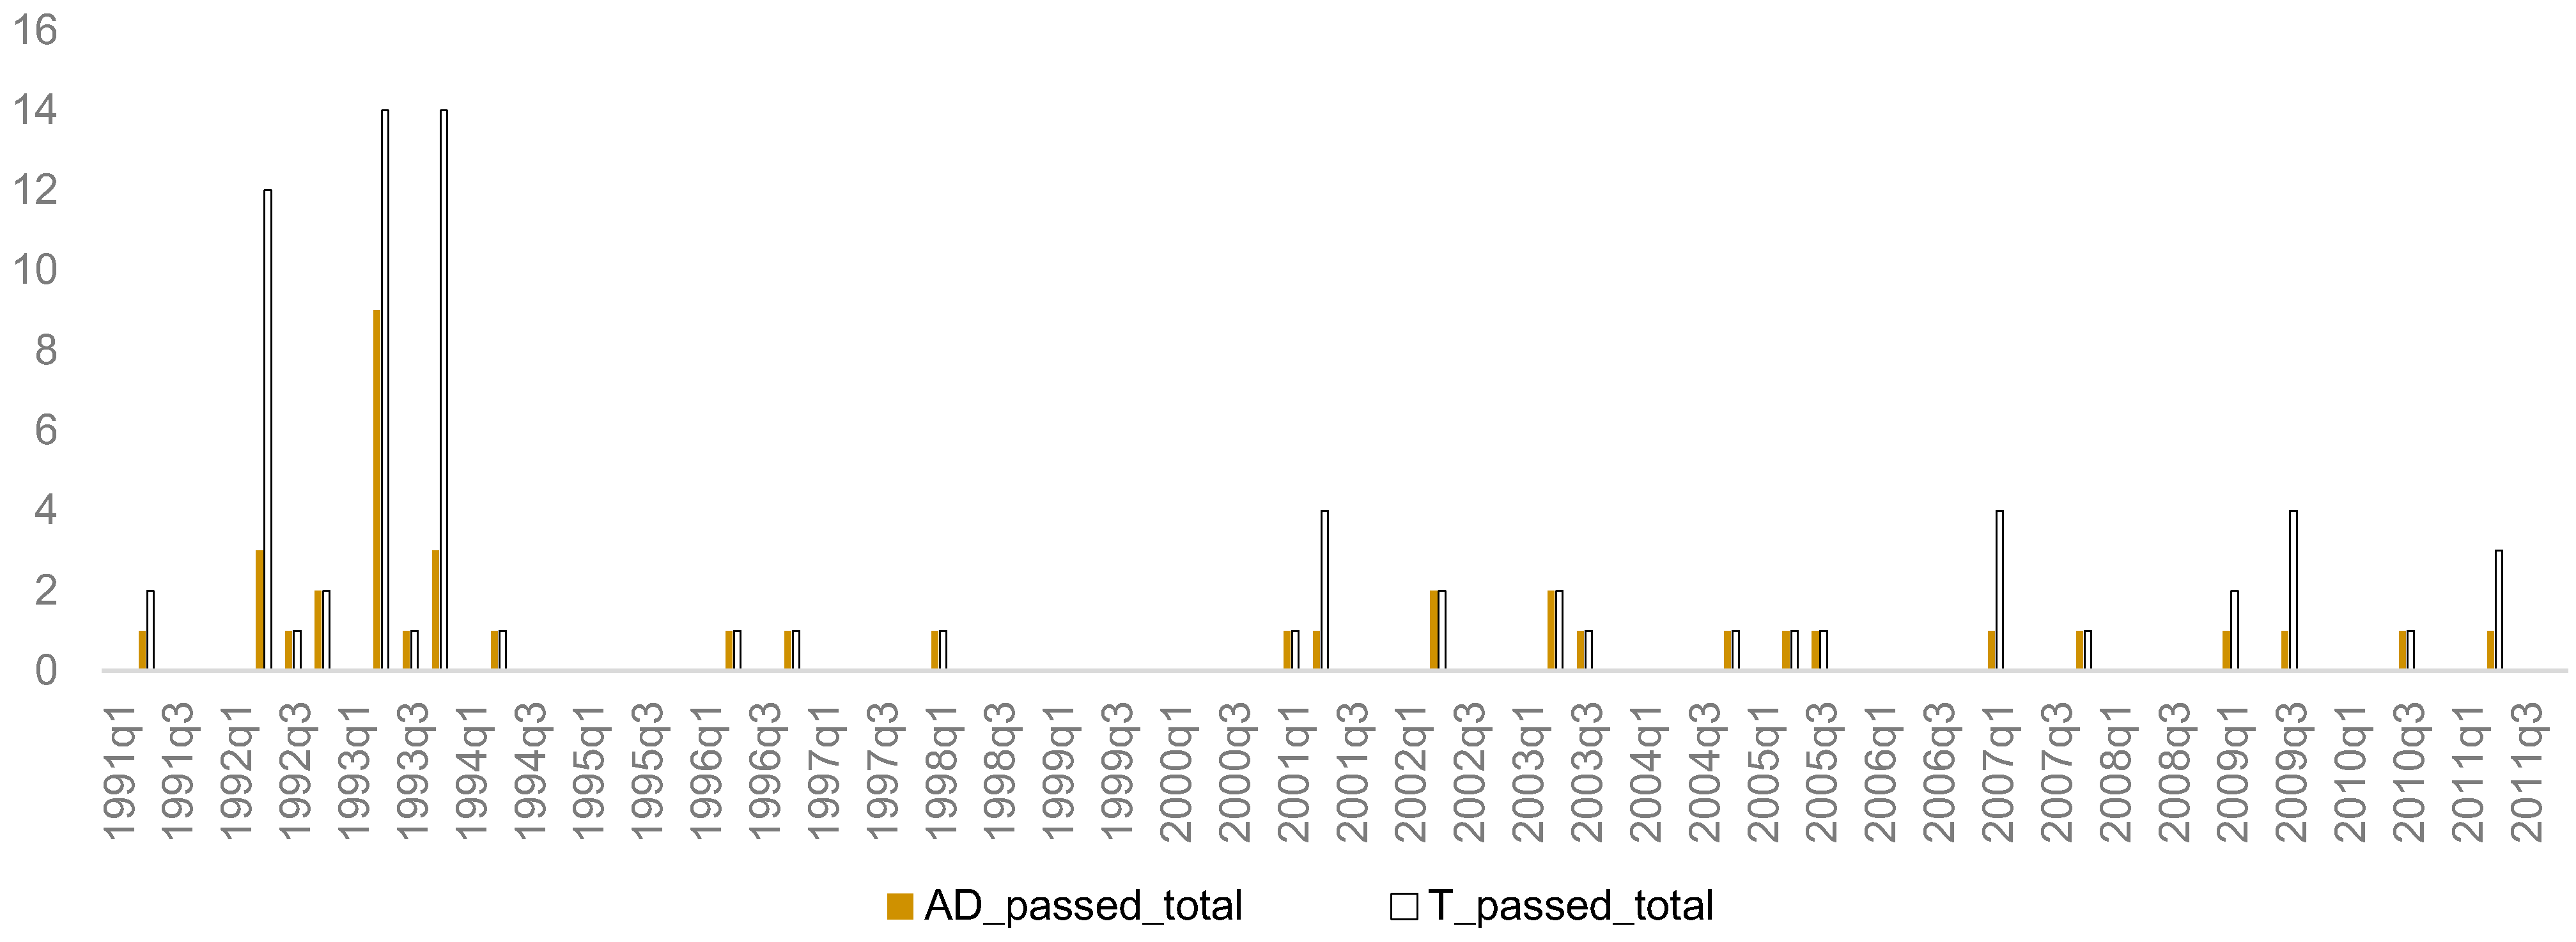
Third, an important advantage of the use of tariff lines is that they enlarge the impact of antidumping within different product sectors. Such an arrangement makes sense of econometric modeling by regressing different sectors separately. It helps to identify the economic causes of affirmative AD findings in different product sectors. If the number of AD cases is the dependent variable, most observations will be identical, in the range of one or zero (
Figure 3). In this paper, both tariff lines and AD are tested as competing dependent variables in the regression model. Each dependent variable has the same length of observation time, a quarter.
Figure 3.
Successful AD and tariff line cases 1991 to 2012 [
14].
Figure 3.
Successful AD and tariff line cases 1991 to 2012 [
14].
The availability of data explains why other scholars have paid so much attention to the number of AD cases instead of to tariff lines. First, the WTO offers only incomplete annual data for AD. It is only in recent years that a comprehensive global antidumping database has been made available to the public by the World Bank. Second, the special character of Mexico’s AD on China is attributed to the use of tariff lines instead of AD in this research. It is also less necessary to separate AD investigations by quarter as in previous research.
A significant difference between this and earlier research is the focus on Mexico’s antidumping cases against China. China is the country experiencing the most intensive AD investigations among all of Mexico’s trade partners. For example, in the second quarter of 1993, 13 AD cases were being investigated; eight AD cases on consumer goods were filed automatically by the government. This is the only time that the Mexican government was the sole petitioner as well as the investigation initiator in Mexican history. By separating AD into tariff lines, the present study will also uncover how abnormal AD cases against China have been.
In this study, there was a need to deal with potential outliers before building an econometric model. Among the total of 56 AD filings against China by Mexico from 1991 to 2011, 40 cases or 1138 tariff lines ended as affirmative AD findings. Notice that the passed tariff lines were 1082 in the second quarter of 1993, which is much higher than the sum of the other periods. Among these 1082 tariff lines, 1062 items were initiated officially by the antidumping authority of Mexico, the International Trade Practices Unit (UPCI). These were associated with the overvaluation of the Peso and the acceleration of domestic consumption of imported goods, as the appreciation of the Peso had increased the competitiveness of foreign made products. If this observation is eliminated, it is possible to ignore economic impacts such as overvaluation of the currency or problems in the balance of payments. To deal with this problem simply, this study used the second largest tariff lines (18) in 1993 to replace the 1082, based on normal practice. This change was made for the purpose of respecting the nature of the data [
19]. Similarly, when separating tariff lines into intermediate and capital, and consumer products, there were 975 and 118 tariff lines, respectively. These were replaced by 11 and 14, respectively (
Table 2).
Table 2.
Adjustment of dependent variables.
Table 2.
Adjustment of dependent variables.
| | Total | Intermediate and capital goods | Consumer goods |
|---|
| Tarifflines in 1993, quarter 2 | 1082 | 975 | 118 |
| Replacement tarifflines | 25 | 14 | 11 |
The tariff lines of intermediate and capital goods are combined into a single dependent variable for two reasons. First, there have been only four tariff lines of capital products in Mexico’s successful AD investigations. These were in 1993 q2, 2006 q3, 2007 q1, and 2009 q3. It would be inappropriate to use only these four observations to create a regression model. Second, intermediate goods and capital goods have similar natures. Antidumping concerns on final consumer goods can be targeted more easily than those relating to capital and intermediate goods during an economic downturn [
13,
19]. That is because any AD imposed duty on intermediate and capital goods will increase the cost of production. Thus, they are always opposed by domestic non-competing producers. The distribution of the tariff lines in these two sector groups is shown in
Figure 4.
Figure 4.
Distribution of tariff lines.
Figure 4.
Distribution of tariff lines.
If we do not take account of the AD surge in 1993 q3, the average tariff rate has been decreasing for intermediate and consumer goods, while the number of AD cases for consumer goods and intermediates has the opposite trajectory (see
Figure 1 and
Figure 2). This evidence confirms our finding and the key argument. That is, as an administrative protective policy, antidumping replaces the function of tariff protection. It helps to mitigate domestic pressure for trade liberalization. When we updated the dataset, there is not significant change in the regression results.
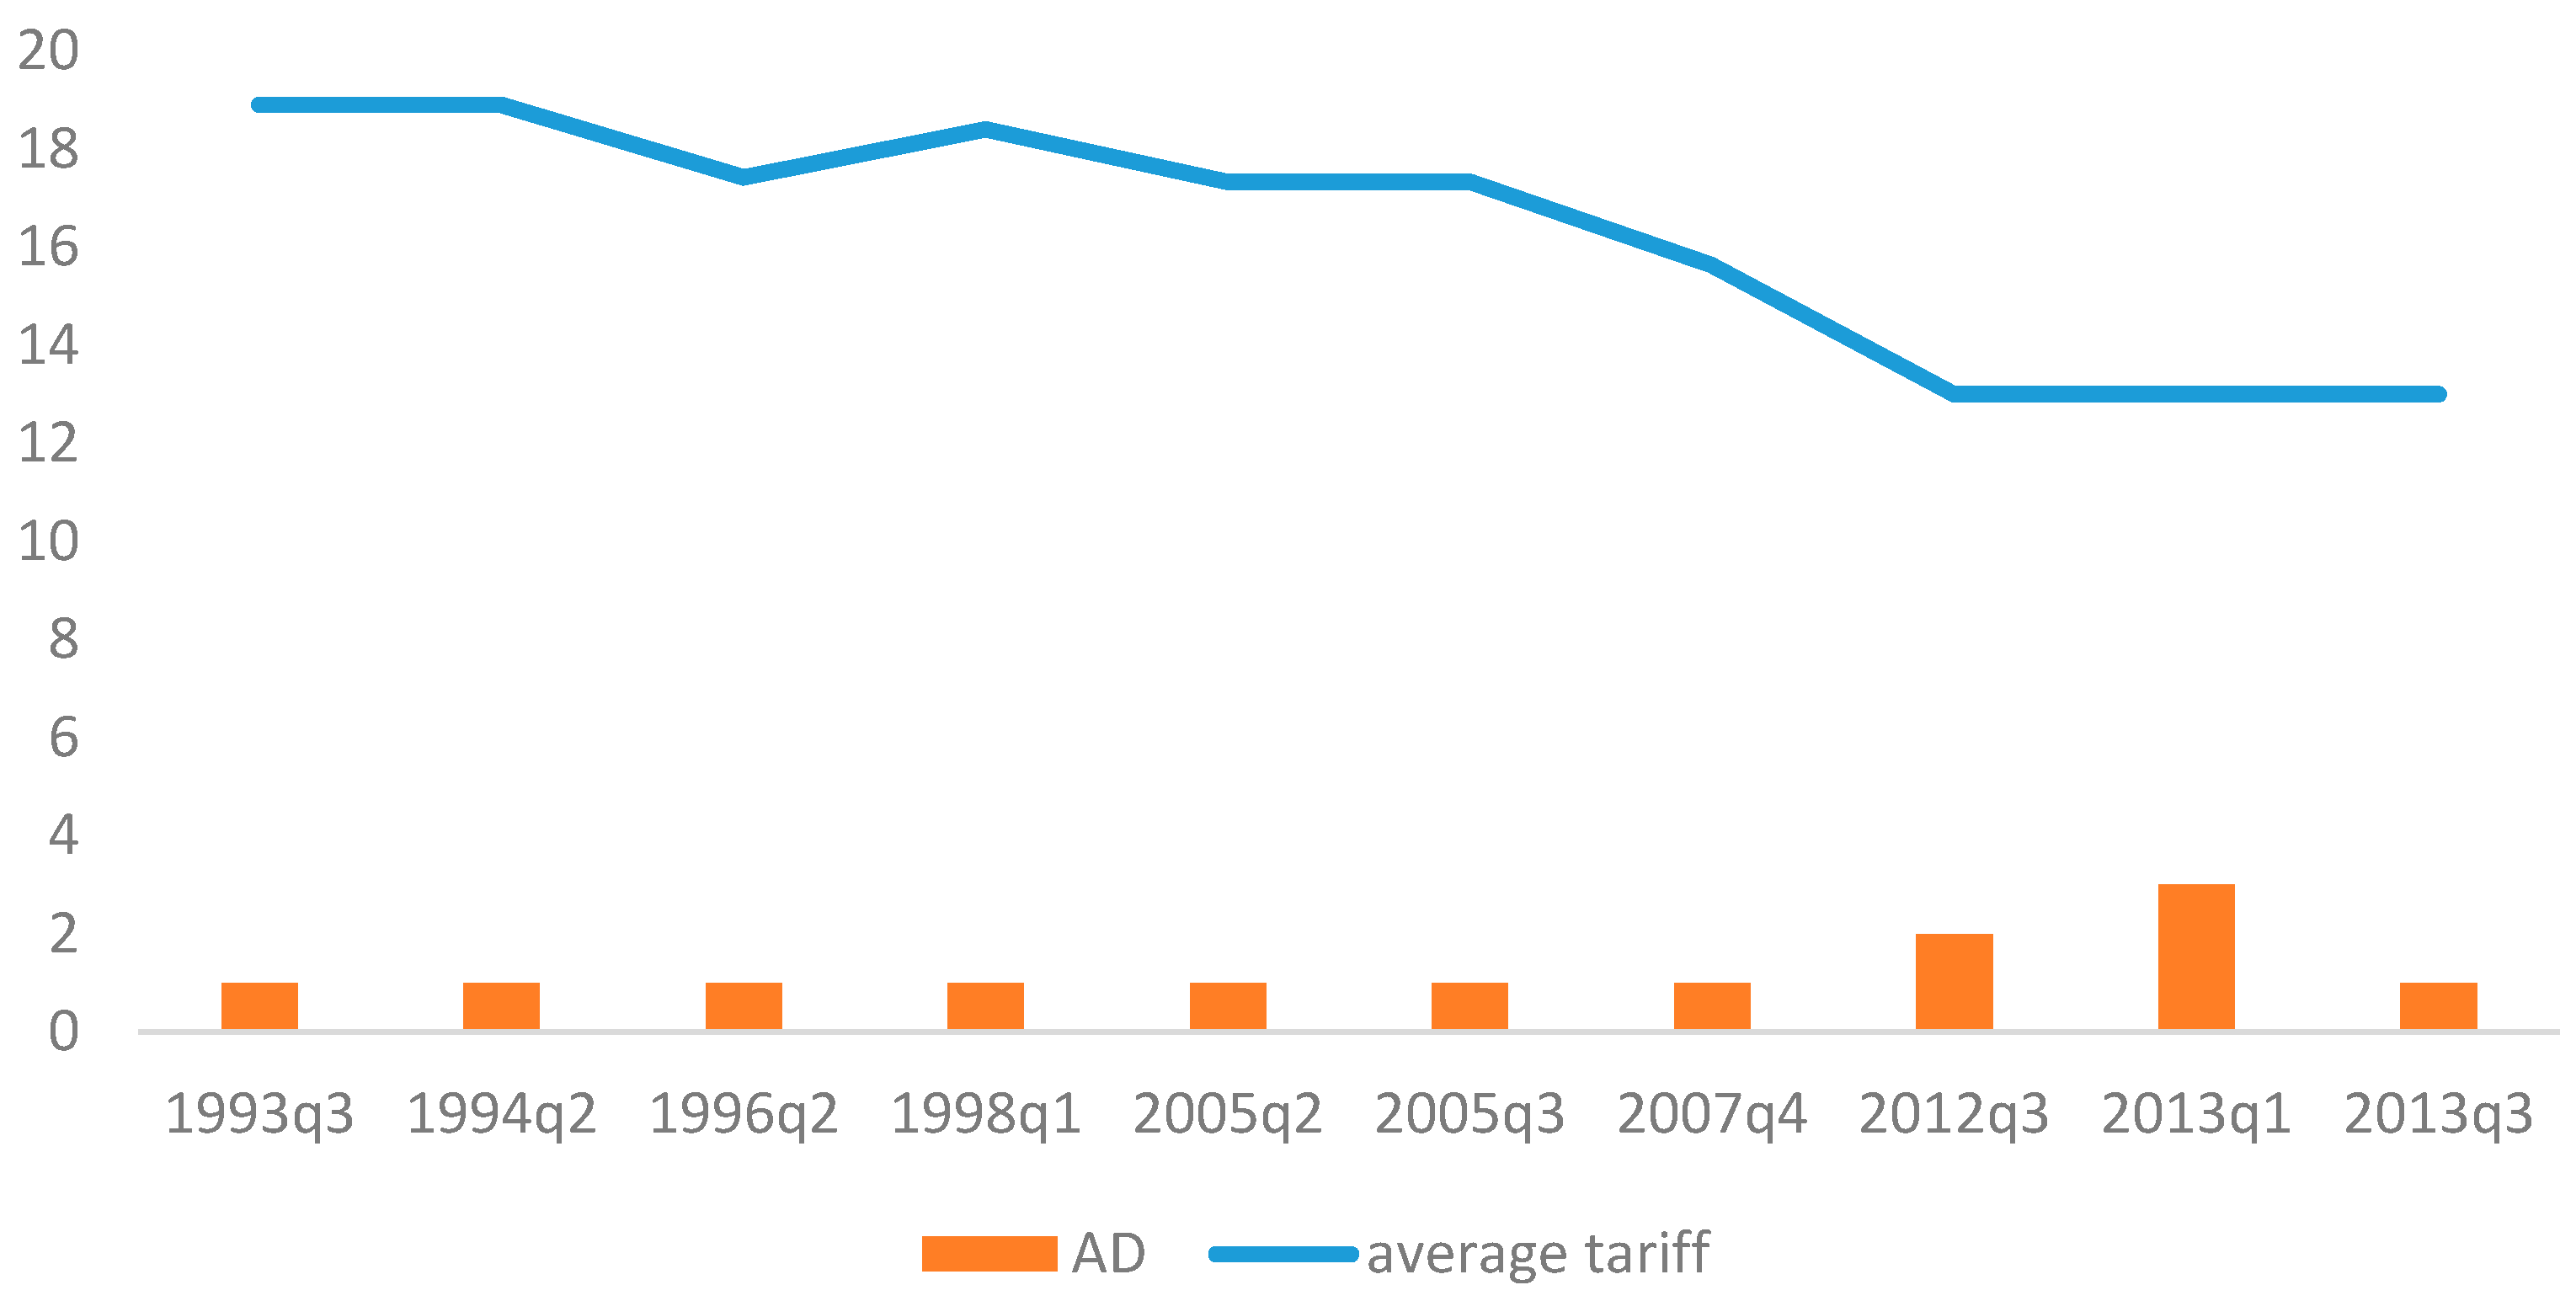
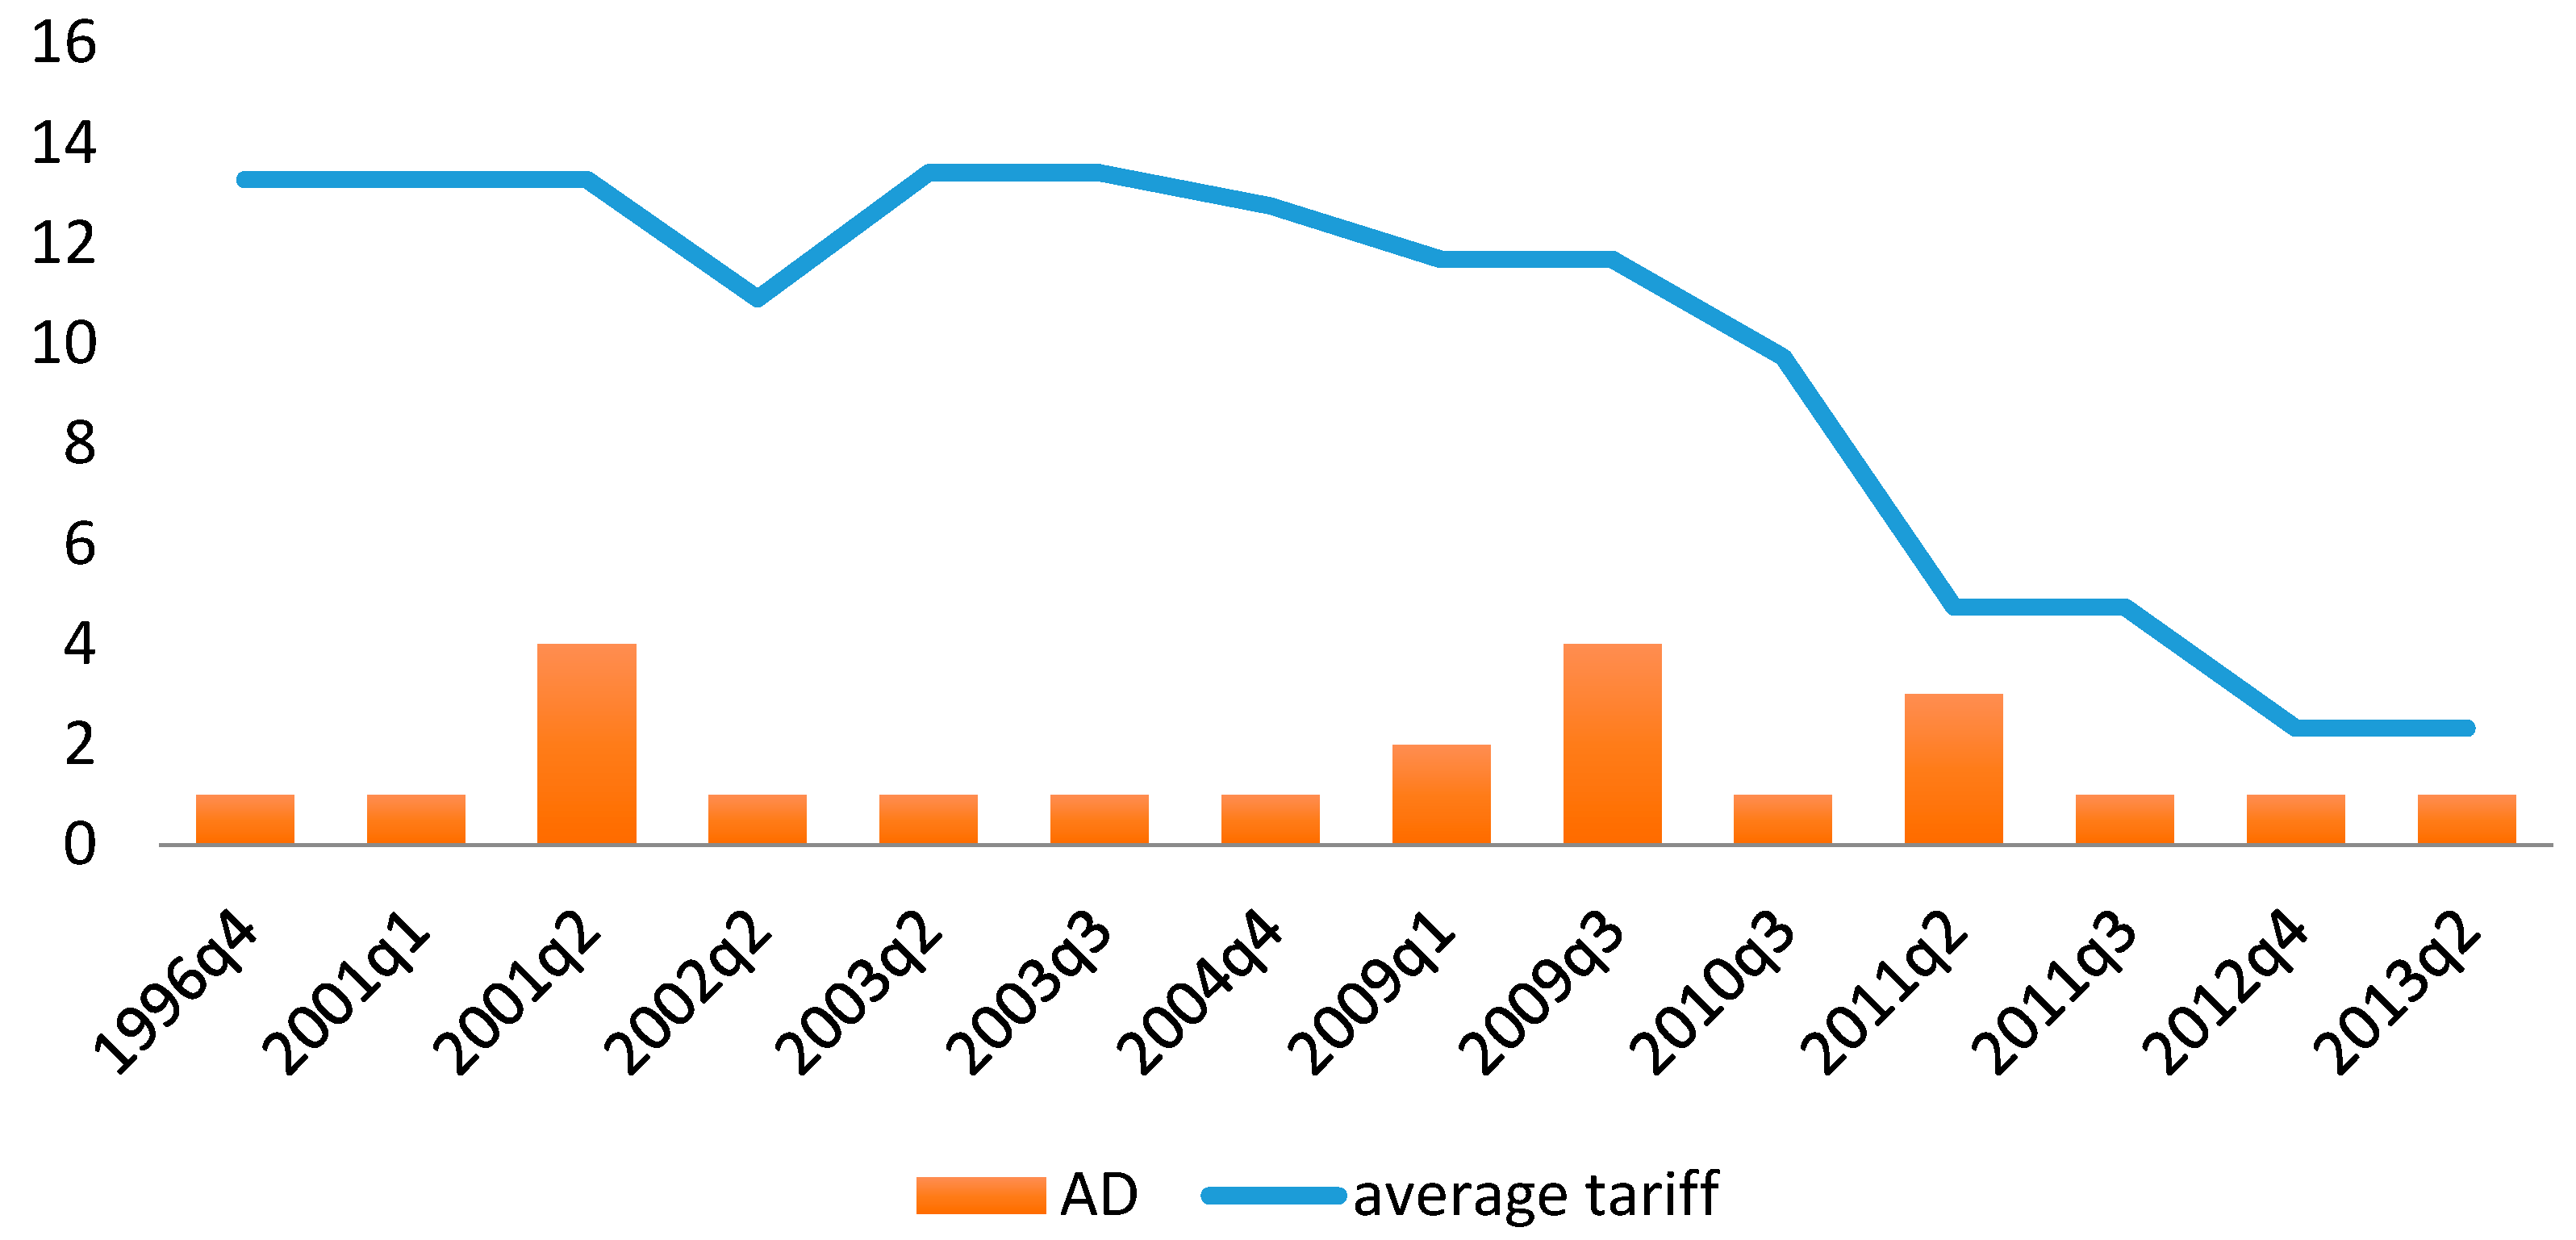
Figure 5 and
Figure 6 show a similar trajectory. Mexico is reducing tariffs in both intermediates and consumer goods. However, the rate of tariff reduction on consumer goods is slower than that of intermediates. That is to say, the Mexican government is more reluctant to liberalize the domestic consumer goods market. As average tariff rate decreasing on intermediate and consumer goods, the number of AD cases on consumer goods and intermediates has opposite trajectory.
Figure 5.
Trajetory of AD cases on consumer goods.
Figure 5.
Trajetory of AD cases on consumer goods.
Figure 6.
Trajectory of AD cases on intermediates.
Figure 6.
Trajectory of AD cases on intermediates.
Another evidence shows AD use is biased towards intermediate and consumer goods. The average AD duties on consumer goods almost doubled that of intermediate goods. That is 183.91% for consumer goods and 100% for intermediate. This is consistent with the literature that higher antidumping duties are more likely to be levied on consumer goods. [
12,
20].
These are economically oriented and industrially specific. Among the economic factors, the real exchange rate is the most debated factor influencing AD. A real appreciation in a domestic currency tends to increase antidumping concerns [
7,
15]. Economic cyclical factors also impact on the results of AD investigations. For example, in Organization for Economic Cooperation and Development (OECD) countries, macroeconomic conditions have tended to have close connections with AD; such factors include balance of payment, industrial production output, and so on [
7,
21].
Current account imbalances, import penetration and unemployment may also impact on AD concerns. Mexico’s AD investigations’ boom has been attributed to current account imbalances and the appreciation of the peso during 1992 and 1993 (Francois and Niels 2003). When trade liberalization strengthens the import penetration of foreign products, it further increases antidumping concerns [
22]. The government faces pressure for trade protection from domestic private sectors when the employment rate and the ratio of capacity utilization is low [
23].
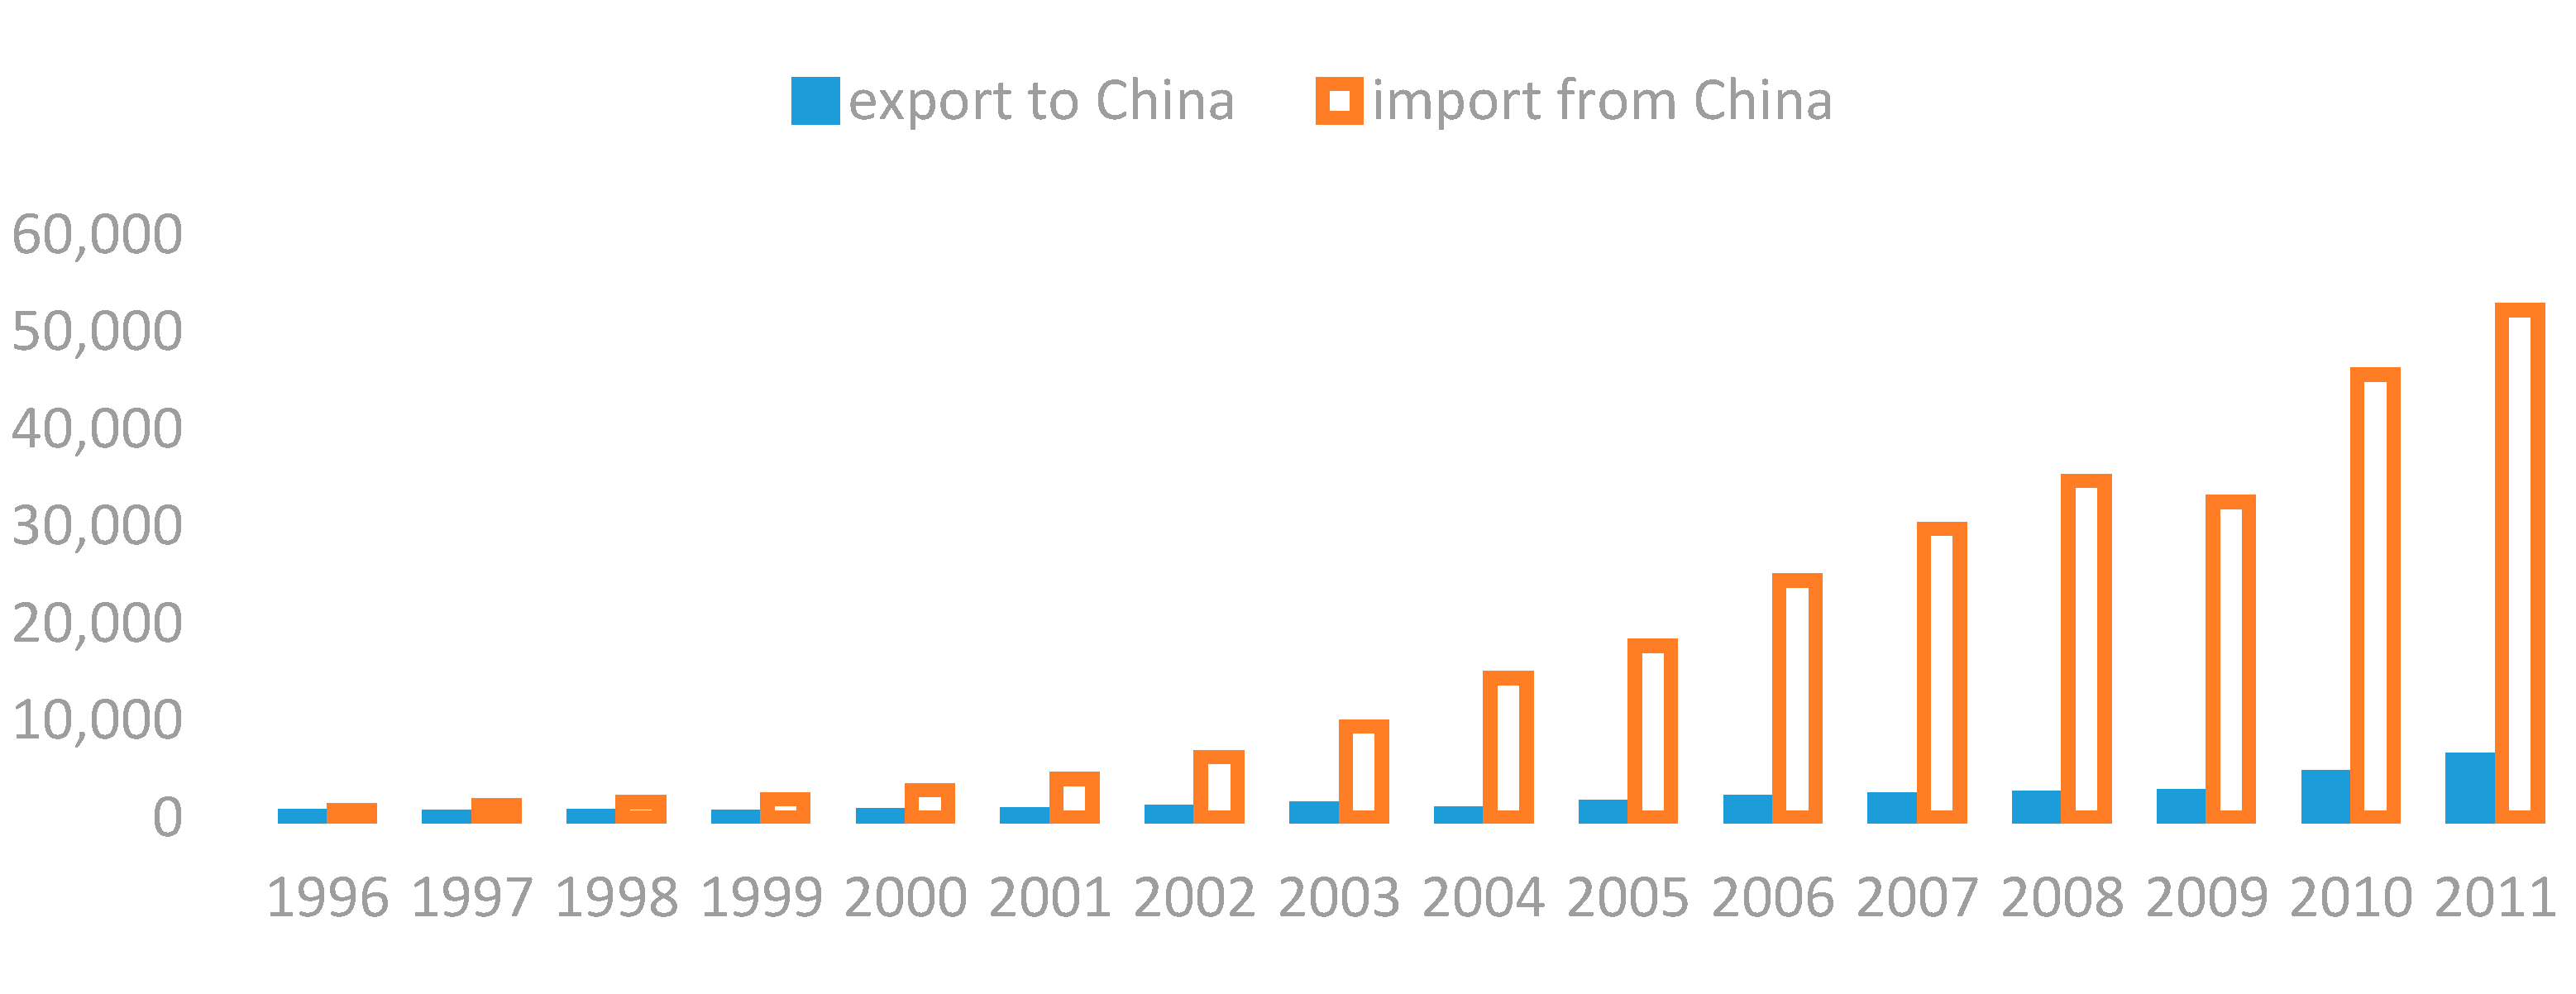
Reciprocity is the fundamental principle of Mexico’s foreign trade policies; as a result, huge trade imbalances encouraged Mexico’s AD actions against China. Mexico is China’s second largest trade partner in Latin America, but the trade relations between Mexico and China are very unbalanced (
Figure 7). For every unit increase in exports to China, Mexico incurs 13 units of imports [
24]. Mexico is one of the few countries that do not directly benefit from trade relations with China in Latin America because of this huge trade deficit [
24,
25]. Thus, Mexico’s AD cases against China are designed to ease the pressure from the country’s worsening balance of payments. AD discourages the import of foreign products. It is assumed that the more the trade balance favors Mexico, the less likely it will file AD against China.
Figure 7.
Mexico’s trade deficit with China ($ million) [
26].
Figure 7.
Mexico’s trade deficit with China ($ million) [
26].
AD petitions are likely to have a positive correlation with the extent of import penetration [
22]. In the United States, an industry is more likely to succeed with an AD petition when its competitiveness is low [
27]. Assuming an import increase would increase successful antidumping cases against China, the reverse should also hold true. In reality, however, the trade volume of each tariff line (HS 8 digits) cannot be attained. As a result, the total import penetration (IP) volume of each quarter is used:
An appreciation in the exchange rate increases the purchasing power of the Peso, and therefore lowers the comparative price of foreign products. The Peso exchange rate appreciated continually from 1988 to 1993, and the subsequent rise in private consumption of foreign made products made possible by this appreciation accelerated imports. However, the resulting balance of payment imbalances consumed foreign currency reserves. Mexico’s current account deficit is around 5.8% of GDP, but increased to 7% in 1994 [
28]. Conversely, AD duties increase the cost of foreign-made products, thus discouraging foreign currency outflows from the current account. It is assumed Mexico is likely to increase its AD activity when the Peso appreciates, and to decrease AD when the Peso depreciates.
By tacit agreement, AD agencies of all countries survey evidence of less than fair value (LFV) for a period of over a year [
7]. Therefore, previous researchers generally used year-lagged values of economic and trade independent variables, such as the exchange rate, GDP growth, and so on [
4,
29]. As the CNY is not an international currency, its value is measured by how many Yuan can buy one US Dollar. This exchange rate is indicated by CNYtUSD. If the CNY appreciates, the value of CNYtUSD will increase. This method uses the real exchange rate of the CNY against the USD as one dependent variable.
One of the principal economic obligations of a government is to develop the economy and to stimulate employment. A government is under considerable political pressure when GDP growth rate is low, thus it is likely to increase protective measures. This study uses a one year-lagged value of GDP growth rate as the independent variable, because the AD authority will decide its findings according to evidence of damage from the previous year [
1,
29]. Similarly, when manufacturing output drops, a government is more likely to find evidence supporting a damage judgment, thus leading to a positive finding for AD. In this study, it is assumed that manufacturing output has a negative correlation with AD. As with GDP growth and exchange rates, one-year lagged values were used.
Trade liberalization has decreased import tariffs on Chinese products. This is very likely to increase the magnitude of Mexico’s AD concerns when Chinese products harm the interests of Mexican domestic manufacturers. This implies that more openness results in more demand for AD laws [
30]. More tariff cutting will likewise increase the use of AD counter-measures. The import tariffs for different sectors, namely consumer goods, capital and intermediate goods, are not the same, and are examined here separately.
Table 3 summarizes the independent variables.
Table 3.
Summary of independent variables.
Table 3.
Summary of independent variables.
| Variable | Observation | Mean | Standard Deviation | Min | Max | Description and Source |
|---|
| CNYtUSD(t-4) | 80 | 7.56 | 1.036 | 5.22 | 8.70 | Exchange rate of USD against CNY a |
| CNYtMXP(t-4) | 80 | 1.17 | 0.455 | 0.35 | 2.17 | Exchange rate of CNY against MXP a |
| GDPg(t-4) | 79 | 0.00 | 0.009 | −0.01 | 0.02 | GDP growth rate a |
| Produc(t-4) | 80 | 0.77 | 1.380 | −1.80 | 4.50 | Manufacture production output a |
| log_BT | 84 | 19.27 | 3.427 | 14.83 | 26.49 | Log of Imbalance of trade a |
| IP | 84 | 2.19 | 0.207 | 1.84 | 2.52 | Import penetration a |
| ConsumpG_private | 84 | 6.00 | 2.362 | 1.90 | 8.75 | Private consumption growth a |
| ConsumpG_individual | 84 | 5.22 | 2.079 | 1.60 | 7.60 | Individual consumption growth a |
| tariff_IC | 84 | 9.76 | 3.642 | 2.33 | 13.54 | Import tariff of intermediate & capital b goods |
| tariff_C | 84 | 18.11 | 4.350 | 9.59 | 23.99 | Import tariff of consumer goods b |
The dependent variable, tariff lines under Mexico’s AD (or AD) per quarter, is a count variable. Count variables are non-negative trials, and Count Response models are a subset of discrete response regression models. Discrete models uncover none negative integer response. All count models aim to explain the number of occurrences or counts. The counts are in intrinsically heteroskedastic, right skewed, and have a variance that increases as the mean of the distribution [
19]. Each trial (tariff line) is identical and independent of each other. Because the number of counts for Mexico’s accepted tariff lines under AD against China are discrete, the analysis does not follow the rules of Ordinary Least Square (OLS). In OLS, variables and residuals should have a bell-shape distribution, the frequency distribution created for this study shows that the dependent variables used violate the basic assumption of OLS, since the count variables are highly skewed (
Figure 1). As a result, a Poisson distribution model is introduced to offset this condition. The resulting model allows estimation the possibility of the occurrence of a given count of tariff lines (
) within each AD case filed by the Mexican government.
According to the Poisson Distribution-based model, the mean value of the dependent variable Y and the variances of Y are identical, they equal
. This is interpreted as the average tarifflines under Mexico’s antidumping measures relating to China in a quarter (tariffline filings):
If y is set as conditional on a set of x values, let
= (
) as the explanatory variables, then the goal is to analyze the relation between the average tariff line filings
and the explanatory variable
:
The distribution of y is conditional on a set of variable
. If
is replaced with
in Equation (1):
The relation between independent variables and dependent variable are expressed as log Y in the Poisson model:
In this study, it was found that the dependent variable did not follow exactly a Poisson distribution, as the variance of tariff lines (52.33) is much larger than its mean (14.202). In this case, there is an over-dispersion in the error term. Thus, a Negative Binomial model (NB) should be used as the regression model instead. The difference between the NB and Poisson models is that the NB helps in observing the over-dispersion of the error term in the Y variable [
15]:
Hypotheses
In testing this model, the following hypotheses are central to the analysis:
Hypothesis 1. The tariff lines used by Mexico in relation to Chinese products are impacted by the exchange rate CNY: MXP. As the CNY increases in value, these tariff lines may decrease its value due to the fact that Chinese made products become more expensive;
Hypothesis 2. The import tariffs imposed by Mexico on Chinese goods have an impact on tariff lines coverage. Mexico is likely to increase the tariff lines under AD scrutiny in relation to Chinese goods as import tariffs decrease.
If the hypothesized variables are inserted in the NB formula:
4. Empirical Finding
Table 4 confirms the economic impact on AD of intermediate and capital goods. In C1, C3 C4 and C6, the tariff lines under successful AD investigation (t) (similarly AD measures) are the dependent variable; for the rest of the columns, AD (ad) are used as the competing variable. The goodness of fit results for C2, C5 and C7 (as indicated by Pseudo R2) are better than that of C1, C4 and C6; however, the lnalpha constant is insignificant in C2, C5 and C7. This indicates that tariff lines are a better independent variable than AD.
Table 4.
Economic impacts on intermediate and capital goods.
Table 4.
Economic impacts on intermediate and capital goods.
| | (1) | (2) | (3) | (4) | (5) | (6) | (7) |
|---|
| | t_IC | ad_IC | t_IC | t_IC | ad_IC | t_IC | ad_IC |
|---|
| tariff_IC | 1.137 *** | 0.757 *** | 1.167 *** | 1.168 *** | 0.773 *** | 0.811 ** | 0.623 ** |
| | (2.60) | (2.66) | (2.66) | (2.65) | (2.60) | (2.28) | (2.35) |
| ConsumpG_private | −1.597 *** | −0.917 *** | −1.789 ** | −1.461 ** | −0.900 ** | | |
| | (−2.71) | (−2.70) | (−2.47) | (−2.50) | (−2.56) | | |
| log_BT | 2.160*** | 1.278 *** | 2.571 ** | 2.122 *** | 1.279 ** | 0.973 ** | 0.687 ** |
| | (2.73) | (2.66) | (2.17) | (2.69) | (2.55) | (2.27) | (2.14) |
| GDPg(t-4) | 108.241 ** | 109.112 *** | 101.846 * | 191.114 ** | 132.906 *** | 122.035 ** | 103.214 *** |
| | (2.02) | (3.09) | (1.86) | (2.20) | (2.91) | (2.49) | (3.50) |
| IP | | | 4.599 | | | | |
| | | | (0.49) | | | | |
| produc(t-4) | | | | −0.731 | −0.276 | | |
| | | | | (−1.32) | (−0.87) | | |
| CNYtUSD(t-4) | | | | | | −1.364 *** | −1.005 *** |
| | | | | | | (−3.03) | (−2.96) |
| _cons | −45.514 *** | −29.431 *** | −62.587 | −46.315 *** | −29.781 *** | −19.112 * | −14.769 ** |
| | (−2.74) | (−2.80) | (−1.59) | (−2.77) | (−2.72) | (−1.92) | (−2.08) |
| lnalpha | 1.683 *** | −1.077 | 1.677 *** | 1.611 *** | −0.876 | 1.367 *** | −13.723 |
| _cons | (3.91) | (−0.45) | (3.88) | (3.74) | (−0.43) | (2.85) | (−0.01) |
| N | 79 | 79 | 79 | 79 | 79 | 79 | 79 |
| Pseudo R2 | 0.1052 | 0.1578 | 0.1071 | 0.1204 | 0.1663 | 0.1286 | 0.1996 |
In the negative binomial model, the significance level of variables can be interpreted by the incidence rate ratio (IRR). IRR equals the exponentiated value of the coefficients, and is expressed as exp(coefficients). This indicates that if an explanatory variable changes by one unit, the dependent variable will change at the percentage rate indicated by IRR, when other variables are held constant.
Import tariffs (Tariff_IC) positively impact tariff lines. As tariffs decrease by one percentage point, the tariff lines of intermediate and capital goods under successful AD investigation are expected to drop about exp(1.168) or 3.22 points, when other variables are held constant. This implies that Mexico is decreasing its concentration on AD relating to Chinese intermediate and capital goods, since Mexico’s import tariff against China has a decreasing trajectory.
Moreover, consumption growth rates in intermediate and capital goods in the private sector have a negative correlation with tariff lines. As the consumption growth rate surges by 1%, Mexico is likely to reduce its AD measures against China (indicated by tariff lines) by about exp(−1.46) or 0.23 points, when other variables are held constant. This phenomenon suggests that the Mexican AD authority is reluctant to use AD against imports of industrial inputs from China, even though the consumption of Chinese-made goods will increase, given that China is the second largest source of imports for Mexico. This is probably because AD charges on intermediate and capital goods from China may increase the input cost of domestic non-import competing companies; thus, they are likely to try to block positive AD findings.
A Log-analysis of the trade surplus of Mexico against China (log_BT) has positive impacts on AD (indicated by tarifflines). For a one point decline in log_BT, tariff lines are expected to decrease for about exp(2.122) or 8.35 percent, and vice versa, when other variables are held constant. As the trade deficit enlarges, tarifflines under AD will decrease. In other words, the number of tariff lines that have been concentrated on under Mexican AD is dropping, even though the trade deficit on intermediate and capital goods is growing.
The GDP growth rate or GDPg(t-4) has a positive impact on tariff lines; for every percentage point increase in GDP, tariff lines under AD go up 8.9 points, when holding other variables constant. This may indicate that if the economy is developing at a fast pace, more input manufacturing sectors will move to Mexico rather than rely on imports from China, as local producers are more sensitive to these demand changes. As a result, imports from China become vulnerable antidumping targets for local producers. This finding is different from the previous finding, that GDP growth rate has a negative correlation with AD.
Table 5 shows the factors influencing successful AD investigations on tariff lines of consumer goods. In C1, C3 and C5, tariff lines within successful AD on consumer goods are used as the dependent variable. In the remaining columns, AD is used as the dependent variable. The goodness of fit in columns using tariff lines as the dependent variable (C1, C3 and C5), is better than those using AD as the dependent variable. Moreover, the lnalpha constant in C2, C4 and C6 is insignificant. This indicates that the new data collection method has advantage in explaining Mexico's AD measures relating to China in both sectors.
Table 5.
Economic impacts on consumer goods.
Table 5.
Economic impacts on consumer goods.
| | (1) | (2) | (3) | (4) | (5) | (6) |
|---|
| | t_C | ad_C | t_C | ad_C | t_C | ad_C |
|---|
| CNYtUSD(t-4) | −2.086 ** | −1.784 ** | −2.372 ** | −2.042 ** | −2.308 ** | −2.066 ** |
| | (−2.27) | (−2.08) | (−2.26) | (−2.04) | (−2.29) | (−2.08) |
| IP | −21.656 ** | −13.097 * | −20.825 * | −13.120 * | −18.169 * | −11.595 |
| | (−1.96) | (−1.71) | (−1.91) | (−1.71) | (−1.75) | (−1.54) |
| ConsumpG_individual | 4.115 * | 3.409 * | 4.745 ** | 3.978 * | 4.528 ** | 3.852 * |
| | (1.84) | (1.83) | (1.98) | (1.89) | (2.03) | (1.89) |
| log_BT | −4.133 ** | −3.140 ** | −4.520 ** | −3.536 ** | −4.231 ** | −3.352 ** |
| | (−2.05) | (−2.01) | (−2.18) | (−2.08) | (−2.20) | (−2.05) |
| tariff_C | −0.443 | −0.403 | −0.532 * | −0.485 * | −0.519 * | −0.468 * |
| | (−1.44) | (−1.51) | (−1.65) | (−1.67) | (−1.67) | (−1.65) |
| produc(t-4) | | | −0.396 | −0.270 | −0.836 * | −0.472 |
| | | | (−1.22) | (−0.94) | (−1.68) | (−1.23) |
| GDPg(t-4) | | | | | 77.990 | 43.283 |
| | | | | | (1.17) | (0.83) |
| _cons | 127.014 ** | 89.789 ** | 133.167 ** | 97.969 ** | 121.857 ** | 91.433 ** |
| | (2.15) | (2.04) | (2.25) | (2.11) | (2.22) | (2.04) |
| lnalpha_cons | 1.158 ** | 0.176 | 1.026 ** | 0.098 | 0.814 | −0.160 |
| | (2.50) | (0.22) | (2.12) | (0.12) | (1.57) | (−0.18) |
| N | 80 | 80 | 80 | 80 | 79 | 79 |
| Pseudo R2 | 0.2188 | 0.2075 | 0.2331 | 0.2174 | 0.2499 | 0.2332 |
The ratio CNYtUSD has negative impacts on AD. For every one percentage point depreciation of the CNY against the dollar, the tariff lines of consumer goods under AD duty is expected to increase by exp(−2.372) or 0.1 point, when other variables are held constant. The individual consumption of consumer goods also positively affects AD. For every one point increase in the consumption of consumer goods, tariff lines covered in AD are expected to increase by exp(4.745) or 115 points. This implies that increases in individual consumption are the major cause of the surge in Mexican AD concerns relating to China.
The log of trade surplus on consumer goods (log_BT) shows negative impacts on AD. For every percentage point decrease in log_BT, tariff lines are expected to increase by exp(−4.52) or 0.01 points, when other variables are held constant. As the log value of trade surpluses decreases, Mexico’s AD measures against China will increase. In other words, as Mexico’s trade deficit increases in relation to consumer goods, the coverage of AD measures relating to China will increase. As observed earlier, this situation is different from that faced by intermediate and capital goods.
Import tariffs on consumer goods though have a negative correlation with AD. For every percentage point decrease in import tariffs, the tariff lines of consumer goods under AD scrutiny are likely to increase by exp(−0.532) or 0.59 points. In fact, Mexico has been decreasing its import tariffs on Chinese goods since the 1990s. From 1991 to 2010, the average import tariff on Chinese consumer goods decreased from 18.9% to 9.59%. This implies that as the Mexican government needs AD as a temporary trade barrier to make up for the loss of the shield of tariff protection. This situation is also different to that faced by intermediate and capital goods—the import tariffs on these inputs has a positive relationship with AD. This indicates that the government has been promoting the trade liberalization of intermediary goods while restraining market opportunities for the consumer goods sector, a strategy helpful in decreasing industrial input costs and increasing the competitiveness of domestic manufacturers.
In order to check whether the AD surge in 1993 affects our empirical result, we removed all the observations in the years 1992 and 1993. The regression models show the same result. In addition, we also added a yearly dummy variable “1” start in 2001, indicating China’s access to the WTO, and “0” indicating China’s non-WTO status. The result shows this dummy variable is not statistically significant in our regression. It indicates China’s WTO access has no impact on the AD claims it received from Mexico.
Table 6 tests the competing independent variables CNYtUSD(t-4) and CNYtMXP(t-4). The goodness of fit (indicating by Pseudo R square) in C1 and C3 is much better than that of C2 and C4. In addition CNYtMXP(t-4) is not statistically significant in C2. This implies that CNYtUSD(t-4) is in fact a better independent variable for the present study. The regression results of the two models outlined in
Table 4 and
Table 5 are summarized in
Table 7. In fact, the CNY exchange rate against the USD has negative impacts on the tariff lines of all sectors. This implies that any depreciation of the CNY against the US dollar will increase Mexico’s AD concerns relating to China; and conversely, as the CNY appreciates against the USD, Mexico will decrease the coverage of AD in relation to China, simply because Chinese goods will become more expensive and less competitive. In this study, the exchange rate of the CNY against the MXP was also tested; however, its goodness of fit is much weaker.
Table 6.
Choosing between CNYtMXP and CNYtUSD.
Table 6.
Choosing between CNYtMXP and CNYtUSD.
| | (1) | (2) | (3) | (4) |
|---|
| | t_C | t_C | t_IC | t_IC |
|---|
| Main | | | | |
| CNYtUSD(t-4) | −2.086 ** | | −1.274 *** | |
| | (−2.27) | | (−2.79) | |
| CNYtMXP(t-4) | | 8.100 | | −8.251 ** |
| | | (1.51) | | (−2.23) |
| tariff_C | −0.443 | 0.029 | | |
| | (−1.44) | (0.12) | | |
| IP | −21.656 ** | −19.976 * | | |
| | (−1.96) | (−1.81) | | |
| ConsumpG_individual | 4.115 * | −0.304 | | |
| | (1.84) | (−0.27) | | |
| log_B | −4.133 ** | −2.337 | 1.012 ** | 1.715 ** |
| | (−2.05) | (−1.39) | (2.36) | (2.47) |
| tariff_IC | | | 0.848 ** | 0.724 ** |
| | | | (2.39) | (2.18) |
| produc(t-4) | | | −0.594 | −0.882 |
| | | | (−1.12) | (−1.56) |
| GDPg(t-4) | | | 187.787 ** | 248.187 *** |
| | | | (2.33) | (2.62) |
| _cons | 127.014 ** | 78.894 | −21.187 ** | −34.155 ** |
| | (2.15) | (1.59) | (−2.11) | (−2.50) |
| Lnalpha_cons | 1.158 ** | 1.341 *** | 1.351 *** | 1.760 *** |
| | (2.50) | (2.83) | (2.82) | (4.33) |
| N | 80 | 80 | 79 | 79 |
| Pseudo R2 | 0.2188 | 0.1833 | 0.1396 | 0.1037 |
Table 7.
Summary of variable impacts.
Table 7.
Summary of variable impacts.
| | CNYtUSD(t-4) | IP | Consumption | log_BT | tariff_C | Produc(t-4) | GDPg(t-4) |
|---|
| C | − | − | + | − | − | ? | + |
| IC | − | ? | − | + | + | ? | ? |
Consumption growth has negative impacts on intermediate and capital goods imports, and positive impacts on those of consumer goods. For every percentage point increase in the consumption of consumer goods, the coverage of tariff lines will increase by 134 points, and conversely, every one point growth on consumption of intermediates and capital goods will decrease tariff lines by 0.23 points. This implies that the Mexican AD authority holds different attitudes towards these two different product sectors. On one hand, the growth in consumption of Chinese consumer goods directly harms the interests of domestic import competing manufacturers, thus it becomes more likely that the antidumping investigation results will be positive; on the other hand, the consumption of intermediate and capital goods from China can assist in increasing the competitiveness of domestic manufacturers in home and foreign markets. As a result, AD for China’s inputs has not increased but has decreased in recent years.
The value of such a trade liberalization strategy is also confirmed by the real impact of tariff cutting. In fact, Mexican import tariffs on Chinese goods decreased dramatically after 1991 in all sectors. Instead, the authorities increased AD coverage on consumer goods but decreased tariff lines on intermediates and capital goods. This implies that the AD authority in Mexico prefers to liberalize the markets for capital and intermediate products, while at the same time protecting domestic consumer goods’ manufacturers.
5. Concluding Remarks
This is a research about AD between two developing countries. We choose Mexico as the AD investigation initiator for several reasons. First, Mexico is one of the most active AD users among all developing countries [
13]. China is the most affected country by Mexico’s AD investigation in the world. The likelihood of successful AD investigations of China is the most highest among all Mexican AD targets [
8] Second, Mexico experienced sudden trade liberalization at the beginning of the 1990s. More importantly, as we have discussed extensively previously, China’s WTO access did not affect the “safety valve” for Mexico. Mexico is the only country in the world that seeks to make China “acquiesce” by using AD as an administrative trade protective barrier against Chinese products. Thirdly, Mexico is one of a few developing countries that did not grant China Market Economy Status (MES). As such, Mexico can use AD as a trade protective measure easily by using other countries’ prices as evidence for China’s dumping.
This paper has reviewed the economic situation of Mexico when it has used antidumping regulations on Chinese imports, focusing on tariff lines in conjunction with antidumping measures. This analysis is better able to explain why AD measures are more biased towards particular sectors of the economy than those carried out in the past. First, as most previous research has taken the exchange rate of the importing country as the subject of study, it is not surprising that these studies found a relation between the exchange rate of the importing country and its initiation of AD actions. However, this study finds, instead, that the exchange rate of CNY against the USD can better explain Mexico’s imposition of AD on China than that of the CNY against the MXP. The results of this analysis show better goodness of fit and stronger robustness. Further, CNY appreciation is helpful in decreasing Mexico’s AD actions against China, particularly those on intermediate and capital goods. In this way, this study is an important addition to the literature.
Second, in the previous literature, a positive relationship between AD and import penetration is stressed. In this study, an inverse relationship between them is apparent. This implies that the Mexican government has been working hard to bring its WTO-inconsistent AD measures for China back to the benchmarks of the WTO system, even though the import penetration of Chinese goods is growing in Mexico. This reflects the efforts made by the two governments to decrease the impact of trade conflicts.
Third, the Mexican AD authority is more likely to generate positive findings (in other words, assess that dumping has taken place) on consumer goods and reach negative findings on the dumping of intermediate and capital goods, when domestic consumption has increased. The intermediate and capital inputs imported by domestic producers thus have the positive role of sustaining trade liberalization, while domestic consumer goods’ producers gain benefits from resisting trade liberalization in consumer goods from China. These results are consistent with the literature, which reports that the companies that produce final consumption goods tend to have been strong lobbying power (Niels and Ten Kate 2004, 2006) [
5,
9].
Globalization is unsustainable in the long run unless we introduce new institutions and policies to govern it. As such, the results indicate that AD use for consumer goods may help to sustain trade liberalization of intermediate and capital goods under the domestic political pressures for trade opening. Further researches are needed to examine the social-economic and environment impacts of such biased attitudes of antidumping on the importing countries. Innovative trade policies are needed for different product types in both importing and exporting countries.


