Article

Assessing Landscape Ecological Risk in a Mining City: A Case Study in Liaoyuan City, China

1
Laboratory for Earth Surface Processes, Ministry of Education, College of Urban and Environmental Sciences, Peking University, Beijing 100871, China
2
Key Laboratory for Environmental and Urban Sciences, School of Urban Planning and Design, Shenzhen Graduate School, Peking University, Shenzhen 518055, China
3
Shanghai Urban Planning and Design Research Institute, Shanghai 200040, China
*
Author to whom correspondence should be addressed.
Sustainability 2015, 7(7), 8312-8334; https://doi.org/10.3390/su7078312
Submission received: 29 January 2015 / Revised: 17 June 2015 / Accepted: 18 June 2015 / Published: 29 June 2015
(This article belongs to the Special Issue Landscape and Sustainability)

Abstract

:
Landscape ecological risk assessment can effectively identify key elements for landscape sustainability, which directly improves human wellbeing. However, previous research has tended to apply risk probability, measured by overlaying landscape metrics to evaluate risk, generally lacking a quantitative assessment of loss and uncertainty of risk. This study, taking Liaoyuan City as a case area, explores landscape ecological risk assessment associated with mining cities, based on probability of risk and potential ecological loss. The assessment results show landscape ecological risk is lower in highly urbanized areas than those rural areas, suggesting that not only cities but also natural and semi-natural areas contribute to overall landscape-scale ecological risk. Our comparison of potential ecological risk in 58 watersheds in the region shows that ecological loss are moderate or high in the 10 high-risk watersheds. The 35 moderate-risk watersheds contain a large proportion of farmland, and the 13 low-risk watersheds are mainly distributed in flat terrain areas. Our uncertainty analyses result in a close range between simulated and calculated values, suggesting that our model is generally applicable. Our analysis has good potential in the fields of resource development, landscape planning and ecological restoration, and provides a quantitative method for achieving landscape sustainability in a mining city.

Graphical Abstract

1. Introduction

Landscape sustainability is defined as the capacity of a landscape to consistently provide long-term, landscape-specific ecosystem services, which is essential for maintaining and improving human wellbeing [1]. Sustainability is an object that not only meets the demands of humans nowadays, but also ensures future benefits. Thus, the forecast for future benefit and security is critical in sustainability research. Risk assessment, which focuses on future damages, is appropriate for evaluating sustainability as both of the concepts concern the future benefits and security of system. In other words, ecological security framework for ecosystem health protection and ecological risk control are essential for the improvement of ecological sustainability in regions and landscapes [2]. Therefore, ecological risk assessment is one effective way to determine regional and landscape-scale ecological sustainability [3]. In 1989, Hunsaker defined regional ecological risk assessment as the evaluation of regional-scale risk faced by environmental resources, or the risk caused by regional-scale pollution and natural disturbance [4], and he proposed to apply ecological risk assessment to regional and landscape scales in 1990 [5]. In the decade that followed, a series of ecological risk assessments were conducted in watersheds and other large areas [6,7,8,9,10]. However, growing recognition of the interplay of factors that might influence risks faced by ecosystems, such as global urbanization, land use change, and climate change, has led to the realization that unilateral risk management is unlikely to be useful in the management of complex systems. The need for a multilateral approach that incorporates the roles of various landscape factors in influencing risk and, therefore, sustainability was addressed with the first landscape ecological risk assessments that were conducted in the 21st century [11].
Landscape ecological risk refers to the possibility of harm to the structure and function of ecosystems from disturbances, such as human activities and natural disasters [12]. Landscapes are typically impacted by multiple disturbances that operate at different spatial and temporal scales [13,14]. Therefore, in contrast to general ecological risk assessment, landscape ecological risk assessment comprehensively assesses various types of potential ecological impacts, and their cumulative effects. It explores the effects of a variety of hazards for large-scale units, and is the complement and expansion of general ecological risk assessment. Landscape ecological risk assessment also accounts for differences in ecological characteristics and risks between different landscapes and assessment units via spatial heterogeneity, and time-series analyses. For example, Graham et al. used contagion index to evaluate the regional ecological risk considering the terrestrial and aquatic linkages, and the landscape pattern [15]; Kapustka et al. suggested risk management countermeasures grounded in landscape ecology [16]; Liu et al. drew attention to potential ecological risks caused by the intensification of soil erosion, and ecological vulnerability [17].
Within the last decade, landscape ecology work in China has produced relatively independent quantitative evaluation models which took landscape patterns and function into consideration [18]. One such model provides a landscape ecological risk index developed from spatial patterns and several indices, such as disturbance and vulnerability indices [19,20], landscape exposure, stability, and external pressure indices [21], as well as threat and intensity indices [22]. However, models of these type tend to calculate risk directly from probability values by the superimposition of landscape pattern indices, ultimately predicting only the probability of the occurrence of an adverse ecological event, and paying little attention to the probability of ecological losses following the event. Models based on threat and intensity indices focus on ecological risk caused by external threats, and ignore the inherent features of landscapes, including their vulnerability, resilience, stability, and the value of certain landscape features. Some other models, that characterize risk loss (the loss of risk), by calculating ecosystem services, are often limited by the direct conversion of land use, and fail to consider the effects of landscape patterns on it [23]. In addition, uncertainty analysis methods, highlighted in ecological risk assessment, is essential for the reliability of the results, and it has drawn increasing attention from scholars [24].
Mining area is a special man-land system, where people are engaged in complex interactions with land, for the exploitation of mineral resources, which has caused serious impacts on the environment [25,26]. Ecological risk assessment plays an important role in both theoretical support, and practical guidance for the implementation of regional sustainable development, and ecological restoration in mining cities [27]. Environmental problems in mining cities result primarily from mining itself, and ecological risk assessment in these cities should be built on the specific social, economic, and natural environments of the mining city in question. When combined with traditional ecological problems and risk type analysis, landscape ecology can form an important component of ecological risk assessment. Current work on ecological risk assessment in mining cities in China largely address the ecological effects of mining on soils, such as heavy metal pollution [28], land use, vegetation and landscape patterns [29,30]. However, quantitative assessments of integrated ecological risks stemming from a variety of risk sources, targeting a number of risk receptors, and driving varied ecological effects, are scarce.
Mining landscape ecological risk assessment entails the analysis of the direct and indirect risks posed by mining on a macro-scale in view of overall regional sustainability. It will be an important warning, as well as a practical guide for the planning and sustainable development of mining landscapes, including mining cities. In this study, using Liaoyuan known as the coal capital of Jilin Province as a case study, a mining landscape ecological risk assessment was quantitatively explored. Liaoyuan belongs to the first batch of China’s resource exhausted cities, and urban development and environmental protection have been significantly influenced by mining activities. In the transformation of economic development, the urban ecological problem and regional ecological risk can probably be stimulated. As a result, ecological risk assessment at landscape scale is in great need to provide a spatial approach for ecological security and sustainability. Specifically, the goals of this study were to (1) quantify the disturbance and vulnerability degrees of the landscape using multiple indicators developed on the basis of traditional landscape pattern indices for mining cities; (2) calculate the risk of loss based on the landscape pattern index, in order to explore a new model for the landscape ecological risk assessment of mining cities; (3) construct landscape ecological risk zoning based on risk assessment results to provide direction for the sustainable development of mining cities; and (4) conduct landscape ecological risk uncertainty analysis to verify the reliability of our risk evaluation results.

2. Materials and Methods

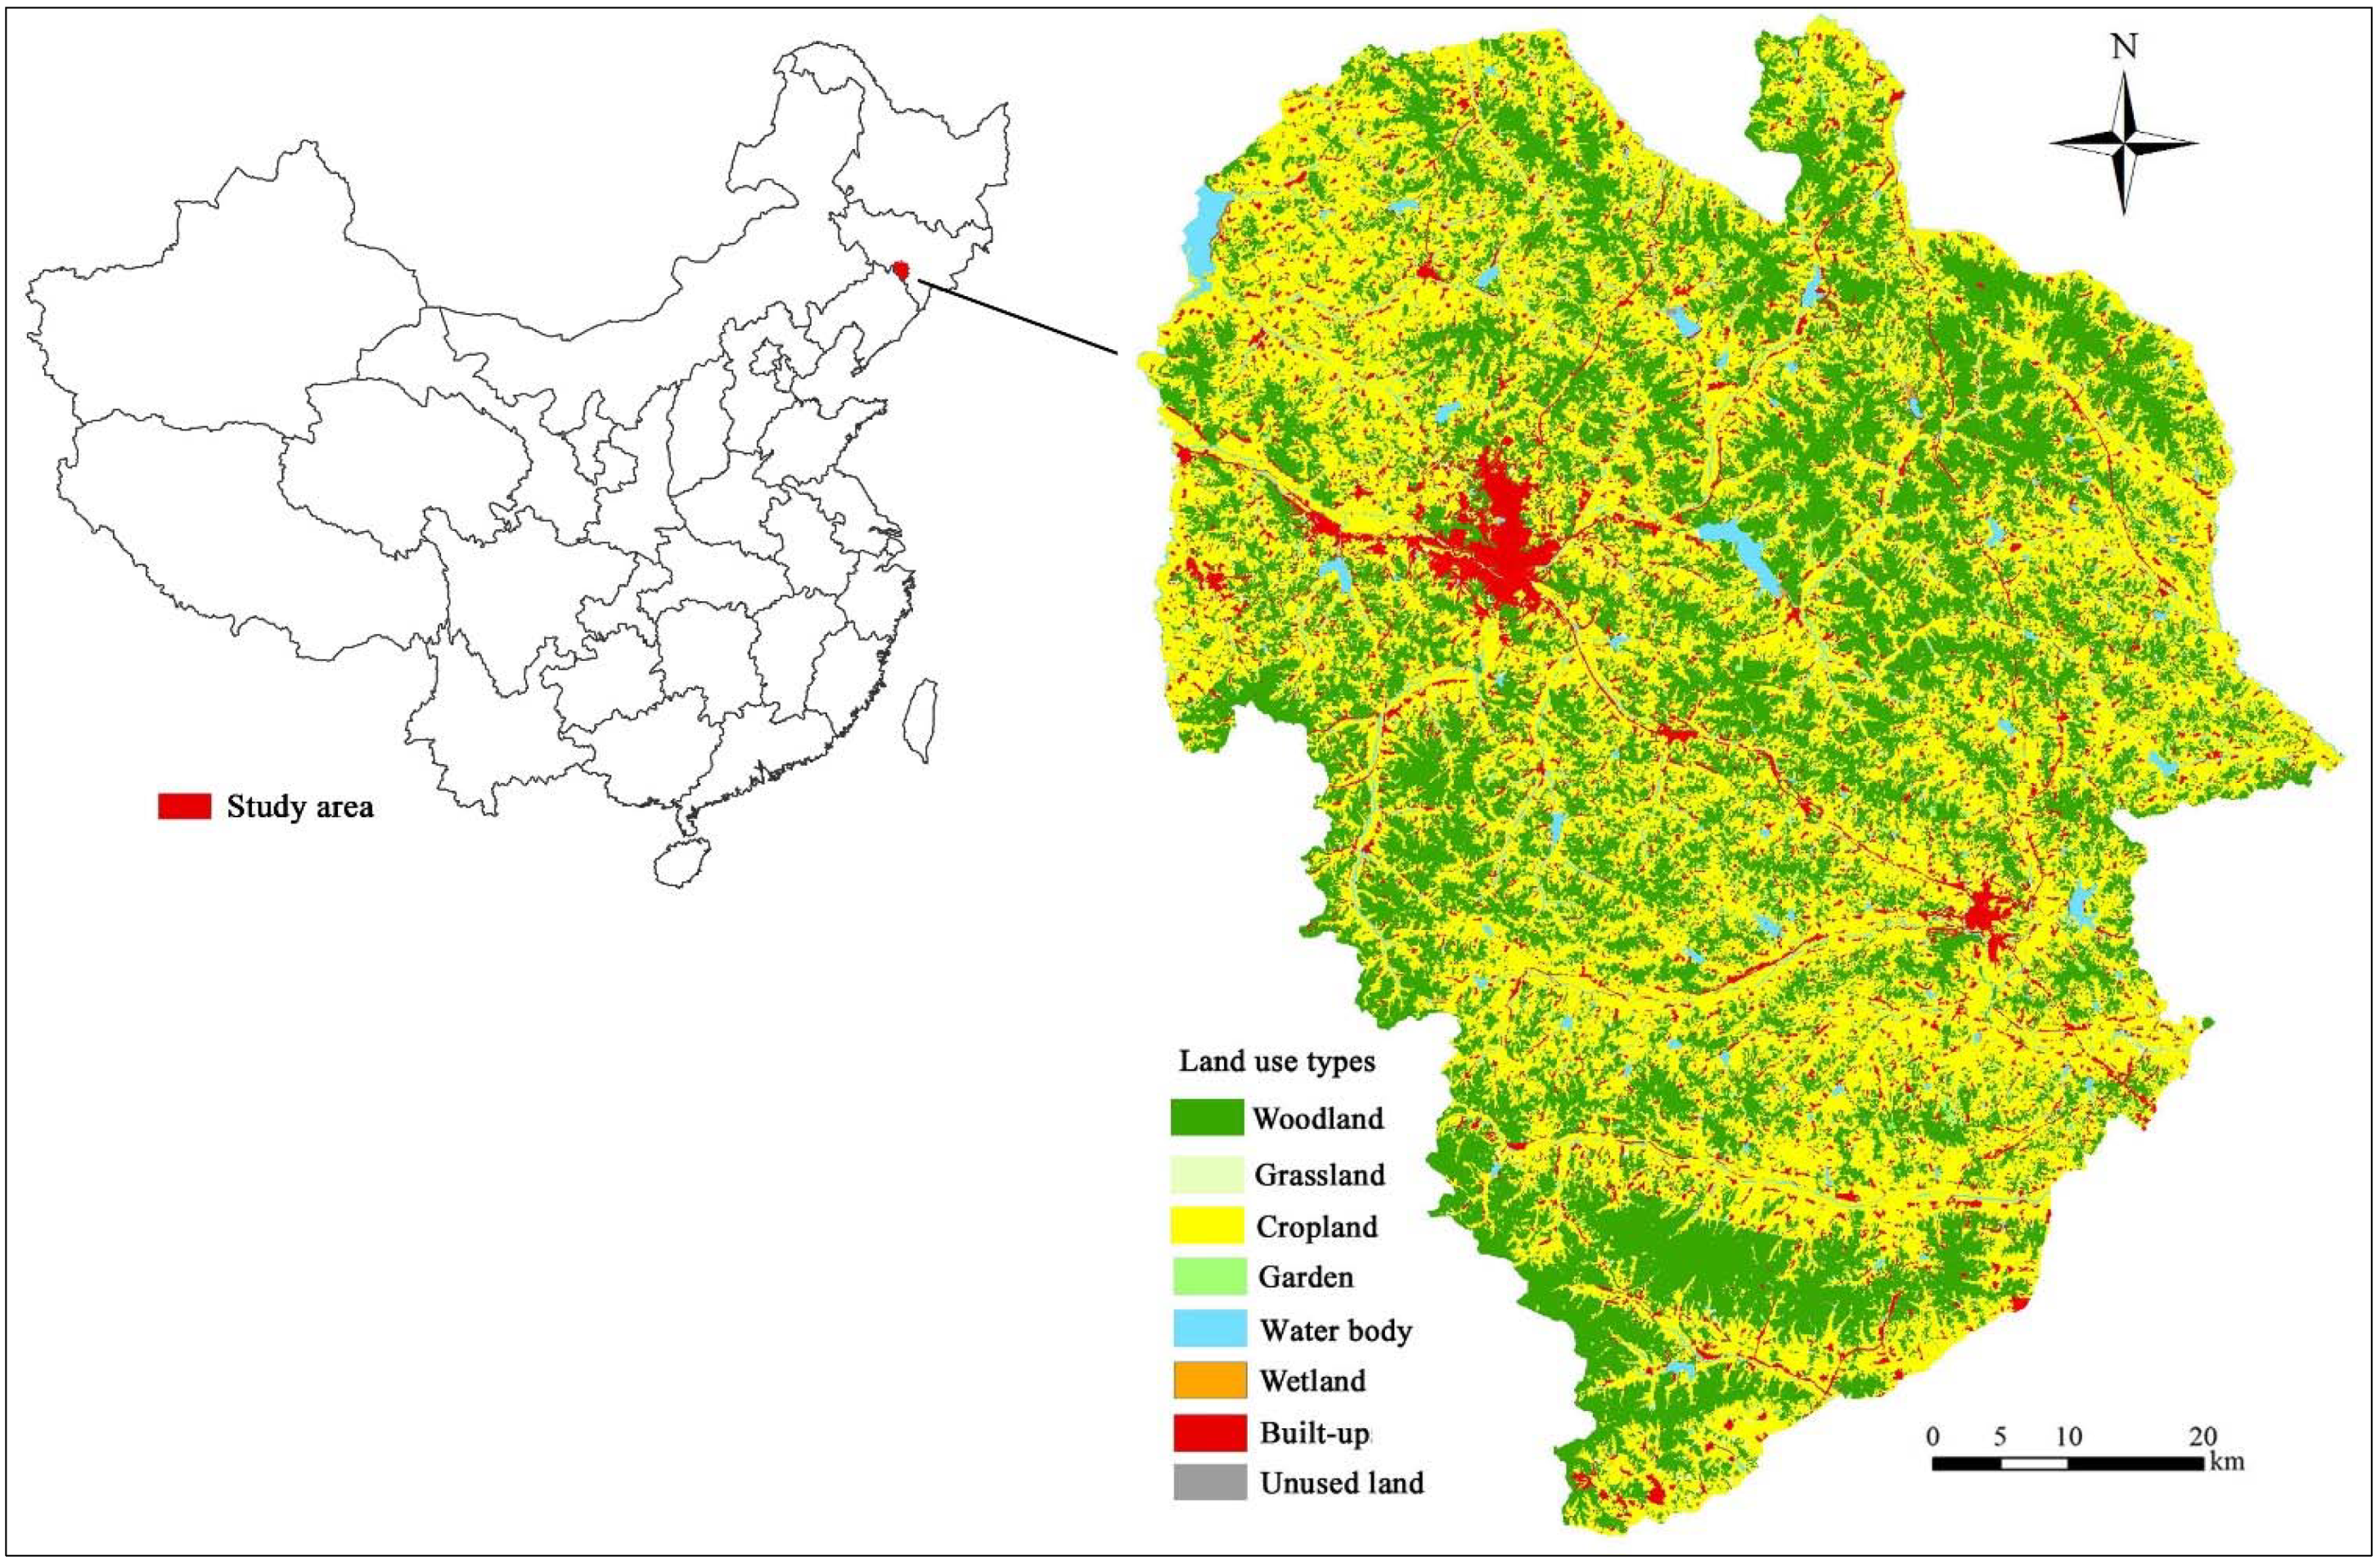
2.1. Study Area and Data Source

Liaoyuan Prefecture City (5140 km2; 42°17′40″N to 43°13′40″N, 124°51′22″E to 125°49′52″E), which contains 33 towns, lies in the south-central part of Jilin Province, China. It is upstream of the Dongliao and Huifa Rivers, within the transition zone between the Changbai Mountains and the Songliao Plain, and across Liaohe River and Songhua River (Figure 1). Liaoyuan enjoys a semi-humid, temperate, and continental monsoon climate, with abundant water, and forest resources. Liaoyuan is a coal resource-based city. By the end of 2007, 33 types of minerals had been discovered in Liaoyuan, of which coal and building stone comprise a large proportion. There are 152 mineral ore fields in Liaoyuan, most of which are small, and their distribution is concentrated. Mining has boosted economic development in the region, but has also resulted in severe damage to regional eco-environment. The environmental problems such as ground subsidence, air pollution, and excessive heavy metal waste production, have had serious impacts on local people’s life and social development [31]. In March 2008, the National Development and Reform Commission (NDRC, China) listed Liaoyuan in the first batch of resource-exhausted cities that were in urgent need of transformation in economic development.
Figure 1. Location of Liaoyuan City, China.
Sustainability 07 08312 g001
The land use data is from the second national land survey of Liaoyuan. According to land use classification and planning criteria published by China Land Resource Bureau, the landscape of Liaoyuan may be divided into 8 types, i.e., woodland, grassland, cropland, garden, water body (including rivers, surface water ponds and reservoirs), wetland (including inland beaches and marshes), built-up, and unused land (including bare, sandy and saline land; Figure 1). Among these types, wetlands and unused land refer to natural reserves referring to the secondary indicators of classification system.
In this study, cities, rural settlements, mining sites, and other construction sites are treated as ecological risk sources, and natural and semi-natural landscapes are treated as risk receptors, whose risk is assessed. The location of mines is provided by Liaoyuan City Land Bureau, which is used for evaluating the disturbance of mines. Data on gross regional product, population, industry, and other socio-economic data is taken from the “Liaoyuan Statistical Yearbook (2009)” and “Liaoyuan Yearbook (2010)” to measure the development of Liaoyuan [32,33]. Based on a 30 m × 30 m Digital Elevation Model (DEM) image, and 1:200,000 topographic maps of Liaoyuan, in 2009, the study area is divided into 58 small watershed basins (Figure 2). Watershed, which in relation to hydrology process and topography, can determine ecosystem processes in a relatively integrated region without being subjectively sliced. Thus, since watershed unit contains more ecological meanings than town unit, it is set as assessing units for landscape ecological risk assessment. The hydrological analysis module (Hydrology) of ArcGIS10.0 is used for zoning the study area.
Figure 2. Extracted watersheds based on DEM in Liaoyuan City, China. (Note: R-River, U-Upstream, M-Midstream, D-Downstream).
Sustainability 07 08312 g002

2.2. Calculation of Landscape Ecological Risk

The formula for risk measurement is the methodology basis of regional landscape ecological risk assessment [34]. In this paper, overall landscape ecological risk (R) is calculated as a function of the probability of ecological risk (P), and risk loss (D), wherein P is the product of ecological disturbance (E) and ecological vulnerability (V), and risk loss represents ecological importance (S). However, the final probability (between 0 and 1), sometimes, may be too small to have a meaningful impact on the partitioning of ecological risk. In order to avoid such insignificant values, the cube root result of proposed function is extracted to arrive at final landscape ecological risk.
R = P × D 3 = E × S × V 3
In order to clarify the management approach most appropriate to a specific landscape ecological risk, such as risk control guidelines, the calculated risk is “zoned” after the risk assessment. First, landscape ecological risk is divided into three grades (high, moderate and low), and then, using the “Natural Break” function in ArcGIS10.0, the risk is stacked onto ecological risk probability, together with risk loss, to produce a map of landscape ecological risk zones.

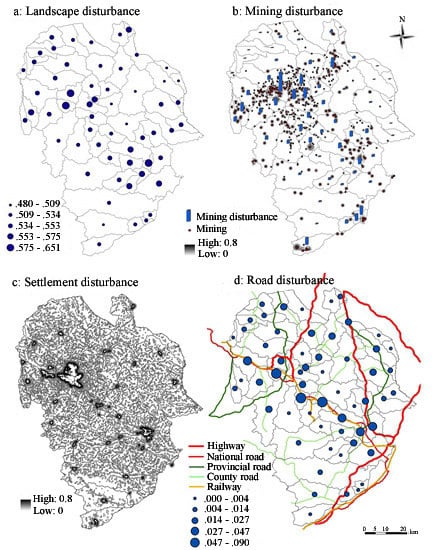
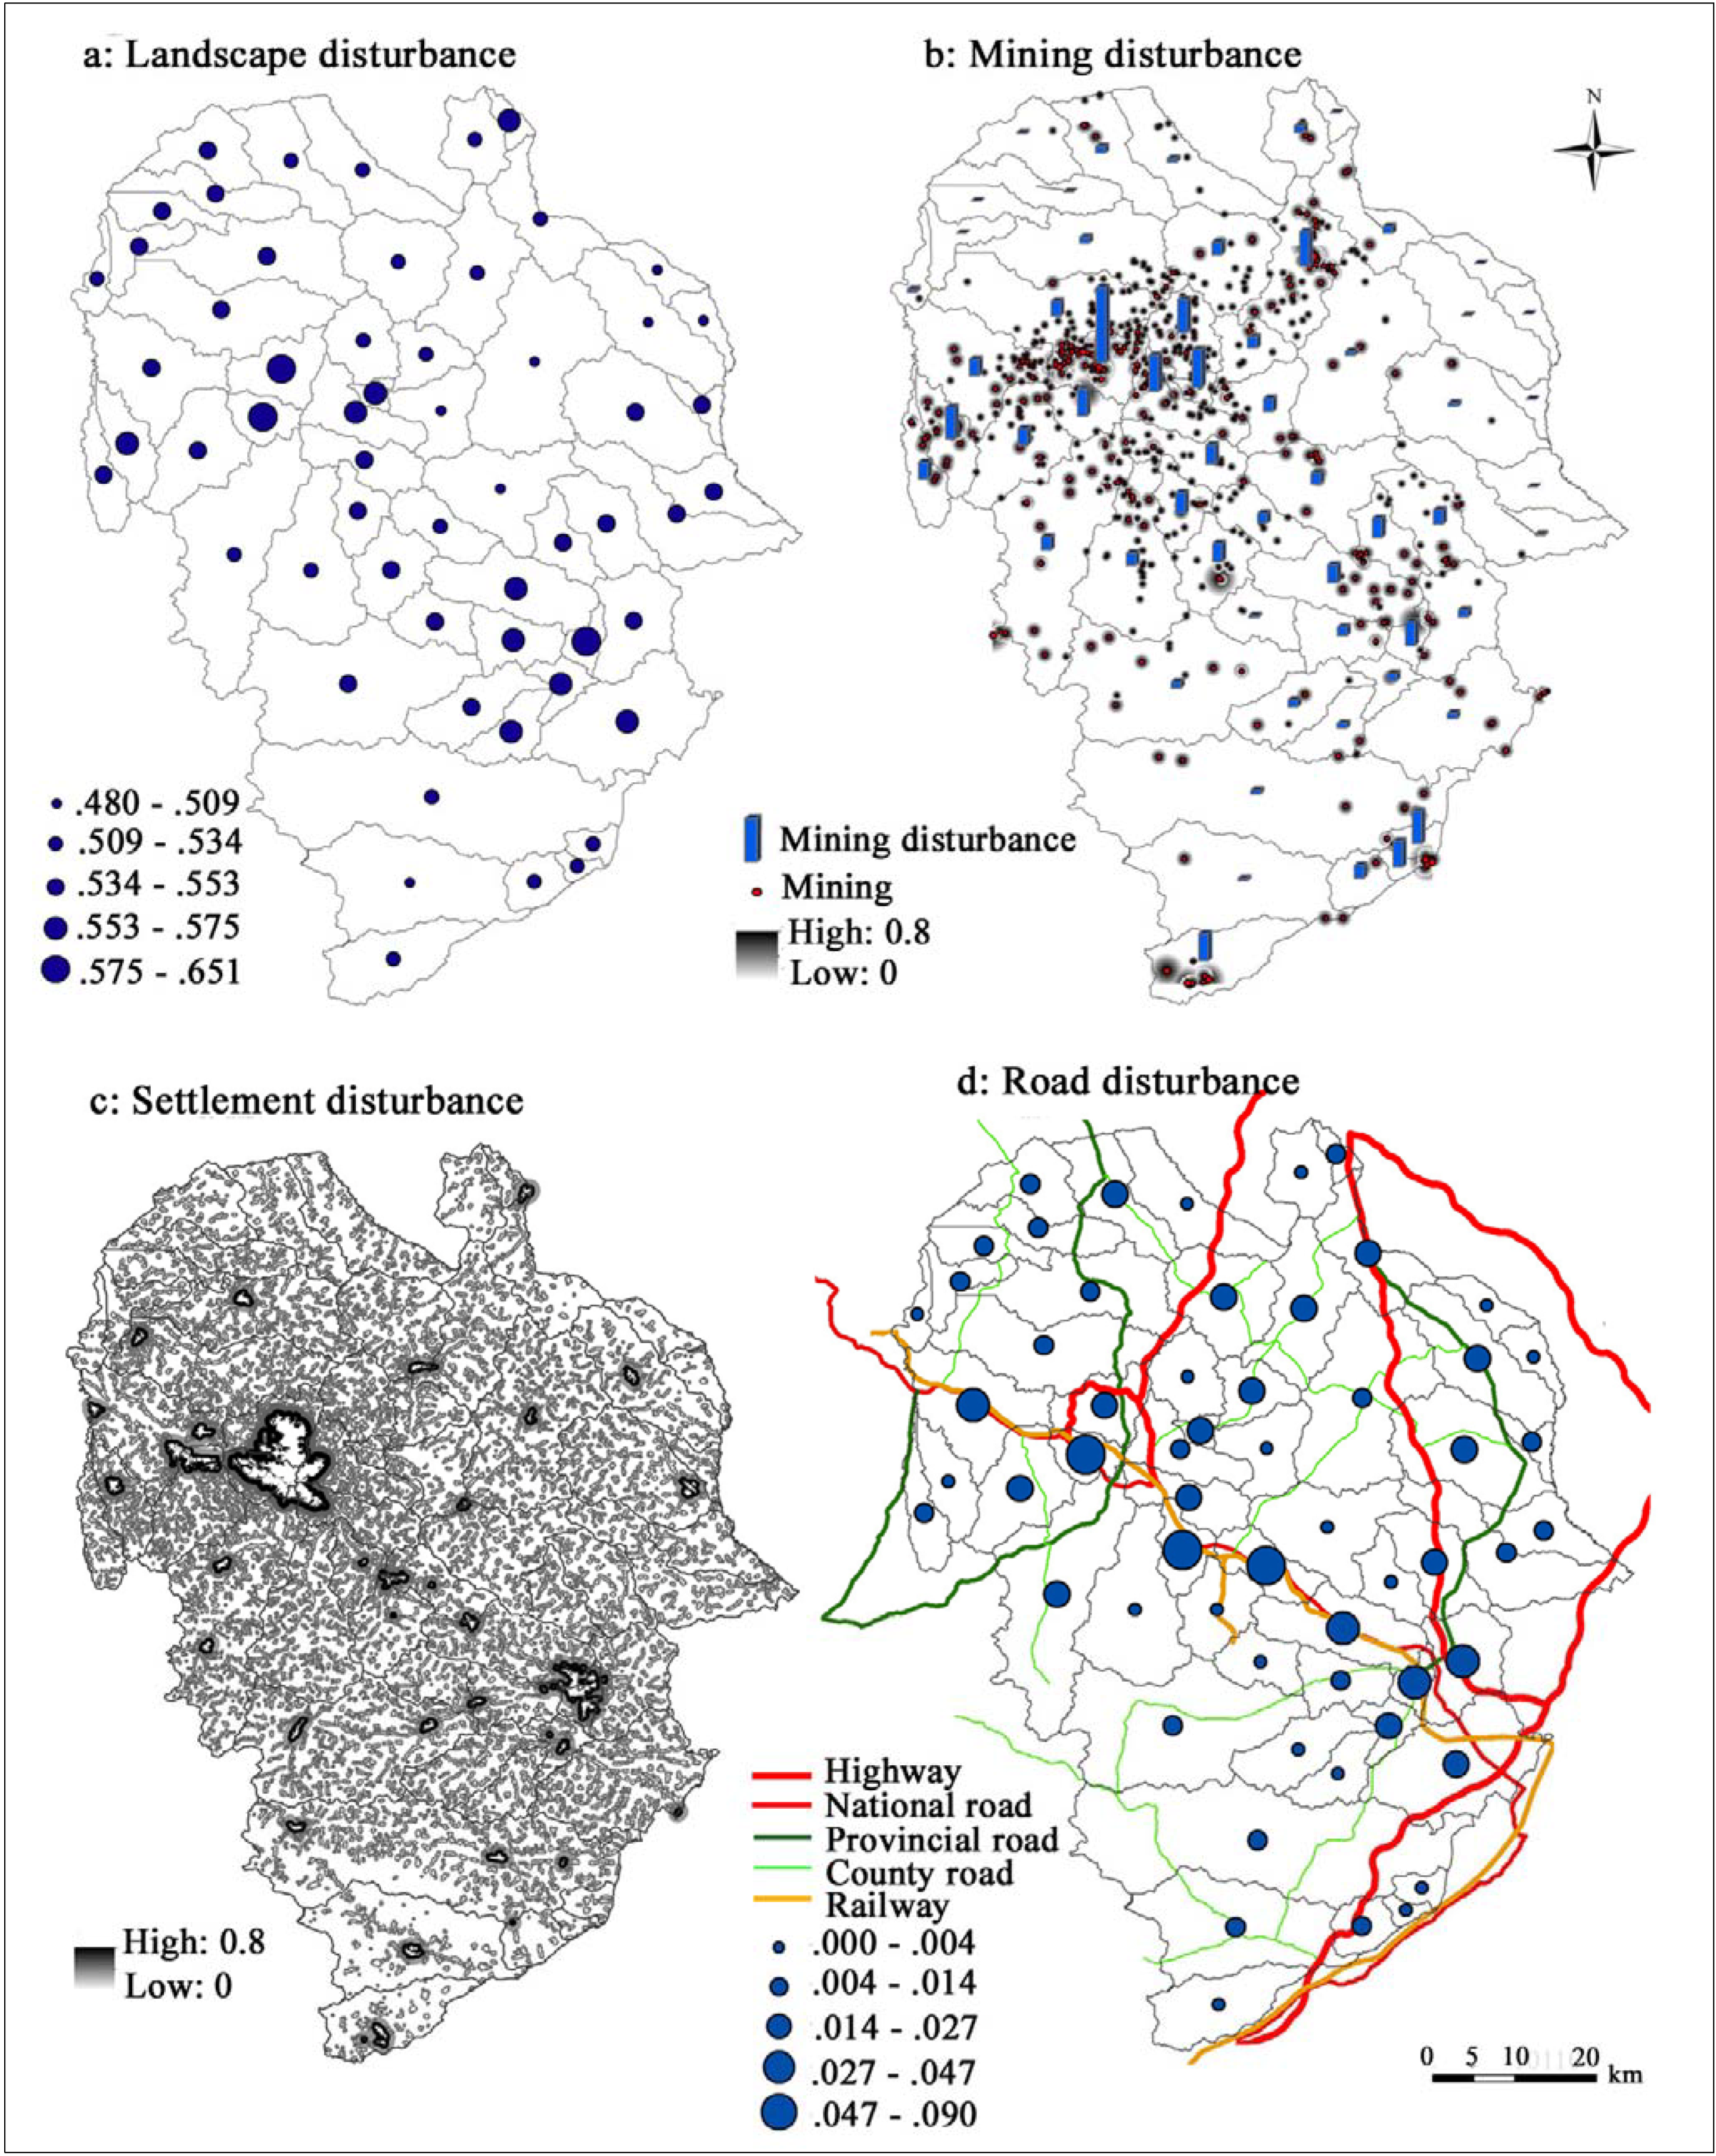
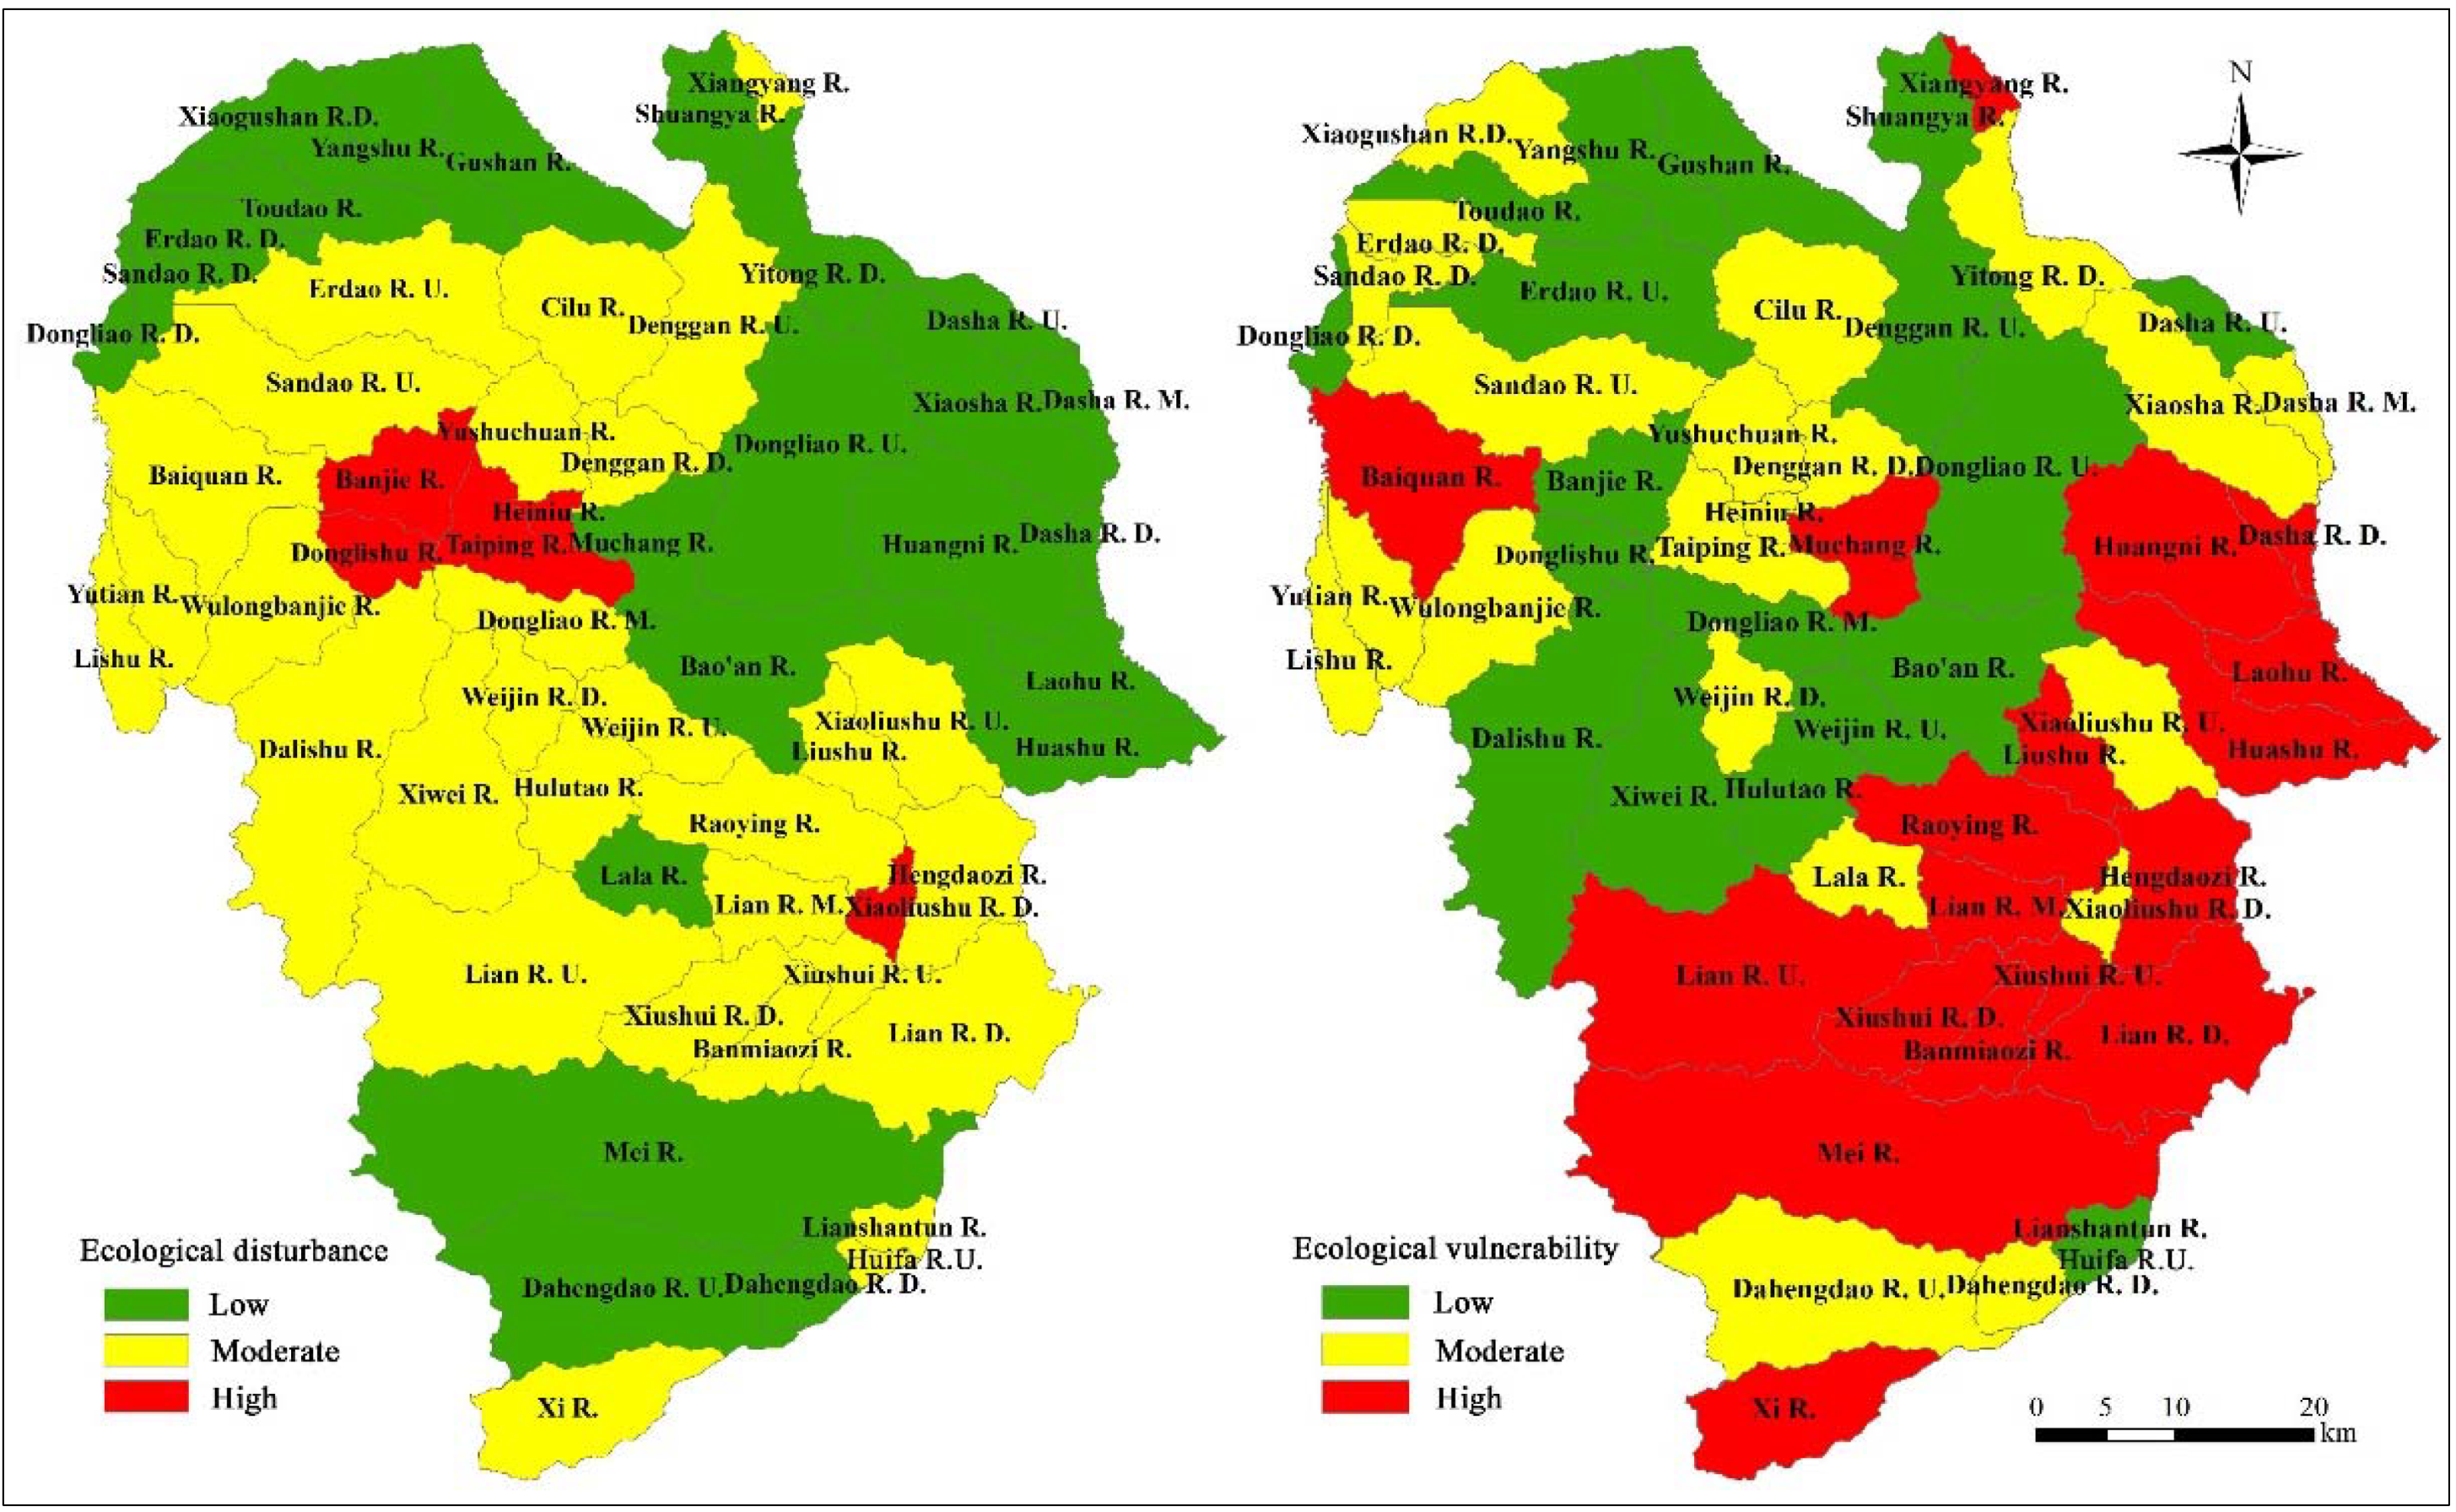
2.2.1. Ecological Disturbance

Ecological disturbances are relatively discrete events that alter ecosystems, communities, or demographic structure, and result in changes in resources, substrates, or the physical environment [35]. It is the external cause of regional ecological risk, and one of the main sources of landscape heterogeneity [36]. Land use degree is a representation of how broad and deep landscapes are utilized under the influence of a combination of human activities and social development factors [37]. It reflects not only the natural attributes of the land, but also the comprehensive effect of human activity on the land [38]. However, land use degree represents only current patterns of disturbance, and does not incorporate, in its measure, the probability of future human disturbance. Thus, on the basis of previous researches on land use classification, in this study, a model of landscape ecological disturbance (E), which attempts to incorporate settlement, mining, and road disturbances into the overall measure of human disturbance, is constructed,
E = a U + b M + c R + d T
where U is landscape disturbance; M, R, and T are mining, settlement and road disturbances, respectively, and a, b, c, d are weights (of 0.4, 0.3, 0.2, and 0.1, respectively) assigned to each disturbance parameter such that a + b + c + d = 1.
Mining, settlement, and road disturbances (M, R, and T) are calculated using the “Buffer Analysis” modules in ArcGIS 10.0. Based on the characteristics of the disturbance and the decreasing relationship between the magnitude of influence of the disturbance and distance from its source, where different buffers are set to measure the influence of different disturbances (Table 1). On the other hand, the influence of mines and settlements are assigned maximum values in area where they overlapped, and the influence of roads is assigned summation due to its additive effects. Depending on the intensity of human activities, different landscapes are assigned different levels to quantify the influence of human activities on landscape disturbance. These levels are as follows: unused (0.2), natural renewable (woodland, grassland, water body, and wetland; 0.4), half natural renewable (cropland, and garden; 0.6), and artificial non-renewable (built-up; 0.8).
Table 1. Influence values of various disturbances based on the size of the disturbance and the distance from the disturbance source.
DisturbanceMiningSettlementRoad
LevelLarge mining (>10 ha)Medium mining (1–10 ha)Small mining (<1 ha)CityDesignated TownRural settlementNational roadProvincial roadCounty roadHighways & railways
Number of Buffer4322223322
Distance/meter (influence value)300(0.8)
600(0.6)
1000(0.4)
2000(0.2)
300(0.6)
600(0.4)
1000(0.2)
300(0.4)
600(0.2)
600(0.8)
1200(0.4)
400(0.6)
1000(0.3)
200(0.4)
500(0.1)
50(0.8)
250(0.5)
500(0.1)
50(0.7)
100(0.5)
500(0.1)
50(0.6)
100(0.1)
30(0.5)
50(0.1)

2.2.2. Ecological Vulnerability

Ecological vulnerability (V), an integral part of ecological risk assessment, refers mainly to the vulnerability of ecosystems to the strong external disturbance [39], and is a function of vulnerability of landscape type, and vulnerability of landscape structure. Ecological vulnerability of landscape type denotes the probability of the landscapes to deviate from their steady states, or suffer enormous damage from outside interference. Landscapes are classified into seven kinds and given different weights: unused land (7), wetland (6), water body (5), cropland (4), garden (3), grassland (2) and woodland (1), then normalized, and finally multiplied by the area ratio of that type of landscape to the surrounding landscape, to obtain the ecological vulnerability of landscape types.
Based on the pattern-process feedback mechanism, in landscape ecology, landscape patterns can also affect ecological vulnerability, and thereby, landscape ecological risk. As an intrinsic attribute of ecosystems, ecological vulnerability is closely related to ecosystem sensitivity, resilience, and stability [40]. Ecosystem sensitivity refers to the ecosystem’s internal adaptive capacity to external pressure or external interference; ecosystem resilience is its ability to recover from these interferences; and ecosystem stability represent the ability to maintain the normal dynamic ecological system. Different landscape types, with different sensitivity and resilience, may play different roles in maintaining biodiversity, protecting species, improving landscape structure, and promoting the overall functioning of the landscape [41]. In this study, such two indicators as landscape fragmentation and area ratio of various landscapes whose slope is greater than 15°, are used to measure ecological sensitivity. The fragmentation of a landscape by natural or human factors is a consequence of changes in landscape patterns, from a continuous structure to patches, and more fragmented landscapes with greater slopes are assumed to be more ecologically sensitive. Ecological resilience, assumed to be positively related to landscape connectivity (the degree to which the landscape facilitates or impedes movement among resource patches), and landscape dominance (the degree to which one or a few land cover types predominate the landscape in terms of area proportion), is calculated as a function of these terms based on the formula described by Wu et al. [31]; weights were assigned using the “Analytic Hierarchy Process” in Matlab R2010a (Table 2).
Table 2. Indicators system for structural vulnerability evaluation.
WoodlandGrasslandCroplandGardenWater BodyWetlandUnused Land
Ecological sensitivityLandscape fragmentation0.90010.72860.98210.48640.95180.89360.4563
Area ratio (slope > 15°)0.09990.27140.01790.51360.04820.10640.5437
Ecological resilienceLandscape connectivity0.93590.23090.97680.31650.29510.28970.2500
Landscape dominancy0.06410.76910.02320.68350.70490.71030.7500
Finally, ecological vulnerability (V) is calculated based on the following model:
V j = i = 1 7 k i j × L j = i = 1 7 k i j × F i j C i j
where i is landscape type, j is basin unit, k is ecological vulnerability of landscape type, L is structural vulnerability, F is ecological sensitivity, and C is ecological resilience.

2.2.3. Ecological Importance

Ecological importance refers, fundamentally, to the intrinsic value of an ecosystem. Thus, the greater the ecological importance of a landscape (as measured by the importance of various constituent landscapes or units in the region), the greater the ecological loss associated with adverse impacts on it. In this study, the value of ecosystem services is used as a measure of ecological importance, as suggested by Costanza et al. [42] and Xie et al. [43].
Ecosystem services are vital functions of the life-support system [44]. They contribute to human welfare, both directly and indirectly, and therefore represent a portion of the total economic value of the planet [42]. Ecosystem services value is the product of interactions between nature and humans, and is directly affected by human activities via changes in landscape patterns [45]. It is also closely related to the spatial distribution of landscape, whose impact may be negative. Landscape fragmentation is a driver of biodiversity loss [46,47]. Increase in fragmentation, implying corresponding increases in patches, leads to reduction in ecosystem services, and therefore decrease in ecosystem services value. In this study, landscape fragmentation is incorporated into the calculation of the ecosystem service value of each watershed, and ecological importance (S) is modeled as follows:
S j = i = 1 7 V i × A i j / A j = i = 1 7 V i F i j / F i × A i j / A j
where i is type of landscape, j is the assessing unit, Vi is the ecosystem services value of the original ecosystems, Vi is the ecosystem services value after fragmentation disturbance, Fij is the landscape fragmentation of type i in watershed j, Fi is the fragmentation of landscape type i in the whole study area, Aij is the area of type i in watershed j, and Aj is the total area of watershed j.

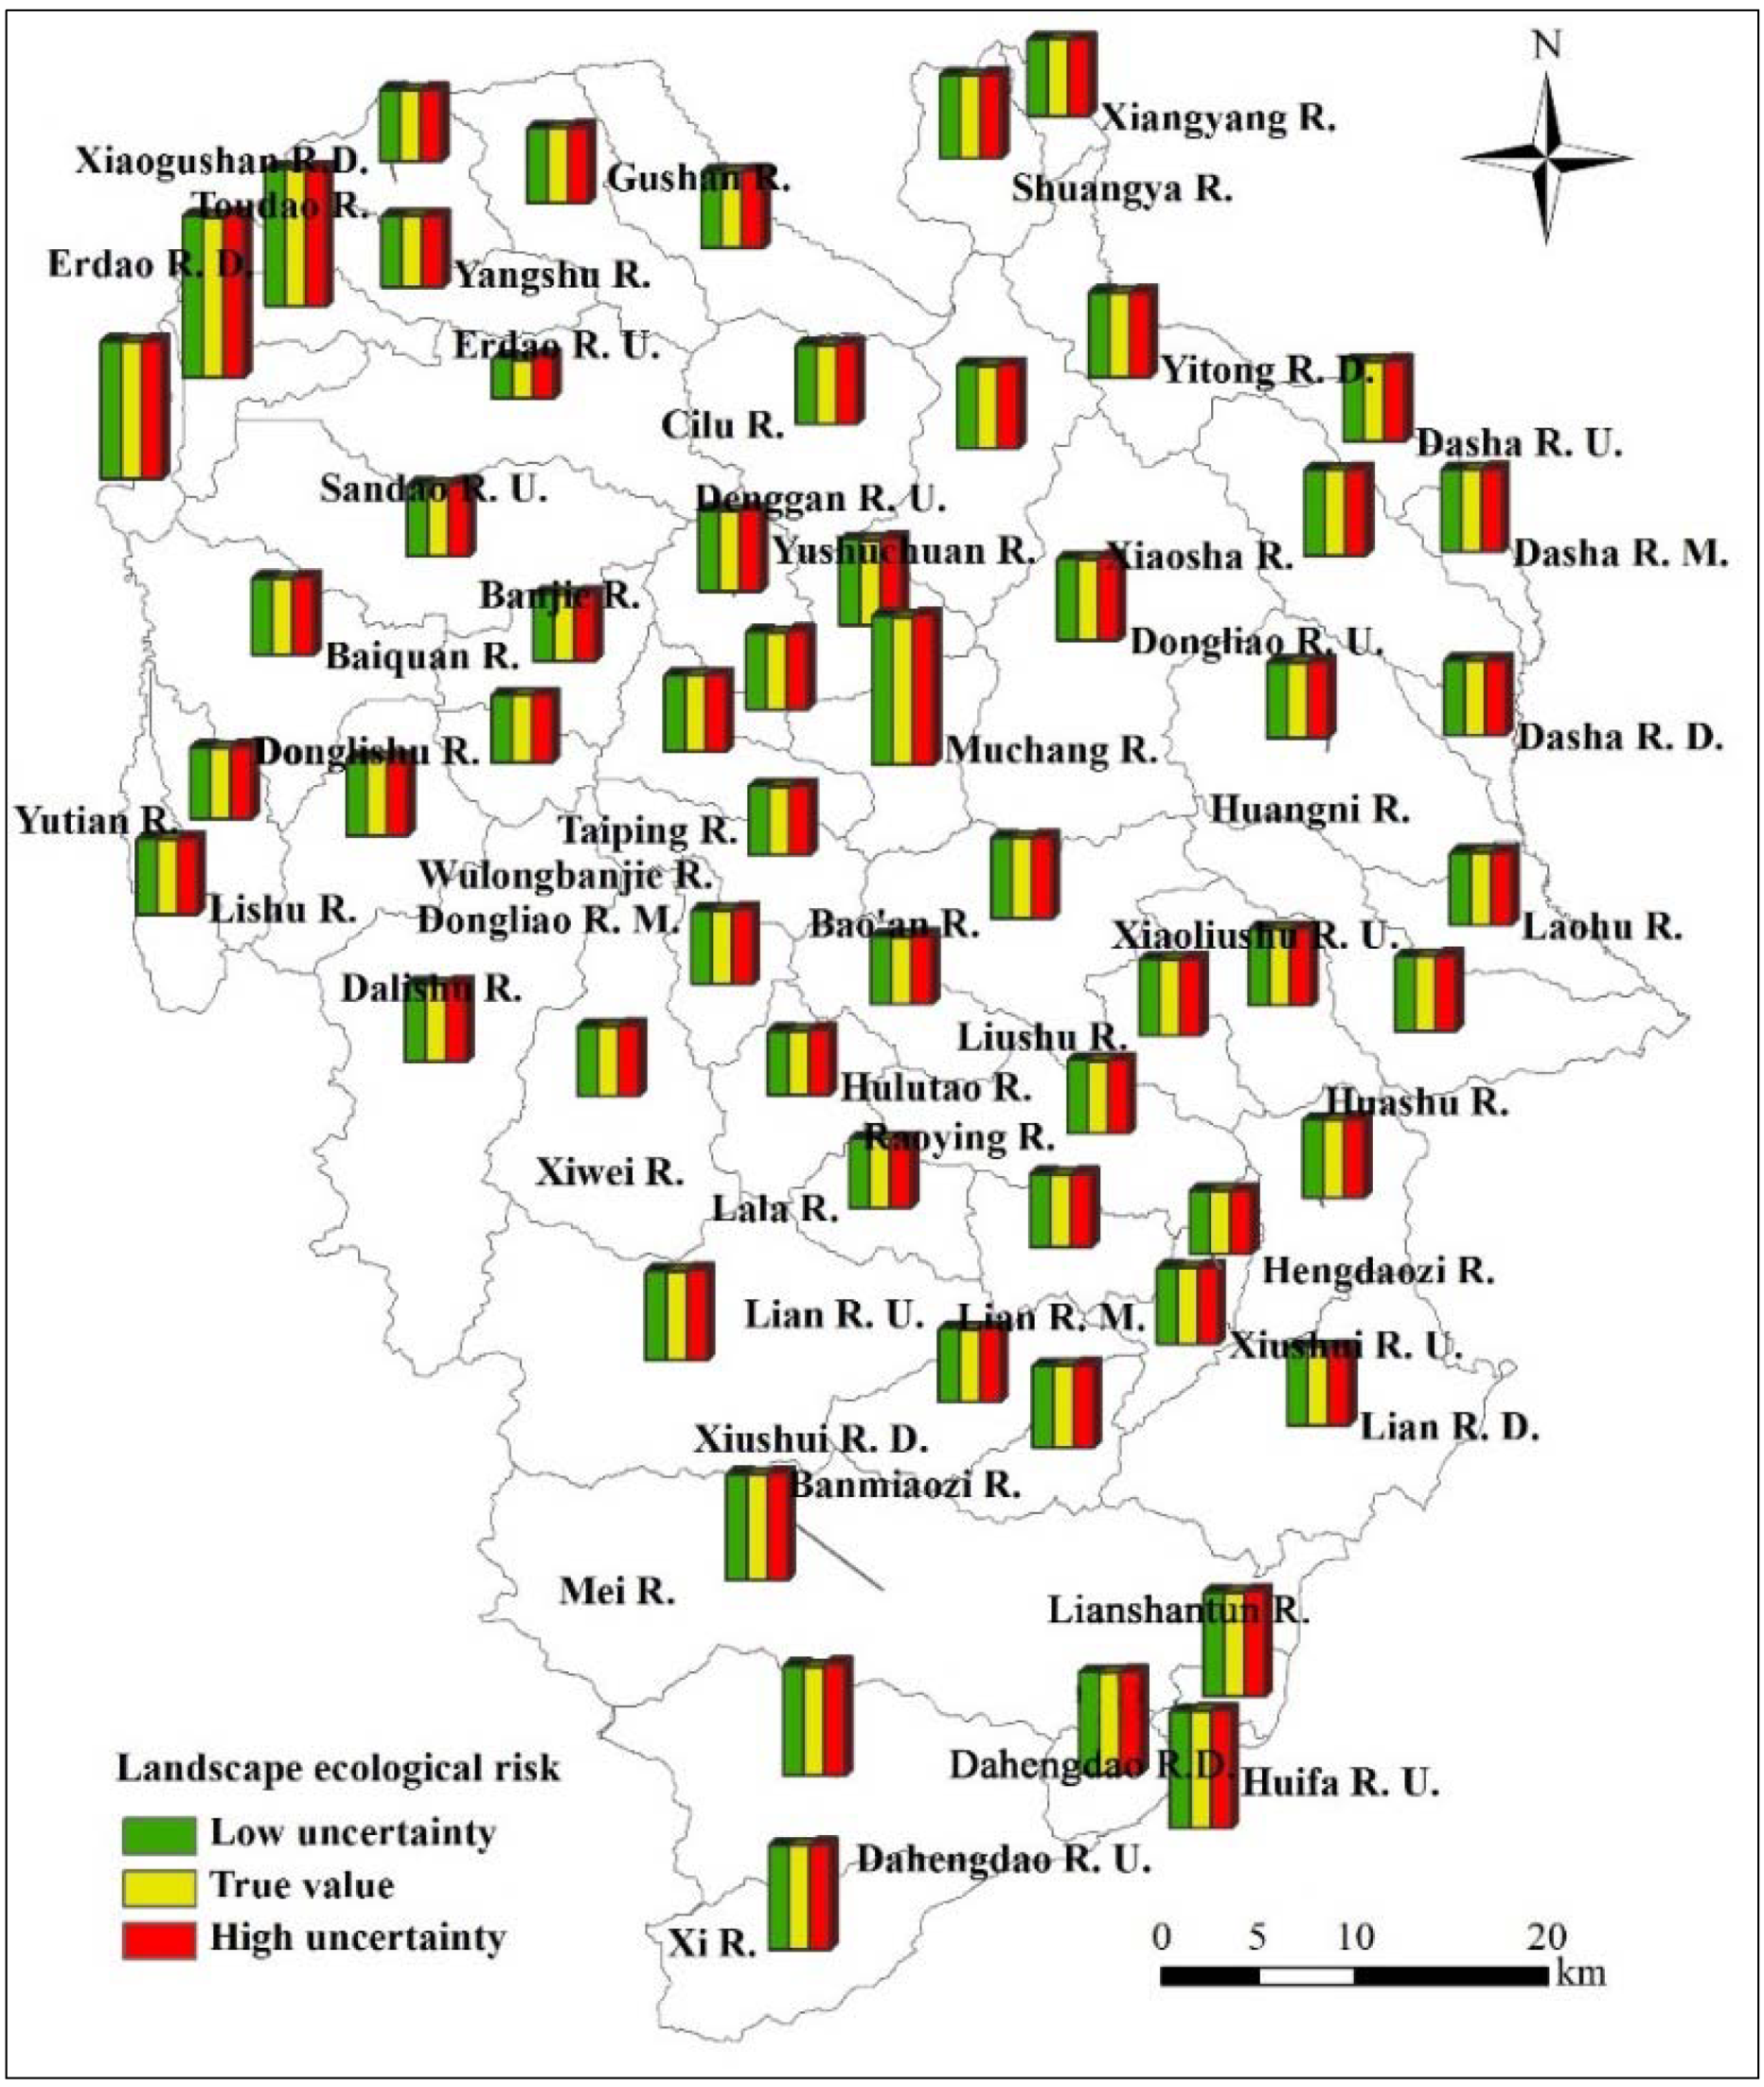
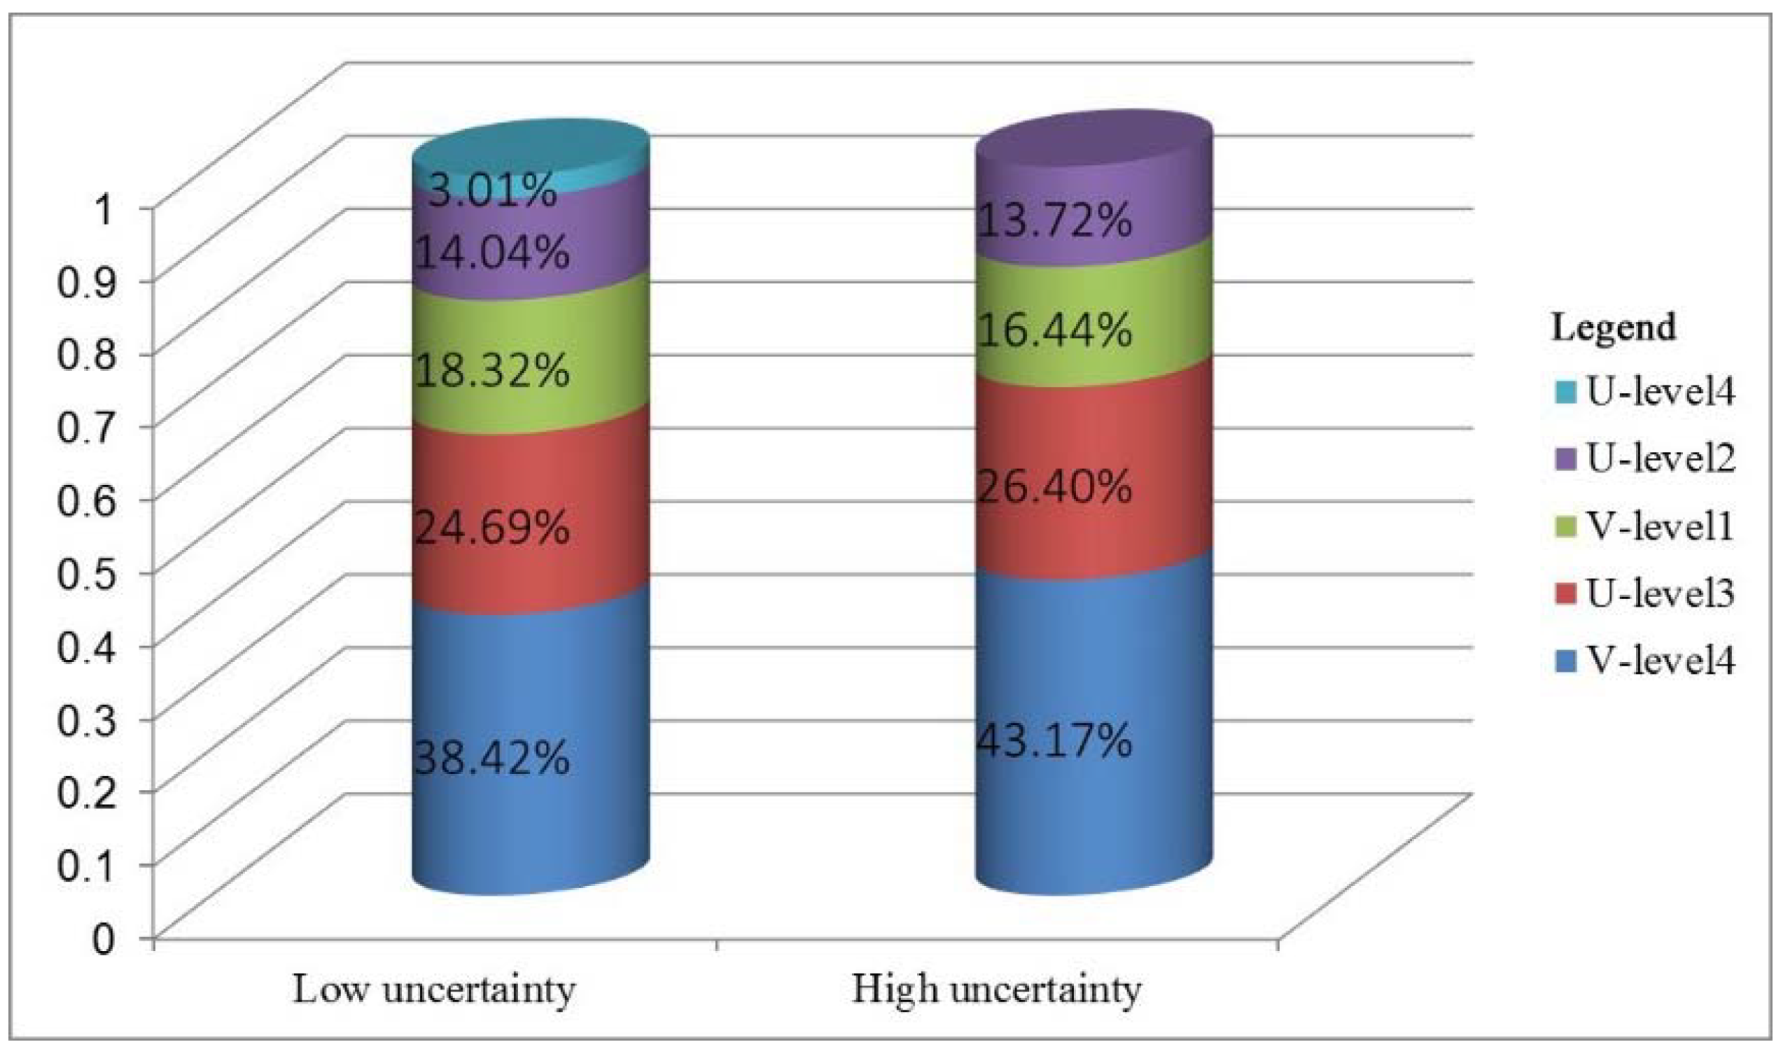
2.3. Monte Carlo Analysis of Assessment Uncertainty

Uncertainty, in the form of incomplete information and data, and diversity of risk sources, is inevitable in ecological risk assessment. As a part of results of probabilistic uncertainty analysis, sensitive analysis reflects dynamic disturbance of the evaluation results of each parameter [48]. It judges the impact of each parameter by its correlation with evaluation results. If the correlation is high, the parameter has great influence on the result and it is sensitive. Especially for a multi parameter model, sensitive analysis can identify the parameters with higher influence on the evaluation results, so that in the further analysis, we can take effective measures to reduce the uncertainty.
In order to make the results more robust, it is necessary to carry out uncertainty analyses using Monte Carlo methods, which explores the uncertainty associated with the ecological risk assessment process, and its possible impact on results. Based on a Monte Carlo analysis, uncertainty arising from land use classification assignments, and their associated ecological vulnerability, are explored using the program Crystal ball 11.1.2.2.000. Specifically, the simulation computing sets two possible uncertainty distributions (low 20%, high 40%), and carries out 10,000 simulative iterations to calculate the simulated value (Table 3 and Table 4). Outliers are excluded by working within a 95% confidence interval; i.e., simulation results above the maximum 2.5%, and minimum 2.5% were excluded before the final simulated value is calculated.
Table 3. Probability distribution of land use degree under low (20%)/high (40%) uncertainty scenarios.
Land USE degreePossible Land Use Degree
Level-1 (0.2)Level-2 (0.4)Level-3 (0.6)Level-4 (0.8)
Level-1 (0.2)0.8/0.60.2/0.40/00/0
Level-2 (0.4)0.1/0.20.8/0.60.1/0.20/0
Level-3 (0.6)0/00.1/0.20.8/0.60.1/0.2
Level-4 (0.8)0/00/00.2/0.40.8/0.6
Table 4. Probability distribution of landscape ecological vulnerability under low (20%)/high (40%) uncertainty scenarios.
Vulnerability of Landscape Types Possible Vulnerability of Landscape Types
Level-1 (0.0357)Level-2 (0.0714)Level-3 (0.1429)Level-4 (0.1071)Level-5 (0.1786)Level-6 (0.2143)Level-7 (0.2500)
Level-1 (0.0357)0.8/0.60.2/0.40/00/00/00/00/0
Level-2 (0.0714)0.1/0.20.8/0.60.1/0.20/00/00/00/0
Level-3 (0.1429)0/00.1/0.20.8/0.60.1/0.20/00/00/0
Level-4 (0.1071)0/00/00.1/0.20.8/0.60.1/0.20/00/0
Level-5 (0.1786)0/00/00/00.1/0.20.8/0.60.1/0.20/0
Level-6 (0.2143)0/00/00/00/00.1/0.20.8/0.60.1/0.2
Level-7 (0.2500)0/00/00/00/00/00.2/0.40.8/0.6
Setting Table 3 as an example, we define that the uncertain values should be attributed to the adjacent class. On one hand, the low (20%) uncertainty means 80% of the values is unchanged, while the other 20% should change the class. Namely in Level-1, 80% is still in Level-1, 20% will change to the adjacent Level-2. On the other hand, the high (40%) uncertainty means 60% of the values is unchanged, while the other 40% should change the class. Namely in Level-2, 60% is still in Level-2, and 40% will change to the adjacent class, where the proportion of adjacent Level-1 and Level-3 should either be 20%, respectively.

3. Results

3.1. Probability of Landscape Ecological Risk

Based on the data of Liaoyuan City, maps showing the spatial distribution of the four types of disturbances—landscape, mining, settlement, and road—are generated (Figure 3). The distribution of ecological disturbances in each watershed (Figure 4), shows that, of the 58 watersheds included in the study, the Banjie River, Donglishu River, and Xiaoliushu River Downstream watersheds have the highest ecological disturbance, and the Dahengdao River Upstream, Dasha River Midstream, and Dasha River Upstream watersheds, have the lowest ecological disturbance. Whereas, in general, ecological disturbance is strongly positively correlated with urbanization and human activities, and in those areas with high ecological disturbances, mines, settlements and roads all strongly influence the landscape types and land uses. In addition, ecological disturbance is significantly correlated with population density (R = 0.76); watersheds with high population densities, have high ecological disturbances. For example, in the Banjie River Watershed, where population density is 2657 person/km2, ecological disturbance is 0.4608; whereas in the Muchang River Watershed, where population density is 78 person/km2, ecological disturbance is 0.2573.
Ecological vulnerability across watersheds (Figure 4) reveals that the Muchang River Watershed has the highest vulnerability, with Erdao River Upstream Watershed for the lowest. Located in the north-central part of the Liaoyuan City, the Muchang River Watershed has the largest reservoir in the study area and is surrounded by mountains, and other landscapes, which isolate it from the surrounding landscapes. Its high landscape topographic index and low landscape connectivity, are likely responsible for its high ecological vulnerability. On the contrary, Erdao River Upstream Watershed, located in northwest Liaoyuan, is a low-lying area with unbroken rivers, large and centrally located croplands, and woodland cover along the river, mainly adjoined by croplands. Spatially, ecological vulnerability increases substantially from the middle to the edges, where the peak appears in the middle, and the higher areas concentrated in the southeast. It is worth noting that regions in relatively flat terrain have high ecological vulnerability, those located in mountainous areas have intermediate levels of vulnerability, and regions located in transitional zones between mountains and plains have the lowest ecological vulnerability.
Ecological risk probability, which is calculated based on ecological disturbance and ecological vulnerability, regardless of ecological losses, is mapped at three levels (low, moderate, and high), for the 58 watersheds (Figure 5). The Banjie River and Xiaoliushu River Downstream watersheds have the highest ecological risk probability, while the low-probability regions, such as the Mei River and Xiaosha River watersheds, mostly concentrated in the southwest, west, northeast and north of Liaoyuan. The overall ecological vulnerability of mountains falls within the moderate and low levels. In summary, the ecological risk probability of mountains (low mountains, hills, and terraces) is lower than that of relatively flat areas.
Figure 3. Spatial distribution of four types of disturbance: (a) Landscape disturbance; (b) Mining disturbance; (c) Settlement disturbance; (d) Road disturbance.
Sustainability 07 08312 g003
Figure 4. Ecological disturbance and vulnerability of watersheds in Liaoyuan City, China.
Sustainability 07 08312 g004
Figure 5. Landscape ecological risk probability and ecological loss in Liaoyuan City, China.
Sustainability 07 08312 g005

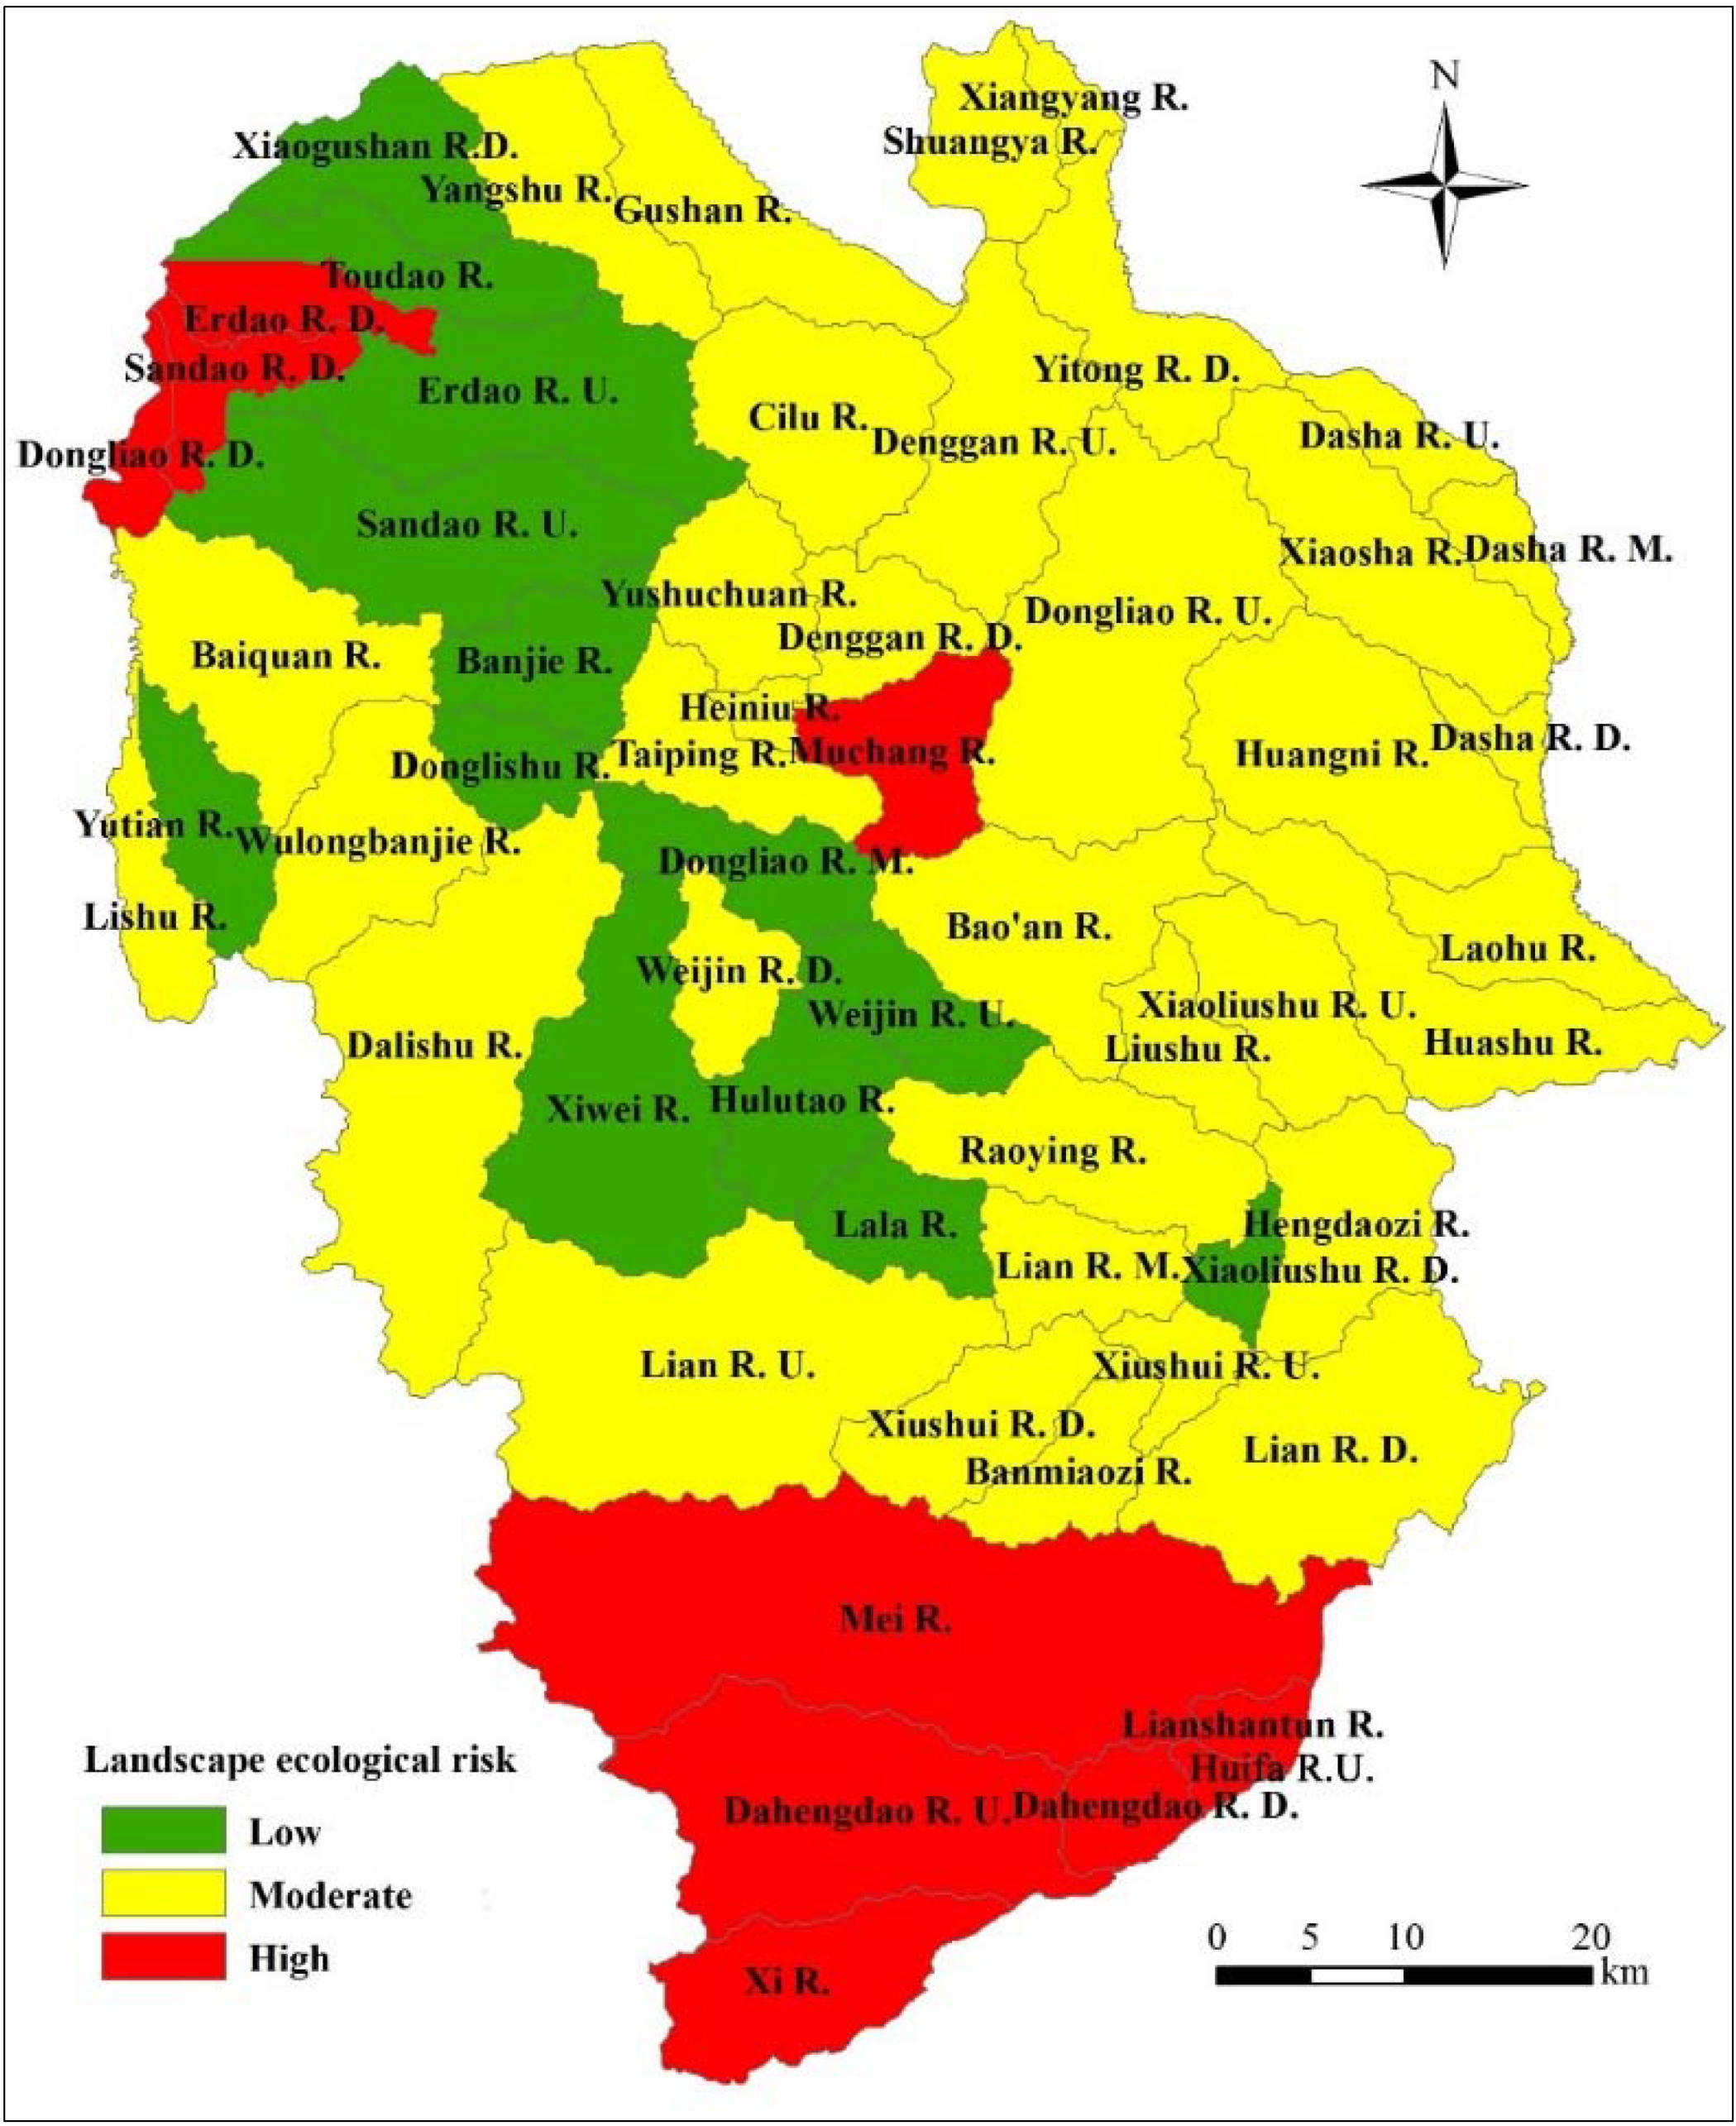
3.2. Ecological Loss and Landscape Ecological Risk

A map of the ecological importance and thus the ecological loss due to landscape ecological risk for 58 watersheds, divided into three levels (high, moderate, low; Figure 5), reveals significant spatial differences across the Liaoyuan City. Sandao River Downstream, Dongliao River Downstream, and Erdao River Downstream watersheds have the highest ecological importance, and Xiaoliushu River Downstream, Banjie River and Donglishu River watersheds, have the lowest ecological importance. The top three most important watersheds are adjacent to one another, and located in the northwest of Liaoyuan, and have a high proportion of little fragmented water bodies, which play an important role in ecosystem services in the watershed. These watersheds also have low proportions of built-up land and cropland, and large proportions of woodland resulting in over 95% of the area of these watersheds consisting of natural and semi-natural landscapes.
The three “lowest loss” watersheds all have experienced high urbanization. Due to urban sprawl, natural and semi- natural landscapes are being continuously converted to built-up land. Consequently, the proportion of construction land in these watersheds is higher than that in others, and resulting in the decline of ecosystem services, and thus their ecological importance. Overall, the ecological importance of watersheds with superior natural resources endowment is higher than that of the watersheds with construction land expansion. That is to say, human activities have a negative impact on the ecological importance of watersheds.
Ecological risk, calculated based on landscape ecological risk probability, and ecological loss, mapped for the watersheds of Liaoyuan City (Figure 6), shows that, except for the Muchang River Watershed, regions with high ecological risk (e.g., Dahengdao River Upstream, Mei River, and Xi River watersheds) are concentrated in northwestern and southern Liaoyuan, whereas regions with low ecological risk (e.g., Lala River, Xiwei River, and Banjie River watersheds) are along the southeast-northwest direction. What is more, cities and counties almost belong to low ecological risk areas, which is due to the natural/semi-natural landscapes, as the object of study, have low ecological loss in these areas. Regions with medium ecological risk constitute the majority of the study area, and are concentrated in the northeast, east, and the west.
Figure 6. Landscape ecological risk of watersheds in Liaoyuan City, China.
Sustainability 07 08312 g006

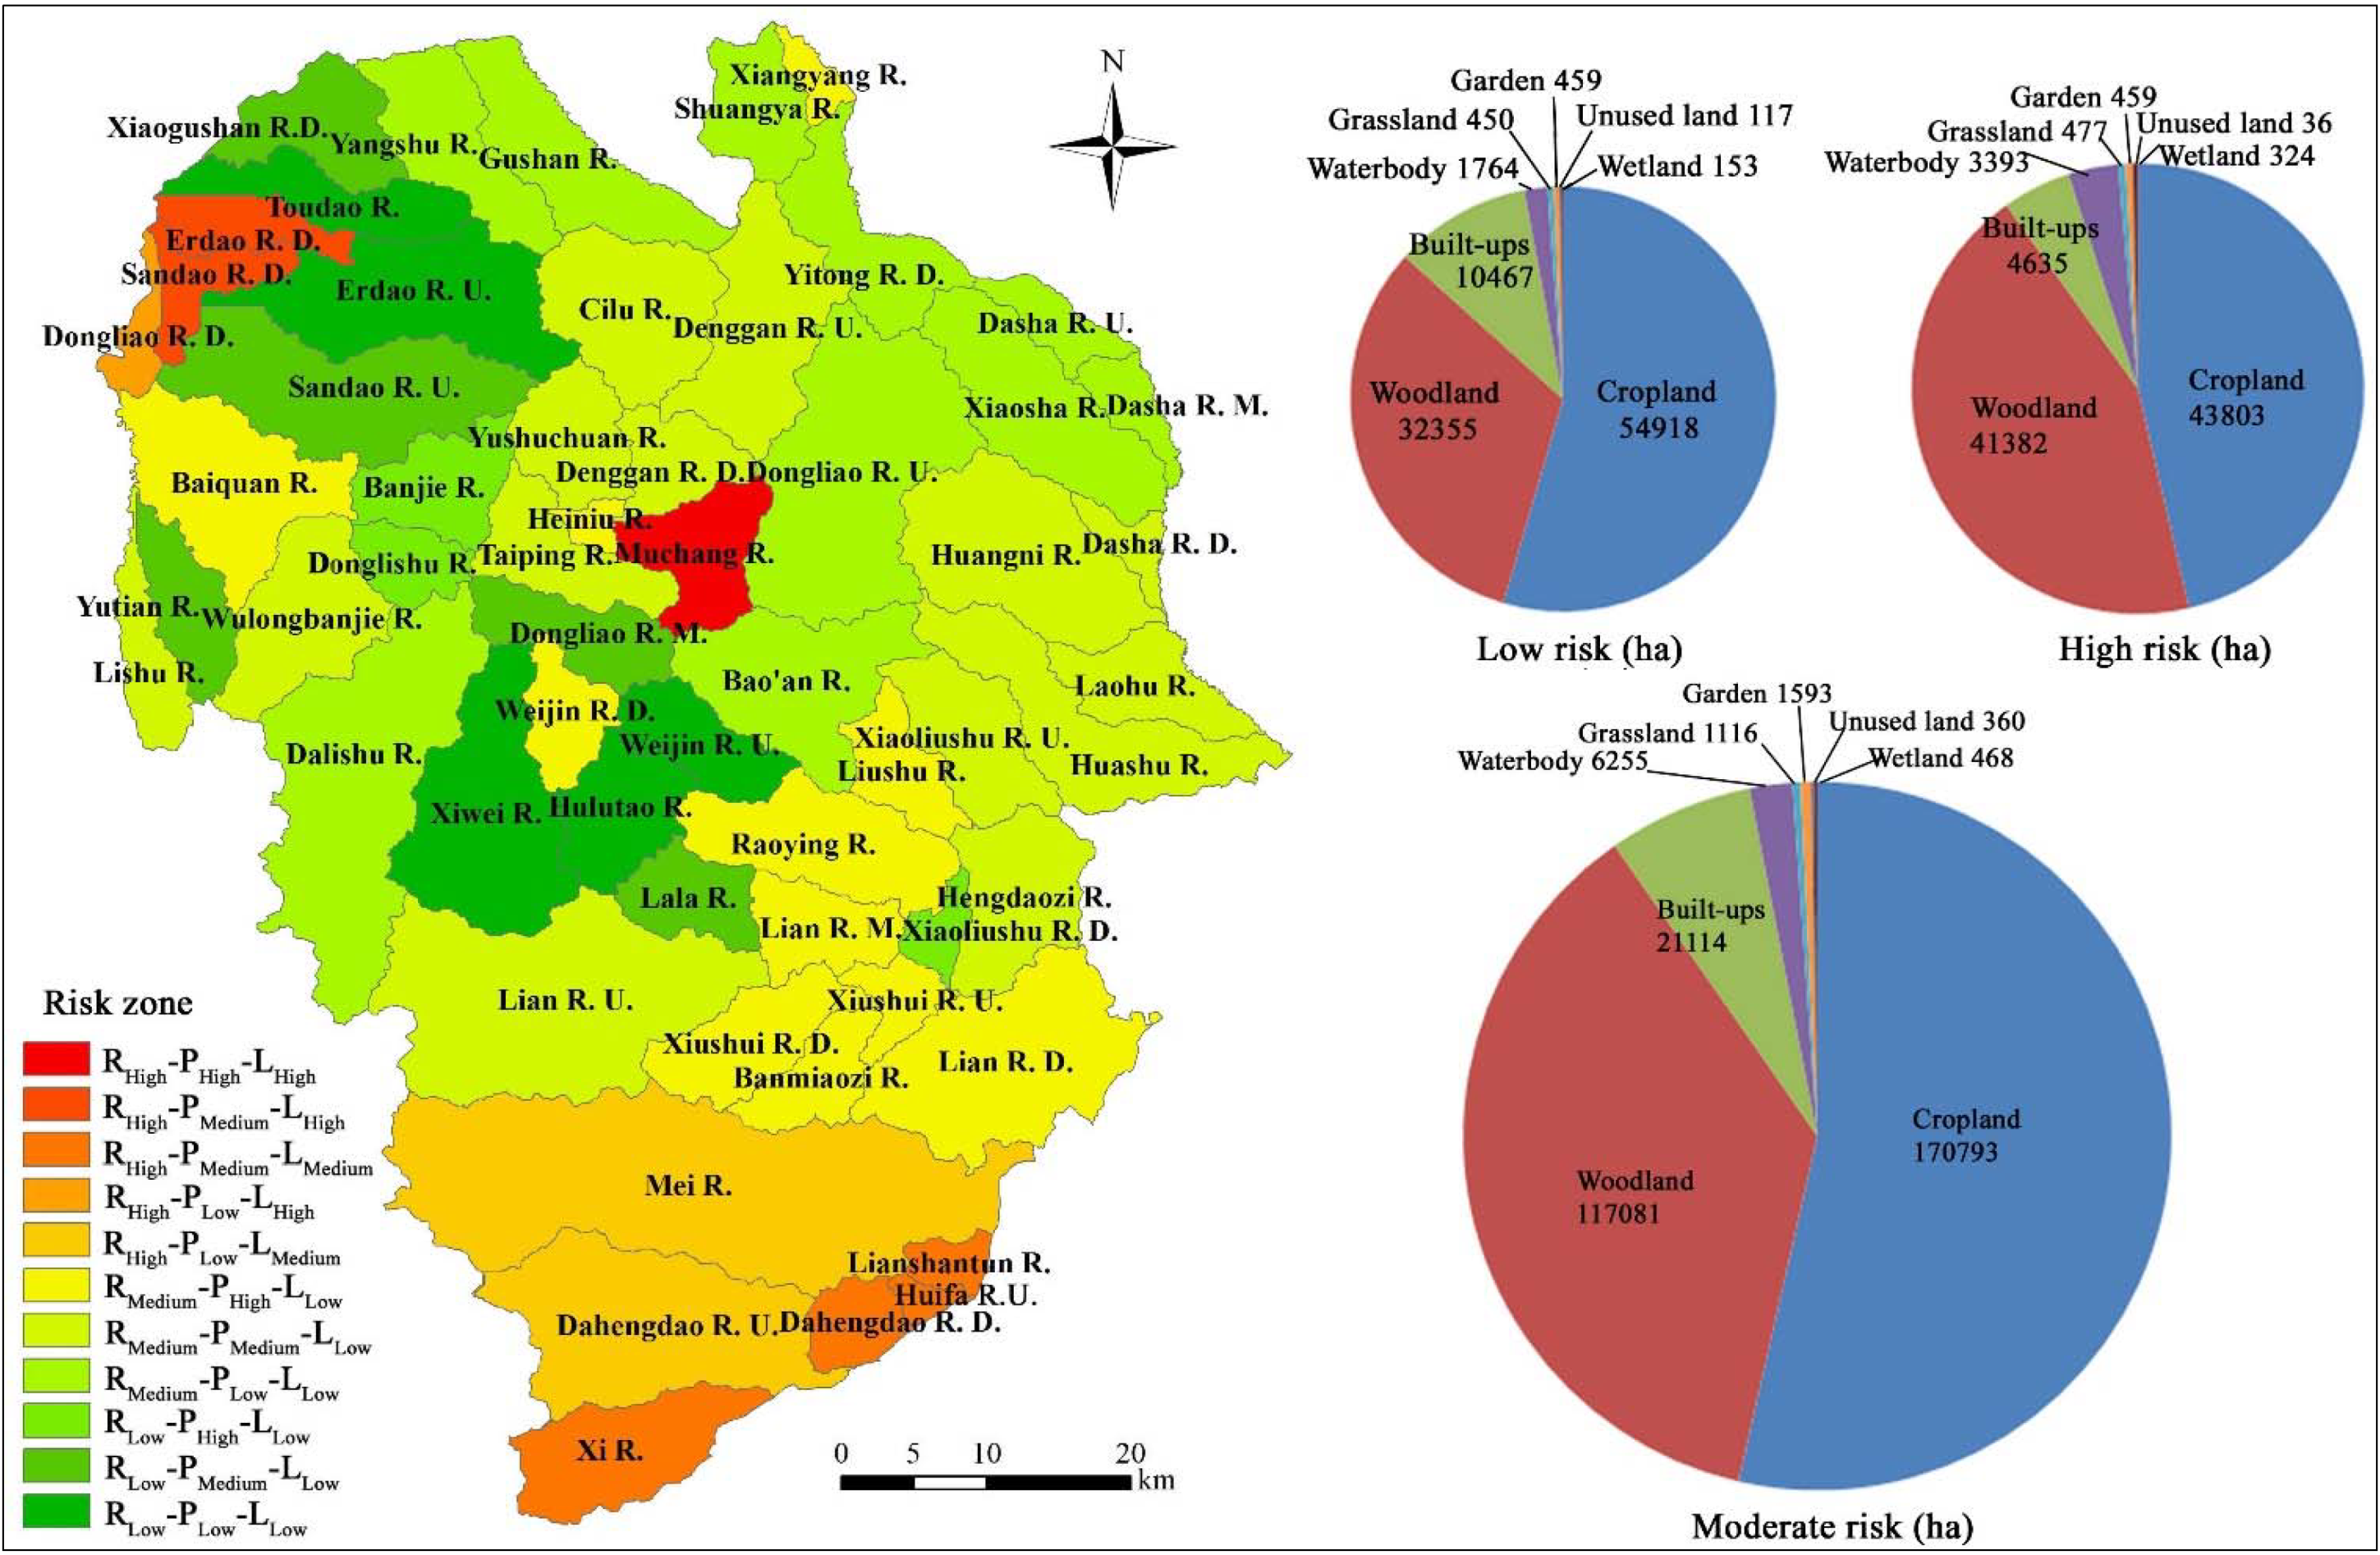
3.3. Zoning of Landscape Ecological Risk

The results of our zoning (Figure 7) show that 10 watersheds face high ecological risk, 35 watersheds face moderate risk, and 13 watersheds are at low risk. Each of these risk classes is addressed as follows: (1) High-risk areas can be divided into five types, accounting for 18.39% of the total area. These areas are mainly concentrated in watersheds where there are large water bodies, high coverage of grassland and woodland (Figure 7), such as Muchang River, Mei River and Dahengdao River watersheds. The ecosystem services offered by water, woodland and grassland and other landscapes, such as water conservation, windbreak and sand-fixation, and biodiversity conservation, have important significance for regional eco-environment. Thus, it is important to keep maintaining and strengthening the protection of woodland, grassland through reforestation; (2) Moderate-risk area includes three types, accounting for 62.02% of the total area. In these areas, the area ratio of cropland is larger than that in high-risk areas. Cropland is a semi-natural and man-made landscape which is vulnerable to human activities. During the long winter in the Northeast China, as the fallow period is long, cropland may be frequently destroyed by human activities and weather disasters. Therefore, it is necessary to strengthen the management of cropland and prevent soil erosion; (3) Low-risk area comprises three types, mainly in relatively flat terrain in the northwestern, accounting for 19.59% of the total area. The area ratio of built-ups in these areas is higher than the other two, while the area ratio of natural and semi-natural landscape is the lowest, as it is deeply influenced by human activities.
Figure 7. Landscape ecological risk zoning and total area of land use types in each grade of landscape ecological risk in Liaoyuan City, China (Note: R means ecological risk, P means ecological risk probability, and L means ecological loss).
Sustainability 07 08312 g007

4. Discussion

4.1. Implications of Assessment Results of Landscape Ecological Risk

In the view of ecological risk probability, the high probability may be accounted for by the fact that these watersheds are relatively flat, and adjoin the city and county centers (which are suitable for human habitation, and have higher human disturbances than other areas). The low-probability regions are exposed to the lowest amount of human activity. However, although human interference in mountainous regions is lower, the ecological sensitivity of these regions is high due to the effects of terrain and slope. Nevertheless, the high or complete vegetation coverage of mountainous lands results in high ecological resilience, such that the overall ecological vulnerability of mountains falls within the moderate or low levels. This phenomenon results in a relatively high ecological risk probability in flat areas.
In the view of landscape ecological risk, the areas with high urbanization are faced with lower risk than rural areas with good ecological conditions, a pattern that is consistent with the findings of Guo et al. for Beijing [49]. Despite this, we recommend that that watersheds with low ecological risk should not be damaged, but rather their protection must be strengthened, and attention should be paid to the reduction in their extant, albeit low, levels of risk. In the zoning of landscape ecological risk, the internal city and the surroundings are of high possibility to be transformed into built-ups due to urbanization. Therefore, the planning and construction of these areas should pay more attention to protecting the integrity and connectivity of natural and semi-natural landscapes, and changing the growth mode to the approach of sustainable development.

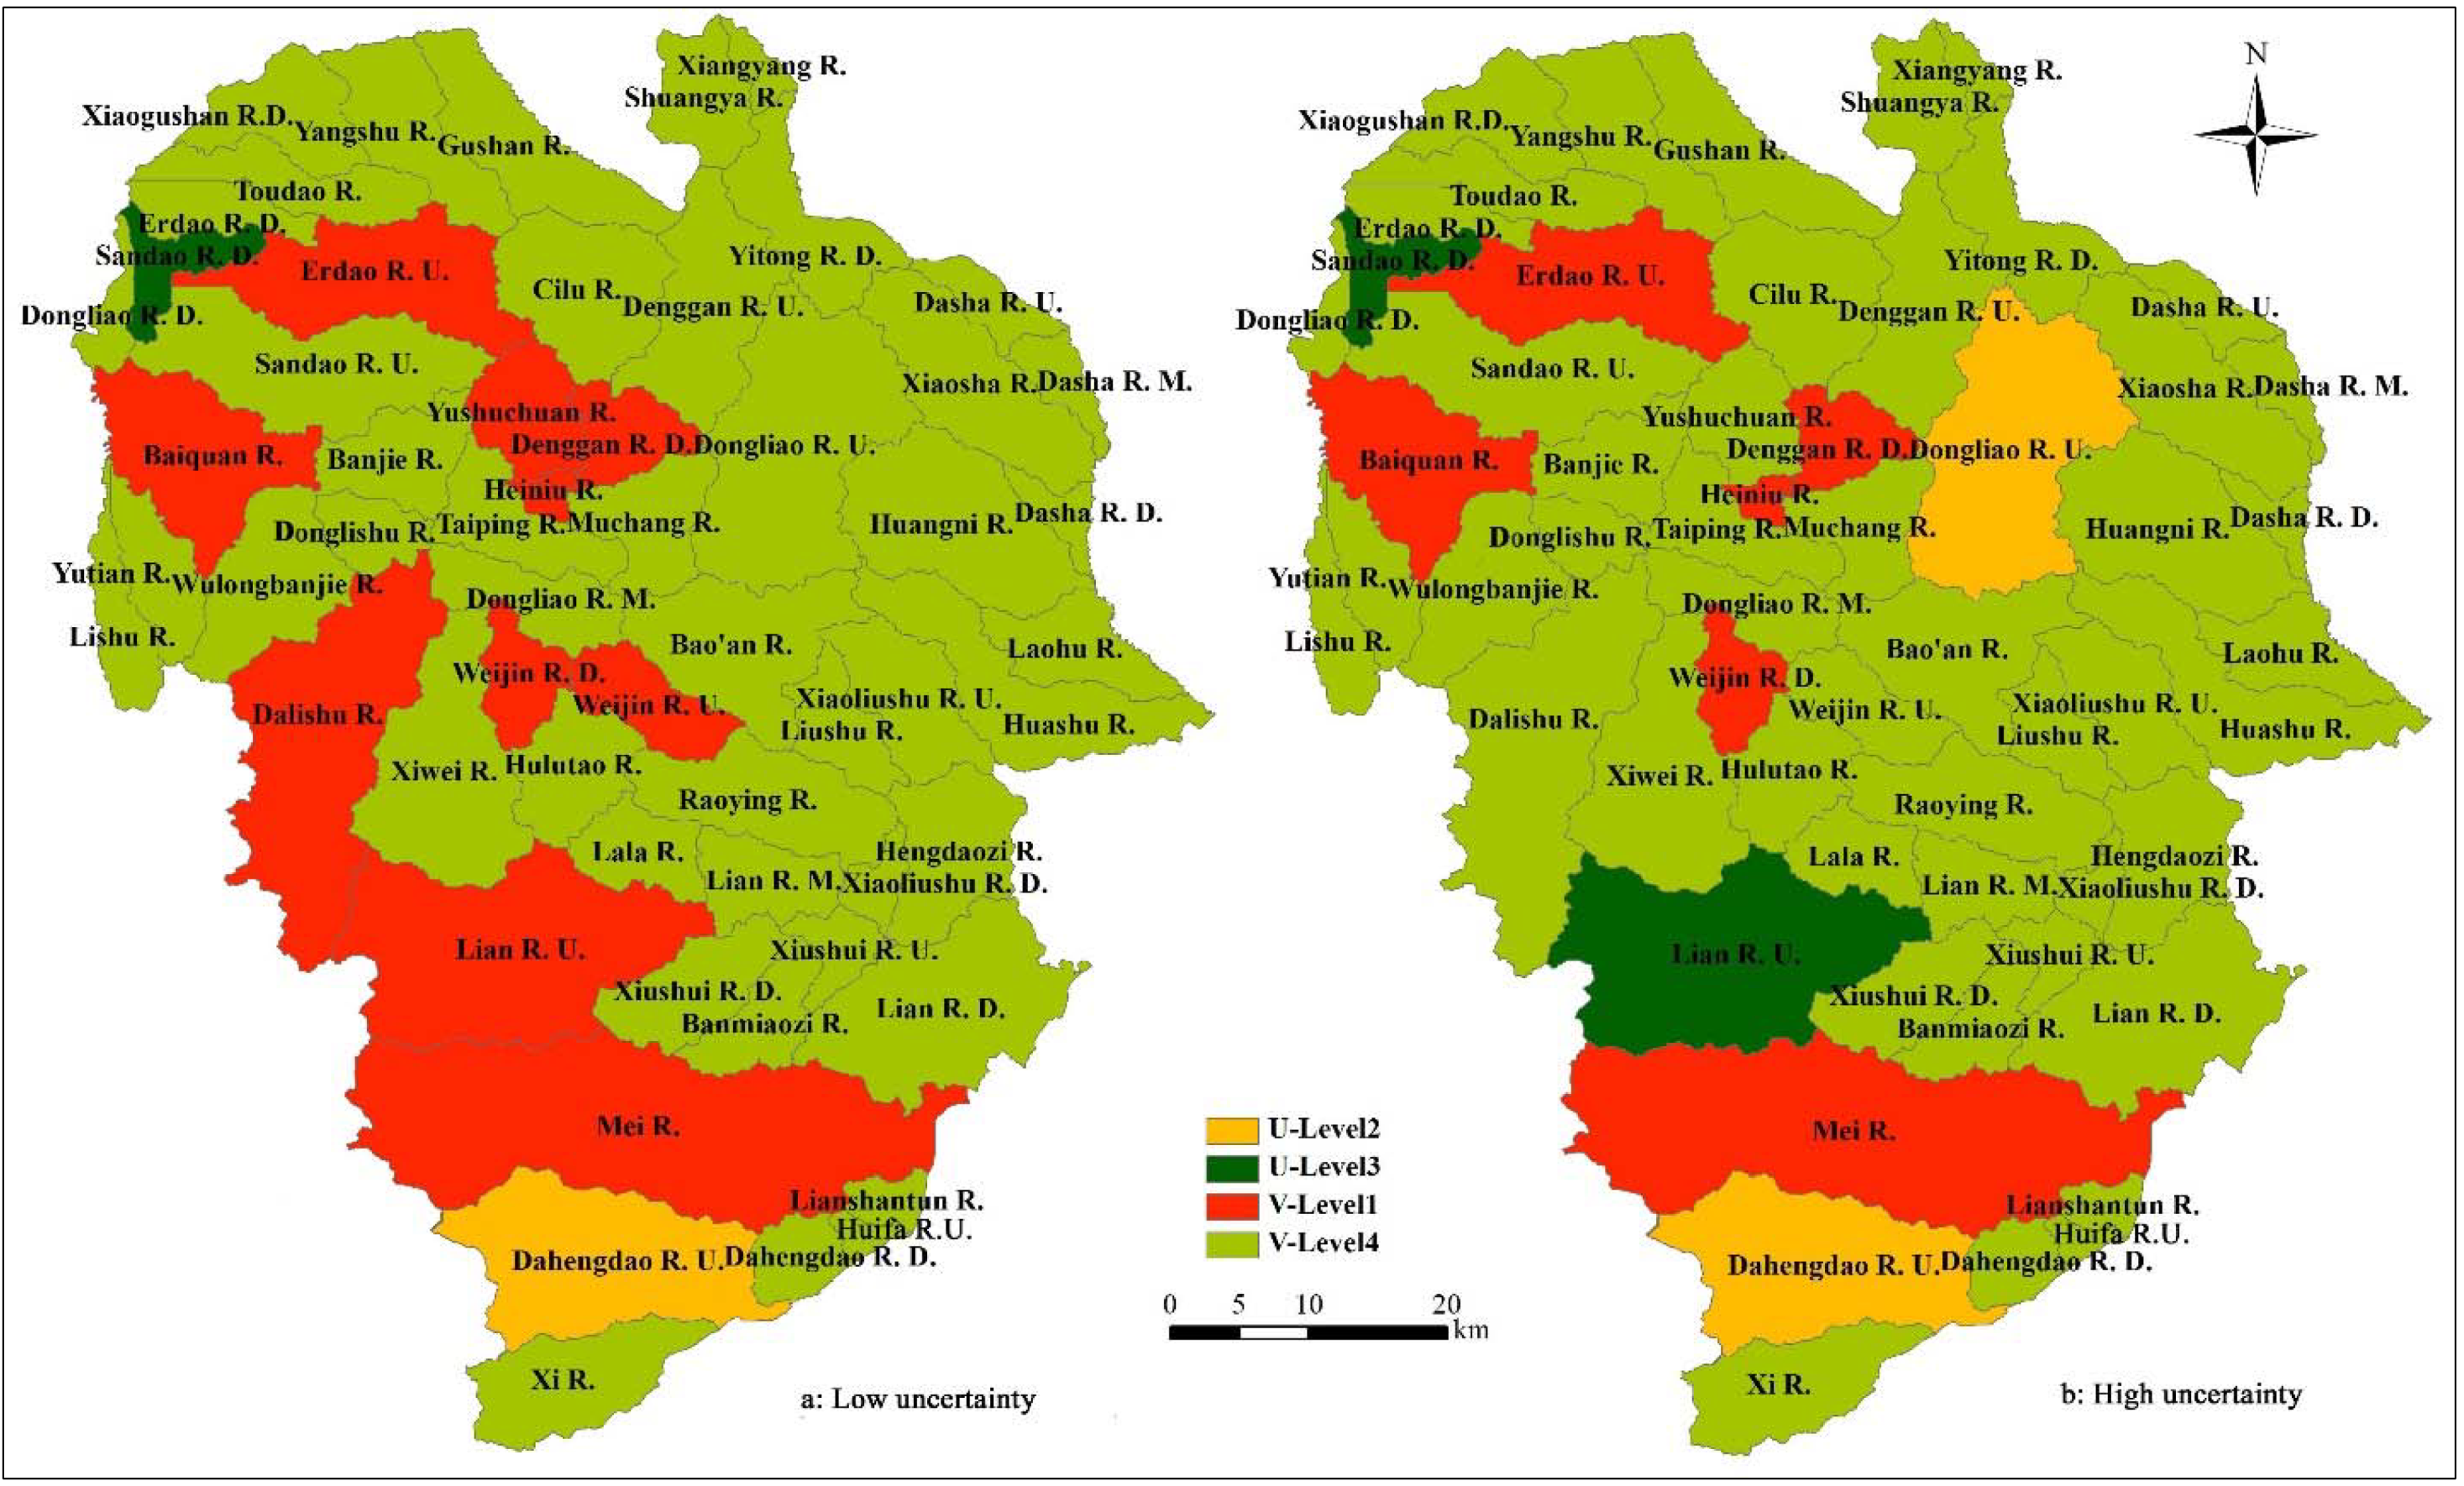
4.2. Uncertainty of Landscape Ecological Risk Assessment

The results of the Monte Carlo analysis (Figure 8) show that the simulated and calculated risk values are similar under both high uncertainty (40%) as well as low uncertainty (20%). This implies that the graded assignment of land use degree and vulnerability of landscape types, is reasonable, and the model is generally applicable in the study area. Whereas under low uncertainty, the ratio of simulated risk to calculated risk is concentrated between 0.99 and 1.05, while under high uncertainty it is concentrated between 0.99 and 1.1; exceptions are the Dasha River Downstream and Xiangyang River watersheds. Results under low uncertainty are slightly better than those under high uncertainty, suggesting that the reliability of calculation values is higher under low uncertainty, and the possibility of bias increases as uncertainty increases [50].
Moreover, under both uncertainties, the spatial distribution of simulated and calculated risk values, in the 58 watersheds, are essentially the same. Under low uncertainty, simulated values, in the east and north of the study area, are closer to calculated values, than they are in the west and southwest. Under high uncertainty, although results are more scattered, the difference between simulated and calculated risk values of the west and southwest is larger than that of the east and north. In general, simulated values under low uncertainty are more geographically concentrated than those under high uncertainty.
Sensitivity analysis, which is important for making recommendations for future monitoring and research, is conducted for two cases. The land use degree is divided into four levels (U-level), and the vulnerability of landscape type is divided into seven levels (V-level). The intervals are equidistant, and a higher level represents to a higher risk value. A variance contribution rate of 1% is set as the threshold in the sensitivity analysis, and under low uncertainty there are five major factors, with four under high uncertainty (Figure 9). Two additional factors, the sixth factor under low uncertainty (V-level 2; level 2 in vulnerability of landscape type), and the fifth factor under high uncertainty (U-level 4; level 4 in land use degree), have a combined variance contribution rate of 0.76%, less than the threshold.
Figure 8. Simulated landscape ecological risk under low or high uncertainty of watersheds in Liaoyuan City, China.
Sustainability 07 08312 g008
A variance contribution threshold of 85% results in four major factors (with the highest sensitivity) under low uncertainty, and three major factors under high uncertainty. This suggests that the most sensitive factors are similar, showing only slight differences between low and high uncertainty. For example, under high uncertainty, the variance contribution rate of V-level 4 is 43.17%, nearly 5% different from that under low uncertainty; other factors show only approximately 2% difference in variance contribution rates between low and high uncertainties. Under both uncertainty scenarios, U-level 3 has a lower average variance contribution rate (24.69% for low uncertainty, and 26.40% for high uncertainty) than V-level 4 (Figure 9). In addition, V-level 1, U-level 2, and U-level 3 all affect the simulated values to varying degrees. Overall, the impact of vulnerability of landscape type on simulated value is greater than that of land use degree. Considering that landscape types corresponding with V-level 4, V-level 1, and U-level 2 account for high area ratio in each watershed, it testifies that when grading assignments, ensuring which landscape types are most dominated in the watershed is essential for the accuracy of the simulated results.
Figure 9. Variance contribution rate of sensitive factors under low or high uncertainty.
Sustainability 07 08312 g009
Sensitivity analyses also shows that under high or low uncertainty, the most sensitive factors change in only five watersheds, i.e., Yushuchuan River, Dongliao River Upstream, Weijin River Upstream, Lian River Upstream, and Dalishu River watersheds (Figure 10). The most sensitive factors of over 90% of the watersheds are stable, indicating that the assignments of land use degree, and vulnerability of landscape types are reliable. From a regional perspective, in both uncertainty scenarios, the most sensitive factors change the most in the western region, such as Dalishu River and Lian River Upstream watersheds, whereas the factors are stable in the southern, northwestern, and eastern regions, implying that the assignments in these areas is the most reliable.
Figure 10. Most sensitive factors in assessing landscape ecological risk under low or high uncertainty of watersheds in Liaoyuan City, China.
Sustainability 07 08312 g010

5. Conclusions

Landscape ecological risk assessment is useful in representing landscape ecological security, which is a critical domain of landscape sustainability [50,51,52]. In the assessment process of this study, the higher landscape ecological risk means the more vulnerability and disturbance on the important landscape units relate to less benefit in the future. The result with high risk may suffer more damages in the future which threatens the sustainability of the landscape. Finally, a zoning to identify the spatial risk should be useful to prevent risks and support a sustainable landscape planning. In the former landscape ecological risk assessment studies, ecological disturbance and vulnerability have attracted much attention [53]. However, the concern for ecological importance is less than those two domains. In the study, on one hand, fragmentation of landscape has been introduced to modify the ecosystem services in the assessment of ecological importance, which is an improvement in the evaluation; on the other hand, the uncertainty of risk was often ignored in the former assessment, and the sensitivity analysis in this study may be a novelty in regional ecological risk study.
Mining areas are susceptible to damage through the economic development of mining cities, and the ecological risk posed by mining has gradually drawn increasing attention. Liaoyuan City, once the coal city of Jilin, is a typical mining city in that it has become a resource-exhausted city because of serious damage to its environment, caused by mining. In the mining process, the sustainability of landscapes is disturbed, and the specific ecological risks and uncertainties associated with this disturbance needs to be clarified. Our study of landscape ecological risk in Liaoyuan has found that areas with high probability of risk are mainly concentrated in the relatively flat terrain of the landscape. Not only cities, but also natural and semi-natural landscapes, contribute to ecological risk. Woodland and water dominated watersheds are high-risk areas, cropland-dominated watersheds are moderate-risk areas, and the watersheds with high proportion of built-up land are low-risk areas. Although the similarity of simulated and calculated values is higher under the low uncertainty scenario, in both scenarios, the spatial distribution of both sets of values among the watersheds are the same. Overall, vulnerability of landscape type has a higher impact on the simulated values than land use degree.
Landscape ecological risk assessment, based on the risk probability and ecological loss, directly guides the planning and restoration of landscapes by recognizing spatial structure, by contributing to regional risk management. One of the gaps in our study is that it is quantified through the relative value of ecological services for several landscape types within a watershed, rather than the calculation of an overall absolute value which may be compared among various regions. Another gap is the absence of information on how landscape patterns affect the per unit area value of ecosystem services. Thus, future research in the field of landscape sustainability needs to focus on quantifying landscape ecological risk in ecologically sensitive and fragile areas. It also needs to incorporate further robust analyses of uncertainty, which, although common in regional ecological risk assessment, is still relatively rare in the field of landscape ecological risk assessment. In addition, the directions for improving uncertainty analyses in landscape ecological risk assessment include: (1) analyzing multiple sources of uncertainty; (2) putting forward new methods that are particularly applicable for landscape ecological risk assessment [54]; (3) using a grid system to carry out evaluation at grid scale, in order to improve the accuracy of assessing results [55]; and (4) investigating more specifically the sensitivity of each parameter in the assessment model [56].

Acknowledgments

This research is financially supported by National Natural Science Foundation of China (41271195).

Author Contributions

Jian Peng, Minli Zong, and Jiansheng Wu conceived and designed the study. Jian Peng, Minli Zong, Yi'na Hu and Yanxu Liu made substantial contributions to acquisition, analysis, and interpretation of the data. Jian Peng and Minli Zong wrote the first draft of the article. Yi’na Hu and Yanxu Liu reviewed and edited the first draft. All authors read and approved the submitted manuscript, agreed to be listed, and accepted the version for publication.

Conflicts of Interest

The authors declare no conflict of interest.

References

  1. Wu, J.G. Landscape sustainability science: Ecosystem services and human well-being in changing landscapes. Landsc. Ecol. 2013, 28, 999–1023. [Google Scholar] [CrossRef]
  2. Peng, J.; Wu, J.S.; Pan, Y.J.; Han, Y.N. Evaluation for regional ecological sustainability based on PSR model: Conceptual framework. Prog. Geogr. 2012, 31, 933–940. (In Chinese) [Google Scholar]
  3. Xu, E.G.B.; Leung, K.M.Y.; Morton, B.; Lee, J.H.W. An integrated environmental risk assessment and management framework for enhancing the sustainability of marine protected areas: The Cape d’Aguilar Marine Reserve case study in Hong Kong. Sci. Total Environ. 2015, 505, 269–281. [Google Scholar] [CrossRef] [PubMed]
  4. Hunsaker, C.T.; Graham, R.L.; Suter, G.W.; O’Neill, B.L.; Jackson, B.L.; Barnthouse, L.W. Regional Ecological Risk Assessment: Theory and Demonstration; Oak Ridge National Lab: Oak Ridge, TN, USA, 1989. [Google Scholar]
  5. Hunsaker, C.; Graham, R.; Suter, G.; O’Neill, R.; Barnthouse, L.; Gardner, R. Assessing ecological risk on regional scale. Environ. Manag. 1990, 14, 325–332. [Google Scholar] [CrossRef]
  6. Adams, S.M.; Bevelhimer, M.S.; Greeley, M.S.; Levine, D.A.; Teh, S.J. Ecological risk assessment in a large river-reservoir: 6. Bioindicators of fish population health. Environ. Toxicol. Chem. 1999, 18, 628–640. [Google Scholar]
  7. Baron, L.A.; Sample, B.E.; Suter, G.W. Ecological risk assessment in a large river-reservoir: 5. Aerial insectivorous wildlife. Environ. Toxicol. Chem. 1999, 18, 621–627. [Google Scholar]
  8. Cook, R.B.; Suter, G.W.; Sain, E.R. Ecological risk assessment in a large river-reservoir: 1. Introduction and background. Environ. Toxicol. Chem. 1999, 18, 581–588. [Google Scholar]
  9. Jones, D.S.; Barnthouse, L.W.; Suter, G.W.; Efroymson, B.A.; Field, J.M.; Beauchamp, J.J. Ecological risk assessment in a large river-reservoir. 3. Benthic invertebrates. Environ. Toxicol. Chem. 1999, 18, 599–609. [Google Scholar]
  10. Sample, B.E.; Suter, G. Ecological risk assessment in a large river-reservoir: 4. Piscivorous wildlife. Environ. Toxicol. Chem. 1999, 18, 610–620. [Google Scholar]
  11. Landis, W.G. Twenty years before and hence: Ecological risk assessment at multiple scales with multiple stressors and multiple endpoints. Hum. Ecol. Risk Assess. 2003, 9, 1317–1326. [Google Scholar] [CrossRef]
  12. Peng, J.; Liu, Y.X.; Pan, Y.J.; Zhao, Z.Q.; Song, Z.Q.; Wang, Y.L. Study on the correlation between ecological risk due to natural disaster and landscape pattern-process: Review and prospect. Adv. Earth Sci. 2014, 29, 1186–1196. (In Chinese) [Google Scholar]
  13. Hemstrom, M.; Mezenich, J.; Reger, A.; Wales, B. Integrated analysis of landscape management scenarios using state and transition models in the upper Grande Ronde River Subbasin, Oregon, USA. Landsc. Urban Plan. 2007, 80, 198–211. [Google Scholar] [CrossRef]
  14. Lange, A.; Siebert, R.; Barkmann, T. Sustainability in land management: An analysis of stakeholder perceptions in rural northern Germany. Sustainability 2015, 7, 683–704. [Google Scholar] [CrossRef]
  15. Graham, R.L.; Hunsaker, C.T.; O’Neil, R.V. Ecological risk assessment at the regional scale. Ecol. Appl. 1991, 1, 196–206. [Google Scholar] [CrossRef]
  16. Kapustka, L.A.; Galbraith, H.; Luxon, M. Using landscape ecology to focus ecological risk assessment and guide risk management decision-making. Toxicol. Ind. Health 2001, 17, 236–246. [Google Scholar] [CrossRef] [PubMed]
  17. Liu, S.L.; Cui, B.S.; Dong, S.K.; Yang, Z.F.; Yang, M.; Holt, K. Evaluating the influence of road networks on landscape and regional ecological risk a case study in Lancang River Valley of Southwest China. Ecol. Eng. 2008, 34, 91–99. [Google Scholar] [CrossRef]
  18. Yin, H.; Wang, Y.L.; Cai, J.L.; Lv, X.F.; Liu, X.Q. Regional ecological risk assessment: Its research progress and prospect. Chin. J. Ecol. 2009, 28, 969–975. (In Chinese) [Google Scholar]
  19. Xie, H.L. Regional eco-risk analysis of based on landscape structure and spatial statistics. Acta Ecol. Sin. 2008, 28, 5020–5026. (In Chinese) [Google Scholar]
  20. Jing, Y.P.; Zhang, S.W.; Li, Y. Ecological risk analysis of rural-urban ecotone based on landscape structure. Chin. J. Ecol. 2008, 27, 229–234. (In Chinese) [Google Scholar]
  21. Li, J.G.; He, C.Y.; Li, X.B. Landscape ecological risk assessment of natural/semi-natural landscape in fast urbanization regions—A case study in Beijing. China. J. Nat. Resour. 2008, 23, 33–47. (In Chinese) [Google Scholar]
  22. Wang, C.Y.; Zhang, J.; Xi, H.M.; Fu, J. Ecological risk assessment of island exploitation based on landscape pattern. Acta Ecol. Sin. 2008, 28, 2811–2817. (In Chinese) [Google Scholar]
  23. Li, Y.F.; Luo, Y.C.; Liu, G.; Ouyang, Z.Y.; Zheng, H. Effects of land use change on ecosystem services: A case study in Miyun reservoir watershed. Acta Ecol. Sin. 2013, 33, 726–736. (In Chinese) [Google Scholar]
  24. Lanis, W.G.; Wiegers, J.K. Ten years of the relative risk model and regional scale ecological risk assessment. Hum. Ecol. Risk Assess. 2007, 13, 25–38. [Google Scholar] [CrossRef]
  25. Liu, L.; Liu, J.; Zhang, Z.G. Environmental justice and sustainability impact assessment: In search of solutions to ethnic conflicts caused by coal mining in Inner Mongolia, China. Sustainability 2014, 6, 8756–8774. [Google Scholar] [CrossRef]
  26. Himley, M. Global mining and the uneasy neoliberalization of sustainable development. Sustainability 2010, 2, 3270–3290. [Google Scholar] [CrossRef]
  27. McLellan, B.C.; Corder, G.D. Risk reduction through early assessment and integration of sustainability in design in the minerals industry. J. Clean. Prod. 2013, 53, 37–46. [Google Scholar] [CrossRef] [Green Version]
  28. Chang, Q.; Qiu, Y.; Xie, M.M.; Peng, J. Theory and method of ecological risk assessment for mining areas based on the land destruction. Acta Ecol. Sin. 2012, 32, 5164–5174. (In Chinese) [Google Scholar] [CrossRef]
  29. Li, Z.Y.; Zhang, N.; Tang, J.; Ji, Y.; Liu, J.L. Analysis on the landscape ecological risk of Jilin coal mining area. J. Jilin Univ. (Earth Sci. Ed.) 2011, 41, 207–214. (In Chinese) [Google Scholar]
  30. Li, L.X.; Wang, B.; Zhou, L.B.; Yu, X.B. Ecological landscape risk evaluation in mineral resources exploitation. Conserv. Util. Miner. Resour. 2011, 2, 1–5. (In Chinese) [Google Scholar]
  31. Wu, J.S.; Zong, M.L.; Peng, J. Assessment of mining area’s ecological vulnerability based on landscape pattern: A case study of Liaoyuan, Jilin Province of Northeast China. Chin. J. Ecol. 2012, 31, 3213–3220. (In Chinese) [Google Scholar]
  32. Wang, E.H. Liaoyuan Statistical Yearbook (2009); Liaoyuan Bureau of Statistics: Liaoyuan, China, 2010. (In Chinese) [Google Scholar]
  33. Chang, Y.J. Liaoyuan Yearbook (2010); Jilin People's Publishing House: Liaoyuan, China, 2010. (In Chinese) [Google Scholar]
  34. Chen, Q.Y.; Liu, J.L. Development process and perspective on ecological risk assessment. Acta Ecol. Sin. 2014, 34, 239–245. (In Chinese) [Google Scholar] [CrossRef]
  35. Pickett, S.T.A.; White, P.S. Chapter 21—Patch Dynamics: A Synthesis. In The Ecology of Natural Disturbance and Patch Dynamics; White, S.T.A., Pickettp, S., Eds.; Academic Press: San Diego, CA, USA, 1985; pp. 371–384. [Google Scholar]
  36. Chen, P.; Pan, X.L. Ecological risk analysis of regional landscape in inland river watershed of arid area—A case study of Sangong River Basin in Fukang. Chin. J. Ecol. 2003, 22, 116–120. (In Chinese) [Google Scholar]
  37. Deal, B.; Pallathucheril, V. Sustainability and urban dynamics: Assessing future impacts on ecosystem services. Sustainability 2009, 1, 346–362. [Google Scholar] [CrossRef]
  38. Scott, C.; Lake, P.; Sergi, S.; John, M.; John, S. The effects of land use changes on streams and rivers in Mediterranean climates. Hydrobiologia 2013, 719, 383–425. [Google Scholar]
  39. Song, G.B.; Li, Z.; Yang, Y.G.; Semakula, H.M.; Zhang, S.S. Assessment of ecological vulnerability and decision-making application for prioritizing roadside ecological restoration: A method combining geographic information system, Delphi survey and Monte Carlo simulation. Ecol. Indic. 2015, 52, 57–65. [Google Scholar] [CrossRef]
  40. De Lange, H.J.; Sala, S.; Vighi, M.; Faber, J.H. Ecological vulnerability in risk assessment—A review and perspectives. Sci. Total Environ. 2010, 408, 3871–3879. [Google Scholar] [CrossRef] [PubMed]
  41. Wayne, C.Z.; Robert, L.B.; Ralph, D.N. Patterns of deforestation and reforestation in different landscape types in central New York. For. Ecol. Manag. 1990, 36, 103–117. [Google Scholar]
  42. Costanza, R.; D’Arge, R.; Groot, R.; Farber, S.; Grasso, M.; Hannon, B.; Limburg, K.; Naeem, S.; O’Neill, R.V.; Paruelo, J.; et al. The value of the world's ecosystem services and natural capital. Nature 1997, 386, 253–260. [Google Scholar] [CrossRef]
  43. Xie, G.D.; Lu, C.X.; Leng, Y.F.; Zheng, D.; Li, S.C. Ecological assets valuation of the Tibetan Plateau. J. Nat. Resour. 2003, 18, 189–196. (In Chinese) [Google Scholar]
  44. Banzhaf, H.S.; Boyd, J. The architecture and measurement of an ecosystem services index. Sustainability 2012, 4, 430–461. [Google Scholar] [CrossRef]
  45. Hessburg, P.F.; Reynolds, K.M.; Salter, R.B.; Dickinson, J.D.; Gaines, W.L.; Harrod, R.J. Landscape evaluation for restoration planning on the Okanogan-Wenatchee national forest, USA. Sustainability 2013, 5, 805–840. [Google Scholar] [CrossRef]
  46. Manuela, D.G.; Rolf, H.; Silvia, T. Effects of habitat and landscape fragmentation on humans and biodiversity in densely populated landscapes. J. Environ. Manag. 2009, 90, 2959–2968. [Google Scholar]
  47. Matteo, M.; Duccio, R.; Francesco, G.; Giovanni, B.; Valerio, A. Biodiversity, roads, & landscape fragmentation: Two Mediterranean cases. Appl. Geogr. 2013, 46, 63–72. [Google Scholar]
  48. Campolongo, F.; Saltelli, A.; Tarantola, S. Sensitivity analysis as an ingredient of modeling. Stat. Sci. 2000, 15, 377–395. [Google Scholar] [CrossRef]
  49. Guo, X.R.; Hu, H.W.; Chen, D.S.; Wei, W.; Cheng, S.Y. Urban ecological risk assessment based on land utilization analysis. J. Beijing Univ. Technol. 2012, 38, 1114–1120. (In Chinese) [Google Scholar]
  50. Gao, Y.; Wu, Z.F.; Lou, Q.S.; Huang, H.M.; Cheng, J.; Chen, Z.L. Landscape ecological security assessment based on projection pursuit in Pearl River Delta. Environ. Monit. Assess. 2012, 184, 2307–2319. [Google Scholar] [CrossRef] [PubMed]
  51. Zhou, K.H.; Liu, Y.L.; Tan, R.H.; Song, Y. Urban dynamics, landscape ecological security, and policy implications: A case study from the Wuhan area of central China. Cities 2014, 41, 141–153. [Google Scholar] [CrossRef]
  52. Cen, X.T.; Wu, C.F.; Xing, X.S.; Fang, M.; Garang, Z.M.; Wu, Y.Z. Coupling Intensive Land Use and Landscape Ecological Security for Urban Sustainability: An Integrated Socioeconomic Data and Spatial Metrics Analysis in Hangzhou City. Sustainability 2015, 7, 1459–1482. [Google Scholar] [CrossRef]
  53. Peng, J.; Dang, W.X.; Liu, Y.X.; Zong, M.L.; Hu, X.X. Review on landscape ecological risk assessment. Acta Geogr. Sin. 2015, 70, 664–677. (In Chinese) [Google Scholar]
  54. Li, Y.F.; Sun, X.; Zhu, X.D.; Cao, H.H. An early warning method of landscape ecological security in rapid urbanizing coastal areas and its application in Xiamen, China. Ecol. Model. 2010, 221, 2251–2260. [Google Scholar] [CrossRef]
  55. Ma, L.Y.; Xu, X.G.; Xu, L.F. Uncertainty Analysis of integrated ecological risk assessment of China. Acta Sci. Nat. Univ. Pekin. 2011, 47, 893–900. (In Chinese) [Google Scholar]
  56. Li, Y.F.; Shi, Y.L.; Qureshi, S.; Bruns, A.; Zhu, X.D. Applying the concept of spatial resilience to socio-ecological systems in the urban wetland interface. Ecol. Indic. 2014, 42, 135–146. [Google Scholar] [CrossRef]

