1. Introduction
Innovation is pervasive. Just as gravity is a constant in physics, innovation is a constant force in market economies. It would be inaccurate to say that innovation is a sustaining momentum at a constant rate over time, such as gravity, but innovation is constantly taking place, albeit at a pace that varies by industry, by geographic location and over time. Historically, we witness some periods that are particularly innovative (i.e., the first and second Industrial Revolutions) while others less so (i.e., The Dark Ages). Depending on rulers and societal norms, some societies have been very supportive of innovation, while others have tended to shun it. Russia’s Peter the Great comes to mind as a ruler that was highly supportive of innovation, investing substantial resources to ensure that Russians benefited from technological advances. Generally, rulers view innovation as a beneficial economic activity—the true source of improvements to human wellbeing—and support the development of technologies and encourage their spread throughout society.
While the benefits of innovation are usually loudly trumpeted, it is worthy to note that innovation is not costless. Those that cannot, or will not, adopt an innovation have frequently been tagged as “losers” in an economic sense, meaning that they incur costs because they cannot or do not adopt the technology. Frequently non-adopters are those without the financial means to take on the costs associated with adopting the new technology. Some non-adopters, however, choose to do so for a variety of other reasons that may be personal, philosophical or religious. It has become accepted economic theory that non-adopters lose from their decision, but there can be important exceptions to this paradigm. This article examines one such case in the agri-food space where non-adopters claim to be worse off when they might actually upon closer inspection gain.
The commercialization of genetically modified (GM) crops in the mid-1990s precipitated the beginning of a suite of innovative technologies and products that has now delivered 20 years of adopter benefits [
1]. Almost immediately upon the commercialization of GM crops, organic farmers proclaimed that they would be adversely impacted by this technology. In a number of developed market economies, organic farming has expanded, suggesting that the adverse impacts that were predicted at the point of GM crop commercialization have not been universally realized and that in some way the commercialization of GM crops may actually benefit organic farming. There is some prima facie evidence:
Avoiding GMOs (genetically modified organisms), for themselves or their children, is an increasingly important reason why parents choose organic food”, the OTA (Organic Trade Association) said in its U.S. Families Organic Attitudes and Beliefs 2014 Tracking Study, which surveyed more than 1200 households with at least one child under the age of 18. “Almost 25% of parents buying organic said that wanting to steer clear of genetically modified foods is now one of their top reasons for selecting organic, the most in the four years the survey has been taken, and up significantly from the 16% who said the same in 2013. Of the 15 reasons for buying organic that parents were asked to rate, not buying GMO’s showed the biggest jump by far from attitudes a year ago [
2].
This article is structured in five parts.
Section 2 reviews the literature on the impacts and effects of GM crops on organic crop production.
Section 3 provides a conceptual model for the paper.
Section 4 discusses the market impacts from the commercialization of GM crops.
Section 5 provides some concluding thoughts.
2. Background
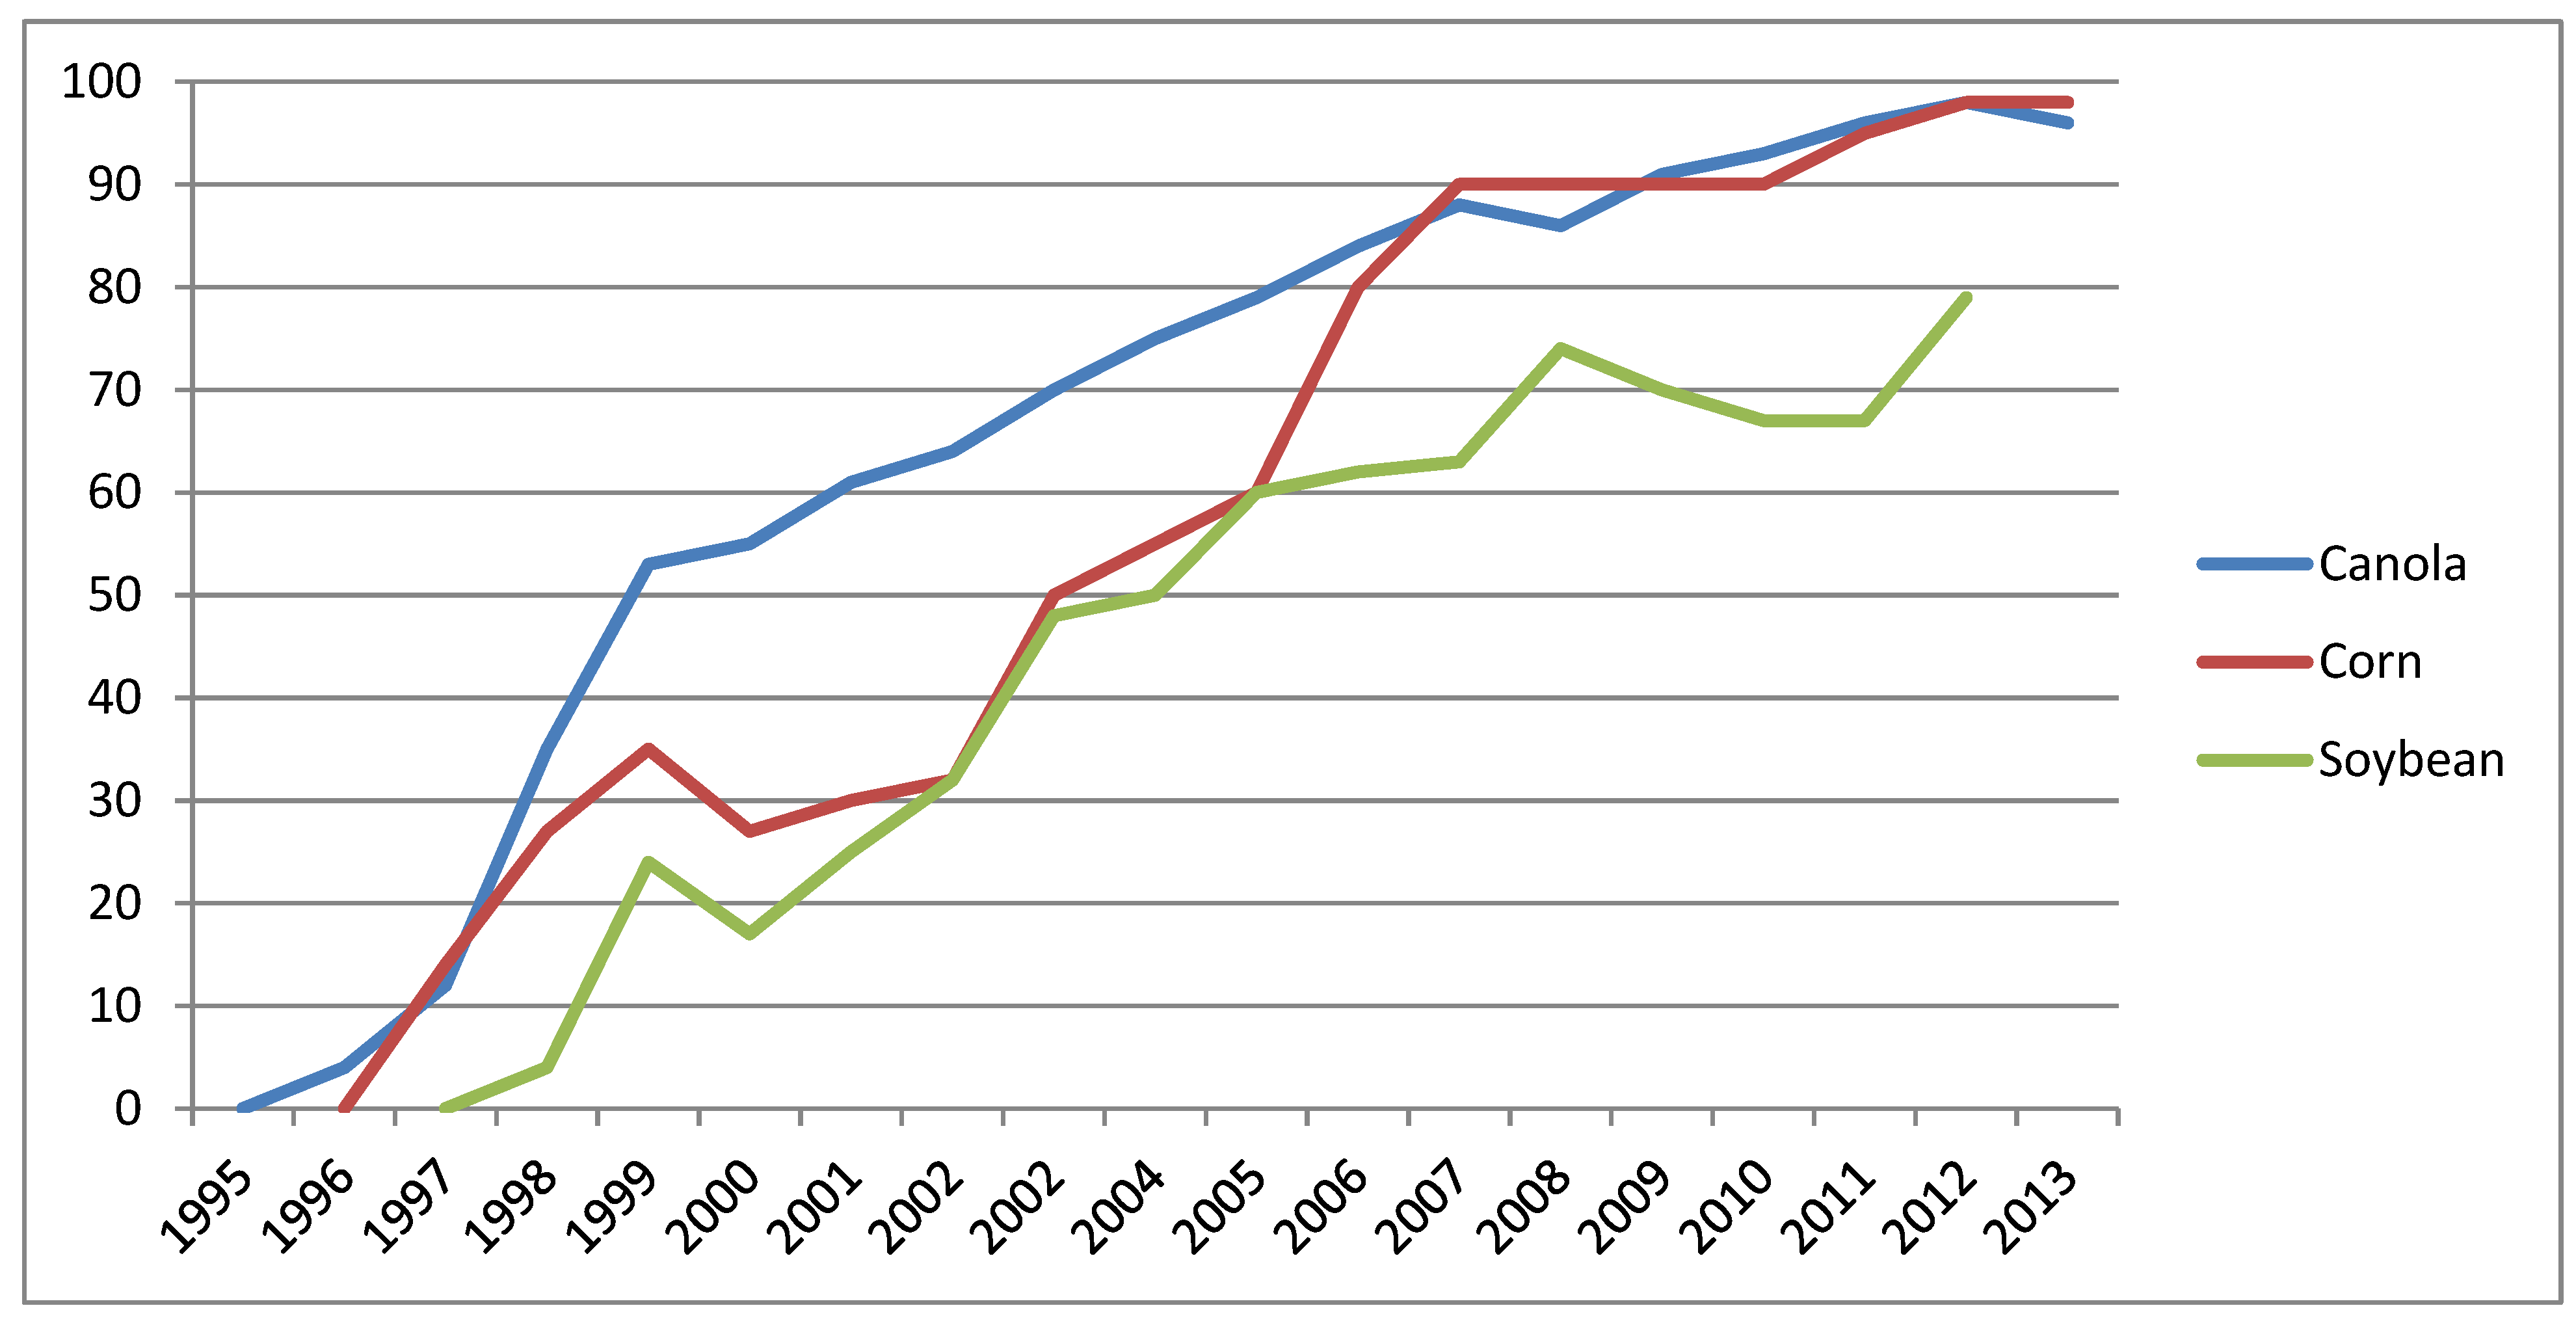
GM varieties of canola, maize/corn and soybean all became commercially available between 1995 and 1997 in both the United States and Canada. Initial concerns from the organic community were somewhat muted given the limited early adoption of GM varieties. At the turn of the millennium adoption rates rose sharply, to a level that began to create concern within the organic producing community.
Figure 1 illustrates the adoption of GM crops in Canada. Until about 2000 organic farmers and the organic industry were able to produce and export organic products without undue concern about provenance and purity being raised [
3]. In response to the spread of GM production, and to capitalize on rising concerns of some consumers regarding GM foods [
4], the organic industry amended their certification standard to exclude the use of GM seeds by certified organic farmers. The new standards were largely silent on the potential for comingling of GM and organic product in the production and marketing system. Testing for trace amounts of GM seed was rudimentary at this time, allowing the organic industry the ability to serve foreign exports markets with little or no risk of rejection based on impurities.
Figure 1.
Adoption of genetically modified (GM) crops in Canada—1995–2013 (Percent). Source: for canola 1995–2010 [
5], 2011–2013 [
6]; for soybean 1997–1999 [
6], 2000–2002 [
7], 2003–2009 [
6], 2010–2012 [
8]; for corn 1996–1999 [
6], 2000–2002 [
7], 2003–2013 [
6].
Figure 1.
Adoption of genetically modified (GM) crops in Canada—1995–2013 (Percent). Source: for canola 1995–2010 [
5], 2011–2013 [
6]; for soybean 1997–1999 [
6], 2000–2002 [
7], 2003–2009 [
6], 2010–2012 [
8]; for corn 1996–1999 [
6], 2000–2002 [
7], 2003–2013 [
6].
As GM seeds became more generally available and the profitability of GM crops became more widely observed, adoption increased. Parallel to this, however, was increasing expressions of concern by the organic industry. At this time, the organic industry in both Canada and the US developed formal standards and regulations preventing the intentional use of GM seed by organic farmers, however, neither set of standards addressed the issue of comingling [
9,
10]. While there are no records, to date, of an organic shipment being rejected due to comingling with a GM commodity, the organic industry grew increasingly nervous. Importers increasingly began to seek assurances that organic shipments were free of GM commodities (and not simply produced using non-GM seed), something that neither organic producers nor export suppliers could absolutely guarantee. Worried that organic export markets might start to close if guarantees could not be provided, the organic industry turned to the courts [
11].
In some instances, concerns precipitated action. In 2002, the Saskatchewan Organic Directorate filed a class-action lawsuit in Saskatchewan’s Court of Queen’s Bench on behalf of two Saskatchewan organic farmers, Larry Hoffman and Dale Beaudoin, representing all registered organic farmers in the province of Saskatchewan against the developers of GM canola, Bayer CropScience (the owners of Agrevo’s Liberty Link canola) and Monsanto Canada (owner of Roundup Ready canola) [
12]. The putative class-action claimed that commercial production of GM canola was responsible for the loss of organic markets due to the real or potential for comingling of GM canola with organic canola. They sought financial compensation for the claimed associated losses, claiming negligence, nuisance, trespass and strict liability [
12]. In particular, they argued that the comingling of GM canola had destroyed the export market for organic canola due to the inability to certify that canola exports (particularly to Europe) were free of GM canola.
The plaintiffs sought damages on behalf of the 1250 certified organic producers in Saskatchewan, regardless of whether they grew organic canola or not. Indeed, it was revealed in the evidence presented in the hearings that only about 14,074 acres were planted to organic canola in the 1990–2001 period, that only 76 certified organic farmers had ever grown organic canola, and that at least six certified organic farmers still produced organic canola in 2001, after the widespread adoption of GM canola, and that exports of organic canola continued [
13]. Based on this evidence, the judge ruled that the evidence did not demonstrate that there was the basis for a class action and ruled against certifying the class action.
The strategy of the organic industry in the US differed slightly in that they sought injunctions against the regulatory decisions allowing commercialization of new GM crop varieties. In 2006, a group of conventional and organic farmers (known as the Geertson plaintiffs as it was Geertson Seed Farms that filed the action) sought an injunction against the commercialization of GM alfalfa in the US [
14]. They argued that the United States Department of Agriculture (USDA) was negligent in undertaking its regulatory oversight on GM crops as it had not required that an environmental impact statement (EIS) be conducted pertaining to the release of GM alfalfa. The heart of the Geertson plaintiffs argument was that pollen flow from the GM alfalfa would be a “contaminant” to the organic alfalfa farmers, causing economic and socio-economic harms [
14]. The local district court ruled in favour of the plaintiffs, granting the injunction and ordering the USDA to perform an EIS. The USDA and Monsanto (the technology commercializer) appealed, but the district court decision was upheld. In 2010, this was further appealed to the US Supreme Court, which ruled that the district court injunction was improper. After further review by the USDA, Roundup Ready alfalfa was deregulated without restriction in 2011 and, in spite of further litigation, remains in production in the US.
In similar fashion, in 2008 the Center for Food Safety (CFS), an environmental non-governmental organization (eNGO), brought a claim against the USDA and Monsanto alleging that commercialization of GM sugar beets should not have been allowed three years earlier, arguing that an EIS was not conducted. The judge allowed planting of GM sugar beets to proceed at the seed multiplication stage. In 2010, the CFS filed for an injunction against any further plantings of GM sugar beets. As GM sugar beets were then commercially cultivated, the USDA undertook an EIS to ensure that further commercial production was not adversely affected. The USDA completed the EIS in 2012 and deregulated the crop. The CFS further challenged this ruling but the courts rejected the claims and dismissed the case [
14,
15].
Through the use of court cases, the organic sector claims to be economically disadvantaged due to the commercialization of GM crops. However, there has yet to be any verifiable evidence from the organic industry that commodity shipments for either domestic use or export are being rejected at point of acceptance due to the low level presence of GM commodities. With no evidence of economic harm due to shipment rejections, one wonders whether, on the contrary, the organic industry may actually be benefiting from the commercialization of GM crops. Some evidence exists that supports this.
Hutchison
et al. [
16] examined the environmental impacts of GM corn adoption in the US Midwest. GM corn has been developed to be insect resistance, particularly to the effects of the European corn borer. At the time of their study, GM corn accounted for two-thirds of the corn planted in the US. Their study of European corn borer suppression due to the widespread adoption of GM corn in the states of Illinois, Minnesota and Wisconsin, found that the cumulative economic benefits from 14 years of production was estimated to be US$3.2 billion. Due to the area wide suppression of corn borers, the authors estimated that 75% (US$2.4 billion) of the economic benefits went to producers not adopting GM varieties (which includes organic corn producers). The high and wide spread use of GM corn has suppressed the presence of the European corn borer to such a degree that those not growing GM corn gain from: relatively lower seed costs; lower chemical needs; and generally improved yields due to lower insect depravation.
Huang
et al. [
17] similarly updated their Chinese Bt cotton study following a decade of commercial production, finding a drop in bollworm infestations, not only in Bt cotton fields, but in all cotton fields in parts of China. In some non-Bt cotton fields, the amount of insecticide used dropped from in excess of 40 kilograms per hectare to less than 10 kg/ha. Across the entire sample region insecticide applications dropped from 14 kg/ha to 4kg/ha.
The evidence indicates that with the adoption of GM crop technologies, impacts may spill over to the fields of the non-adopters, providing economic disadvantages or advantages. While the organic industry is unable to substantiate their claims of economic losses due to shipment rejections, anecdotal evidence demonstrates that some economic advantage has been gained due to close proximity to GM crops. As is noted above by Hutchinson
et al. [
16], non-adopters of GM crops achieved benefits from GM crops through lower pest pressures, which lead to higher yields and reduced pesticide applications (the organic industry also can benefit as producers are allowed and many use Bt spray to control corn borer, the chemical analogue to the Bt gene that gives GM corn its insect resistance). With economic benefits from reduced corn borer populations and reduced pesticide applications, organic farmers growing corn have benefited economically by the commercialization of GM corn. The remainder of this article examines the full range of our hypothesis that organic producers could benefit from GM crops.
3. Conceptual Framework
Some civil society groups and a few regulators argue for the inclusion of socio-economic factors in assessments of new GM-crops. In their view, a technology that imposes economic or social costs on society, or any of its individual members, is unacceptable and should not be licenced for production or import. In other words, the only technologies that should be accepted are those whose adoption would create only “winners” (
i.e., no “losers”). The challenge is that all new technologies generate a mix of “winners” and “losers”. Implicit in the rejection of any technology that imposes any negative economic impacts is the rejection of the cost-benefit regulatory rule that weighs and makes decisions on the aggregate benefits and costs for society. While those who work in the area of technological change understand that it will not be possible to deliver “winner only” technologies, this eventuality is not always intuitive. Given that some who wish to influence technology policy appear to believe that “winner only” technologies are possible [
18], it is worth laying out the reasons why such a result is not feasible.
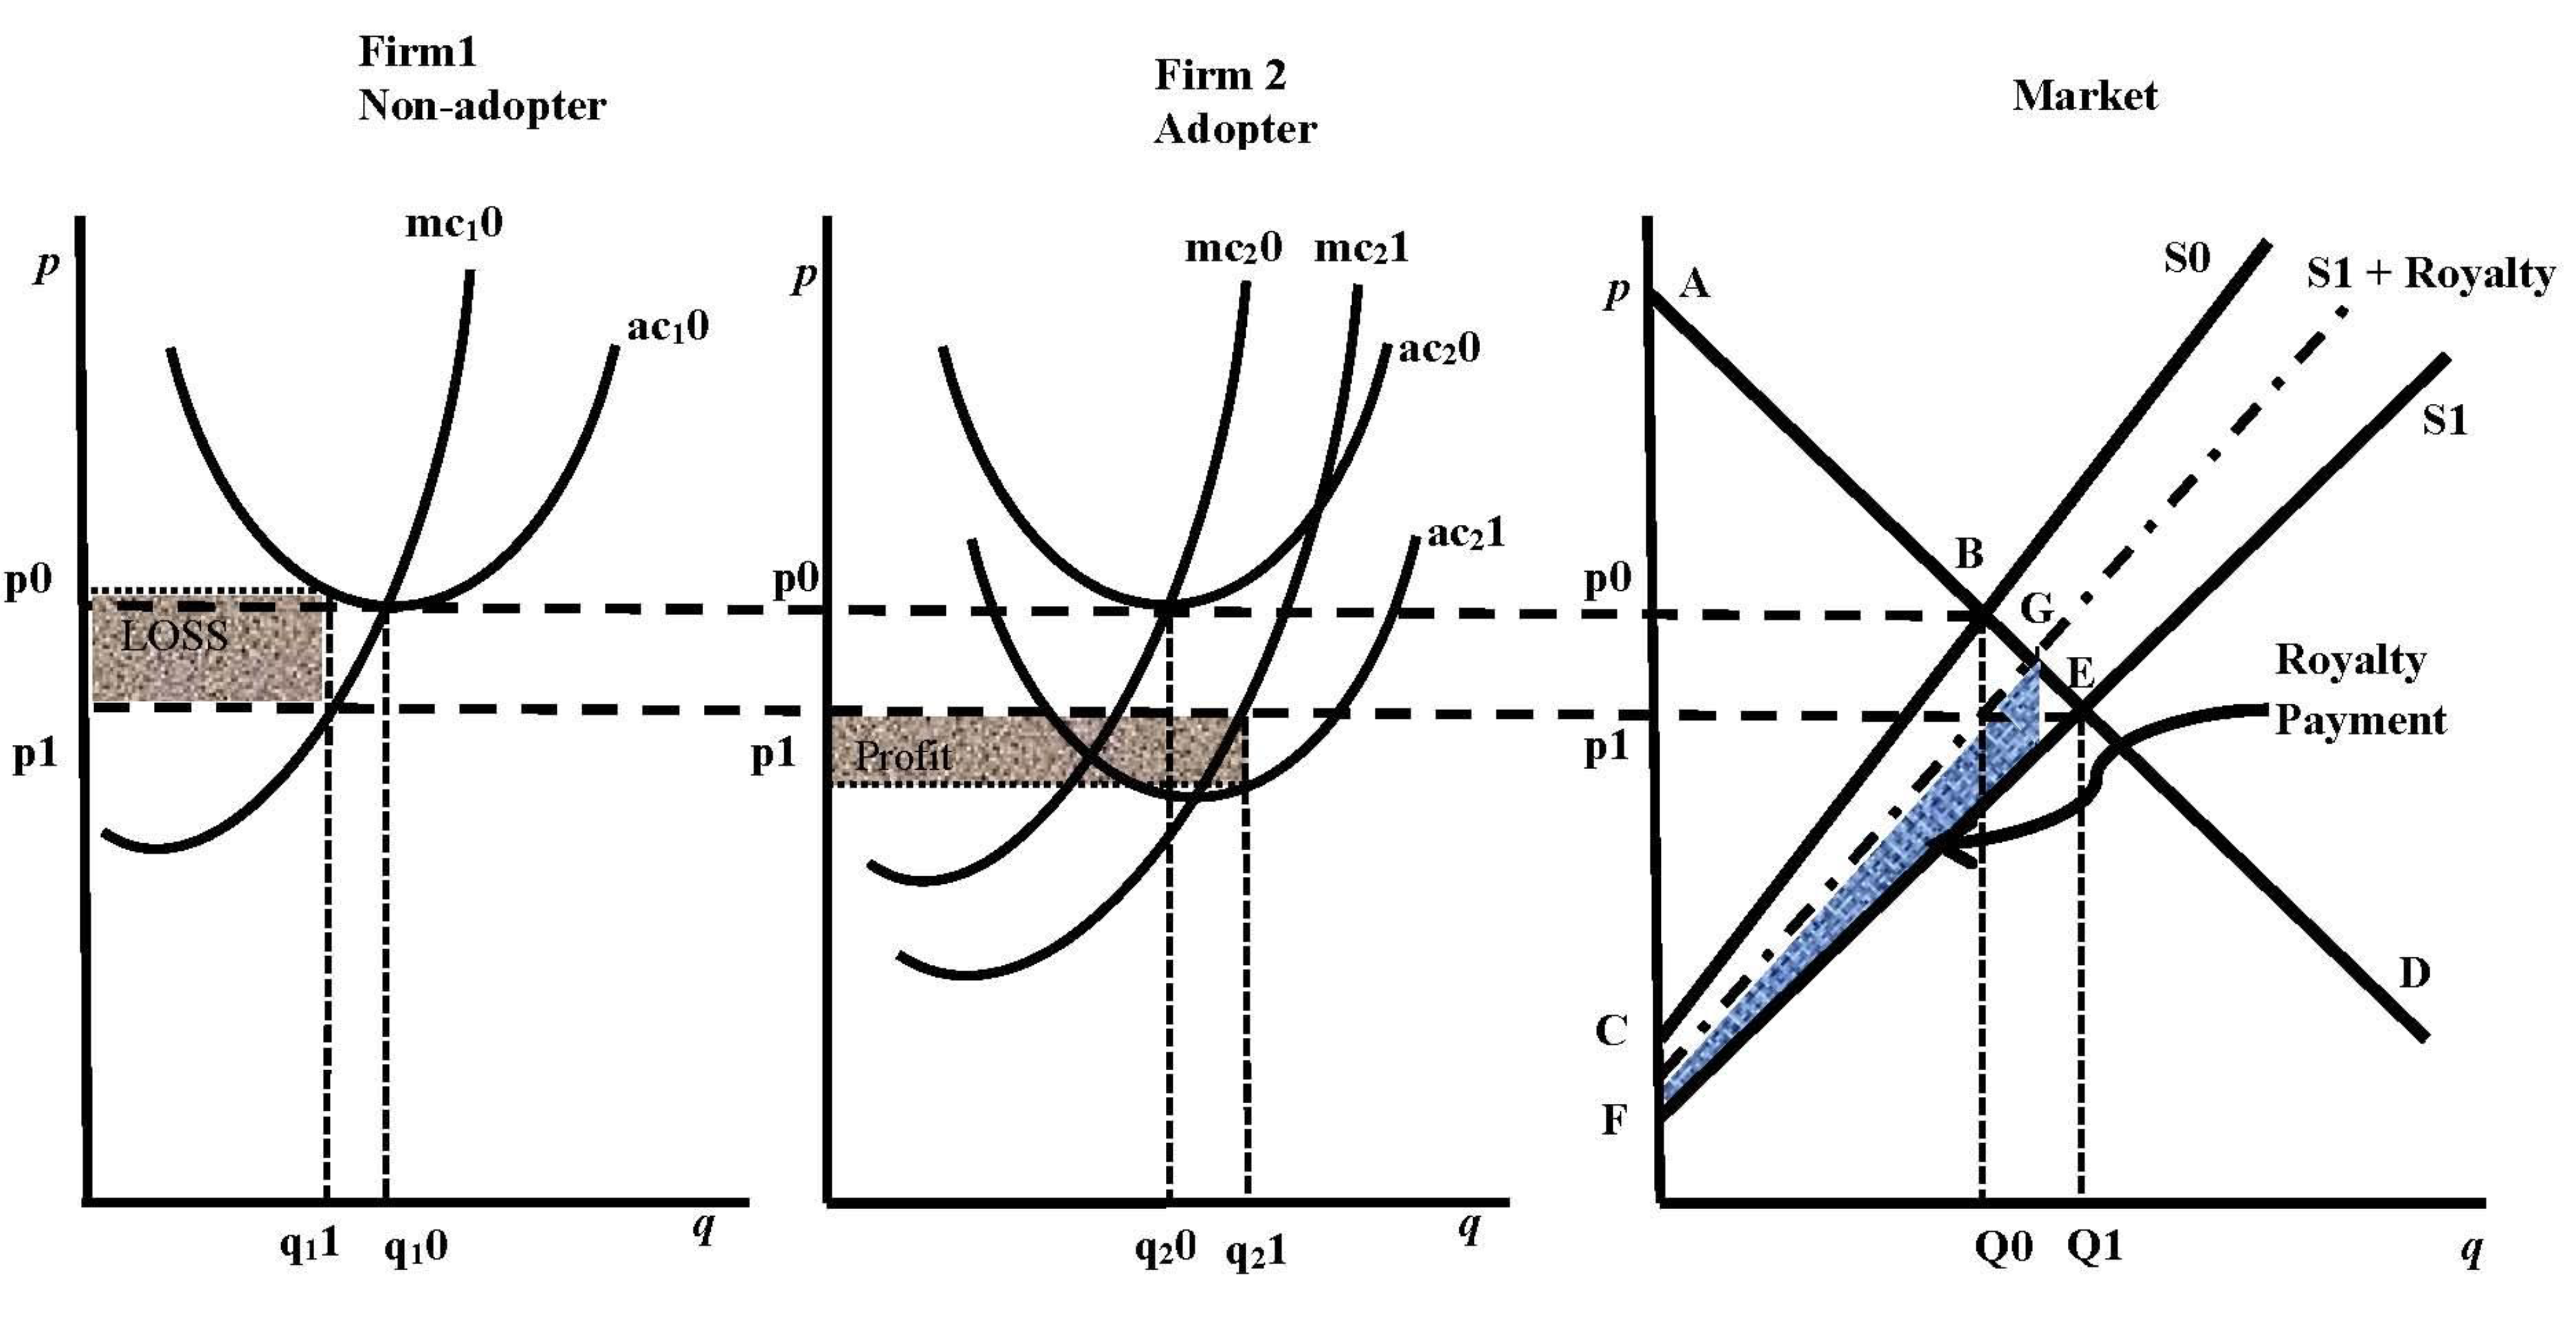
Figure 2 can be used to illustrate why “winner only” technologies are not expected to arise. The assessments of technological change are most often based on the “partial equilibrium, comparative statics” models of economists [
19,
20], which we use to develop our argument. This approach does not consider cross market effects in its assessments of new technologies—although there is no reason why effects on heavily affected markets cannot be included in any empirical assessment of a new technology (Alston
et al. [
21] show just that for Roundup Ready soybeans). A single market is depicted in the right hand panel of
Figure 2.
Figure 2.
Modelling technological change in a partial equilibrium framework. Legend: p (or P) = price; q (or Q) = quantity; 0 indicates equilibrium before the change in technology; 1 indicates equilibrium after the change in technology; S = supply; D = demand; mc = marginal cost of production; ac = average total cost of production.
This discussion of the inclusion socio-economic factors in the assessment of a new technology assumes that the technology has been judged as being acceptable to society on a scientific basis. In other words, issues such as food safety and environmental risk have been dealt with by competent scientific authorities and the technology is deemed acceptable for commercialization. If the scientific bar is not cleared then the technology cannot be approved for commercialization and, hence, there is no need for a socio-economic assessment. It should be noted that the scientific-based risk assessment will normally include factors such as the economic cost of adverse human health impacts and thus have been “dealt with” and should not be included in the subsequent examination of socio-economic factors [
22].
“Social welfare” is the normal metric used to evaluate a new technology in partial equilibrium models. The “comparative statics” methodology compares one static equilibrium (e.g., before the technological change) to a second static equilibrium (e.g., after the technological change). The total (societal) welfare for the pre-technological change equilibrium is defined by the demand curve in the market, D, and the supply curve representing the original technology, S0. In this case the total welfare is area ABC [
23]. A successful new technology represents an increase in technical efficiency—or a lowering of the cost of producing the same output, thus both the marginal cost (mc) and the average cost (ac) decline for adopters. This is represented by a downward shift in the market supply curve—from S0 to S1. The market moves to a new equilibrium at point E where S1 intersects the demand curve. Total welfare is now equal to area AEF which is larger than the original total welfare (area ABC) by area CBEF. Hence, the technological change is “welfare enhancing”. These increased benefits are divided between consumers—through increased consumer surplus generated by lower market clearing prices—and producers—through increased producer surplus generated by more efficient production methods.
In this example the technological change is assumed to be developed outside the market and provided free of charge to the producers in the market. This would be the case, for example, when new seed varieties developed in government research facilities or publically funded universities are given to the industry at no cost. If, however, the new technology is developed in the private sector that enjoys intellectual property protection through patents [
24] and royalties can be charged, which would increase the cost to producers and cause the supply curve to shifts upward to, for example, S1 + Royalty [
25]. The welfare given the technical change when royalties are collected becomes AGC (which is less than AEF, which was generated when the technology is free). While the technical efficiency associated with the technological change is still represented by the cost underlying supply curve S1, a royalty payment equal to the shaded area in the right hand panel of
Figure 2 benefits the holder of the intellectual property rights. Hence, the benefits of the technological change are ultimately shared between three parties: consumers, producers (farmers) and innovators. Given this particular method of assessing a technological change—partial equilibrium, comparative statics—one might be led to believe that “winner only” technologies might exist—after all there are no losers noted in the analysis above.
There is, however, a great deal going on behind the curves when this particular method of assessment is used. This is where the “losers” are to be found. To discover some of the losers the figures depicting Firms 1 and 2 in
Figure 2 are useful. These two firms are representative of all of the firms engaged in this competitive market—usually taken to be a “large” number. The supply curve of an industry is the sum of the marginal costs curves of the individual firms. Let us start with Firm 2—the adopter. In the absence of a technological change the firm is operating on mc
20 contributing to S0 in the market. It faces p0 from the market and choses to produce quantity q
20. We assume the firm is in equilibrium having an average cost function ac
20 and earning normal profit at q
20 (
i.e., p0 = ac
20 at q
20). At this point Firm 1 and Firm 2 use the same technology and are assumed to have the same cost structure. Firm 1 is also contributing to supply curve S0 through mc
10, producing q
10 and earning normal profit.
Consider a technological change that Firm 2 both can technically and is willing to adopt. A technological change lowers the firm’s cost (increases its efficiency) moving it from mc
20 to mc
21. If there are a sufficient number of adopting firms, S0 shifts down to S1. Price declines in the market from p0 to p1. Firm 2 must then re-chose its optimal output based on the new price and its new marginal cost curve (
i.e., at q
21 where mc
21 = p1). If the marginal cost shifts down the average cost will also shift down so that, as depicted [
26], it now has average cost curve ac
21. As ac
21 is less than p1 at q
21 Firm 2 now makes a “supernormal” profit equal to the shaded area in the center panel of
Figure 2. Thus all of the firms represented by Firm 2 are “winners” as a result of the technological change.
In the short run, however, a new technology seldom has universal adoption. Thus it is important to consider non-adopting firms when evaluating the socio-economic effects of a new technology. If there is a new technology that Firms 2 adopts, the effects in the market are as described above. Price falls from p0 to p1. Firm 1 does not adopt the technology due to technological incompatibility or an unwillingness to adopt it. Thus, it retains the same technologically determined marginal cost curve mc
10 (and ac
10). Given the decline in price, Firm 1 must re-choose its optimal output. This is now q
11 (where mc
10 = p1). As ac
10 is greater than p1 at q
11 the firm makes a loss equal to the shaded area in the left hand panel of
Figure 2. Non-adopting firms are “losers”. The strict model would assume Firm 1 can be expected to leave the industry and their resources are available for deployment elsewhere in the economy [
27]. While firms leaving the industry shift the supply curve in the market upward, the supernormal profits earned by Firms 2 provide a signal for additional firms that can use the technology to enter shifting the supply curve in the opposite direction. Eventually the market will reach a new equilibrium with full adoption of the most efficient technology.
As the technological change leads to the market price declining—from p0 to p1 there will also be cross market effects. For substitute products [
28] the decline in price will lead to a leftward shift in the demand curve of the substitute, meaning less total welfare in the substitutes’ market—thus “losers” are created [
29]. Similarly, demand and prices in markets for complements would rise, generating windfall gains. Alston
et al. [
21] undertook to put numbers to the cross market effects for the adoption of GM soybeans, concluding that farmers and countries adopting the technology gained, all consumers (whether they wanted GM crops or not) gained but that producers of competing crops, such as canola, sunflower and palm lost (while consumers of those crops gained). In all, about 10% of the benefits flowed to producers and consumers outside the soybean sector.
With technological change, the quantity of inputs used is unlikely to remain the same. For example, in the center panel of
Figure 2 as the marginal cost curve declines (to mc
21) for Firm 2, the total input cost is less than was the case when Firm 2 was operating on mc
20. This means that the demand for inputs has declined. The shift to the left in the demand for inputs creates “losers” in the input market [
30].
Further, and more likely, the mix of inputs is likely to change as the technology changes. For example, if the industry depicted in
Figure 2 was the market for personal conveyance vehicles and the technological change was the invention of the automobile, Firm 2 that is producing cars will need a very different mix of inputs (e.g., engine blocks, gas tanks, brake shoes) than Firm 1 that is producing buggies (e.g., leather, hitches for horses) [
31]. Thus, as the technological change progresses, demand for inputs specific to the manufacture of buggies will decline—creating “losers” [
32]. In the case of some GM technologies, their adoption has meant a considerable reduction in the use of pesticides, especially older pesticides—in effect this has translated into significant losses in market share for those pesticide products that are not as competitive as those linked to GM seeds while some chemical producers have lost significant sales as their pesticides are no longer used.
GM technology may also mean a reduction in the quantity or change in quality of labour required in production. For example, in developing countries herbicide tolerant crops may no longer have to be hand weeded, releasing labour from production—often women and girls. This change will represent a reduction in employment. The labour released, however, may be redeployed to other activities such as fetching water or attending school [
33]. Evaluating secondary market effects of technological changes can be very complex. Of course, changes in secondary markets lead to cascading effects in other markets. A full assessment of a technology would require a different methodology—a general equilibrium approach that includes an evaluation of all interactive market effects. Unfortunately, disaggregated general equilibrium models require unattainable quantities of data so that any assessments undertaken using computable general equilibrium models are done at a level of aggregation that does not yield the degree of detail required for a useful assessment of a technology [
34].
The bottom line is that putting policies in place whereby only technologies that have no negative effects—
i.e., ones that create only “winners”—means that all new technologies would be rejected. In effect, this means that the gains in societal welfare observed in
Figure 2 would be forgone. Thus, public policy assessments of new technologies need to be conducted in a cost/benefit framework whereby both “winners” and “losers” are considered. The full-scale, frontal attack on this regulatory norm could have dire consequences for socio-economic progress.
4. A GM-Based Technological Change
One area that has not adequately assessed the market effects arising from a technological change is the interaction between GM-based crops and organic production in the same product space. As a result, in some jurisdictions regulatory policy may not produce a socially optimal outcome. These market interactions are explored in
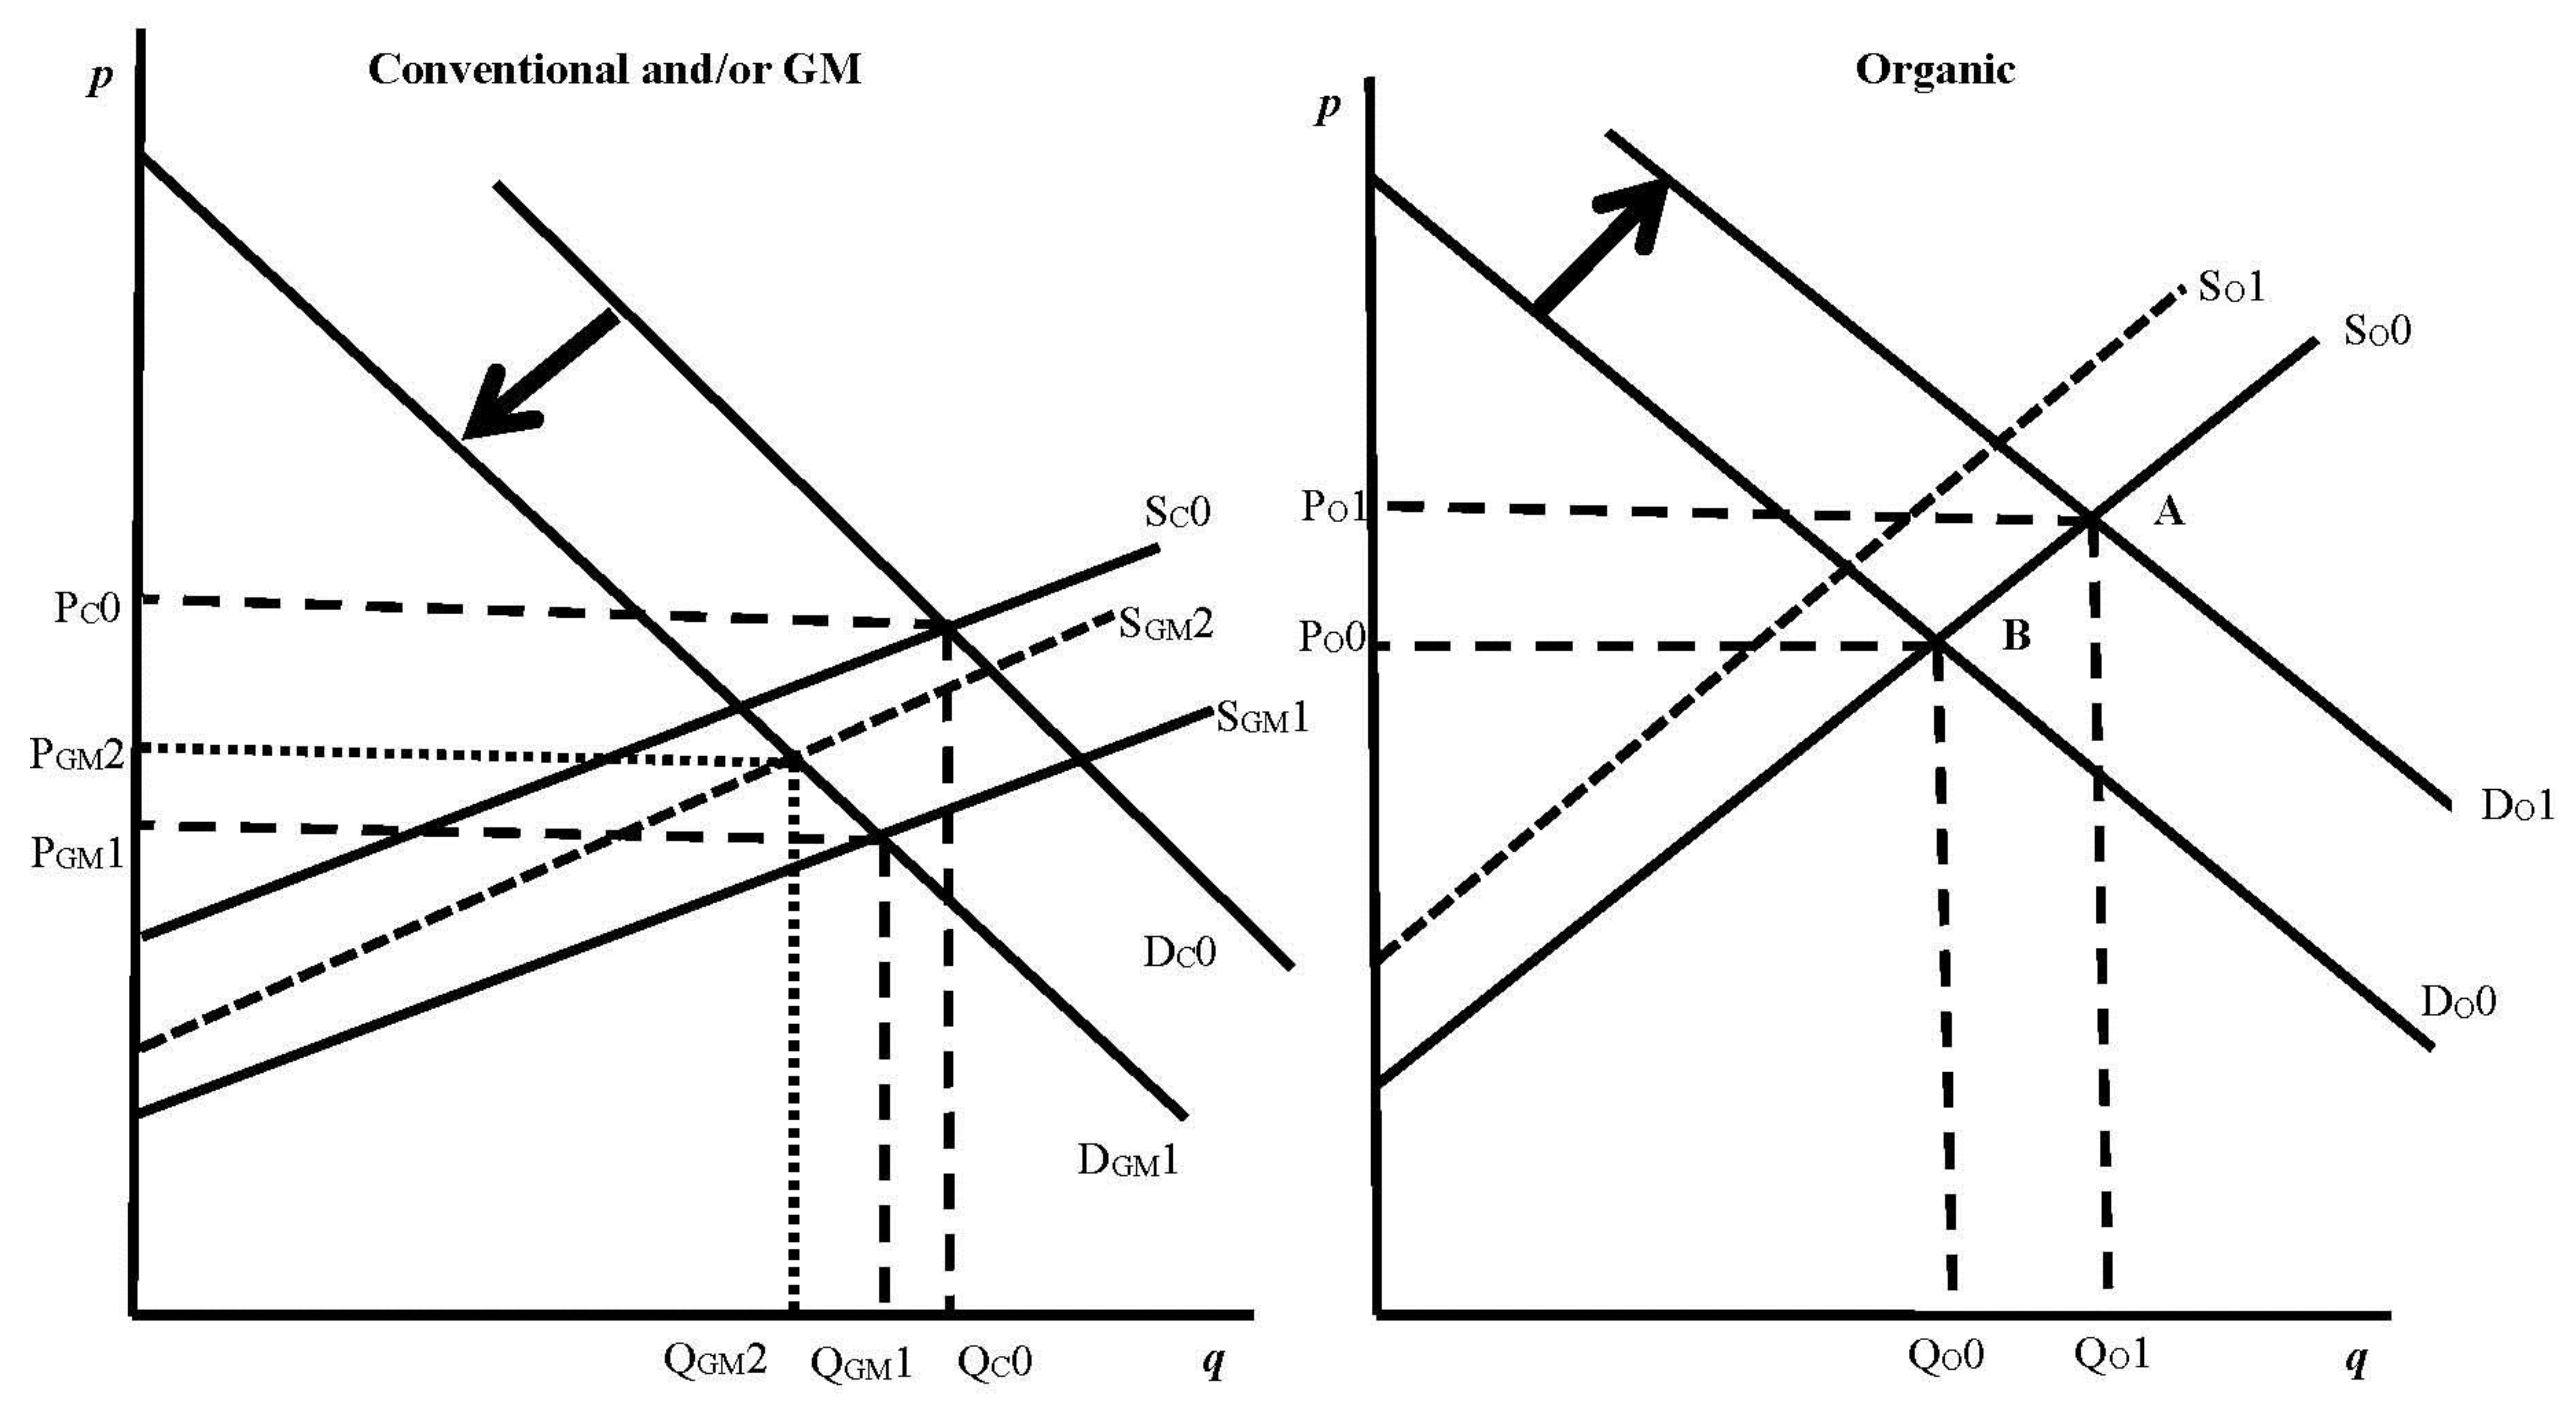
Figure 3.
The right hand panel of
Figure 3 represents the organic market for a particular crop. In the absence of a GM variety of the crop, organic (O) producers must compete with producers of conventional (C) crop varieties. In the organic market, in the absence of GM varieties, the demand for organic product is D
O0 and the supply is S
O0 yielding price P
O0 and quantity Q
O0. The left hand panel of
Figure 3 depicts the market for the conventional [
35] variety of the same crop. In the absence of a GM-based technological change the demand for conventional varieties is D
C0 and conventional supply is S
C0 yielding price P
C0 and quantity Q
C0.
When a GM variety of the crop is introduced into the market, in the absence of labelling and segregation of GM and conventional varieties (such as is the case in the US and Canada), consumers will be unable to discern whether they are consuming GM products or products produced using non-GM, yet non-organic, technologies. As a result, those consumers that prefer not to consume GM products may begin to purchase organic products, which are certified as GM-free—this would shift the organic demand curve outward.
Figure 3.
Partial equilibrium model effects of a GM-based technological change on conventional and organic markets. Legend: p (or P) = price; q (or Q) = quantity; 0 = pre-change time period; 1 = first subsequent time period; 2 = second subsequent time period; c = conventional; o = organic; GM = genetically modified; S = supply in a market; D = demand in a market.
At the same time as the demand in the organic market shifts out, the demand in the conventional and/or GM market shifts inward in response to consumers shifting their purchases between the two product categories [
20,
36]. The greater the proportion of the market that becomes GM the higher the probability that a consumer who does not chose to purchase organic product will be consuming GM and, thus, for those that wish to avoid GM products the larger the incentive to switch to organic products—thereby shifting the demand curve for organic products further outward [
37]. Once the adoption of GM technology is complete, the entire market in the left hand panel of
Figure 3 will be GM production so that consumers are faced with a choice of only GM or organic products.
The new equilibriums in the markets now segmented as 100 per cent GM and organic can be seen in
Figure 3. Once all the consumers that wish to avoid GM products have shifted to the organic market, demand in the GM market will be D
GM1. The post technological change supply curve—the GM supply curve—is S
GM1. The GM market price is P
GM1 and the quantity purchased Q
GM1. The decrease in resource cost per unit (the efficiency gain) is the vertical distance between S
C0 and S
GM1 for any quantity.
In the organic market the additional consumers who have switched their consumption to organic produce move the demand curve from D
O0 to D
O1. The new price of organic products is P
O1 and the quantity Q
O1. Thus there is a gain to organic farmers—they gain producer surplus—of area P
O0BAP
O1. This gain to organic farmers so far has been universally ignored in assessments of the introduction of GM technology given that policy makers are focused on potential “losers” arising from the advent of a new technology [
38].
While policy makers and regulators are empowered (and in some cases directed) to use cost-benefit as part of risk analysis, in most cases regulatory decisions are focused on avoiding or mitigating losses rather than counting and realizing gains. In the context of GM regulation many jurisdictions unapologetically concentrate on the potential “losers” that may arise from the commercialization of GM varieties. One common policy focus is on preventing “losers” in the organic industry. The policy is sometimes identified as ensuring “coexistence” between organic and GM products, but the real intent is to prevent “losers” arising in the organic industry. As the organic industry has self-declared itself to be producing only non-GM products, any comingling of GM and non-GM varieties in their outputs is posited to threaten producer’s ability to sell their products as organic and to receive the price premium. The possibility of genetic drift (or unintentional comingling of organic and GM seed in the supply chain) could jeopardize the certified organic status of some organic farms [
39]. In the context of
Figure 3, comingling of this sort would force those producers to “leave” the organic industry, causing the supply curve to shift up and to the left in the right hand panel of the figure—to S
O1. The “losers” are those organic farms where comingling has been detected [
40].
Coexistence policy aims to prevent these “losers” from arising. In short, the goal is to hold the organic supply curve steady at So0. Coexistence policy seeks to create physical or managerial barriers between farms where GM production takes place and organic farms in order to prevent genetic drift from causing organic farmers to lose their organic status. This could result in GM producers being required to create buffers zones around their fields to localize the genetic drift of their GM crops—which would effectively reduce their productivity as less area can be planted to GM crops. In the left hand panel of
Figure 3 these reductions in productivity (increased costs per unit of output) mean that the supply curve shifts upward from S
GM1 to S
GM2. This decreases producer surplus in the GM industry. The more onerous the coexistence rules for GM farmers the more the supply curve will shift. In the making of coexistence policy this loss is not considered because the focus is on preventing “losers” arising in the organic industry.
If the costs of coexistence policies are sufficiently high it may “wipe out” all of the efficiency gains associated with the new technology (
i.e., if the cost of coexistence policy shifts the GM supply curve back to S
C0 or beyond) [
41]. From the societal point of view there is a clear trade-off between the loss of surplus in the organic market and the loss of producer surplus in the GM market. The more onerous the coexistence policy is for GM producers the further the GM supply curve shifts and the less the organic supply curve shifts. From a strict economic optimization perspective, there is an optimal coexistence policy whereby the total loss of surplus (from the two markets) is minimized.
That is not, however, current practice. Coexistence policies, as suggested above, are simply focused on preventing any shift in the organic supply curve. Policies are often constructed with an objective of zero tolerance [
42] which would mean the organic supply curve would not shift. While this could jeopardize important welfare gains in the GM market, these losses are seldom taken into account. The result is sub-optimal from society’s perspective, but not of course for the vested interests in the organic industry. In some cases the inability to design a “viable” [
43] coexistence policy has led to “temporary” bans on licencing GM products [
44] with the result that the gains to society from the new technology are forgone in the name of preventing “losers” arising in the organic industry; and, ironically, any knock-on growth in organic demand is also foregone.
Clearly a serious policy issue arises from the perception that “winner” only technologies exist and that any technologies that create “losers” should not be tolerated. All technologies create both “winners” and “losers” and policy makers need to examine both the benefits and costs associated with new technologies and not simply the costs. This is the way socio-economic factors are intended to be treated in assessments of new technologies and the most appropriate basis for policy engagement.
5. Conclusions
Innovations change societies into which they are commercialized [
45]. Some in society will benefit more than others (also known as the “winners”), while others that have restricted means or ability to adopt or suffer from negative cross-market effects (a.k.a. “losers”) have typically been thought to be disadvantaged. However as we demonstrate in this article, some non-adopters can also benefit from some innovations. In our example, organic farmers in many markets may actually be benefiting from the commercialization of GM crops as demand for their products has increased due to the desire of some consumers to avoid consuming GM products; all other things being equal, there is no expectation that these consumers would have purchased organic products had GM crops not been commercialized. Some organic farmers have also benefitted from lower costs and improved yields due to reduced pest populations arising from widespread adoption of Bt corn.
In the course of this research, and in the absence of any published data, major downstream firms in the organic industry were contacted and asked to what degree they thought the demand for organic products was affected by consumers seeking to avoid GM-foods. There are only a few firms (3–5 at most) that export organic bulk commodities routinely. We contacted these exporters and one expert respondent asserted [
46]:
On balance, I believe that organic sales have been boosted perhaps 10% by consumer concerns over GMO. That is belief and not provable fact. Ten percent would be worth perhaps $3 billion [
47].
In direct response to our query [
48], the same firm provided the following information:
We have some buyers who tell us that they are motivated to buy organic to avoid GMOs. Others indicate that avoiding GMOs is just part of the package they seek in buying certified organic products. Almost all organic buyers place some significant value on avoiding GMOs.
Had the organic rules accepted GMO as an approved practice, organic might have lost 50% or more of its demand to non-GMO verified products raised conventionally with synthetic fertilizers and pesticides.
The premiums for non-GMO trend toward 15% of the underlying commodity price. Current premiums for non-GMO soybeans run about $1.50/bu with a base commodity price of $9.30/bu; for corn, about $0.45 with a base corn price of $3.l2/bu.
(L. Clarkson, personal communication [
47])
While not conclusive evidence that the organic industry has benefitted from the existence of GM foods, it is consistent with the theoretical framework developed above and suggests that these positive benefits should be investigated and included in socio-economic public policy assessments of GM products. It is an area where further applied research is warranted.
While a hot topic in high-income countries, this policy issue has wider application and impact on global food security. The eNGO community has lobbied and pressured many developing countries to implement broad socio-economic considerations as part of their domestic biosafety regulatory framework, ostensibly to protect potential losers in those countries. In Mali, for instance, eNGOs encouraged the government to enact regulations that will not allow any negative socio-economic impacts to occur from the commercialization of GM crops. Innovation is not possible within this type of regulatory environment as every new production possibility will inevitably displace older, inefficient technologies, creating losers among those not able or nor willing to adopt, in cross markets and in the input markets. The encouragement of such policy development by eNGOs ultimately fosters increased food insecurity. When small landholder farmers are denied access to innovations, they are forced to maintain existing low-skilled, labour-intensive work that they have undertaken for centuries, while landholders in neighbouring countries are able to reap the benefits of GM crops, including greater yields, increased profits, rising household incomes and enhanced food security.


