Article

Development of the Social Inventory Database in Thailand Using Input–Output Analysis

1
National Metal and Materials Technology Center (MTEC), National Science and Technology Development Agency (NSTDA), Thailand Science Park, Pathum Thani 12120, Thailand
2
Faculty of Environmental Studies, Tokyo City University, Yokohama, Kanagawa 224-8551, Japan
3
The Petroleum and Petrochemical College, Chulalongkorn University, Patumwan, Bangkok 10330, Thailand
*
Author to whom correspondence should be addressed.
Sustainability 2015, 7(6), 7684-7713; https://doi.org/10.3390/su7067684
Submission received: 9 April 2015 / Revised: 24 May 2015 / Accepted: 1 June 2015 / Published: 16 June 2015
(This article belongs to the Section Social Ecology and Sustainability)

Abstract

:
The social life cycle assessment (S-LCA) is a technique for assessing social impact and potential impact that aims to evaluate the social and socio-economic aspects of products and their potential for both positive and negative impacts along their life cycle. The lack of a quantitative inventory data for social issues is a weakness of the S-LCA methodology to calculate social impacts. This study aims to establish a social inventory database in Thailand using input–output (IO) modeling. The 2005 economic IO table of Thailand is used in this study. The six different social issues are calculated for both direct and indirect social intensity. The social issues include employment, number of female employees, working hours, wages and salaries, and non-fatal and fatal occupational cases. The results indicate that the primary sector has the highest social intensity in terms of employment, female employment, and working hour intensity. Meanwhile, the secondary sector was higher in non-fatal occupational cases intensity than other sectors. For wages intensity, the results show that the government sector was higher than other sectors, it being labor intensive and of low economic value. In addition, the fatal occupational cases shows the highest intensity in the non-metallic mining, fertilizer and pesticides, and construction sectors. In terms of total social impacts or social footprints, the wholesale and retail trade sector had the highest impact for almost all social issues due to the higher final demand in this sector.

1. Introduction

The three dimensions for sustainable development are environmental, social, and economic issues, with the ultimate goal being human well-being of both the current and future generations. Over the past 15 years (1999–2013), Thai GDP has grown 4.5% a year on average. Although some periods of economic crisis, the economy has proven to be recover to solid economic fundamentals. However, social problems are increasing both in regards to living standards and quality of life. In addition, this results in increasing impacts in the up-stream and down-stream economic sectors of the economy. Current research activities in Thailand have focused on energy and environmental assessment of products and services. In the last two decades, the annual average increase in the ratio of energy consumption value to GDP in Thailand has exceeded 100%. In 2012, the ratio was 18.8% higher than the previous year, whereas in 1990 it was only 11% [1]. This increase in energy consumption is also expected to result in greater environmental impacts on the environment. In Thailand, fossil fuel energy resources are limited and their use is associated with a number of negative environmental impacts. However, energy has become an important socio-economic issue that puts pressure on all countries in the world to improve energy efficiency and develop renewable energy resources.
Industrial ecology (IE) is the investigation of material and energy flows across the industrial systems which are associated with scientific, technical, economic, political, social and cultural issues. The world economic systems can be modeled as an industrial network with the extraction of resources and their transformation into commodities to meet the needs of society. Industrial ecology is concerned with switching from linear industrial process (open loop) systems to a closed loop system where wastes can be used as inputs for new processes, in order to manage the rapid increase of environmental degradation that effects society in terms of both economy and quality of life. The IE theory introduced a novel paradigm of principles and tools of analysis and decision support by integrating environmental issues in strategic planning, product design, manufacturing, product use, and end of life management regarding the development of an eco-industrial system [2]. Various IE researches focus on the following areas: material and energy flow analysis [3], life cycle assessment, social life cycle assessment, design for the environment, extended producer responsibility, eco-industrial parks, eco-efficiency, etc. [4]. Industrial ecology helps companies to increase their competitive advantage by improving their environmental performance and strategic management. In addition, IE helps government agencies plan policies and regulations to improve both environmental protection and business competitiveness.
At present, the life cycle assessment (LCA) technique is highlighted to promote sustainable development. LCA has sparked worldwide interest in quantifying the environmental performance of a product or service from cradle to grave in a systematic approach. In addition, LCA can address the social aspects of a product and the potential impacts (positive and negative) of the product’s entire life cycle, the so called social LCA (S-LCA). The result of S-LCA is used to communicate social performance to stakeholders. The panel discussion of integrating social issues as part of LCA began in the 1990s due to S-LCA methodology having advanced to a point that resolved some issues regarding environmental LCA.
There have been many social LCA case studies conducted based on the UNEP/SETAC Guidelines for Social Life Cycle Assessment of Products [5]. Almost all social issues addressed in the S-LCA case studies assessed social impact in terms of a qualitative and semi-quantitative approach. In this regard, there is a lack of data on the social inventory in many social indicators.
Process-based LCA, economic input-output LCA (EIO-LCA), and hybrid LCA are the most widespread LCA approaches in the literature. However, the application of EIO-LCA in Thailand is limited by the availability of statistical databases and the type of products or services in sub-sectors in the economic input-output table. In addition, the lack of statistical data on sectoral energy consumption, environmental emissions, and social issues are barriers to EIO-LCA application in Thailand. Thus, it is difficult to develop a satellite matrix in the input-output (IO) model.
Social indicators in terms of quantitative, qualitative and semi-quantitative are issued in the UNEP/SETAC guidelines for social LCA. The social inventory includes five stakeholder groups: workers, local communities, consumers, society, and value chain actors [5]. There have been many social LCA studies around the world and many social issues proposed based on the ILO point of view. Examples of social LCA studies are as follows:
Dreyer et al. [6] proposed a framework for social LCA focusing on the fundamentals of universal criteria and company relevance. The proposed area of protection in respect of the social aspect is “Human Dignity and Well-being”. The S-LCA framework consists of two levels of impact categories—mandatory and optional. The method combines the bottom-up and top-down approach. In the bottom-up approach, relevant social issues from the company’s point of view should be considered. For a top-down approach, the parameters that identify what is valuable to society, which are relevant from a societal point of view, are assessed. In addition, six case studies to confirm the applicability and feasibility of the inventory and characterization steps of the method were conducted [7].
Benoit-Norris et al. [8] presented an overview of the social hotspots database (SHDB) development and features. The SHDB was developed over three years as a follow-up to the UNEP/SETAC Guidelines for S-LCA. It provided characterization indicator data on 191 countries and multiple sectors. The data were collected from over 200 data sources, mostly international organizations’ databases.
Macombe et al. [9] analyzed the possibilities and development needs for evaluating the social impacts of a biodiesel case study. The analysis focused on three levels: company, regional, and state level. The conclusion shows that in many cases it is not yet possible to carry out a S-LCA. The S-LCA at various levels would improve the methodology and empirical basis.
Hutchins et al. [10] provides a framework for characterizing and identifying key characteristics of social impacts associated with manufacturing throughout the life cycle using a process-based approach. Social impacts occur on various scales in manufacturing, from the level of a unit process to the level of the enterprise.
Martínez-Blanco et al. [11] performed a S-LCA case study of fertilizer production and application in cultivation. The method selected in the study was based on the UNEP/SETAC S-LCA guidelines and the social hotspots database (SHDB) was used to include social aspects related to background processes. The assessment performed was based on three geographical scales: country, sector, and company scales. In conclusion, the social indicators could be aggregated throughout the life cycle of the system. However, this approach could not be employed at company scale because data at this level are difficult to obtain for the entire life cycle.
In addition, there are some case studies on social impact analysis using an IO analysis (IOA). Almost all case studies are focused only on an employment analysis; for example, Garrett-Peltier [12] evaluated the employment impacts of renewable energy investment in US; Martinez et al. [13] assessed the social impact in term of employment for sugarcane-ethanol in Brazil; Chen et al. [14] looked at oyster farming in Taiwan; Tang et al. [15] examined Chinese petroleum industry; Lee and Yoo [16] evaluated the fisheries and aquaculture sectors in Korea; Ferrao et al. [17] addressed the packaging waste management system in Portugal; McBain and Alsamawi [18] assessed labor in global trade using multi-regional input–output analysis; Malik et al. [19] addressed the employment issue for lignocellulosic biofuel production in South Australia; Yang et al. [20] evaluated the employment impact for algae-derived biodiesel in China. There are two case studies concentrated on two social issues, such as Kucukvar et al. [21] who focused on income and work-related injuries for social sustainability assessment in US, and Alsamawi et al. [22] focused on the employment and income footprint of world’s nations. There are some case studies concentrated on many social issues such as Chang [23] who focused on accidents, fatality, employment, research and development personnel, science and technology (ST) personnel, and funding for ST activities for a construction project in China. Onat et al. [24] addressed the social impacts in term of income, government tax, and injuries for the US building sector using IO analysis. Simas et al. [25] addressed the six negative labor footprints, which consist of occupational health damage, vulnerable employment, gender inequality, share of unskilled workers, child labor, and forced labor associated with consumption, in seven world regions. Gómez-Paredes et al. [26] focused on six labor issues included collective bargaining, forced labor, child labor, gender inequality, hazardous work, and social security, for an Indian case study.
In Thailand, the relationship between economic growth, employment, and occupational health and safety has been investigated. The Thai Government has recognized the importance of occupational safety and health (OSH) issues in its National Agenda “Decent Safety and Health for Workers”. The agenda aims to reduce and prevent occupational accidents and illnesses in the workplace. The OSH Master Plan was developed to provide directions for the development of OSH in Thailand. It is necessary for continual collaboration between relevant stakeholders, including both public and private sectors, so as to enhance safety and health at workplaces in all sectors [27]. In addition, important social issues are female employment, working hours, wages and salaries, and health care cost.
To understand the embodied impacts of each economic sector on employment, working hours, wages and salaries, and occupational health and safety, this study developed the social inventory database based on input–output (IO) models regarding Thailand’s 2005 economic IO tables. The social issues included employment, number of female employees, working hours, wages and salaries, fatal accident and non-fatal accident cases).

2. Methodology

2.1. LCA Model

Life cycle assessment (LCA) is an effective tool for quantifying the environmental burden of products, processes or services during their life cycle from cradle to grave [28]. Various LCA studies have been conducted in the energy and environment fields. LCA approaches can be divided into three: process-based LCA, IO LCA, and hybrid LCA.
The process-based LCA requires information on energy, material, and resource inputs and environmental outputs for each stage in the product life cycle. The process-based approach was defined in the ISO 14040 framework; the general steps include goal and scope definition, inventory analysis, impact assessment, and interpretation [28]. The advantages of process-based LCA are the detailed process-specific analysis, specific product comparisons, and highly accurate results. However, limits of process-based LCA are that it is time and cost intensive.
The IO LCA has integrated energy and environmental aspects into the national economic input-output table which provides results on a macro-level. The economic input–output model was developed by Leontief [29] and is normally used as a quantitative model for national and regional economic analysis. The input–output analysis offers a static image of the relationships between the different economic sectors for a year and is expressed in monetary terms. Thus, the energy, environmental, and social issues of each economic sector could be calculated. The framework of the IO LCA model is a sector-by-sector economic interaction. The evaluated results on energy, environmental, and social aspects based on the IO model are the mean value of goods and services provided by each sector. The advantage of the IO LCA model is a comprehensive system boundary, reproducible results, and time and cost savings [30]. However, the limitations of IO LCA are that it provides rough analyses for specific, individual products, and has a high dependency on available data.
Due to the disadvantages of both process-based LCA and IO LCA, a hybrid LCA was proposed to appropriate the approach. A hybrid LCA integrates process-based and IO LCA, to balance time and cost efficiency. Based on the hybrid LCA models, the upstream impacts of goods could be included in an economy-wide scope, and impacts on the production, usage and end-of-life phases could be specifically analyzed [31].
The social impacts are effects on the sustainable operation of society such as employment, salaries, and occupational safety. A social LCA is a social impact (and potential impact) assessment technique that aims to evaluate the social and socio-economic aspects of products and their potential positive and negative impacts during their life cycle, including: extraction and processing of raw materials, manufacturing, distribution, use, re-use, maintenance, recycling, and final disposal [5]. In comparing the environmental LCA and social LCA, the research scope and framework of social LCA has not been fully formed and needs further development.

2.2. Social Inventory Database Development Based on IO Model

The IO model is widely applied to conduct national economic analyses and is used to assess macro-economic impacts of production change. This study uses the 2005 IO table of Thailand which consists of 180 × 180 sectors in the analyses by aggregating it into a new format (96 × 96 sectors) to match the sector divisions used with the published data on employment, working hours, wages, and occupational safety. The aggregation was based on the proportion of each economic sector output. Definition of economic sectors for the new aggregated IO table (96 × 96 sectors) are shown in Table A1, in the Appendix.

2.2.1. Matrix of Direct Input Coefficient

The direct input coefficient is the ratio of the intermediate demand inputs (sales from sector i to sector j) (Xij) and the total output of sector j (Xj). The set of input coefficients of all economic sectors is expressed in the square matrix A (n × n), which is called the direct input coefficient matrix. n is the number of sectors or the dimension of economic system. The matrix A defined as:
A = aij = Xij/Xj        (i, j = 1, … , n)
Since the time and statistics are data limitations, similar sectors are often aggregated or merged for all individual outputs into one aggregated output. This study developed the input coefficient matrix based on the 2005 economic IO table of Thailand with aggregated data for 96 × 96 economic sectors.

2.2.2. Matrix of Social Footprint Coefficient

The modified IO model adds a row for social aspects to show the social issues involved in production processes, thus quantifying the social footprint for the final demand in different sectors. The social footprint matrix (S) is the extension of the direct input coefficient matrix for social issues. Where S is a k x j matrix, skj is social issue k (e.g., employment, accident cases) per monetary output of sector j. The matrix S is defined as:
S = skj = Skj/Xj        (k = 1,…, m; j = 1, … , n)
This study analyzes six different social impacts, the dimensions of the social aspects matrix are S (6 × 96). Elements in the social aspects matrix reflect the impacts per sectoral output, e.g., 100 working-hours per 1000 Thai Baht for the paddy rice sector.

2.2.3. Final Demand Vector

Final demand vector (Y) is the economic demand of goods or services. Final demand can be divided into six categories: household consumption, private consumption expenditures, government consumption, gross domestic fixed capital formation, increase in stock, and exports. Based on the IO model, the final demand vector is chargeable for the scale of the results such as the impacts of one million Thai Baht, or total annual output of an interest sector. In this study, the total scale of social impacts for each economic sector in Thailand was calculated from the total annual output in 2005.

2.2.4. Calculation of Total Social Impacts

The total social impact vector (f) of goods or services versus a given amount for economic demand is
f = S   ( I A ) 1  Y
where A is the direct input coefficient matrix (calculated by dividing the industry-by-industry direct requirements of sectoral inputs by the sectoral output); I is the identity matrix; S is the social footprint matrix; and Y is the final demand vector. (I − A)−1 is the matrix of input–output multipliers and shows the total effects (direct and indirect) on sectoral production caused by unitary changes in the final demand of sectors.

2.3. Data Processing

This study developed the social inventory database based on the IO model using Thailand 180-sector input–output table in 2005 [32]. The social inventory established in this study included employment, female employment, working hours, wages and salaries, occupational accidents and fatalities. The summary of social indicators used in this study is presented in Table 1.
Table 1. Summary of social indicators used in the study.
MeasureIndicatorsUnitDefinitionData SourceData Year
EmploymentTotal employmentPersons-yearTotal employment required for the production of goods and servicesNSO (2006) [33]2005
Gender inequalityFemale employmentPersons-yearTotal female employment required for the production of goods and servicesNSO (2006) [33]2005
Working hoursWorked hoursHours-yearTotal number of hours actually worked per year for the production of goods and services. Actual hours worked include regular work hours of full-time, part-time workers, self-employed workers, and exclude time not worked.BOT (2014) [34]2005
Wages and salariesIncomeMillion Thai BahtThe compensation by employers to employees. Employees are classified as long-term workers, temporary workers, executives and hired laborers in the agricultural sector, but excluded family workers.NSO (2006) [35]2005
NSO (2007) [36]2006
NSO (2007) [37]2006
Fatal occupational casesFatal cases in workplaceCases-yearCases where workers were fatally injured as a result of occupational accidents, and where death occurred within one year of the day of the accident.SSO (2006) [38]2005
Non-fatal occupational casesNon-fatal cases in workplaceCases-yearCases of occupational injury where the workers injured were unable to work temporarily or permanently from the day after the day of the accident.SSO (2006) [38]2005
Sectoral employment and female employment is the sum of both formal and informal employment in Thailand gathered from the Labor Force Survey of 2006 [35]. However, the published sector based data are limited and fail to reflect the whole picture of employment in Thailand, e.g., farmers are not classified into a sub-sector. In the case of aggregated data, this study allocated the numbers of employment for each sub-sector based on economic value.
Working hours (WH) for the agriculture sector is classified into two categories: WH of employees and WH of self-employed workers and family workers. WH of employees is calculated from the ratio of the total wage paid by the primary sector from the 2005 IO table and minimum wage rate of each province in the planting of each crop. WH of self-employed and family workers was estimated by work day based on the planting period of each crop and allocated the WH for self-employed and family workers to each crop based on the economic value of each crop.
The WH of industrial sectors and service sectors were calculated from the working hour statistic data of Thailand [34]. In case of aggregated data, this research allocated the working hours to each sub-sector based on the employment numbers of each sector.
Likewise, the intensity for wages and salaries indicator was calculated. This data are from the 2007 Industrial Census Whole Kingdom of Thailand [36], the 2006 Business Trade and Service Survey of Thailand [33] and the Statistical Yearbook Thailand 2007 [37].
The database for occupational accidents and fatalities was gathered from Thailand’s Social Security Office [38]. The database included only formal labor (permanent labor) defined under the Thailand Social Security Act. The database excluded informal labor and public servants. The accident and fatality statistics were allocated to each sector based on sectoral economic outputs.

3. Results

3.1. Employment

3.1.1. Employment Intensity
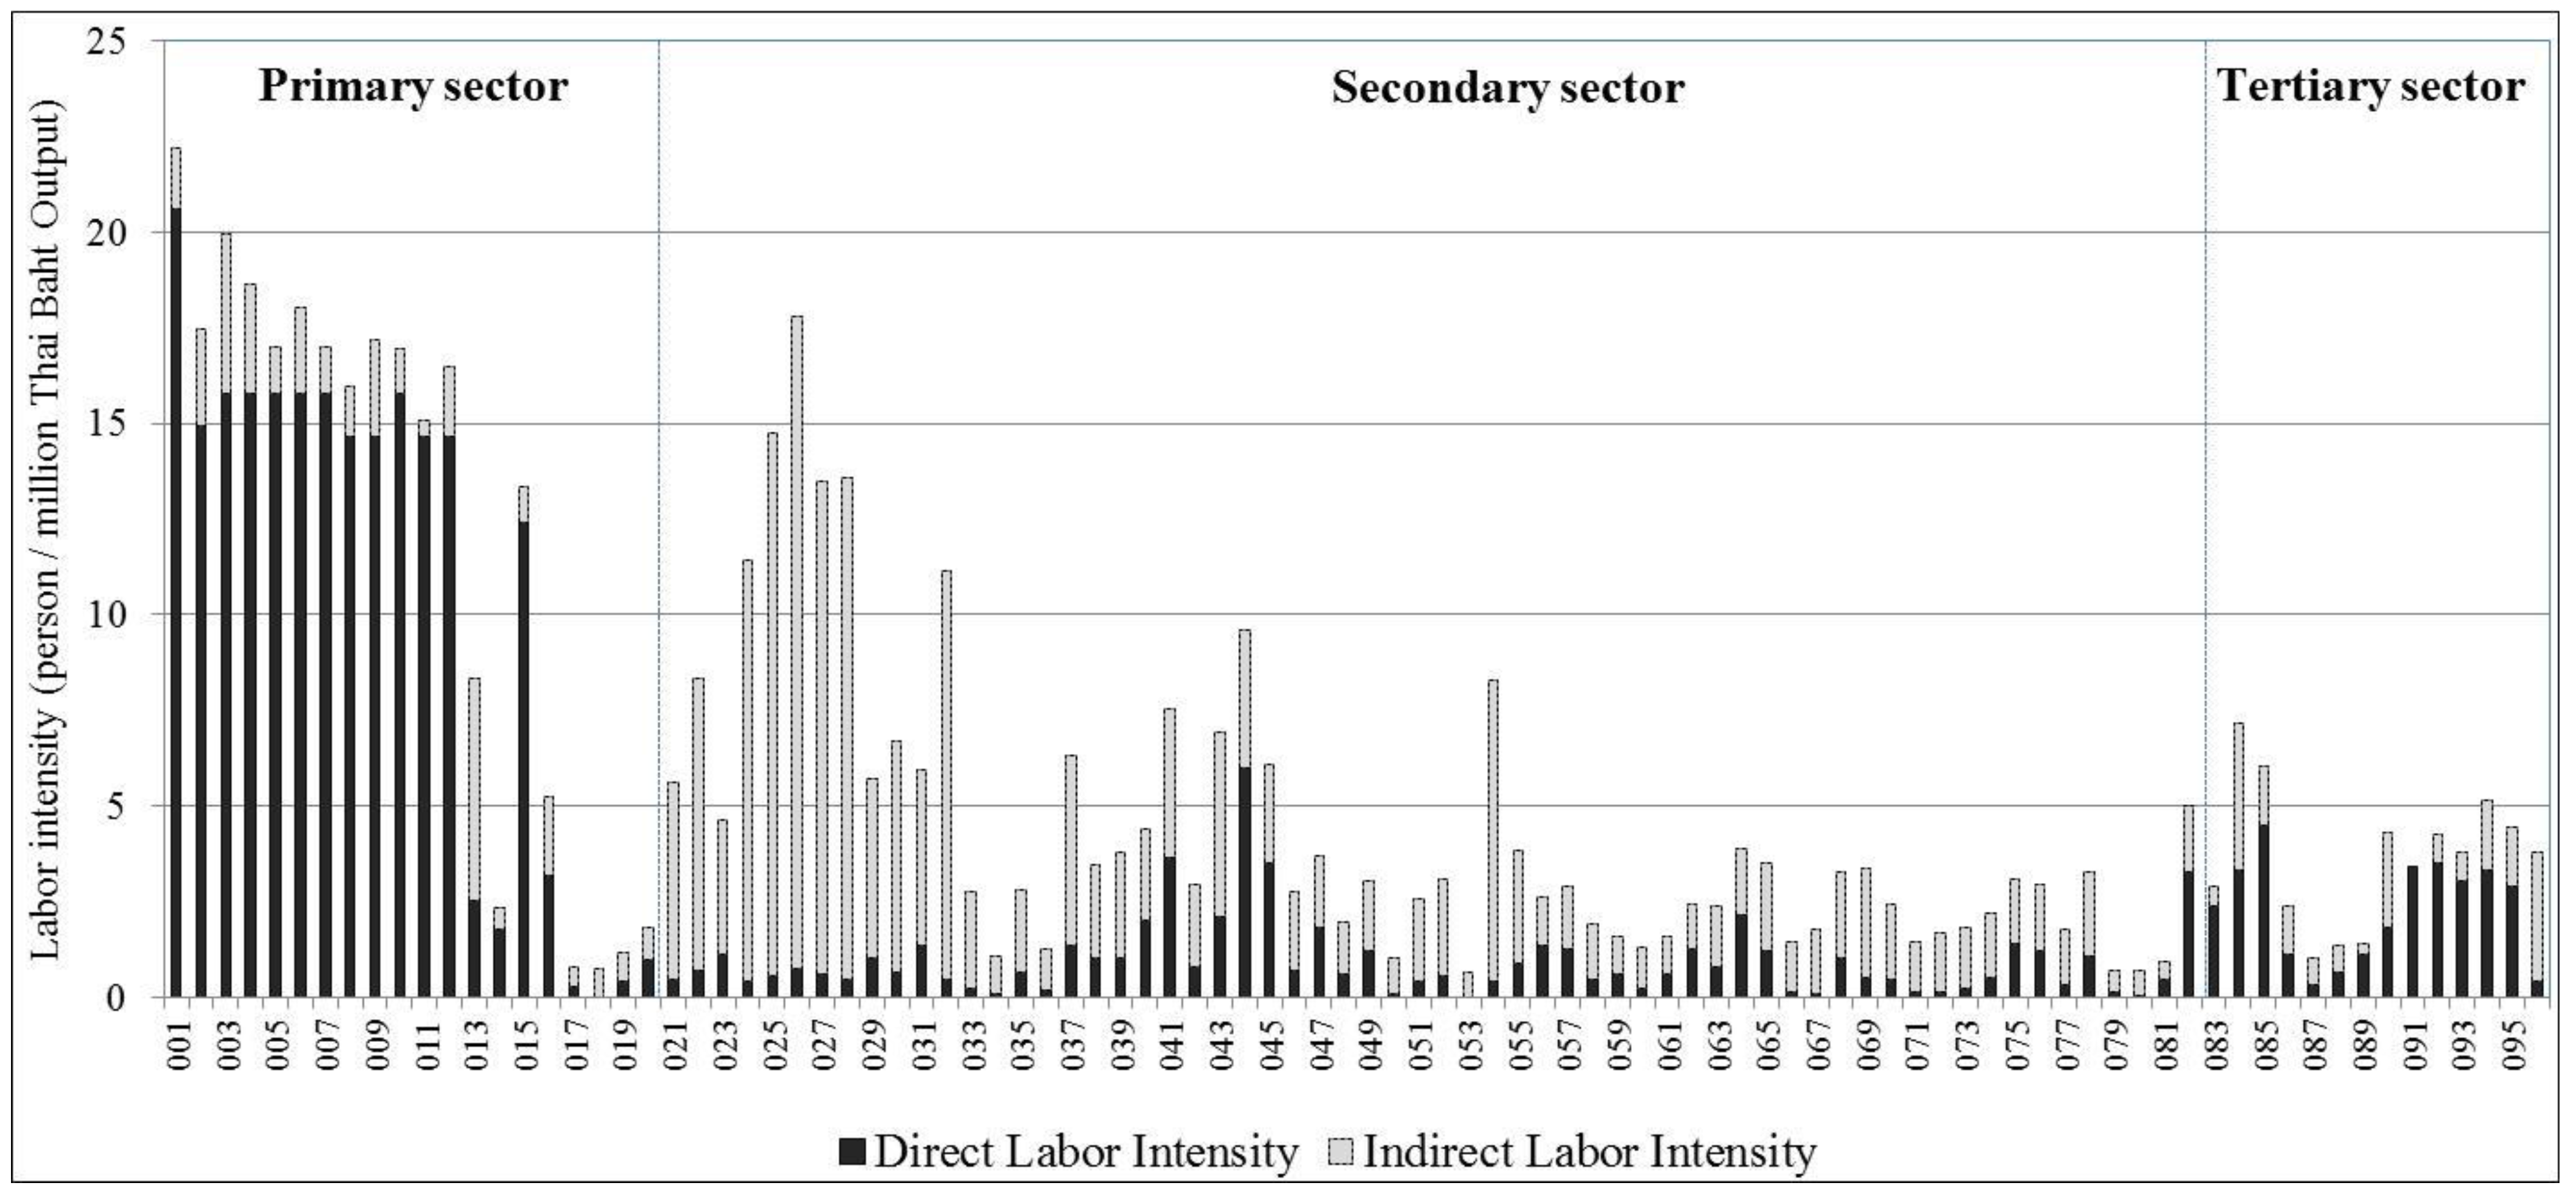
The employment intensity expressed in terms of person-year per million Thai Baht output of 96 industrial sectors is given in Figure 1. The largest employment intensity is in paddy rice, accounting for 22.21 person-year/million Thai Baht output. The highest intensity in the paddy crop was attributed to the low economic value of the product with a large amount of labor used in the cultivation. The next was cassava (19.95) followed by beans and vegetables (18.66), sugarcane (18.03), rice milling (17.80), maize and other grain (17.48), tobacco (17.20), fruits (17.01), oil palm (17.00), and coffee and tea (19.95), respectively. Due to the fact that agriculture in a developing country is labor intensive, the agricultural sector has the highest employment intensity in both direct and total intensity excluding livestock and fisheries.
Food and related sectors show six categories out of the top 20: Rice milling and grinding of maize (17.80), animal and vegetable oil (14.75), flour and other grain milling (13.56), tapioca milling (13.48), coconut and palm oil (11.43), and animal feed (11.17). It was shown that the majority of these sectors are agricultural and they are in the food production chain.
From Figure 1, it was found that in 2005, direct labor intensity in the agricultural sector was very high. Given high labor employment in this sector, it largely dragged down the country’s overall labor productivity. The result showed that the employment intensity in the agricultural sector has greater direct labor intensity, whereas the industrial sector has a higher share of indirect labor. Especially, food processing sectors have a greater portion of indirect labor due to the influences from the primary sector. It may be caused by the impact of food crops as raw materials. More than 50% of labor use was indirect labor in most manufacturing sectors in Thailand. For the tertiary sector, the restaurant and bar sector showed the greatest employment intensity; 54% of the labor is indirect labor. The next was the hotel and guest house sector followed by medical and sanitary services sectors, respectively.
Figure 1. Employment intensity by economic sector.
Sustainability 07 07684 g001

3.1.2. Employment Footprint

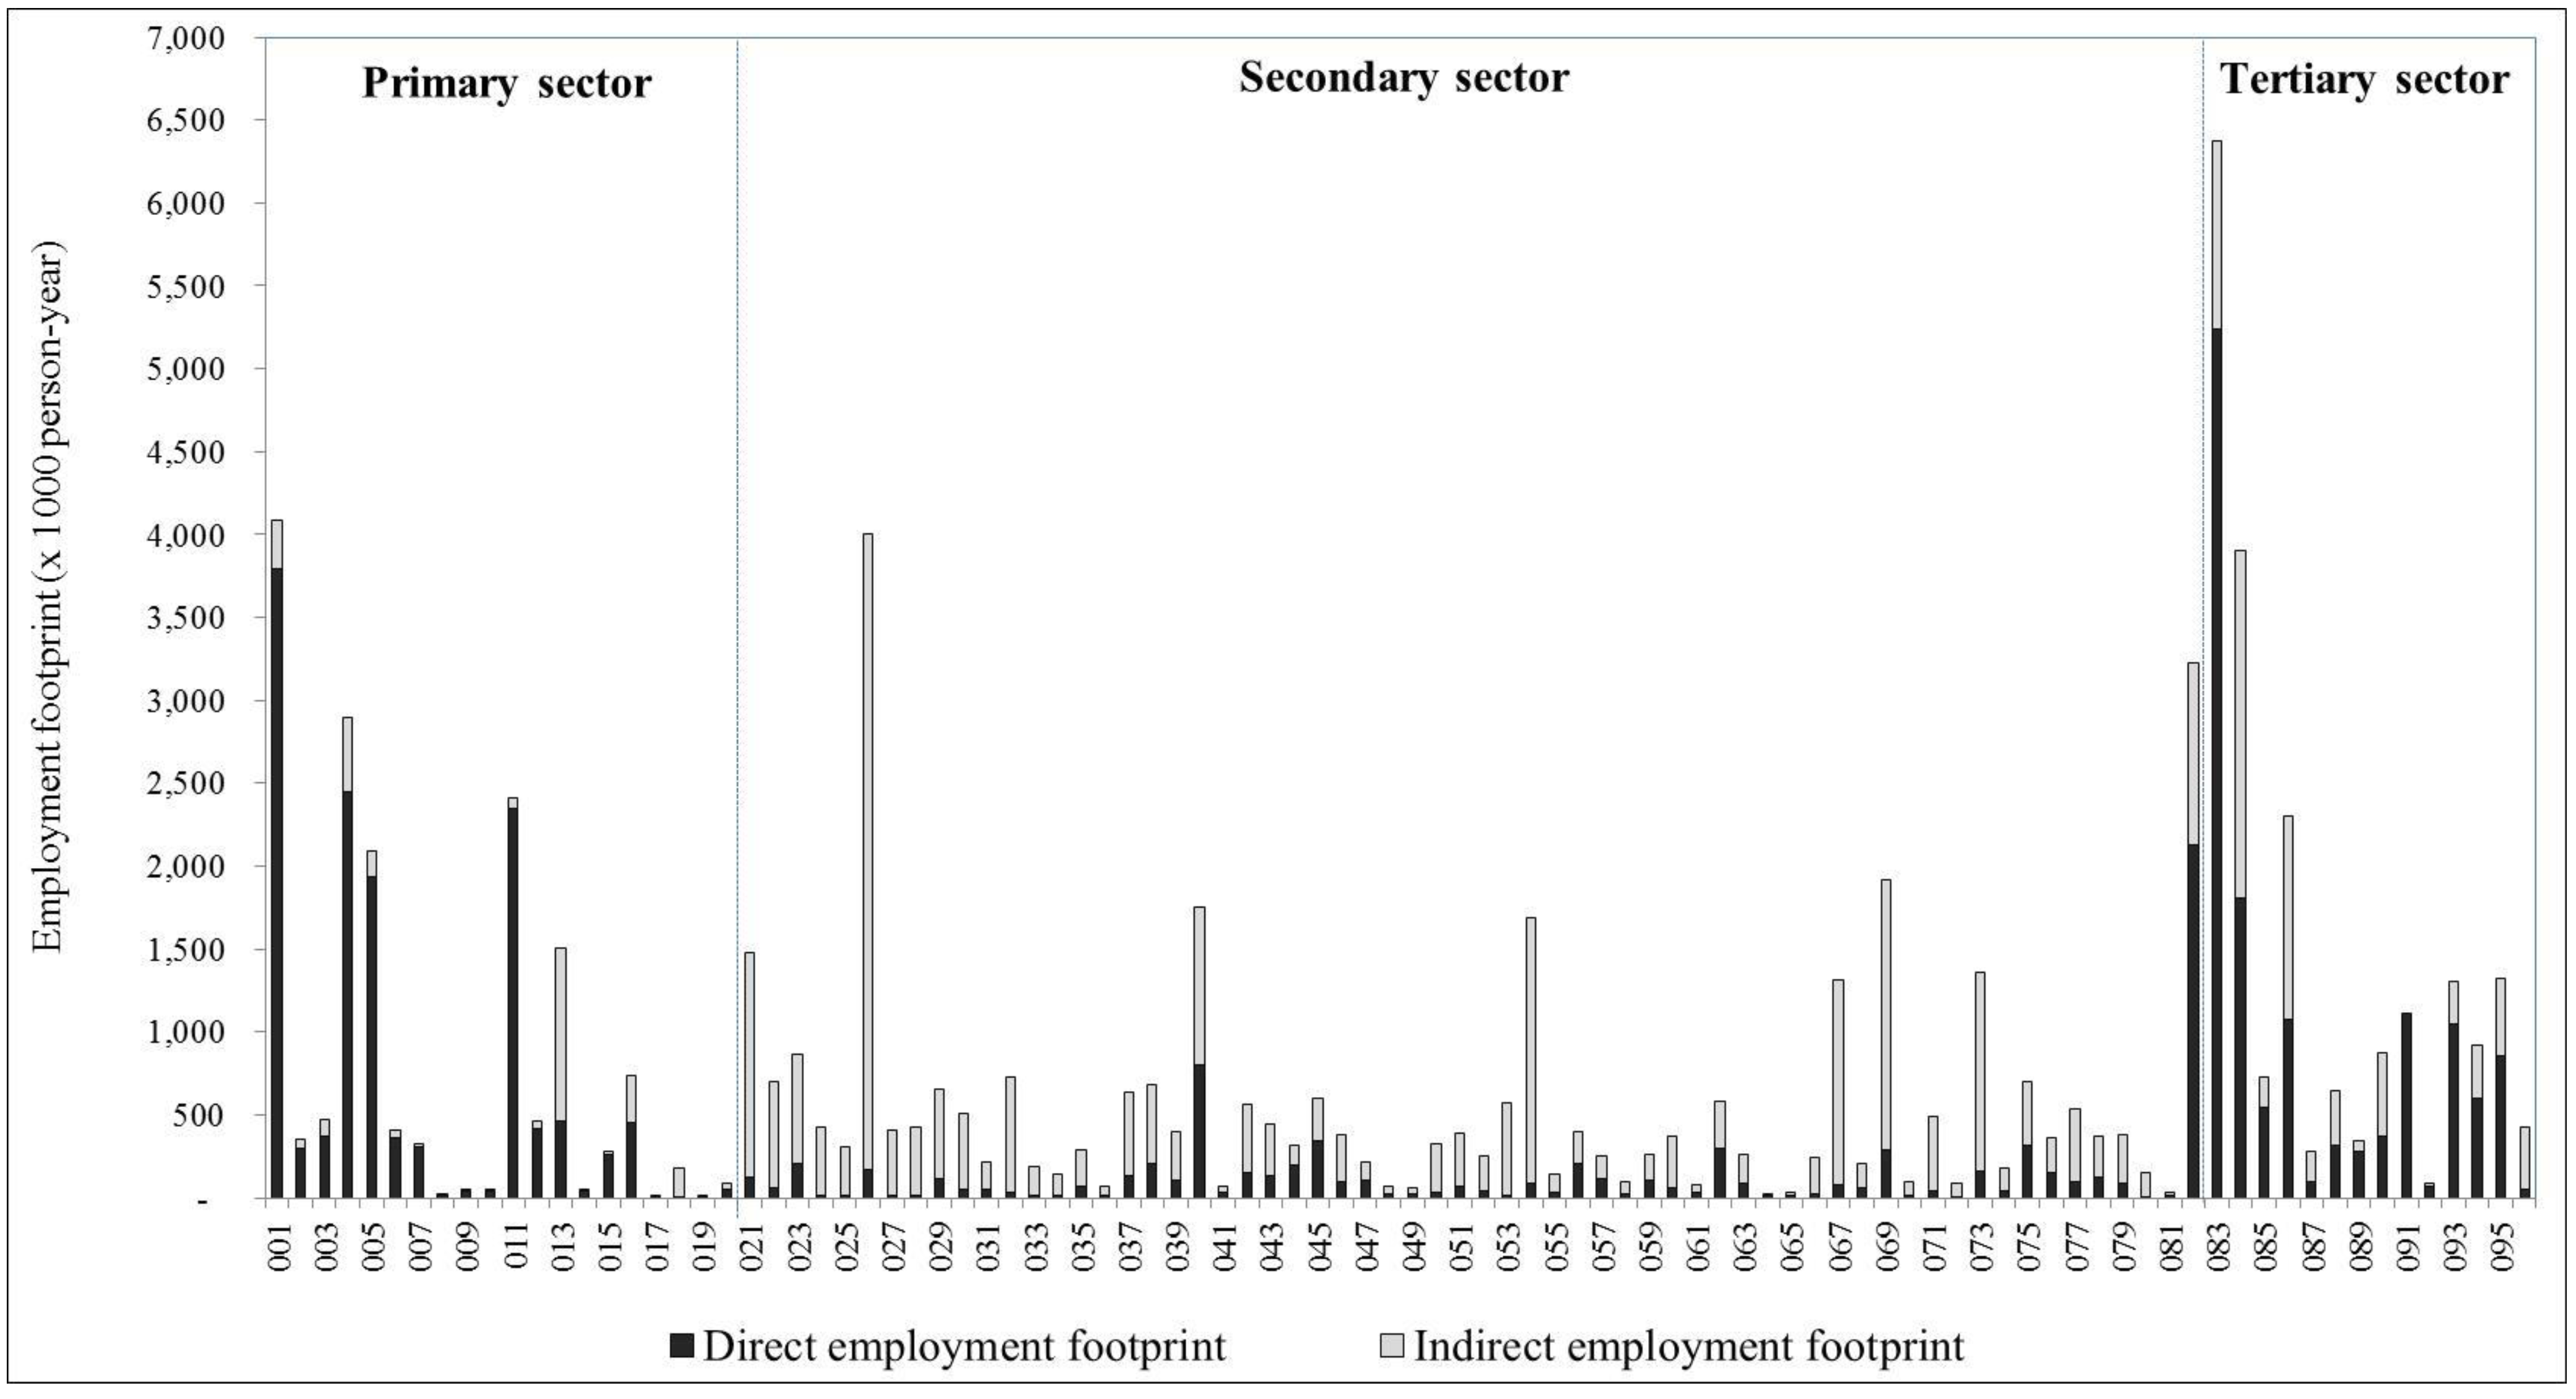
The results of the total embodied employment or employment footprint are presented in Figure 2. Compared to employment intensities, the ranking changes and the most important labor intensive sector becomes the wholesale and retail trade sector (direct 5.24 and total 6.37 million person-year), followed by paddy (direct 3.79 and total 4.09 million person-year), rice milling (direct 0.17 and total 4.01 million person-year), restaurant (direct 1.81 and total 3.90 million person-year), construction (direct 2.13 and total 3.23 million person-year), beans and vegetables (direct 2.45 and total 2.89 million person-year), rubber (direct 2.35 and total 2.41 million person-year), transportation (direct 1.07 and total 2.30 million person-year), fruits (direct 1.94 and total 2.09 million person-year), and radio and television sectors (direct 0.29 and total 1.92 million person-year), respectively. The description of this change is the high final demand of the wholesale and retail trade, radio and television, restaurant, construction, and transportation sectors that imply smaller employment intensity. At the same time, the small final demand of paddy, rubber, beans and vegetables, and rice milling sectors imply a larger intensity of employment. The bigger indirect employment sectors are the rice milling and restaurant sectors due to the agricultural sector using raw materials.
According to the informal labor survey in 2005 (NSO, 2005) [39], the number of informal workers with no social security and protection was estimated at 21.8 million, or 61.5% of the total employed workforce of 35.5 million. About 57% of informal labor or 12.5 million workers were employed in the agricultural sector while 35% and 4% worked in the trade and service sector and manufacturing sector, respectively. In addition, half of employment is considered weak employment, which means being self-employed with no employees or having unpaid family workers.
Figure 2. Total employment footprint by economic sector.
Sustainability 07 07684 g002

3.2. Female Employment

3.2.1. Female Employment Intensity
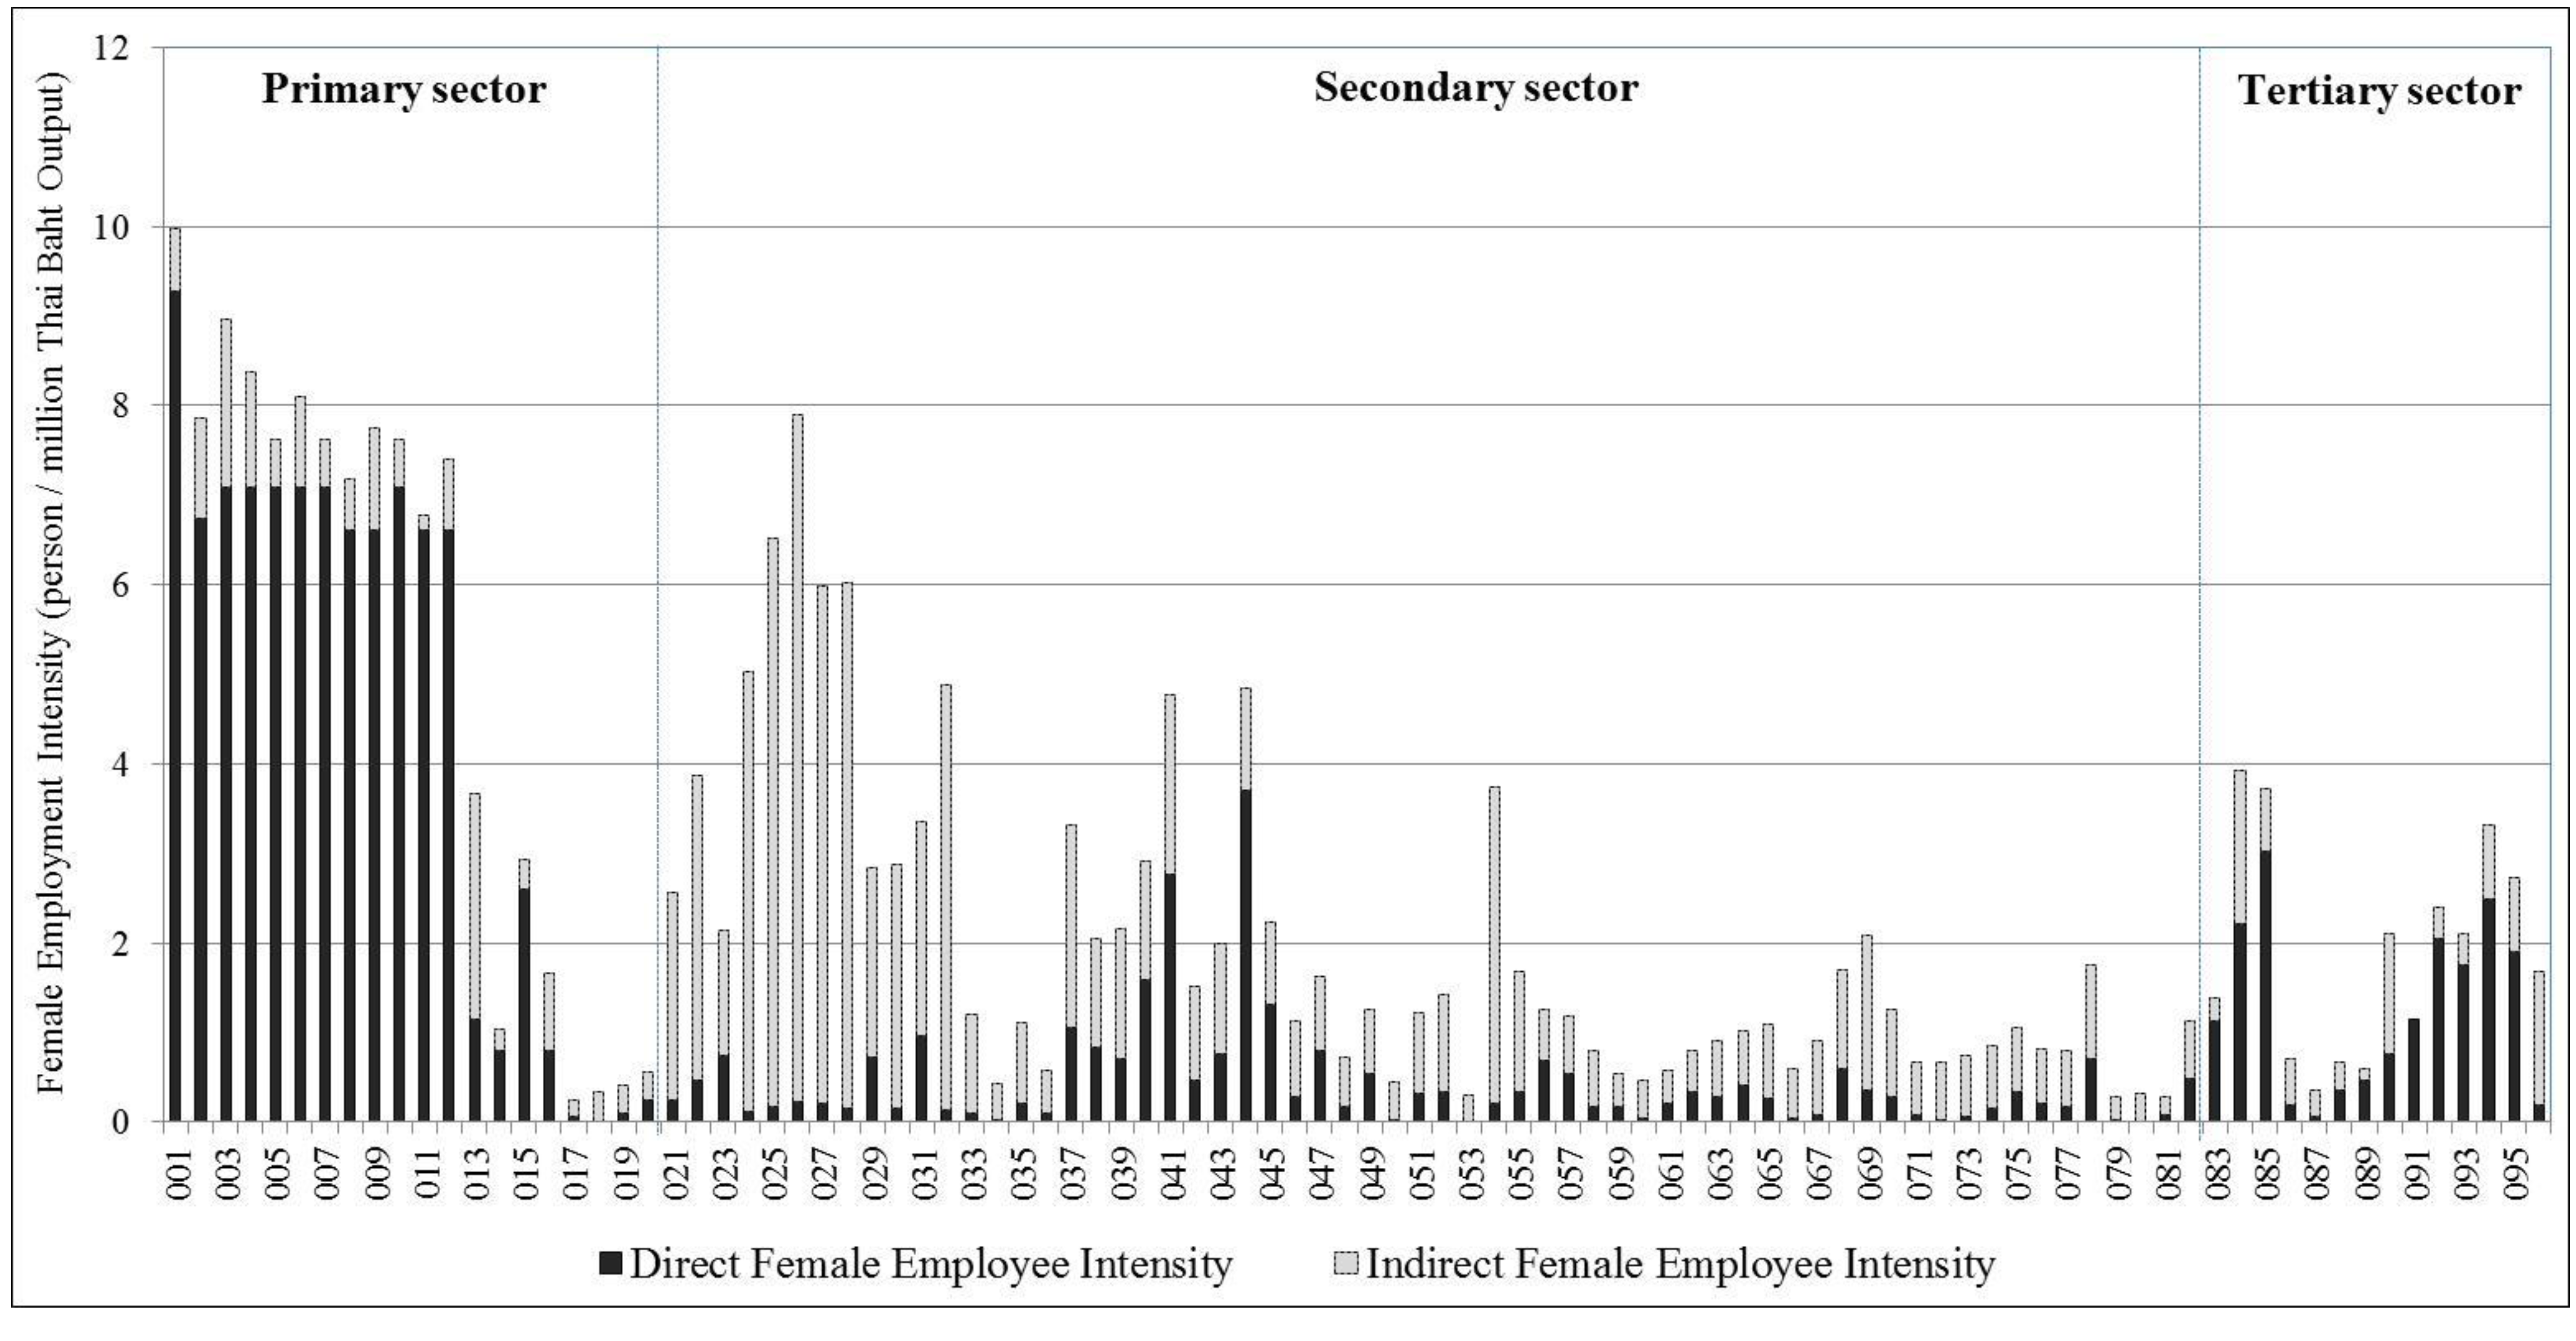
Figure 3 shows the female employment intensity from 96 industrial sectors. The largest female employment intensity is paddy rice accounting for 9.98 person-year/million Thai Baht output. The high intensity in the paddy crop was attributed to the low economic value of the product with a great deal of labor used in the cultivation. The next was cassava (8.96) followed by beans and vegetables (8.38), sugarcane (8.10), rice milling (7.89), maize and other grain (7.85), tobacco (7.76), fruits (7.63), oil palm (7.62), and coffee and tea (7.62), respectively. The result shows that the female employment intensity is in line with the total employment intensity. There are only 19 industrial sectors in which the female employment proportion is more than male employment. Especially, the secondary and tertiary sectors including textiles and leather products, coffee and tea processing, wood and cork products, electrical and electronics industry, hotel, restaurant, sanitary and similar services, education and research, medical, and other services. In the secondary sector, the result showed the highest numbers pf recruits of female workers were in the textiles and electronics sectors. The overall labor force participation rate of female workers is 14.5% below male workers. Female workers should take up more paid employment and seek gender equality.
Figure 3. Female employment intensity by economic sector.
Sustainability 07 07684 g003

3.2.2. Female Employment Footprint

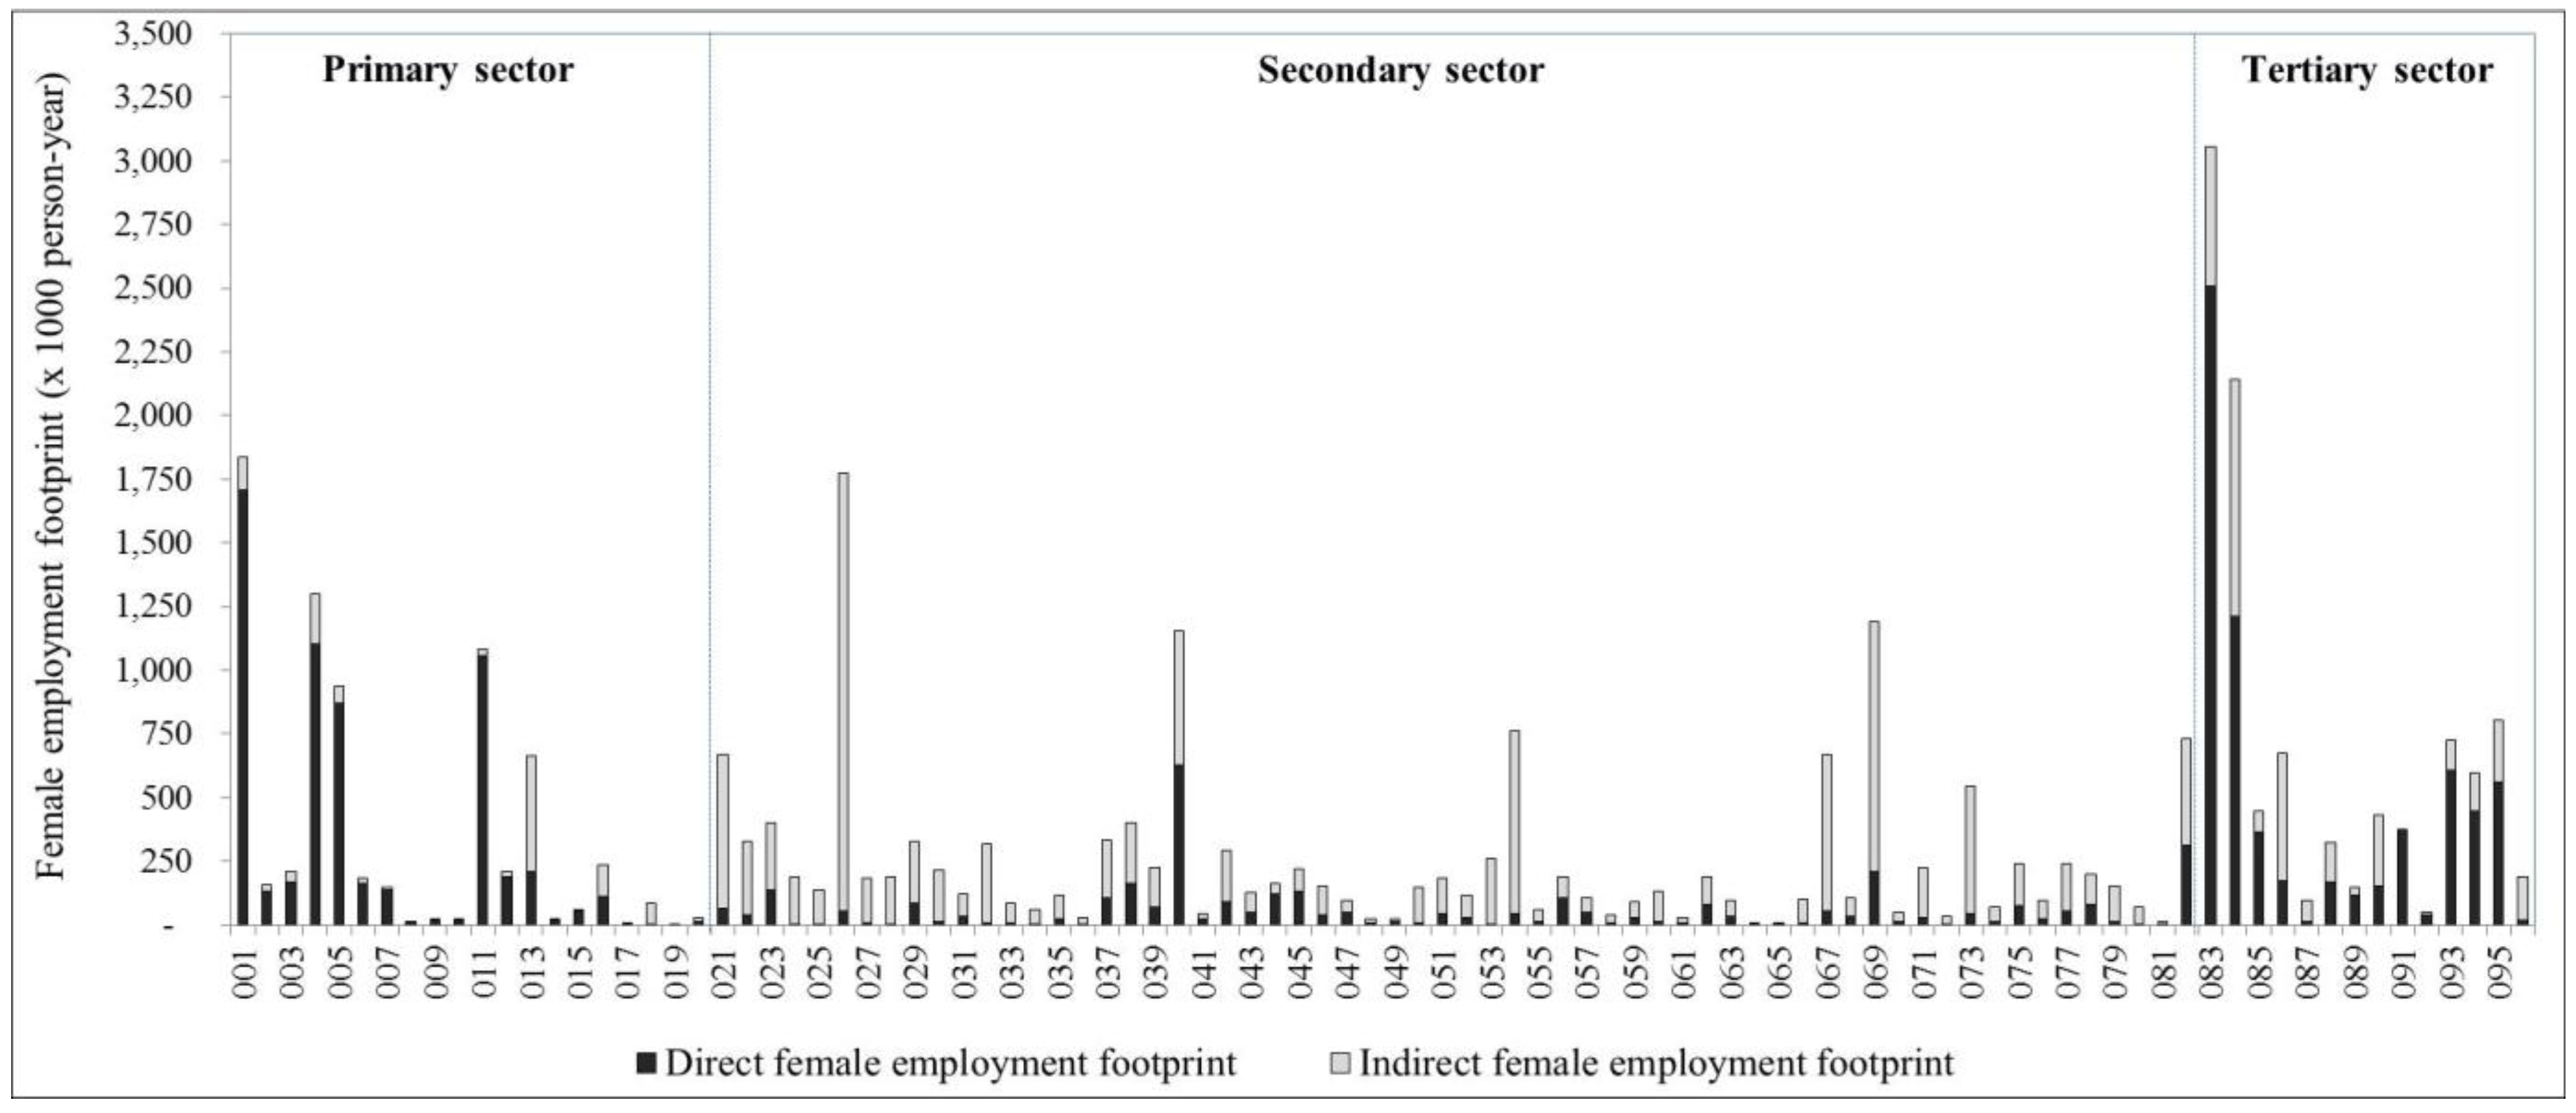
Figure 4 shows the results of the female employment footprint, which is similar to the total employment footprint in some rankings. When compared with the female employment intensities, the ranking changes and the most important female labor intensive sector becomes the wholesale and retail trade sector (direct 2.51 and total 3.06 million person-year), followed by restaurant (direct 1.21 and total 2.14 million person-year), paddy (direct 1.71 and total 1.84 million person-year), rice milling (direct 0.05 and total 1.78 million person-year), beans and vegetables (direct 1.10 and total 1.30 million person-year), radio and television (direct 0.21 and total 1.19 million person-year), clothing except footwear (direct 0.63 and total 1.15 million person-year), rubber (direct 1.06 and total 1.08 million person-year), fruits (direct 0.87 and total 0.94 million person-year), and other services (direct 0.56 and total 0.81 million person-year), respectively. These results stem from the high final demand of the wholesale and retail trade, radio and television, restaurant, clothing except footwear, and other services sectors that have smaller female employment intensity. At the same time, the small final demand of paddy, beans and vegetables, rubber, fruits, and rice milling sector implies a bigger intensity of female employment. The bigger, indirect female employment is in the rice milling and restaurant sectors due to the agricultural sector using raw materials.
Figure 4. Female employment footprint by economic sector.
Sustainability 07 07684 g004

3.3. Working-Hours

3.3.1. Working Hour Intensity
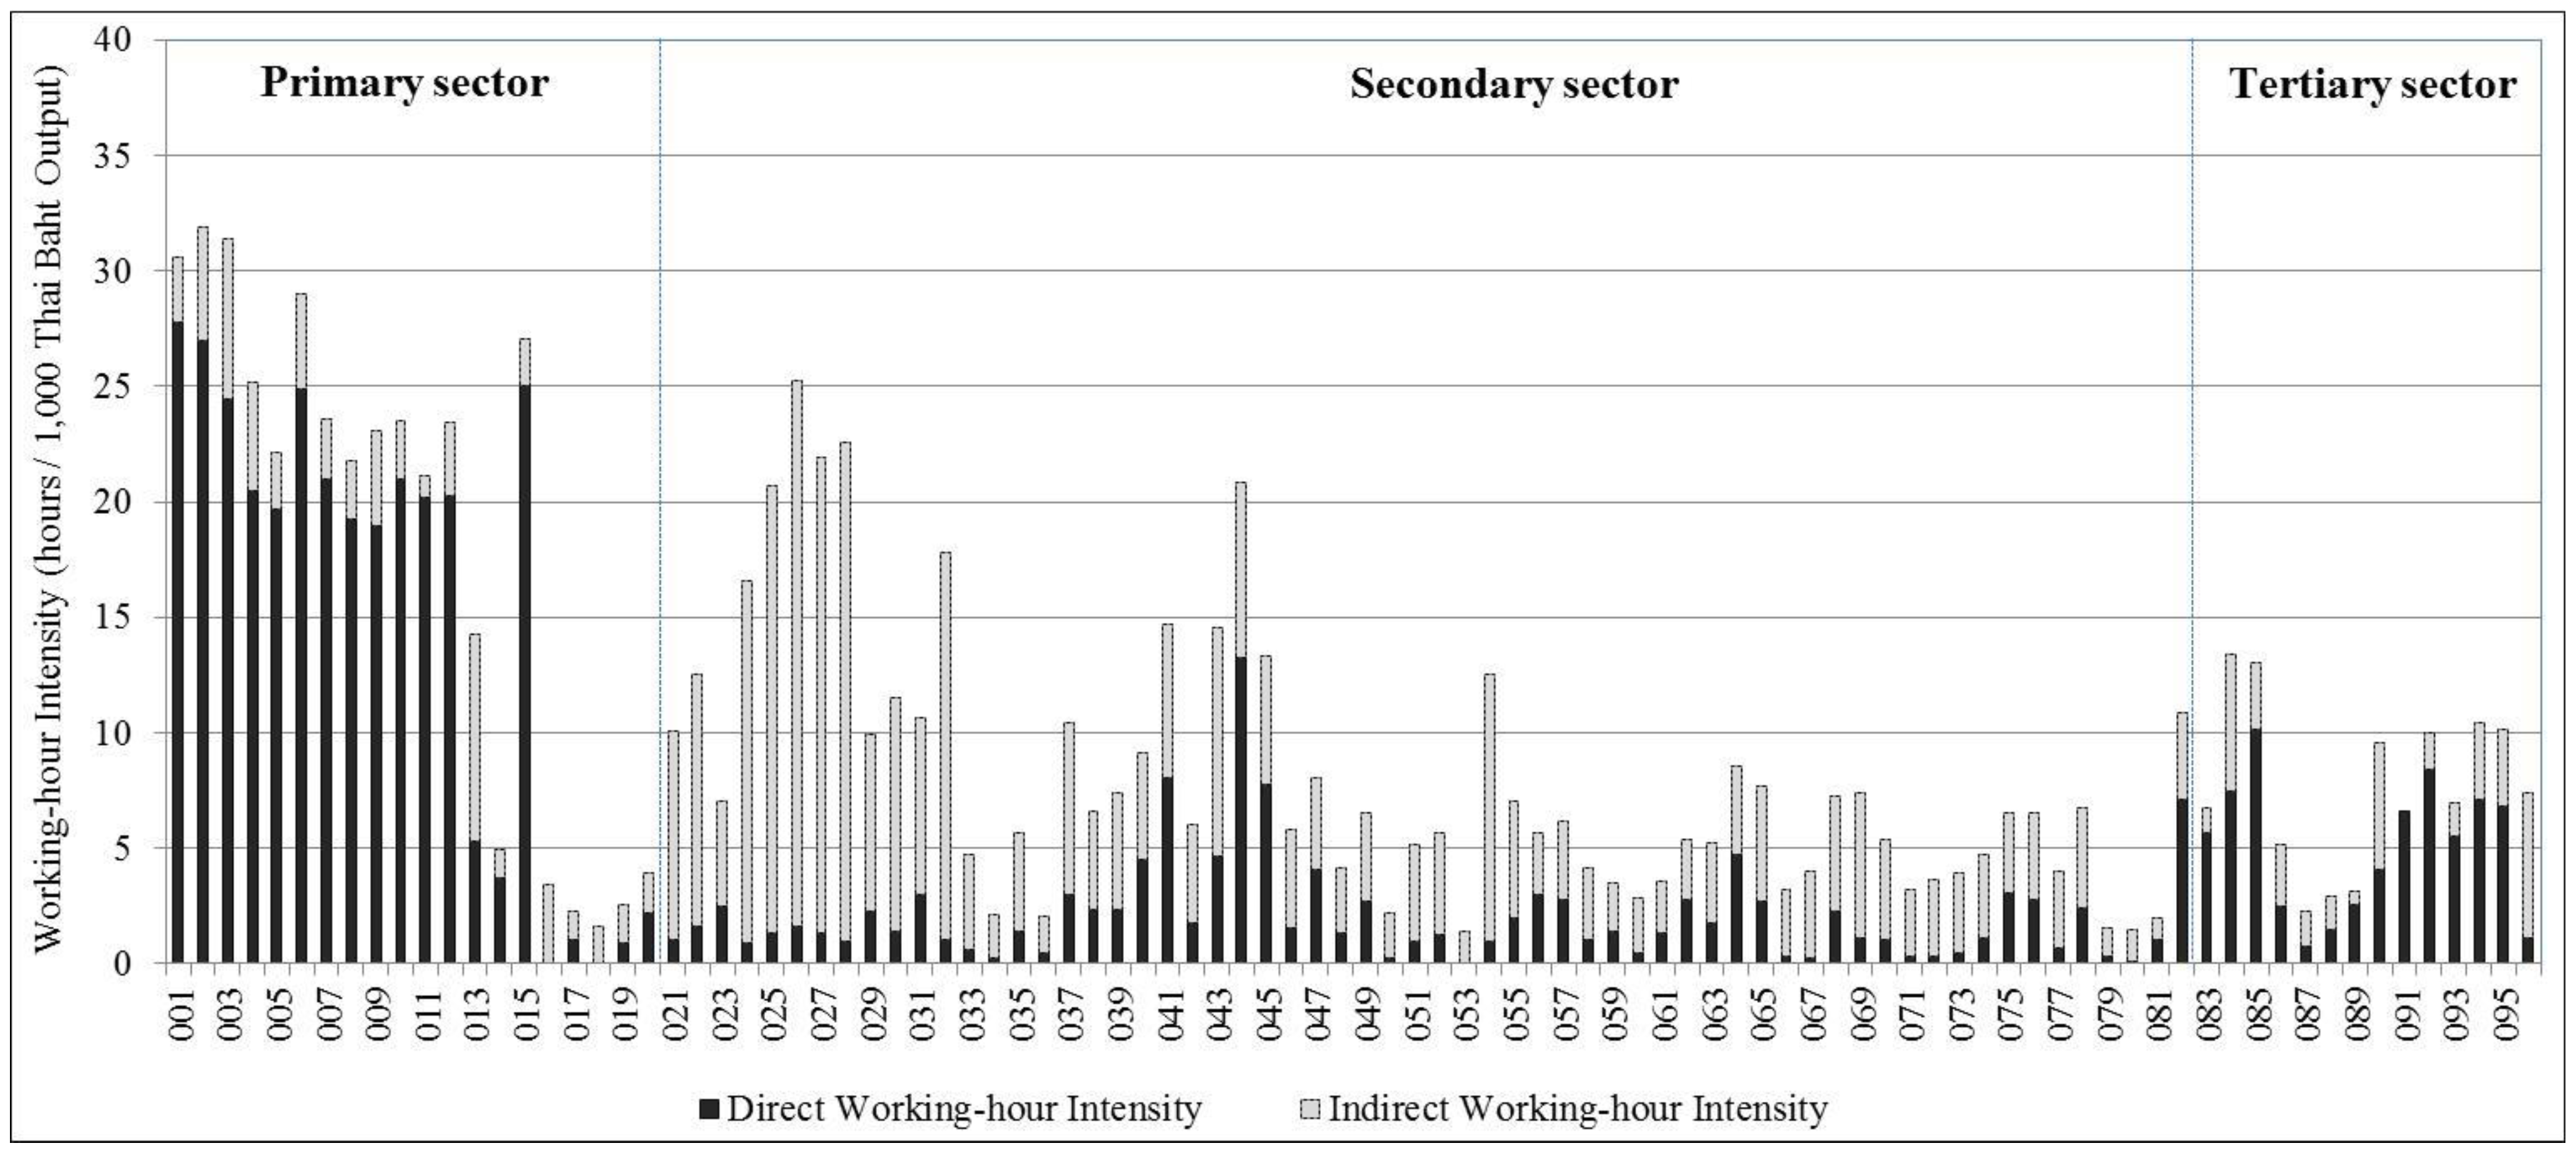
The top 20 in working hour (WH) intensity are in the agricultural and food processing sectors among the 96 industrial sectors, and this is given in Figure 5. The largest working hour intensity is maize and other grain accounting for 31,869 h/million Thai Baht output or 15.93 FTE/million Thai Baht output (1 FTE or full time equivalent is estimated 2000 h/year). The highest intensity in maize and other grain crops were attributed to the low economic value of the product with working hour intensity in the cultivation and harvesting stages. The second highest was cassava followed by paddy, sugarcane, and forestry, respectively.
Figure 5. Working-hours intensity by economic sector.
Sustainability 07 07684 g005
Food and related sectors show six categories out of the top 20: Rice milling and grinding of maize, flour and other grain milling, tapioca milling, animal and vegetable oil, animal feed, and coconut and palm oil, respectively. The majority of these sectors are agricultural, and they are in the food production chain.
The results for working hour intensity show that agricultural sector and service sector had greater direct WH intensity whereas the manufacturing sector had higher share of indirect WH. Especially, the food processing sectors have greater portion of indirect WH though food processing is classified as a primary sector. It may be caused by the impact of the food crops as raw materials. WH patterns vary greatly both in concentration and distribution by sector. Wholesale and retail trade, construction, and service sectors often contribute a large share of WH in the tertiary sector.

3.3.2. Working Hour Footprint

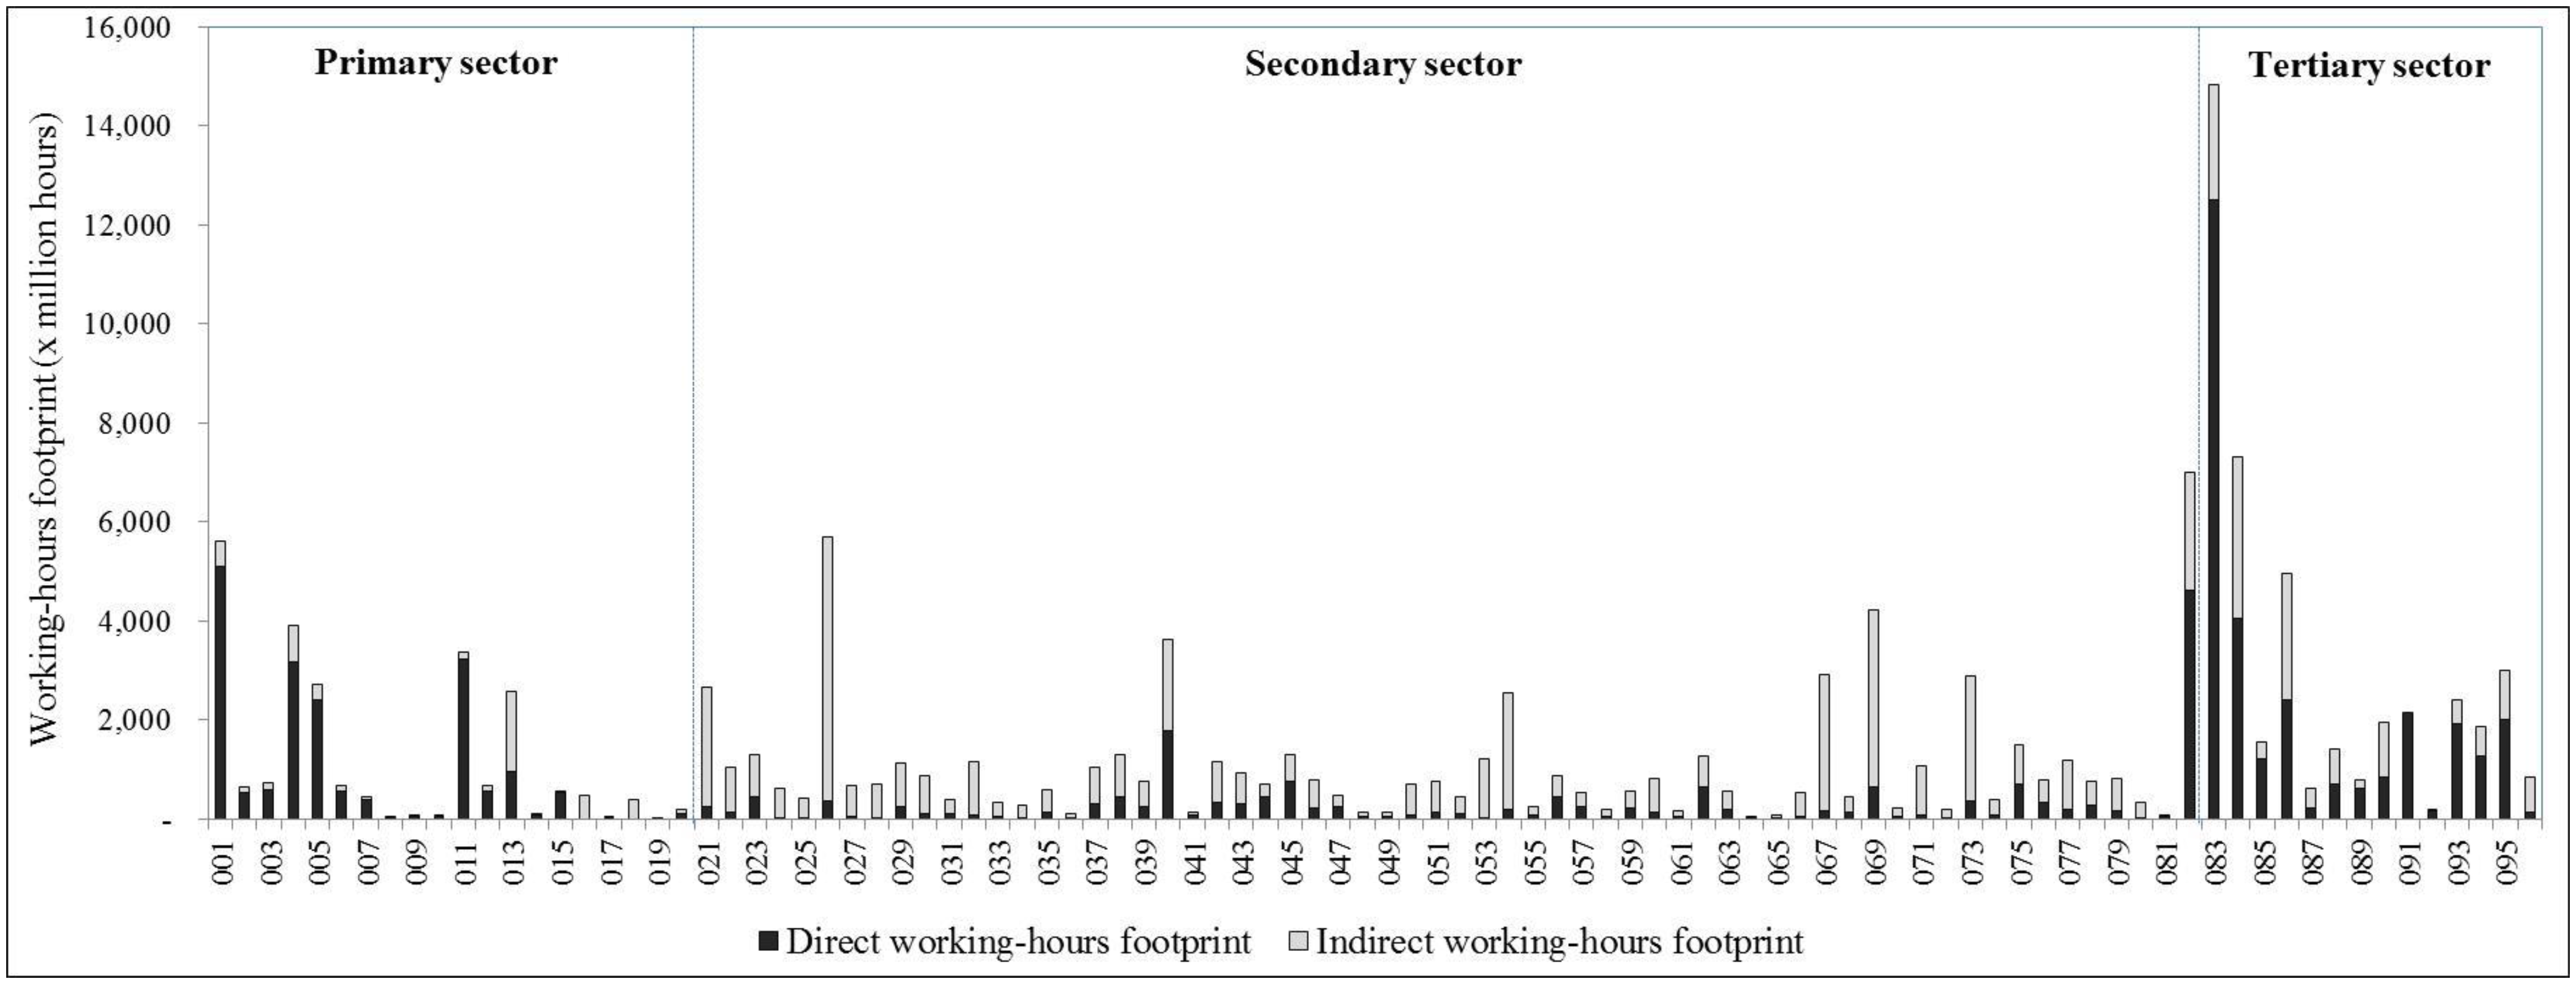
Figure 6 shows the result of the working hour footprint by economic sector. Compared to working hour intensities, the ranking changes, and the most important working hour intensive sector becomes wholesale and retail trade, followed by restaurant, construction, rice milling, paddy, transportation, radio and television, beans and vegetables, clothing except footwear, and rubber sectors, respectively. This change may be explained by the high final demand of the wholesale and retail trade, construction, restaurant, radio and television, and transportation sectors that indicates smaller working hour intensity of these sectors. Also, the small final demand of paddy, rice milling, beans and vegetables, and rubber sector indicates bigger working hour intensity. The bigger indirect working hours lie in the rice milling and restaurant sectors due to raw materials being used in the agricultural sector.
Figure 6. Working-hours footprint by economic sector.
Sustainability 07 07684 g006

3.4. Wages

3.4.1. Wages Intensity

The IO table gives the data on the average wages paid to employees. In each sector, the average wages of employees are different. Pay in each economic sector shows the amount of earnings that are directly required to produce one unit of production of that sector. Wages are a part of the production cost in each sector. Thus, if a component of the production of any sector is used as an input for production of other sectors, its increased price affects the production cost in other sectors as well.
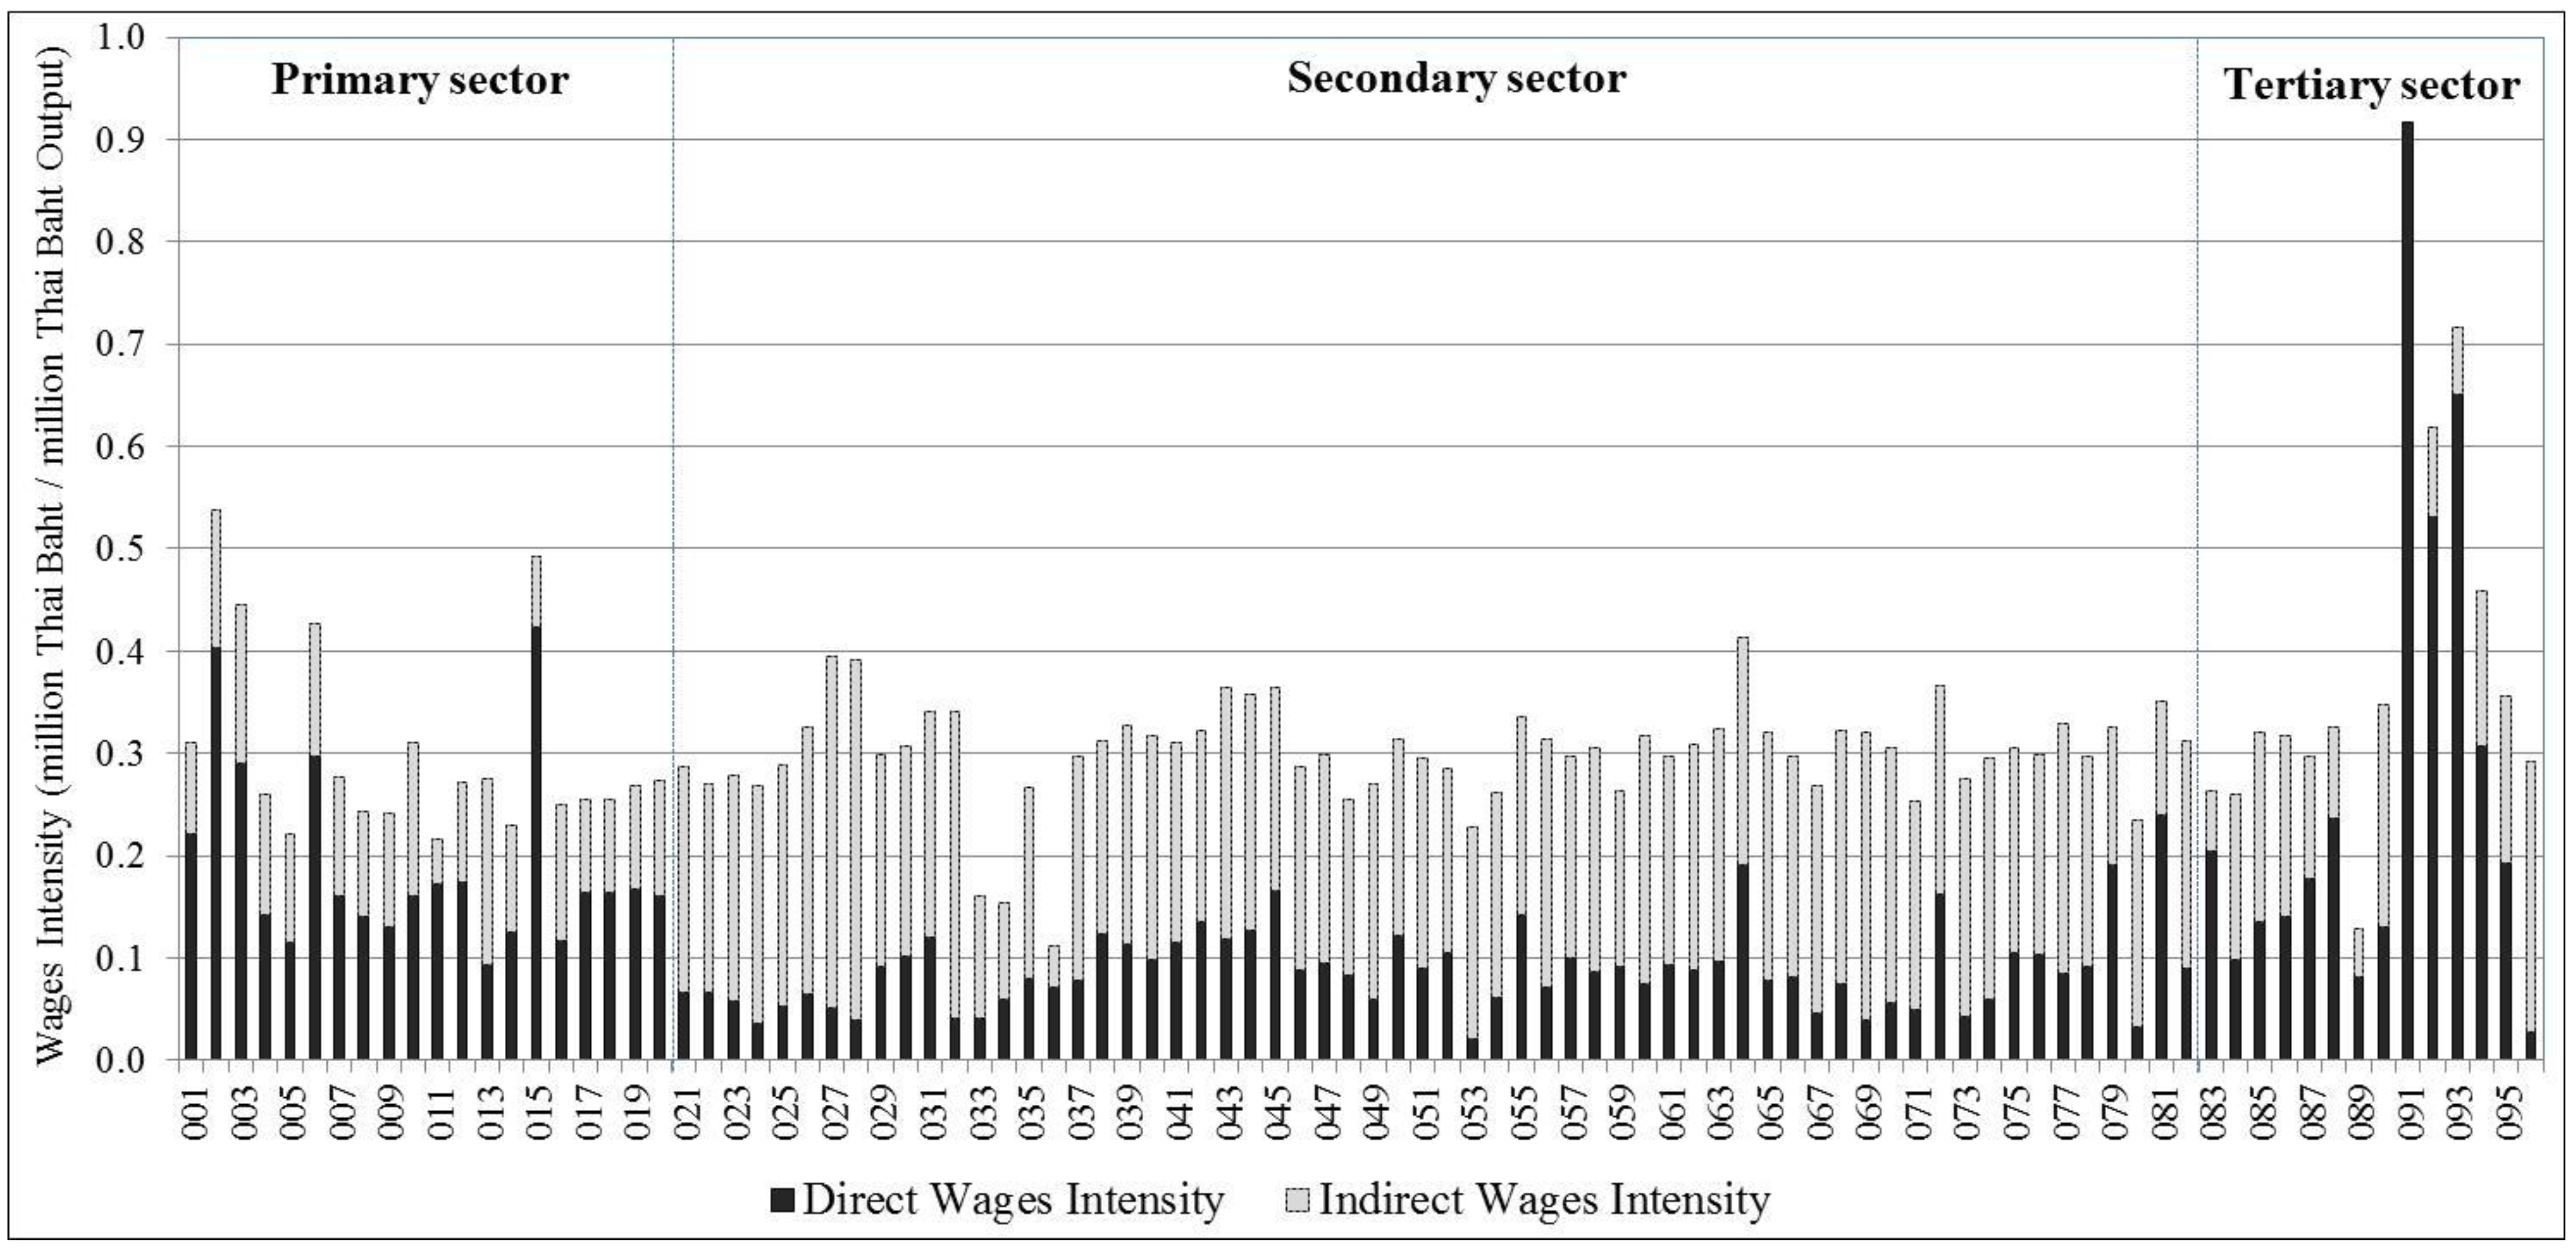
The total wages intensity from 96 industrial sectors is given in Figure 7. The largest wages intensity is public administration sector accounting for 0.92 million Thai Baht/million Thai Baht output. The highest intensity in the public administration sector was due to this sector accounting for only labor compensation and depreciation but it does not have input from others sectors. The next was education and research (0.72) followed by sanitary and similar services (0.62), maize and other grain (0.54), forestry (0.49), medical (0.46), cassava (0.44), and sugarcane (0.43), respectively. The result shows that almost all the primary and service sectors have greater direct wage intensity whereas the secondary sector had a higher share of indirect wages intensity. This is due to Thailand being categorized as a middle-income country, with an intermediate level of production technology. The key industries in the manufacturing sector use low wages as a base for competitive advantage. Thus, the secondary sector had a lower share of direct wage intensity.
Figure 7. Wages intensity by economic sector.
Sustainability 07 07684 g007

3.4.2. Wages Footprint

Figure 8 shows the results of the total remuneration paid to employees or wages footprint for each economic sector. From wages intensity, the ranking changes, and the most important wages intensive sector becomes the wholesale and retail trade sector (579,949 million Thai Baht), followed by transportation (305,861 million Thai Baht), public administration (298,720 million Thai Baht), education and research (247,547 million Thai Baht), motor vehicle (202,985 million Thai Baht), construction (201,219 million Thai Baht), and petroleum refineries sector (201,174 million Thai Baht), respectively. This change may be explained by the high final demand of the wholesale and retail trade, transportation, petroleum refinery, motor vehicle, and construction sectors that indicate a smaller wages intensity. Also, the small final demand of public administration and education sector imply a bigger wages intensity. The bigger indirect wages are in petroleum refineries, motor vehicle, industrial electrical machinery, radio and television, and transportation sectors due to the effect from raw material inputs in these sectors.
Figure 8. Wages footprint by economic sector.
Sustainability 07 07684 g008

3.5. Non-Fatal Occupational Injury

3.5.1. Non-Fatal Occupational Injury Intensity
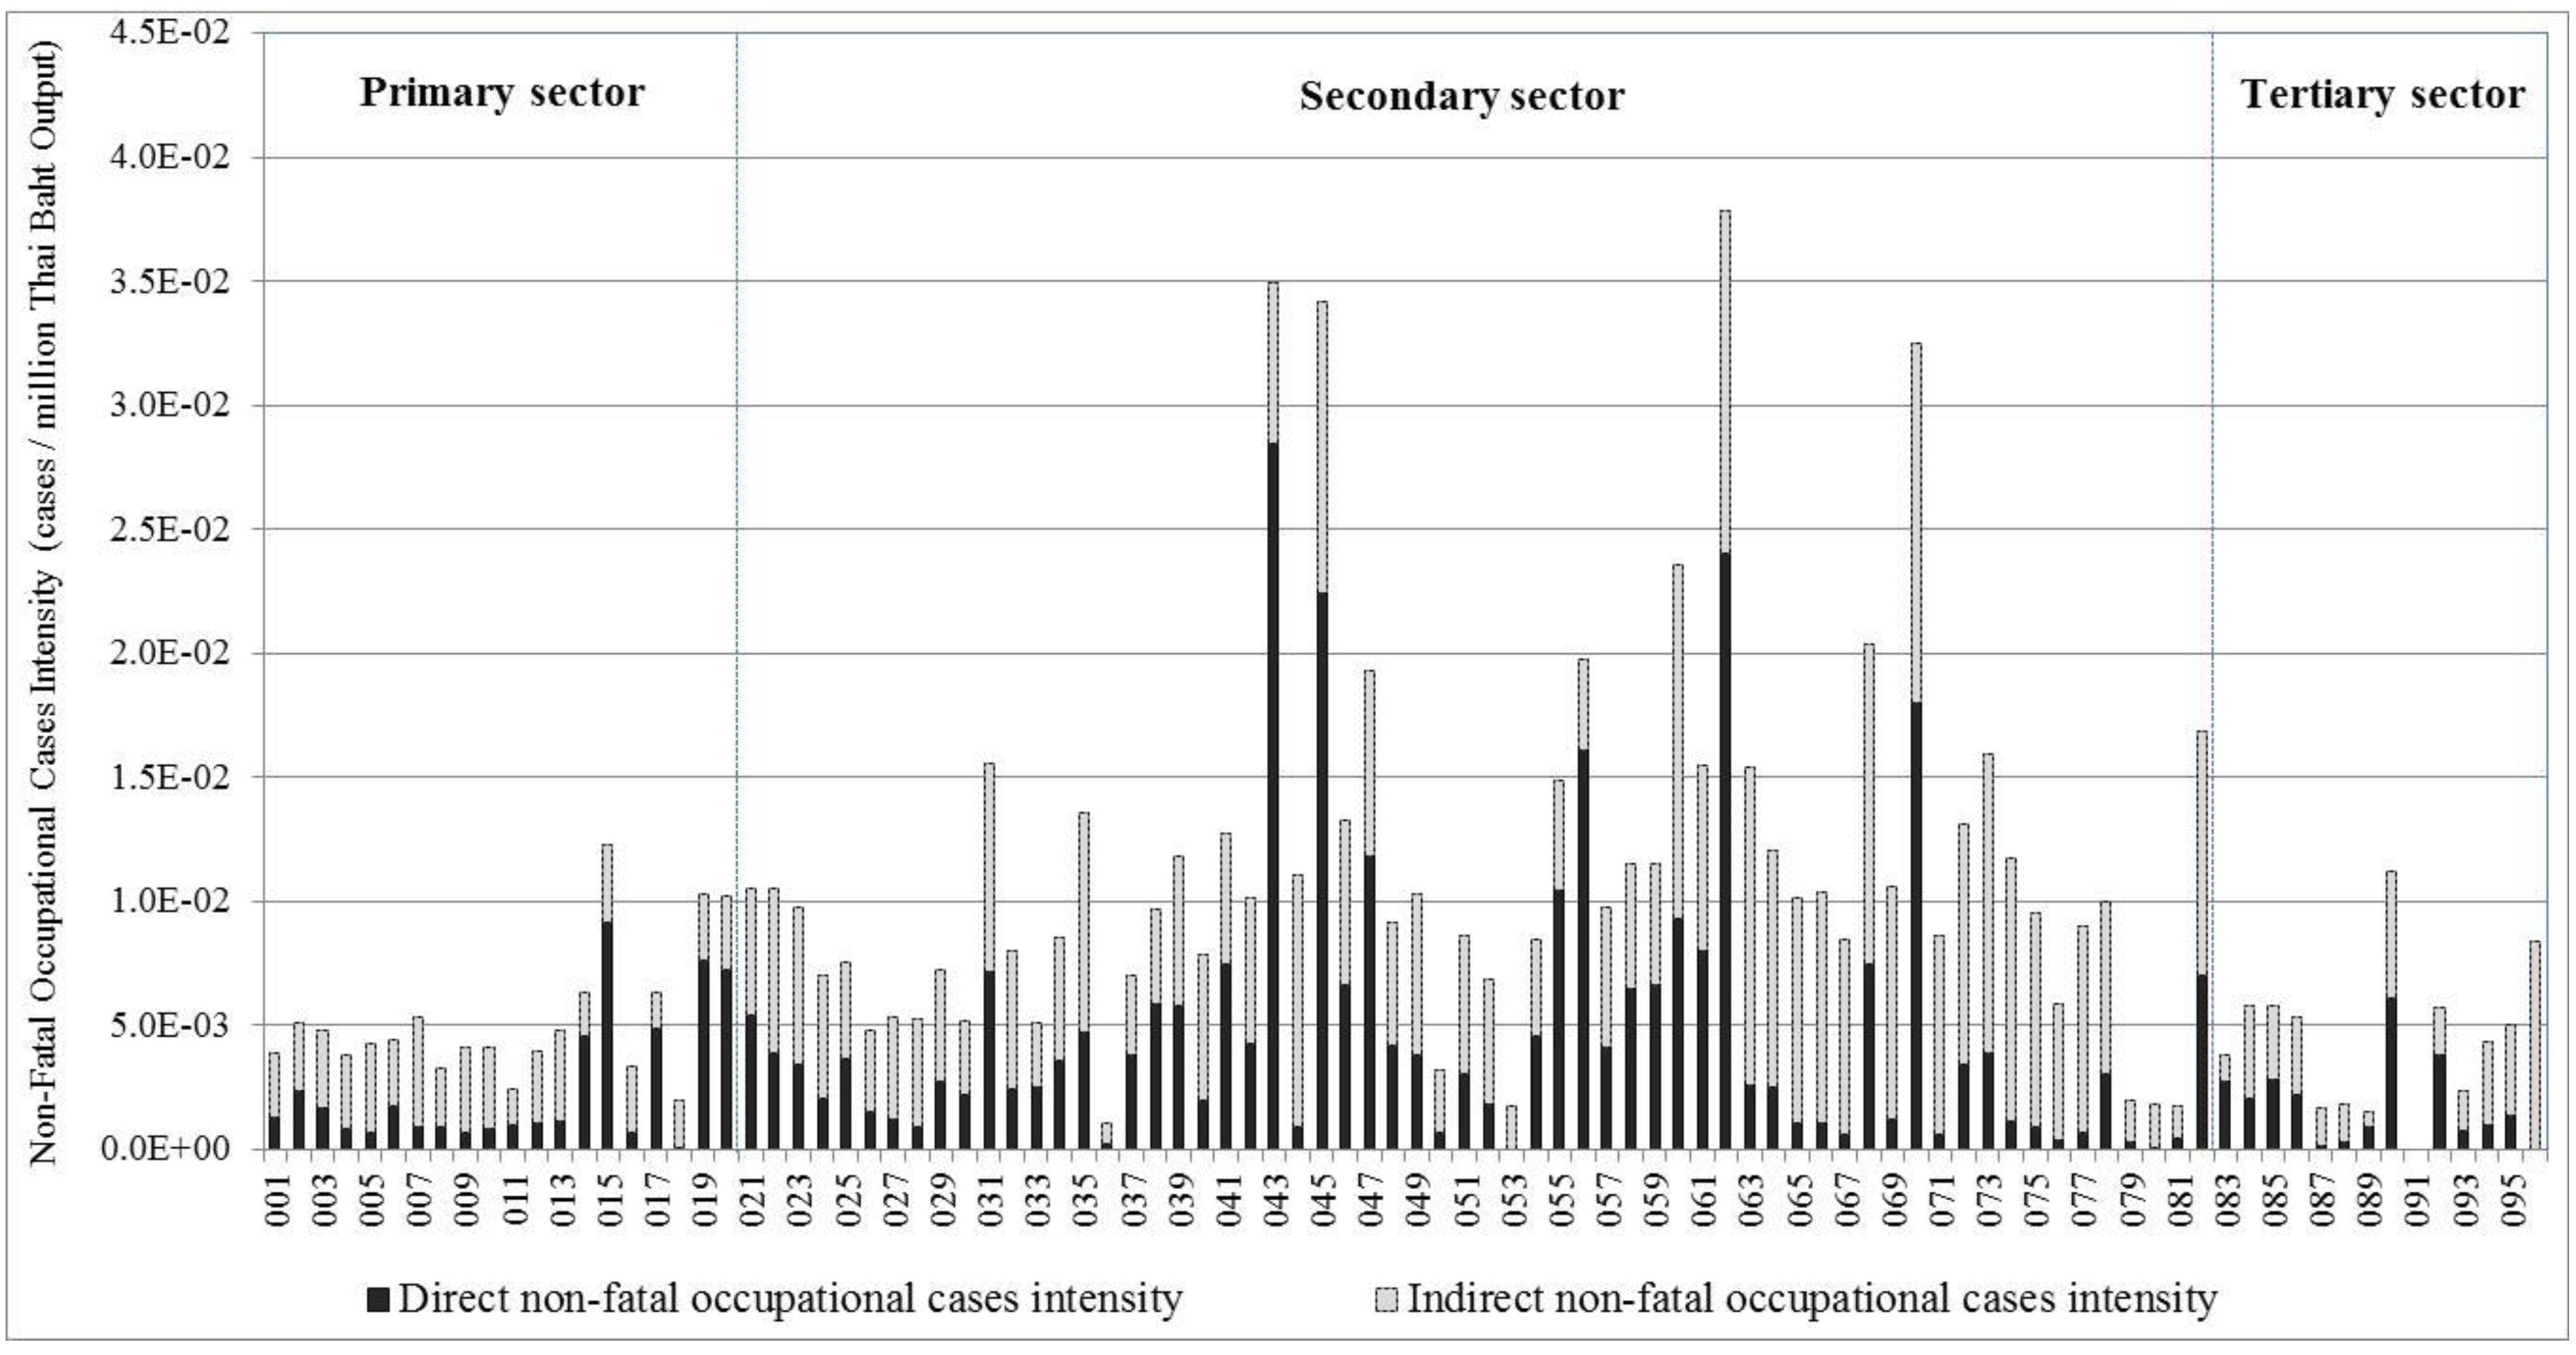
Figure 9 shows the non-fatal occupational injury intensity of 96 industrial sectors in 2005. The highest non-fatal occupational injury intensity is the metal product sector (3.78 × 10⁻² cases/million Thai Baht output) follow by saw mills (3.49 × 10⁻² cases/million Thai Baht output), wood furniture (3.42 × 10⁻² cases/million Thai Baht output), home appliances (3.25 × 10⁻² cases/million Thai Baht output), basic metal (2.35 × 10⁻² cases/million Thai Baht output), household machinery (2.03× 10⁻² cases/million Thai Baht output), plastic products (1.98 × 10⁻²² cases/million Thai Baht output), printing and publishing (1.93 × 10⁻² cases/million Thai Baht output), construction (1.68× 10⁻² cases/million Thai Baht output), and motor vehicle sector (1.59 × 10⁻² cases/million Thai Baht output), respectively.
The non-fatal occupational injury intensity in the metal product, basic metal, household machinery, plastic products, construction, and motor vehicle sector were more severe than other sectors due to these sectors being high risk work activities. While, timber, wood furniture, home appliances, and printing and publishing sectors are high risk work activities and with low economic value. However, the improvement in occupational safety in these sectors over time is also obvious; the non-fatal accident cases in these sectors decreased from 2005–2010 by 30%–50%. There are only 20 economic sectors in which the direct non-fatal occupational injury intensity is larger than the indirect effect; including agricultural service, forestry, lignite mining, metallic mining, non-metallic mining, spinning and weaving, dyeing, saw mills, wood furniture, printing and publishing, rubber and tries, plastic products, metal products, home appliances, wholesale and retail trades, real-estate, business services, and sanitary and similar services sectors.
Figure 9. Non-fatal occupational cases intensity by economic sector.
Sustainability 07 07684 g009
Data on incidents, including fatal injuries, are published by the Social Security Office of Thailand (SSO) focusing on the incidents in formal labor of the private sector under the Thai Social Security Act. There are no reports on non-fatal injury and fatality cases in government agencies and informal labor in the private sector [37].

3.5.2. Non-Fatal Occupational Cases Footprint

Figure 10 shows the result of the non-fatal occupational injury footprint for each economic sector. From non-fatal occupational injury intensity, the ranking changes, and the most important non-fatal occupational injury intensive sector becomes the motor vehicle sector (direct 2881 and total 11,744 cases), followed by construction (direct 4501 and total 10,851 cases), metal products (direct 5701 and total 8966 cases), wholesale and retail trade (direct 4501 and total 8468 cases), iron and steel (direct 2676 and total 6748 cases), electrical industrial machinery (direct 440 and total 6201 cases), radio and television (direct 668 and total 6039 cases), transportation (direct 2142 and total 5157 cases), and wood furniture (direct 2216 and total 3378 cases), respectively. This change may be explained by the high final demand of the wholesale and retail trade and transportation sectors that indicates the smaller non-fatal occupational injury intensity of these sectors. At the same time, the small final demand of the electrical industrial machinery and wood furniture sectors indicate bigger non-fatal occupational injury intensity. The bigger indirect non-fatal occupational injury intensity is the motor vehicle, electrical industrial machinery, radios and television, and construction sector is due to the effect from raw material inputs in these sectors.
Figure 10. Non-fatal occupational cases footprint by economic sector.
Sustainability 07 07684 g010
Statistical data from the Social Security Office, Ministry of Labour reported that 7.99 million (22.5%) workers registered with the Social Security Office. The following occupational accident statistics in 2005 are only for insured workers. Occupational accident statistics are gathered from the Office of Workmen’s Compensation Fund (WCF), Social Security Office (SSO) under Ministry of Labour [38]. The first cause of occupational accidents are cuts or stabbings by materials or objects, the second cause is impact by materials or objects, the third cause is materials or objects or chemical substances getting into eyes, and the fourth cause is materials or objects collapsing. In addition, the highest number of occupational accident cases are workers aged between 25 and 29 years followed by those 20–24 years old, and 30–34 years old, respectively. The occupational accident cases classified by sector showed that the highest occupational accident cases are manufacturing of metal products followed by commercial establishments, and construction, respectively [27].

3.6. Fatal Occupational Injury

3.6.1. Fatal Occupational Injury Intensity
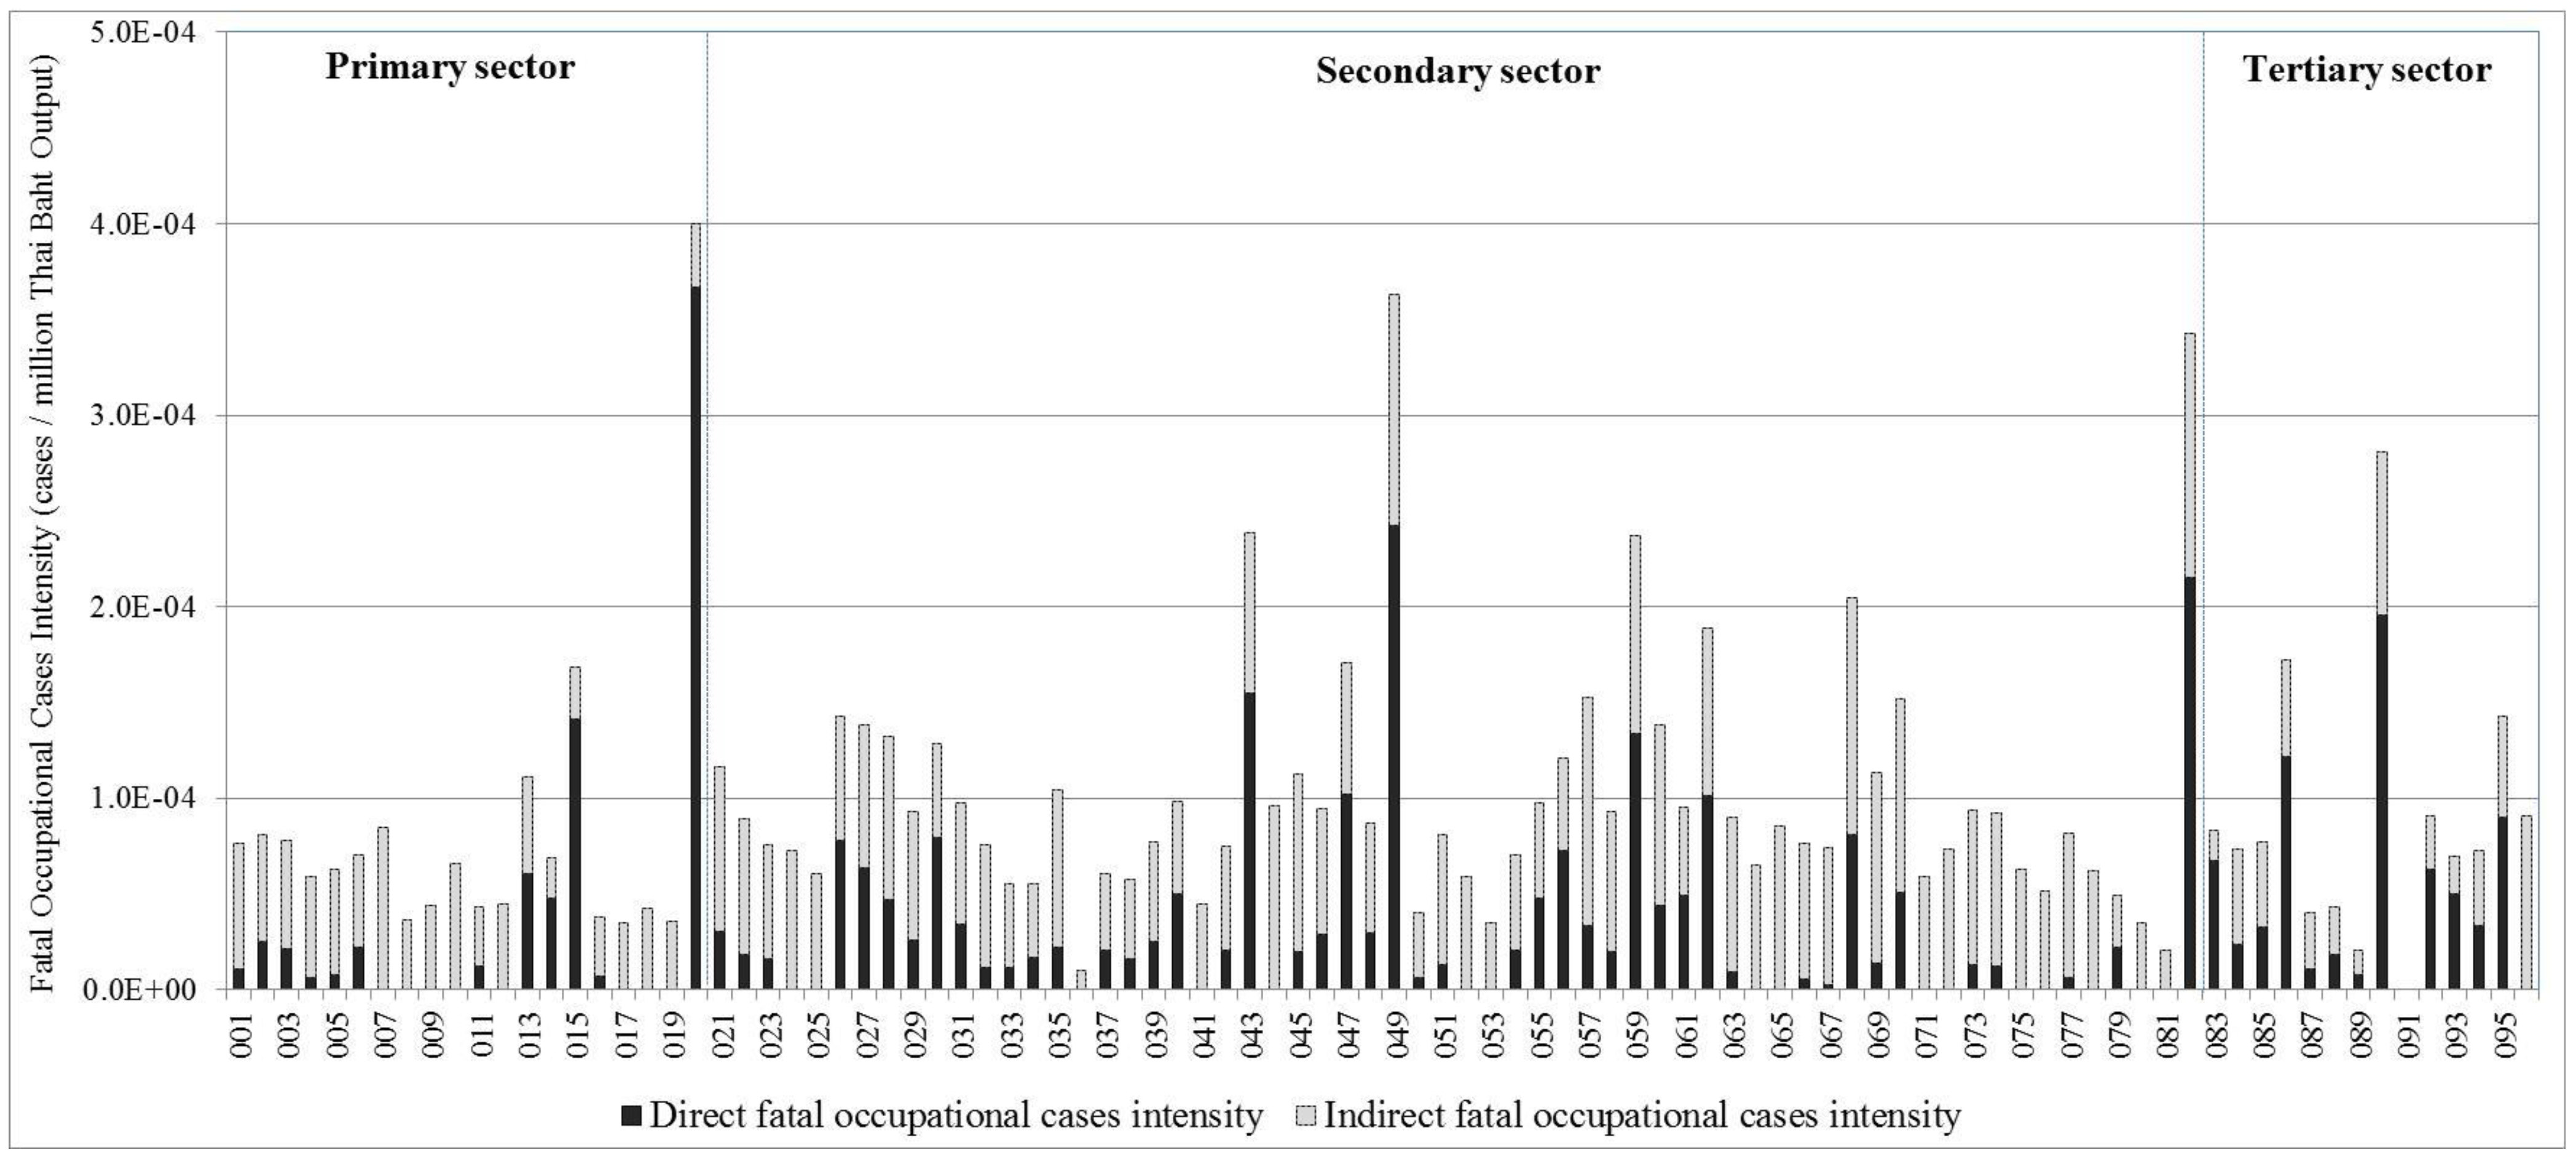
Figure 11 shows the fatal occupational injury intensity of 96 industrial sectors in 2005. The highest fatal occupational injury intensity is the non-metallic mining sector (4.00 × 10⁻⁴ cases/million Thai Baht output) followed by fertilizer and pesticides (3.63 × 10⁻⁴ cases/million Thai Baht output), construction (3.42 × 10⁻⁴ cases/million Thai Baht output), business services (2.81 × 10⁻⁴ cases/million Thai Baht output), saw mills (3.38 × 10⁻⁴ cases/million Thai Baht output), cement and concrete (2.37 × 10⁻⁴ cases/million Thai Baht output), household machinery (2.05 × 10⁻⁴ cases/million Thai Baht output), metal products (1.89 × 10⁻⁴ cases/million Thai Baht output), forestry (1.68 × 10⁻⁴ cases/million Thai Baht output), and printing and publishing sectors (1.71 × 10⁻⁴ cases/million Thai Baht output), respectively.
Figure 11. Fatal occupational cases intensity by economic sector.
Sustainability 07 07684 g011
The fatal occupational injury intensity in the construction sector was more than other sectors. This is mainly because this sector is labor-intensive and involves high-risk work activities. In addition, numbers of deaths per 1000 workers in the construction sector are higher than that of other sectors [27]. However, the improvement in occupational safety in this sector over time is also obvious; the numbers of fatal accident cases in this sector decreased from 2005–2010, estimated at 38%. The fatal occupational injury intensity in the non-metallic mining, fertilizer and pesticides, and saw mill sectors was more than other sectors due to high-risk work activities and low economic value.

3.6.2. Fatal Occupational Injury Footprint
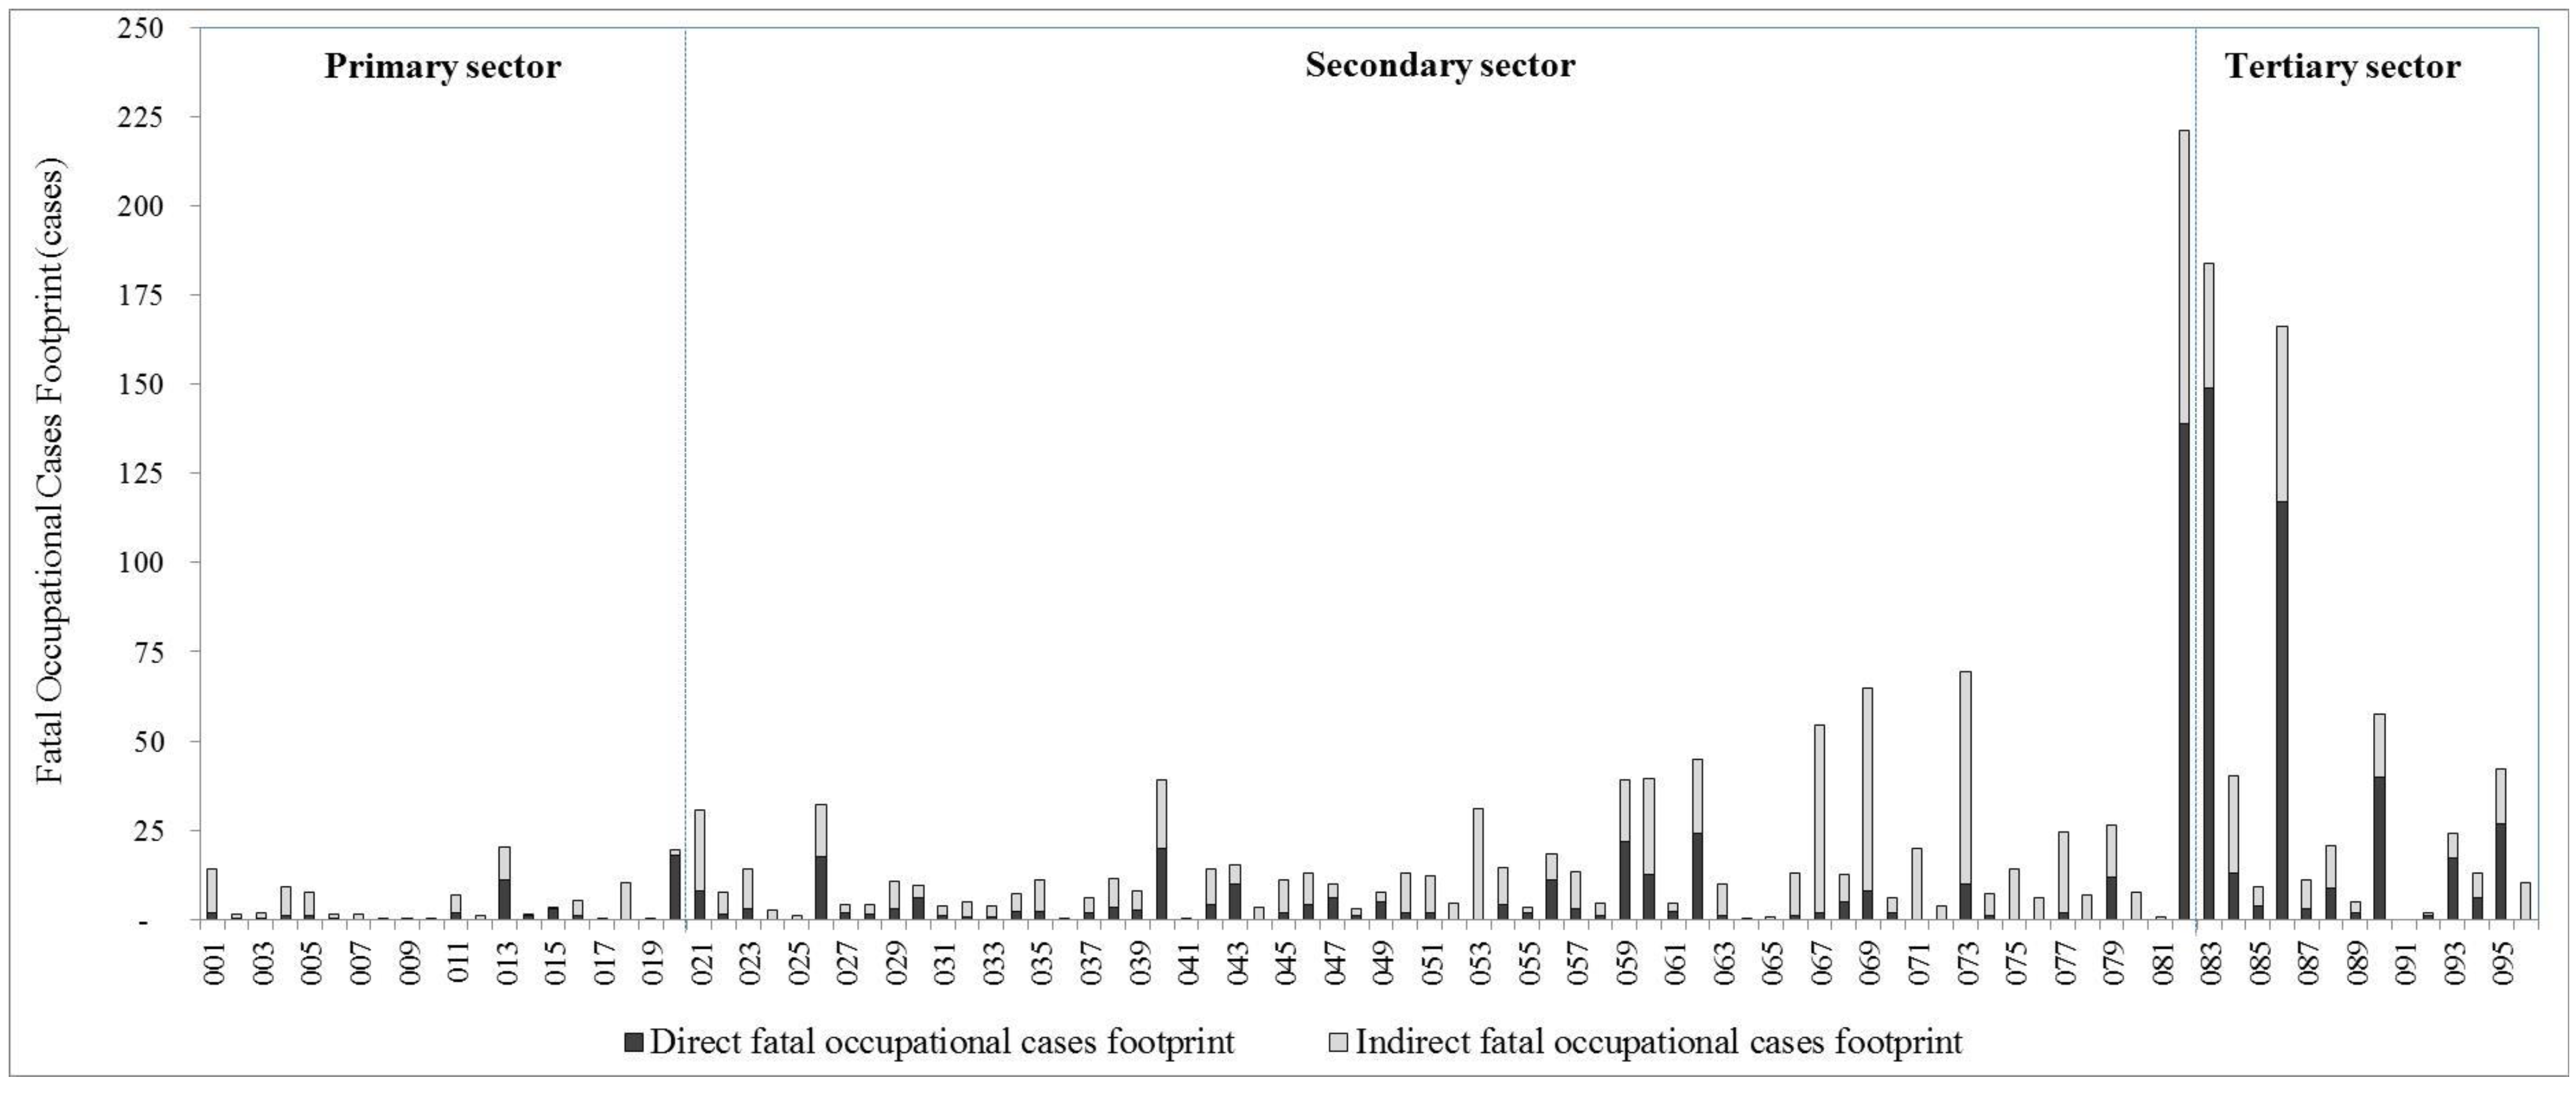
The result of the fatal occupational injury footprint for each economic sector is shown in Figure 12. From the fatal occupational injury intensity, the ranking changes, and the most important fatal occupational injury intensive sector becomes the construction sector (direct 139 and total 221 cases), followed by wholesale and retail trade (direct 149 and total 184 cases), transportation (direct 117 and total 166 cases), motor vehicle (direct 10 and total 69 cases), and radio and television sectors (direct 8 and total 65 cases), respectively. This change may be explained by the high final demand of the wholesale and retail trade, motor vehicle, and radio and television sectors that indicates the smaller fatal accident case intensity of this sector. For the construction sector, both final demand and fatal occupational injury intensity has a high value. The larger number of indirect fatal occupational injury cases are in motor vehicle, radio and television, and electrical industrial machinery sectors due to the effect from raw material inputs in these sectors.
Figure 12. Fatal occupational cases footprint by economic sector.
Sustainability 07 07684 g012

3.7. Consumption in Social Footprints

Table 2 shows social footprint indicators for the top 10 economic sectors in absolute values, which are divided into the domestic and exported shares. Total social footprint of production would correspond to domestic plus exports, while footprint of consumption accounts only for domestic production. Approximately 14% of social footprint in the wholesale and retail trade sector was associated with the production of goods and services consumed in other countries. Social footprint associated with supply chains of the wholesale and retail trade sector corresponded to 16%–29% of total footprint in the country (16% for working hours, 18% for total employment and female employment, 19% for fatal occupational cases, 22% for wages, and 29% for non-fatal occupational cases). In paddy, construction, education and research, public administration, and electricity generation sectors, the contribution of domestic consumption to social footprint is up to 100%, or there were no exports to other countries.
Table 2. Top 10 social footprints and footprints of trade.
IssuesSectorTotal FootprintDomestic ShareExports Share
Total employment footprint (persons-year)1. Wholesale and retail trade6,373,33786%14%
2. Paddy4,085,795100%0%
3. Rice milling and grinding of maize4,006,43862%38%
4. Restaurant and drinking places3,899,61688%12%
5. Construction3,228,436100%0%
6. Bean and vegetables2,894,72595%5%
7. Rubber2,413,16184%16%
8. Transportation2,303,10166%34%
9. Fruits2,089,58996%5%
10. Radio and television1,917,2774%96%
Female employment footprint (persons-year)1. Wholesale and retail3,056,03386%14%
2. Restaurant and drinking places2,139,32488%12%
3. Paddy1,835,384100%0%
4. Rice milling and grinding of maize1,776,37262%38%
5. Bean and vegetables1,300,32395%5%
6. Radio and television1,191,8044%96%
7. Wearing apparels except footwear1,153,19567%33%
8. Rubber1,084,35384%16%
9. Fruits937,15396%4%
10. Rubber products, tires and tubes764,55835%65%
Worked hours footprint (million hours-year)1. Wholesale and retail trade14,82086%14%
2. Restaurant and drinking places730488%12%
3. Construction6997100%0%
4. Rice milling and grinding of maize568362%38%
5. Paddy5625100%0%
6. Transportation497266%34%
7. Radio and television42234%96%
8. Bean and vegetables390195%5%
9. Wearing apparels except footwear362267%33%
10. Rubber337584%16%
Wages footprint (million Thai Baht)1. Wholesale and retail trade579,94986%14%
2. Transportation305,86166%34%
3. Public administration298,720100%0%
4. Education and research247,547100%0%
5. Motor vehicle202,98559%41%
6. Construction202,219100%0%
7. Petroleum refineries products201,17482%18%
8. Electrical industrial machinery197,26118%82%
9. Radio and television183,2324%96%
10. Electricity generation174,758100%0%
Fatal occupational injury footprint (cases-year)1. Construction221100%0%
2. Wholesale and retail trade18486%14%
3. Transportation16666%34%
4. Motor vehicle6959%41%
5. Radio and television654%96%
6. Business services5792%8%
7. Electrical industrial machinery5418%82%
8. Metal products4557%43%
9. Iron and steel4076%24%
10. Restaurant and drinking places4088%12%
Non-fatal occupational injury footprint (cases-year)1. Motor Vehicle11,74559%41%
2. Construction10,851100%0%
3. Metal products896657%43%
4. Wholesale and retail trade846886%14%
5. Iron and steel674876%24%
6. Electrical industrial machinery620218%82%
7. Radio and television60394%96%
8. Transportation515766%34%
9. Wooden furniture and fixtures337867%33%
10. Restaurant and drinking places316288%12%

4. Discussion

The labor intensity is calculated by the ratio of employment to monetary output of each economic sector. When comparing industries that are capital-intensive and labor-intensive, the labor intensity of labor-intensive industries will use a greater number of workers or working hours for the same level of output. Based on the direct labor intensity and direct working hour intensity, economic sectors that are labor intensive include agricultural, fishery, wholesale and retail trades, construction, garment, leather, and furniture while economic sectors that are not labor-intensive such as automotive, refinery and petrochemical will be able to deal with the higher wage with fewer burdens. Previous studies (Xu et al. [40]; Garrett-Peltier [12]; Gomez-Paredes et al. [26]) have shown that agricultural, construction, textiles, and wood product sectors were labor-intensive especially in developing countries such as China and India which is a similar result to our study. In addition, the service sectors were found to be labour intensive too, and this result is consistent with other studies (Garrett-Peltier [12]; Simas et al. [25]).
According to statistical data of Thailand [33], the agricultural, forestry, and fishery sectors directly employed 13.27 million workers while the service sector employed 16.05 million and the remainder of workers were found in the manufacturing sector (5.86 million). The main concentration of employment is in the service sector, followed by the agricultural sector. It should be noted that employment in the agricultural sector has dropped continuously while employment in the service sector has increased, with female workers shifting away from the agricultural sector into the service sector. Despite high employment in the agricultural sector, labor productivity in this sector is still at a low level. In 2005, GDP of the agricultural sector accounted for just 10.27% while GDP of the manufacturing and service sectors accounted for 40.95% and 48.79%, respectively [1]. According to Thailand’s statistics, employment is divided into five groups including salary workers (42.4%), employers (3%), self-employed workers (31.5%), unpaid family workers (23%), and co-operative workers (0.1%). It should be noted that the weak employment rate of Thailand is high as 55% of total employment consists of self-employed workers and unpaid family workers.
For female employment, the economic sectors that are female-worker intensive include wholesale and retail trades, paddy, restaurant, garment, radio and television, food processing, education and research, and hospital service while economic sectors that are not female-labor intensive include construction, saw mill, and metal products. The result of our study is compatible with Simas et al.’s [25] findings.
For wage intensity, almost all the primary and service sector has higher direct wage intensity than that of the secondary sector, due to Thailand being categorized as a middle-income country and having an intermediate level of production technology. A key strategy of the manufacturing sector is the use of low wages for maintaining competitiveness advantage. Thus, the secondary sector had a lower share of direct wage intensity than other sectors. In addition, due to the high proportion of self-employed workers and unpaid family workers in Thailand, these worker groups were excluded for measuring wage intensity.
According to the report on occupational safety and health in Thailand [27], it was found that statistical relationships between socio-demographic variables and incidents of occupational injury depend on sex, age, job experience, and occupation. This study shows a higher possibility of fatality for workers in the construction, wholesale and retail trades, transportation, and motor vehicle sectors. Overall, 10 years ago, the construction sector reported the highest fatality rate in Thailand. The work-related injuries rate per 1000 workers in the construction sector was twice as high as the overall industry rate [41]. These results are compatible with other studies of the construction sector (Onat et al. [24]; Gonzalez-Delgado et al. [42]) and services sector (Waehrer et al. [43]). In addition, it found that male workers illustrated a higher risk of fatality from an occupational injury, which may be explained by their jobs having a higher level of exposure to risks than female’s jobs. Non-fatal occupational injury appeared to be most concentrated in the motor vehicles, construction, metal products, and wholesale and retail trade sectors. The results of our study are similar to other studies such as construction (Onat et al. [23]; Simas et al. [25]), metal products (Kifle et al. [44] and service sector (Waehrer et al. [43]; Simas et al. [25]). In case of the motor vehicle sector, non-fatal injury cases are significantly higher in indirect cases than other industries, with a ratio of 3 times. This high ratio means that great care is taken to shield worker health and safety in this sector, whereas supply sectors are notably dangerous, especially the iron and steel and metal products sectors. In addition, the rate of occupational injuries per 1000 workers was highest in the aged group of 15–19 year old followed by the 20–24 year old group and 25–29 year old group, respectively [38]. The young workers are at higher risk of occupational injuries due to being experienced in their jobs. In terms of the specific occupation, the workers in the construction sector, machine operators and technicians in the manufacturing sector, and salespeople in wholesale and retail trade sectors show higher possibilities of non-fatal occupational injury. The high risk of occupational injuries in construction, manufacturing, and service sectors may be related to a lack of training for the duties and a lack of access to safety standards on the job, and could also be attributed to educational level.

4.1. Policy Implications

Social footprint indicator based on IOA framework related to commodities can provide guidance on where to focus in investigation and implementation strategies. For example, endeavors to address labor issues in the production of agricultural products (such as paddy, cassava, sugarcane, maize, fruits, vegetables, etc.) and fishery products should focus on direct employment as indirect labor is less important. For the construction, wood and cork products, wood furniture, and restaurant sectors, both direct and indirect employment become important, particularly concerning female employment and working hours.

4.2. Supply Chain Implications

On the contrary, social issues linked to the electrical and electronics industry (such as electrical appliances, radio and television, and battery, cable and lighting) and motor vehicles sector (Figure 10 and Figure 12), supply chain controls are the most important. Possibly, approaches to solving social issues should focus on the most directly affected sectors. Addressing issues in these sectors (Figure 10) will mitigate not only their sectors’ footprints, but also those sectors’ inputs. For example, reducing non-fatal occupational injury in the iron and steel and metal products sectors will lower the indirect non-fatal injury in the motor vehicles, and electrical and electronics industries.

4.3. Consumer Implications

By considering the share of social footprint in traded goods, we found that more than 50% of each social footprint in the top 10 economic sectors is from domestic consumption. Except for the radio and television, electrical industrial machinery, and rubber products and tubes sectors, the export share makes for a significant part of these sectors (range from 65%–96%). In addition, we found that the primary and tertiary sectors has a significant share of its social footprint in domestic consumption, accounting for 60%–100%. While in the secondary sectors, more than 30% of social footprints in these sectors are mainly driven by foreign consumption, whereas the rest is the production for use domestically. We can conclude that the share of exports’ social footprint is higher in secondary sectors than in other sectors. The main exports of Thailand are electrical and electronics appliances, wearing apparels, rubber products, and motor vehicles. The manufacturing of these products may require direct labor from the domestic market. Investigating the main social footprint flows in export products of Thailand shows that underlying social issues virtually flow from Thailand to foreign countries.

4.4. Limitation of This Study

Socially extended input–output model allows following the flow of social footprints along supply chains. By considering social aspects in every production step, the result is a social inventory of production and consumption, e.g., employment, female employment, fatal and non-fatal occupational injury footprints of sectors or countries. Social footprint based on IO model is served by data that are assembled at the sector level rather than for specific products.
Input–output tables are the sum of financial transactions of very many individual activities and are grouped into a limited number of industries. An IOA shows the social impact of an industry or product group (e.g., soft drink products) but not of a specific product (e.g., orange juice). In addition, the social footprint based on IO approach has some limitations; examining labor issues via IOA gives only a historical picture linked to given economic activities in the considered time period. However, labor dimensions might not imitate the linear proportion assumption. For example, if the demand for a commodity and its wage footprint is reduced, it would be incorrect to assume that wage rate will be reduced also. Actually, it is possible that less profit may be a stimulant for some employers to move to lessen their costs. When considering the social footprint based on input–output analysis, it is estimated that 57% of the Thai labor force work in the informal market. This is not included within the non-fatal and fatal footprint of this work. These values will be captured at the point in the supply chain where the good or service is sold or purchased in the formal economy. The lack of data on the sub-sector share of labor in the agricultural sector results in large uncertainty in this analysis. In addition, this study did not consider imports’ effect in its calculations. Further work on this analysis is recommended including the impacts from importing of raw materials.

5. Conclusions

This study calculates the direct and indirect social footprint associated with the activities of the Thai economy and detects key sectors and important social issues in Thailand using the IO model. The six different social issues are calculated including employment, number of female employees, working hours, wages and salaries, non-fatal accident cases, and fatal accident cases. The results show that the primary sector has the highest social intensity in terms of employment, female employment, and working hour intensity. Meanwhile, the secondary sector was higher in non-fatal occupational cases’ intensity than other sectors. The government sector was higher in wages intensity than other sectors due to being labor intensive and of low economic value. In addition, the fatal occupational cases intensity was highest in the non-metallic mining, fertilizer and pesticides, and construction sectors. We calculated the expected increase in social impacts throughout the entire supply chain, from minerals extraction to energy supply, components production, and final assembly. This study provides information for companies and consumers regarding the social issues associated with their purchases. If businesses and consumers become more concerned about the social implications of their activities, they may incentivize the supply chain to perform better. For example, for social issues linked to the electrical and electronics industry, and the motor vehicles sector, supply chain controls are the most important. Reduction of non-fatal occupational injury in the iron and steel, and metal products sectors will lower the indirect non-fatal injury of motor vehicle sectors, and electrical and electronics industries. Thus, producers can force their suppliers to reduce the social footprint of their products.
Although the IO model presented in this study is easy to use, it has some limitations that should be considered. Some debatable issues include calculations based on the linear inter-industry interactions, the estimations at national level, data availability and data quality. The aggregation of data used for calculations may lead to under/over estimations, such as accident cases within the agricultural sector are allocated based on economic value. In addition, this study did not consider imports in its estimations.

Acknowledgments

This research was supported by the Japan Society for the Promotion of Science (JSPS) under JSPS RONPAKU (Dissertation PhD) Program, Tokyo City University (TCU), National Research Council of Thailand (NRCT), and National Metal and Materials Technology Center (MTEC). The authors would like to thank all contributors for the data used in this study.

Author Contributions

The text of this manuscript was written by Seksan Papong, with contributions by Norihiro Itsubo, Masanori Shukuya, and Pomthong Malakul. Data collection and data analysis was performed by Seksan Papong. The research was supervised by Norihiro Itsubo, Masanori Shukuya, and Pomthong Malakul. All authors proofread and approved the final manuscript.

Conflicts of Interest

The authors declare no conflict of interest.

Appendix

Table A1. Definition of economic sectors for the new aggregated IO table (96 × 96 sectors) compare to the conventional IO table (180 × 180 sectors).
New CodeAggregated Sectors (96 × 96 Sectors)Conventional Thai IO Table (180 × 180 Sectors)
Primary Sectors
001Paddy001
002Maize and cereals002, 003
003Cassava004
004Beans, vegetables, and other root crops005,006, 007
005Fruits and coconut008, 010
006Sugarcane009
007Oil palm011
008Textile crops012, 013
009Tobacco014
010Coffee and tea015
011Rubber016
012Other agricultural products017
013Livestock 018–023
014Agricultural services024
015Forestry 025–027
016Fishery 028–029
017Coal and lignite030
018Petroleum and natural gas031
019Metal ore mining032–035
020Non-metal ore mining036–041
Secondary Sectors
021Slaughtering, meat canned, and dairy products042–044
022Canning of fruits and vegetables045
023Canning preserving of fish046
024Coconut and palm oil047
025Other vegetable and animal oils048
026Rice milling and grinding of maize049, 051
027Tapioca milling050
028Flour and other grain milling052
029Other food products053, 054, 056, 057, 058, 060
030Sugar055
031Coffee and tea processing059
032Animal feed061
033Distilling blending spirits062
034Breweries063
035Soft drinks064
036Tobacco processing and products065, 066
037Spinning067
038Textile weaving, bleaching and finishing068, 069
039Made-up textile goods and knitting070, 071
040Wearing apparels except footwear072
041Carpets, rugs, cordage rope, and twine products073, 074
042Leather products and footwear075, 076, 077
043Saws mills078
044Wood and cork products079
045Furniture and fixtures wood080
046Pulp and paper products081, 082
047Printing and publishing083
048Basic industrial chemicals084
049Fertilizer and pesticides085
050Synthetic resins and plastics086
051Other chemical products087, 089, 090, 091, 092
052Drugs and medicines088
053Petroleum refineries products093, 094
054Rubber sheets, block rubber, tires, and tubes095, 096
055Other rubber products097
056Plastic wares098
057Ceramics and clay products099, 101, 104
058Glass and glass products100
059Cement and concrete products102, 103
060Iron and steel products105, 106
061Non-ferrous metal107
062Fabricated metal products108, 109, 110, 111
063Engines and turbines112
064Agricultural machinery113
065Wood and metal working machinery114
066Special industrial machinery115
067Office and household machinery116
068Electrical industrial machinery117
069Radio and television118
070Household electrical appliances119
071Wire, cable, battery, and other electrical apparatuses120, 121, 122
072Ship building123
073Motor vehicle125
074Motorcycle, bicycle and other carriages126
075Railway equipment, repairing of motor vehicle, and aircraft124, 127, 128
076Precision products129, 130, 131
077Jewelry and related articles132
078Other manufacturing goods133, 134
079Electricity135
080Pipeline136
081Water supply system137
082Construction138–144
Tertiary Sectors
083Wholesale and retail trade145, 146
084Restaurant and drinking place147
085Hotel and lodging place148
086Transportation 149–158
087Post and telecommunication159
088Financial services160–162
089Real-estate163
090Business service164
091Public administration165
092Sanitary and similar services166
093Education and research167, 168
094Hospital169
095Other services170–178
096Unclassified180

References

  1. NESDB. GROSS DOMESTIC PRODUCT: Q4/2014; Office of the National Economic and Social Development Board (NESDB): Bangkok, Thailand, 2015.
  2. Deutz, P.; Ioppolo, G. From theory to practice: Enhancing the potential policy impact of industrial ecology. Sustainability 2015, 7, 2259–2273. [Google Scholar] [CrossRef]
  3. Cappelletti, G.M.; Ioppolo, G.; Nicoletti, G.M.; Russo, C. Energy requirement of extra virgin olive oil production. Sustainability 2014, 6, 4966–4974. [Google Scholar] [CrossRef]
  4. Ioppolo, G.; Cucurachi, S.; Salomone, R.; Saija, G.; Ciraolo, L. Industrial Ecology and Environmental Lean Management: Lights and Shadows. Sustainability 2014, 6, 6362–6376. [Google Scholar] [CrossRef]
  5. UNEP (United Nations Environment Programme). Guidelines for Social Life Cycle Assessment of Products; UNEP (United Nations Environment Programme): Druk in de weer, Belgium, 2009; Available online: http://www.unep.fr/shared/publications/pdf/DTIx1164xPA-guidelines_sLCA.pdf (accessed on 1 May 2014).
  6. Dreyer, L.C.; Hauschild, M.Z.; Schierbeck, J. A framework for social life cycle impact assessment. Int. J. Life Cycle Assess. 2006, 11, 88–97. [Google Scholar] [CrossRef]
  7. Dreyer, L.C. Inclusion of Social Aspects in Life Cycle Assessment of Products—Development of a Methodology for Social Life Cycle Assessment. Ph.D. Thesis, Department of Management Engineering, Technical University of Denmark, Kongens Lyngby, Denmark, 2009. [Google Scholar]
  8. Benoit-Norris, C.; Cavan, D.A.; Norris, G. Identifying social impacts in product supply chains: Overview and application of the social hotspot database. Sustainability 2012, 4, 1946–1965. [Google Scholar] [CrossRef]
  9. Macombe, C.; Leskinen, P.; Feschet, P.; Antikainen, R. Social life cycle assessment of biodiesel production at three levels: A literature review and development needs. J. Clean. Prod. 2013, 52, 205–216. [Google Scholar] [CrossRef]
  10. Hutchins, M.J.; Robinson, S.L.; Dornfeld, D. Understanding life cycle social impacts in manufacturing: A processed-based approach. J. Manuf. Syst. 2013, 32, 536–542. [Google Scholar] [CrossRef]
  11. Martínez-Blanco, J.; Lehmann, A.; Muñoz, P.; Antón, A.; Traverso, M.; Rieradevall, J.; Finkbeiner, M. Application challenges for the social LCA of fertilizers within Life Cycle Sustainability Assessment. J. Clean. Prod. 2014, 69, 34–48. [Google Scholar] [CrossRef]
  12. Garrett-Peltier, H. The Employment Impacts of Economy-Wide Investments in Renewable Energy and Energy Efficiency. Ph.D. Thesis, University of Massachusetts Amherst, Amherst, MA, USA, 2010. [Google Scholar]
  13. Martínez, S.H.; van Eijck, J.; da Cunha, M.P.; Guilhoto, J.; Walter, A.; Faaij, A. Analysis of socio-economic impacts of sustainable sugarcane–ethanol production by means of inter-regional Input-Output analysis: Demonstrated for Northeast Brazil. Renew. Sustain. Energy Rev. 2013, 28, 290–316. [Google Scholar]
  14. Chen, T.P.; Chang, T.; Chiau, W.; Shih, Y. Social economic assessment of coastal area industrial development: An application of input-output model to oyster farming in Taiwan. Ocean Coast. Manag. 2013, 73, 153–159. [Google Scholar] [CrossRef]
  15. Tang, X.; Zhang, B.; Wei, X. Employment impacts of petroleum industry in China: an input-output analysis. Int. J. Glob. Energy Issues 2013, 36, 116–129. [Google Scholar] [CrossRef]
  16. Lee, M.K.; Yoo, S.H. The role of the capture fisheries and aquaculture sectors in the Korean national economy: An input-output analysis. Mar. Policy 2014, 44, 448–456. [Google Scholar] [CrossRef]
  17. Ferrão, P.; Ribeiro, P.; Rodrigues, J.; Marquesa, A.; Preto, M.; Amaral, M.; Domingosa, T.; Lopes, A.; Costa, I. Environmental, economic and social costs and benefits of a packaging waste management system: A Portuguese case study. Resour. Conserv. Recycl. 2014, 85, 67–78. [Google Scholar] [CrossRef]
  18. McBain, D.; Alsamawi, A. Quantitative accounting for social economic indicators. Nat. Resour. Forum 2014, 38, 193–202. [Google Scholar] [CrossRef]
  19. Malik, A.; Lenzen, M.; Geschke, A. Triple bottom line study of a lignocellulosic biofuel industry. GCB Bioenergy 2015. [Google Scholar] [CrossRef]
  20. Yang, Y.; Zhang, B.; Cheng, J.; Pu, S. Socio-economic impacts of algae-derived biodiesel industrial development in China: An input–output analysis. Algal Res. 2015, 9, 74–81. [Google Scholar] [CrossRef]
  21. Kucukvar, M.; Egilmez, G.; Tatari, O. Sustainability assessment of U.S. final consumption and investments: triple-bottom-line input–output analysis. J. Clean. Prod. 2014, 81, 234–243. [Google Scholar] [CrossRef]
  22. Alsamawi, A.; Murray, J.; Lenzen, M. The employment footprints of nations. J. Ind. Ecol. 2014, 18, 59–70. [Google Scholar] [CrossRef]
  23. Chang, Y.; Ries, R.J.; Wang, Y. The quantification of the embodied impacts of construction projects on energy, environment, and society based on I–O LCA. Energ. Policy 2011, 39, 6321–6330. [Google Scholar] [CrossRef]
  24. Onat, N.C.; Kucukvar, M.; Tatari, O. Integrating triple bottom line input-output analysis into life cycle sustainability assessment framework: the case for US buildings. Int. J. Life Cycle Assess. 2014, 19, 1488–1505. [Google Scholar] [CrossRef]
  25. Simas, M.S.; Golsteijn, L.; Huijbregts, M.A.J.; Wood, R.; Hertwich, E.G. The “Bad Labor” Footprint: Quantifying the Social Impacts of Globalization. Sustainability 2014, 6, 7514–7540. [Google Scholar] [CrossRef] [Green Version]
  26. Gómez-Paredes, J.; Yamasue, E.; Okumura, H.; Ishihara, K.N. The labour footprint: A framework to assess labour in a complex economy. Econ. Syst. Res. 2015, 27, 1–25. [Google Scholar] [CrossRef]
  27. Ministry of Labour. National Profile on Occupational Safety and Health of Thailand 2012; Occupational and Health Bureau, Department of Labour Protection and Welfare, Ministry of Labour: Bangkok, Thailand, 2012.
  28. ISO. ISO 14040: Environmental Management—Life Cycle Assessment—Principals and Framework; International Organization for Standardization: Geneva, Switzerland, 2006. [Google Scholar]
  29. Leontief, W.W. Input–Output Economics, 2nd ed.; Oxford University Press: New York, NY, USA, 1986. [Google Scholar]
  30. Hendrickson, C.; Horvath, A.; Joshi, S.; Lave, L. Economic input–output models for environmental life-cycle assessment. Environ. Sci. Technol. 1998, 32, 184A–191A. [Google Scholar] [CrossRef]
  31. Bilec, M.; Ries, R.; Matthew, H.S. Hybrid life cycle assessment model for construction processes: methodology, model, results, and comparisons. J. Infrastruct. Syst. 2010, 16, 199–205. [Google Scholar] [CrossRef]
  32. NESDB. The 2005 IO Table of Thailand; Office of the National Economic and Social Development Board (NESDB): Bangkok, Thailand, 2014. Available online: http://www.nesdb.go.th/Default.aspx?tabid=97 (accessed on 1 May 2014).
  33. NSO (National Statistical Office). The 2006 Business Trade and Service Survey of Thailand; Ministry of Information and Communication Technology: Bangkok, Thailand, 2006.
  34. BOT (Bank of Thailand). Number of Employment Classified by Working-Hour Per Week for Each Economic Sector in 2005–2010; Bank of Thailand: Bangkok, Thailand, 2014; Available online: (accessed on 9 September 2014).
  35. NSO (National Statistical Office). Labor Force Survey in 2006 (in Thai); Ministry of Information and Communication Technology: Bangkok, Thailand, 2006.
  36. NSO (National Statistical Office). The 2007 Industrial Census Whole Kingdom (in Thai); Ministry of Information and Communication Technology: Bangkok, Thailand, 2007.
  37. NSO (National Statistical Office). Statistical Yearbook Thailand 2006 (in Thai); Ministry of Information and Communication Technology: Bangkok, Thailand, 2007.
  38. SSO (Thailand’s Social Security Office). Occupational Accidents and Fatality Cases; Ministry of Labour: Bangkok, Thailand, 2006.
  39. NSO (National Statistical Office). Informal Labor Survey 2005 (in Thai); Ministry of Information and Communication Technology: Bangkok, Thailand, 2005.
  40. Xu, M.; Williams, E.; Allenby, B. Assessing environmental impacts embodied in manufacturing and labor input for China–U.S. trade. Environ. Sci. Technol. 2010, 44, 567–573. [Google Scholar] [CrossRef] [PubMed]
  41. SSO (Thailand’s Social Security Office). The Social Security Office: Annual Report 2010; Ministry of Labour: Bangkok, Thailand, 2010.
  42. Gonzalez-Delgado, M.; Gómez-Dantés, H.; Fernández-Niño, J.A.; Robles, E.; Borja, V.H.; Aguilar, M. Factors associated with fatal occupational accidents among Mexican workers: A national analysis. PLoS ONE 2015, 10, 1–19. [Google Scholar] [CrossRef] [PubMed]
  43. Waehrer, G.; Leigh, J.P.; Miller, T.R. Costs of occupational injury and illness within the health services sector. Int. J. Health Serv. 2005, 35, 343–359. [Google Scholar] [CrossRef] [PubMed]
  44. Kifle, M.; Engdaw, D.; Alemu, K.; Sharma, H.R.; Amsalu, S.; Feleke, A.; Worku, W. Work related injuries and associated risk factors among iron and steel industries workers in Addis Ababa, Ethiopia. Saf. Sci. 2014, 63, 211–216. [Google Scholar] [CrossRef]