1. Introduction
The globalization of food systems has increased the distances between places where food is produced and places where it is consumed, as several authors have noted for a number of geographical contexts [
1,
2]. This phenomenon has led researchers to examine how local food distribution chains can contribute to reducing energy consumption and greenhouse gas emissions [
3,
4,
5,
6,
7,
8].
The concept of food miles defined by Lang (2001) as “the distance food travels between primary producer and end consumer” [
9] (p. 539) has recently been proposed as a tool for defining policies associated with the sustainability of food systems in economic, environmental and social terms. The most recent studies on this topic compare large-scale, organized distributors and local food alternative systems in terms of food miles and their environmental impact, expressed in terms of CO
2 emissions [
10,
11].
The results of these food miles studies are often conflicting, and many of them indicate that purchasing from local suppliers, notwithstanding the associated reduction of food miles, does not necessarily imply an improvement in sustainability of the local food system. This is due to economies of scale and the fact that the superior operational organization of the supply systems of the large-scale retailers typically compensates for the higher impact generated by the transportation of goods [
4,
10,
12,
13].
On the other hand, some authors affirm that the reduction of transportation distance and the number of intermediaries allows for a reduction in energy consumption [
2,
14]. Some authors [
2] (p. 16) and [
15] in particular argue that actions to reduce farm and food miles’ negative externalities (such as eutrophication, losses of biodiversity, greenhouse gases emissions at the farm gate, CO
2 emissions for transporting foodstuff from farm to point of consumption) and to shift consumers’ decisions to specific alternative shopping preferences and transport choices (e.g., home delivery of groceries) would have a substantial impact on environmental outcomes.
The production and processing of fluid milk involves many resource inputs and environmental outputs [
16,
17,
18] that consistently contribute to greenhouse gas (GHG) emissions, even though different environmental performances have been evidenced between organic and conventional milk production systems [
18]. Analysis of an existing study on the life cycle impact of final consumption of milk and other dairy products in the EU-25 has shown that these products account for around 5% of global warming potential (GWP), 10% of eutrophication potential and 4% of photochemical ozone creation potential [
19]. Similar results have been found in a more recent study about the environmental impact of dairy and meat products consumption in EU-27, considering the contribution of dairy products [
15].
Many studies have used life cycle assessments (LCAs) to analyze the environmental impact of milk, considering all phases of its “life cycle” from production and transport of inputs for dairy farming and agricultural production to the consumer phase and also waste management of the packaging [
16,
20,
21,
22]. Results show that the dairy farm phase has the highest impact for GHG emissions with more than 80% for milk and more than 90% for cheese. Among the non-farming phases, those of the most importance for GHG emissions are dairy processing (6%) and packaging production (5%), followed by distribution (4.5%, including transport from dairy farms to dairy processing facilities), end-of-life (4%) and the use phase in consumer households (1% including only refrigeration) [
23].
The strong environmental impact of milk production has driven researchers to investigate mitigation measures [
24], and several producing countries have tried to respond with initiatives of varying levels of complexity and at different stages of the supply chain. Examples include New Zealand’s GHG Reporting Strategy, the U.S. Environmental Protection Agency GHG Registry, the U.K.’s PAS (Publicly Available Specification) 2050, the U.K. Milk roadmap of the Dairy Supply chain, the U.K. Tesco Sustainable Dairy Project, the USA/Europe Dairy Stewardship alliance, the EU Environmental Improvement of Products and the Netherlands’ Sustainable Dairy Chain; for a complete review, see Guinard
et al., 2009 [
23]. Over 40% of these initiatives consider delivery an important phase to take into consideration.
In recent years, researchers and practitioners have become increasingly interested in local food supply systems and their potential in terms of social and environmental benefits [
25,
26,
27,
28]; the food miles indicator has been used with growing frequency to express the environmental benefits that accrue from local food supply chains because of their lower carbon emissions [
3,
4,
10,
29,
30,
31].
The objective of this study was to compare food miles and the corresponding CO2 emissions related to the transport from the farm to the point of sale, for three types of fresh milk that differ in provenance and production process, in the Umbria region (Italy), where the dairy sector has so far been one of the most important parts of the regional agro-food system. The first part of this paper details some key facts about the Italian fresh milk market, then the Materials and Methods Section describes the three different distribution systems, followed by the related estimation and results. Finally, the Discussion and Conclusions Section outlines the main findings of this work.
Key Facts about the Fresh Milk Market in Italy
The Italian supply chain for fresh milk has undergone significant reorganization during the last fifty years under the pressure of the progressive liberalization of the European milk market. In 50s and 60s, milk was processed in so-called “Centrali del Latte” (milk processing plants), located throughout Italy, in general within a few kilometers from cities, and later, by regional dairy cooperatives, which succeeded in paying farmers a premium price, thanks to the leading position gained in regional markets and also to local government funding.
At the end of the last decade, as well as nowadays, local milk systems operated in a very competitive market. The national-level dairy firms, such as Granarolo and Parmalat, led the market, holding together about 45% of fresh milk market share in hyper- and super-markets, according to IRI (Information Resources Inc.) data [
32]. They have launched innovative products, such as lactose-free milk and enriched milk, and hold almost 100% of the market share in these sectors. There has been an expansion of brands owned by big supermarket chains (the so-called private labels, PLs), which from 2004 to 2009 gained market share, increasing their sales five-fold through vigorous competition in prices. Furthermore, there is a fierce competition driven by foreigner players.
In this context, decreases in milk prices and the simultaneous increases in production costs, caused by increasing costs of cattle feed, energy and workforce, have induced some farmers who were former members of regional dairy cooperatives to search for alternative marketing channels, such as selling milk directly to consumers. In fact, in most cases, the price paid by a regional cooperative does not cover production costs. For example, in the period from 2007 to 2009, Italian farmers sold milk at an average price ranging from 33 to 36 cents/liter against a cost of production of 39 to 44 cents/liter [
33]. In search of alternative market and distribution channels, automatic vending machines that dispense raw milk for direct sale to consumers have been progressively adopted by farmers in Northern Italy. In 2013 in Italy, there were 1360 such automatic vending machines [
34], though this number is still lower than that recorded in other European countries, such as Germany and Switzerland.
2. Materials and Methods
The explorative analysis carried out in this work compared food miles and CO2 emissions caused by the transportation of three brands of fresh milk currently sold in Umbria: (1) Granarolo, a national brand that has seven production plants of fresh milk distributed across the country (in detail, in the regions of Lombardia, Emila Romagna, Toscana, Lazio, Puglia and Calabria) and sold to big national retail chains (hereafter, national branded); (2) Grifo Latte, a regional brand produced in Umbria and sold to big national retail chains (hereafter, regional branded); and (3) Latte dello Zio (Uncle’s Milk), a brand of raw milk produced in Umbria by two dairy farms and sold locally through four automatic milk vending machines (hereafter, local branded).
We use the concept of food miles as defined by Pirog: “a food mile is the distance food travels from where it is grown or raised to where it is ultimately purchased by the consumer or end-user” [
3] (p. 1), and we have estimated the carbon emission per unit of product over the transport chain, taking into account the amount of food transported [
3,
4], the vehicles/trucks used for transport [
3] and the transport mode and transport efficiency [
4], as there is a trade-off between transport distance, vehicle size and transport efficiency.
In particular, we estimated food miles and CO2 emissions associated with the transportation of milk from farms to the final points of sale, which are big national retailer chains in the case of national and regional brands of fresh milk and vending machines in the case of local raw milk.
In order to do this, in 2011, we conducted 16 face to face interviews with different stakeholders in the milk supply chain: 4 dairy farmers, 3 agricultural industry logistics managers (one of whom works for a regional dairy company, while the other two work for two national companies), 1 manager of logistics that collects regional-branded products, 1 manager of logistics that collects non-regional branded products, 2 buyers for large-scale retail channels (LRS), 3 directors of LRS stores and 2 grocery store owners.
In these interviews, we gathered data about production and logistic structures and their geographical location (farms, dairy companies, logistics platforms, purchasing centers, grocery stores), milk delivery and supply procedures (number of deliveries, means of transport used, quantity of milk and other foods delivered) and the organization of deliveries (number of forms of transport involved, distances travelled from one logistic structure to another, fuel consumption rates of the different means of transport at full-load and the number of times sellers come back during a week).
After calculating the food miles indicator and carbon emissions generated by milk transport in each milk supply chain, we estimated kilometers travelled and CO2 emissions generated by total domestic consumption in Umbria, by considering the average amounts of different brands of milk purchased at large-scale retail trade and at grocery stores.
In order to do a more comprehensive assessment of the environmental burden of transport related to alternative distribution systems of fresh milk, we calculated the variations in terms of CO2 emissions due to the change in raw milk consumption patterns, sold at vending machines. For this purpose, we investigated two different scenarios supposing an increase in local-branded milk market share to the detriment of regional- and national-branded milk, respectively. Finally, a sensitivity analysis has been carried out with the aim to find the combinations of the three brands’ market share that can lead to an increase or reduction of CO2 emissions by 10% compared to the 2011 situation.
2.1. Restructuring of the Three Milk Supply Chains Analyzed
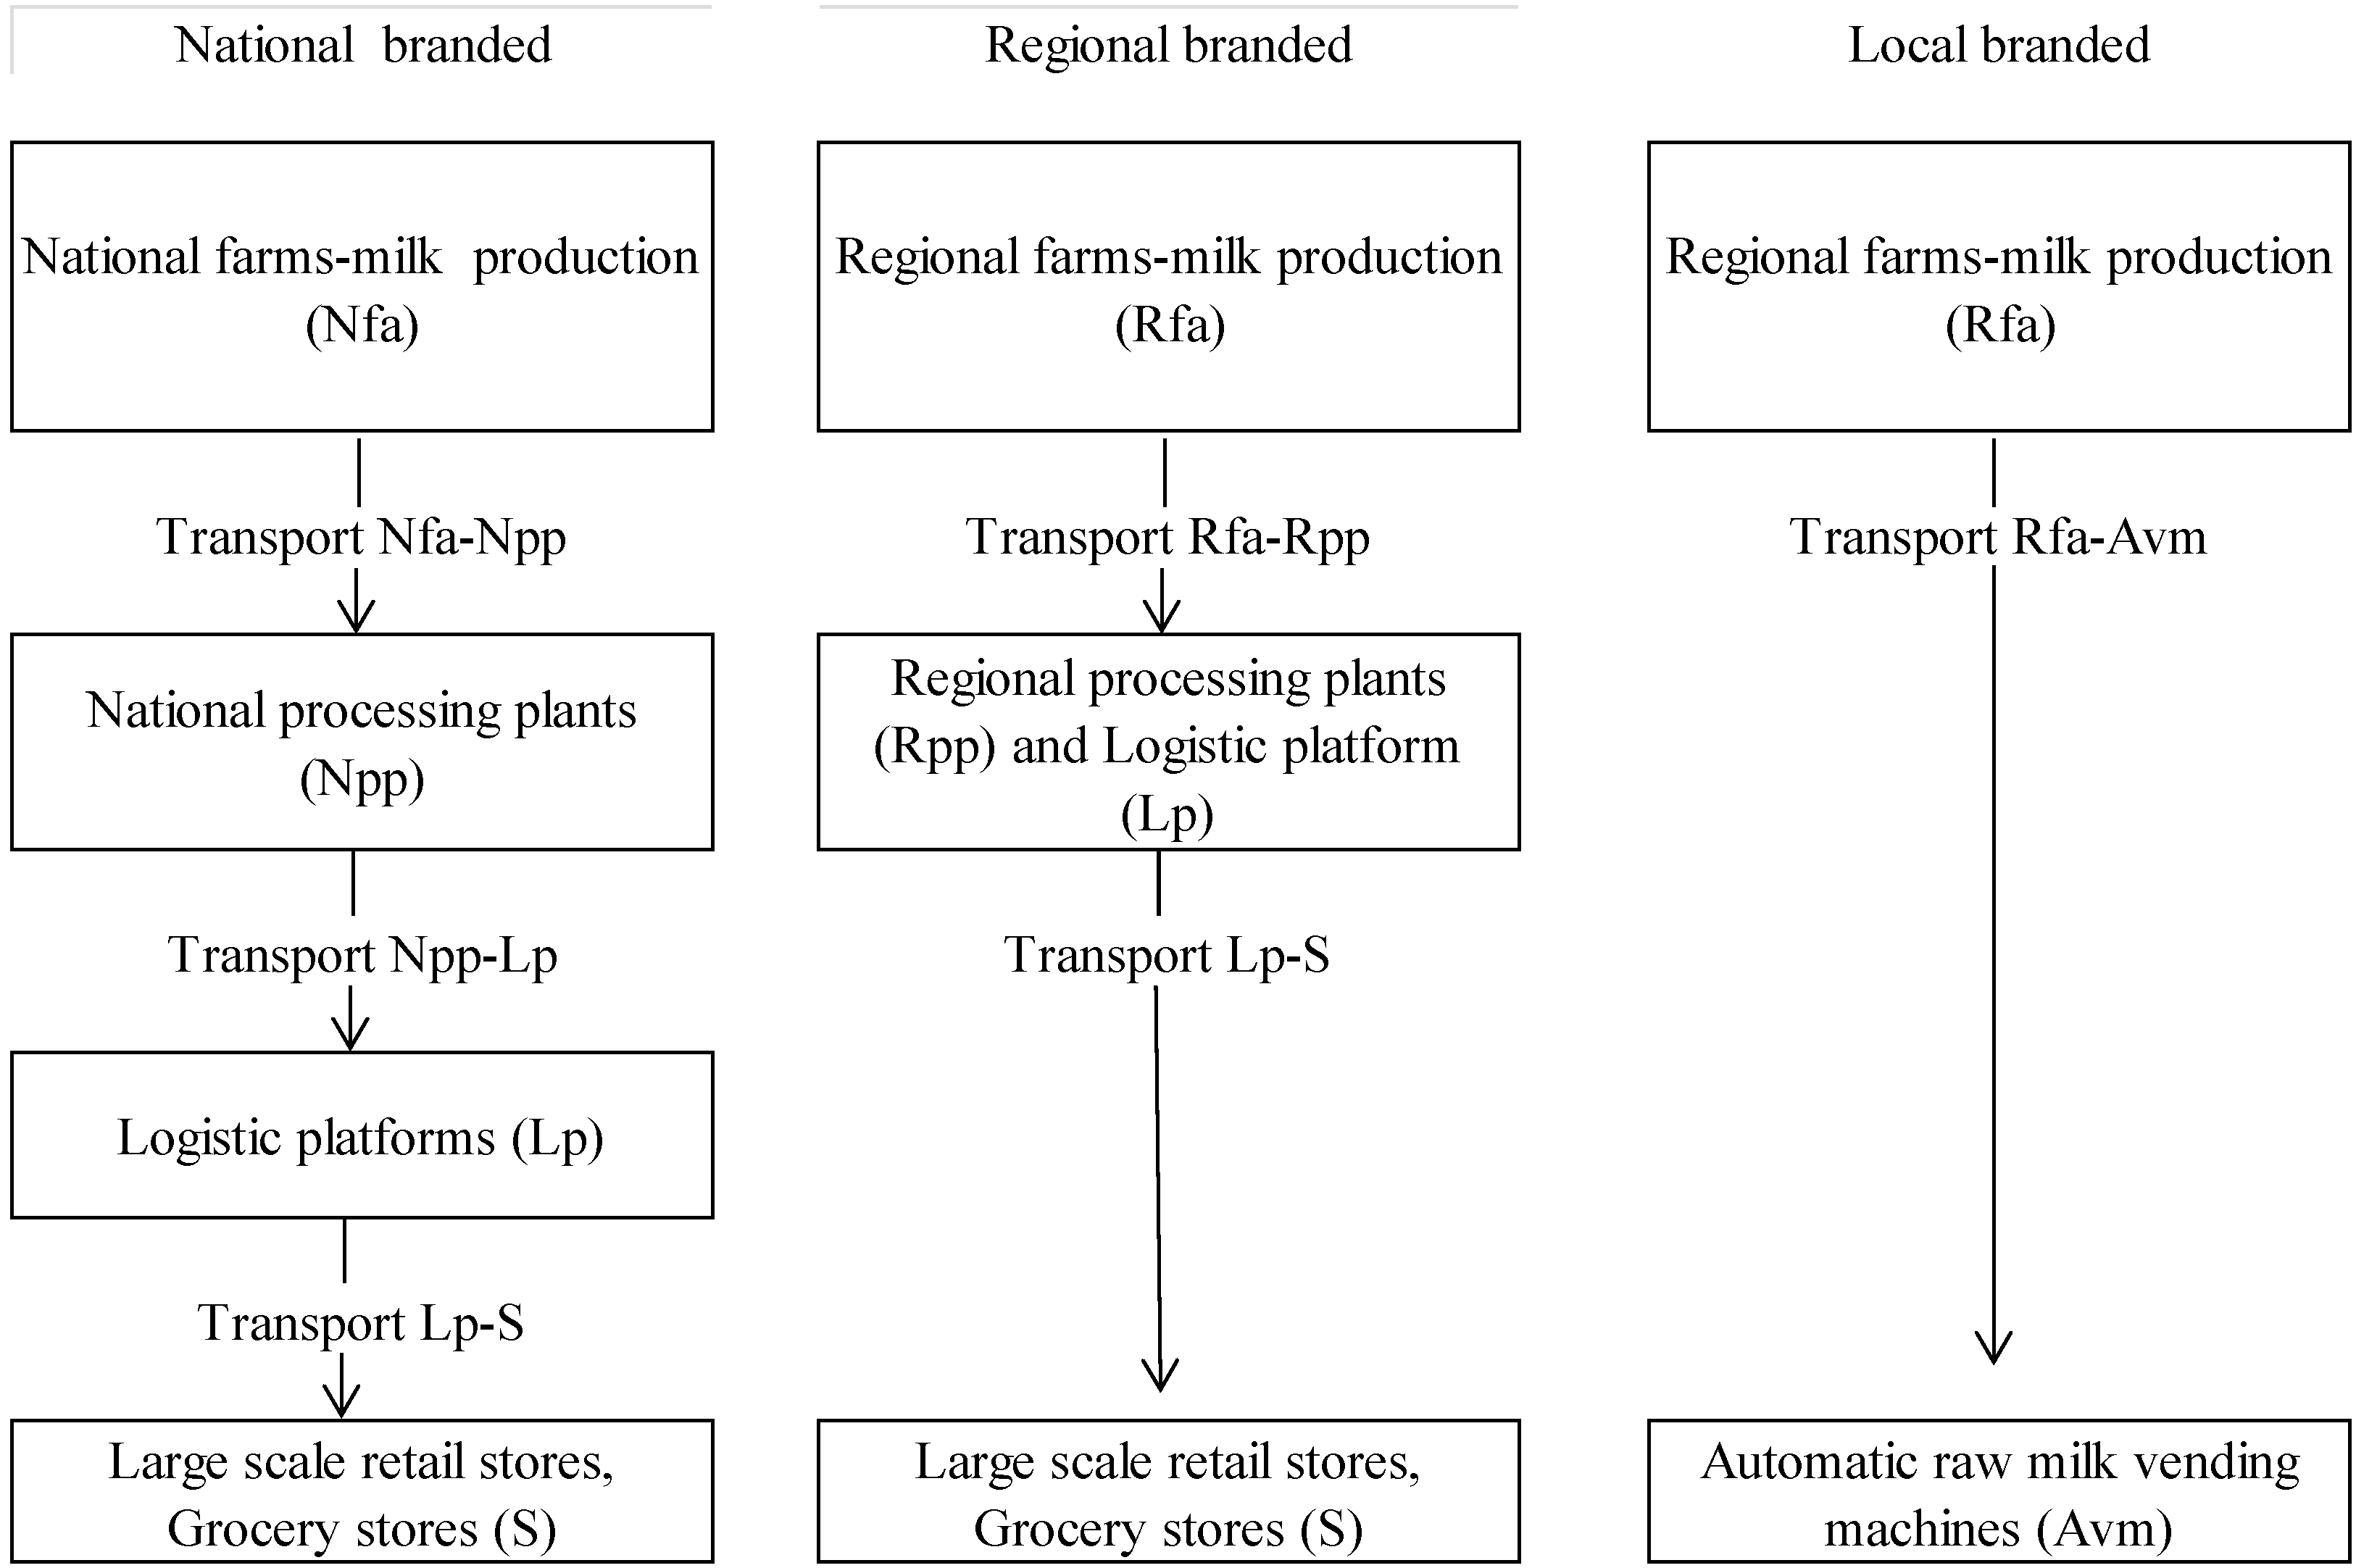
As shown in
Scheme 1, both regional and national production systems for milk include four different logistics structures (farm, milk processing plant, distribution center and point of sale), each of which is controlled by specific economic subjects (farmer, dairy firm, distribution company and management of point of sale). Milk is delivered from each structure to the next one with different means of transport. First, fresh milk is transported from the dairy farms to the processing plants in cooled storage tanks on trucks that consume 0.25 L/km of gasoline (in our analysis, we considered gasoline consumption assuming full-load for all means of transport, as well as empty return rides; moreover, the data source of gasoline use is the Department of Economic Welfare, 2010 [
35]). Second, after being processed and packaged, the milk is moved to regional distribution centers in cooled tanks on 2- to 6-axle semi-trailers that consume 0.5 L/km of gasoline. Third, the packaged milk is then delivered from distribution centers to retailers, in a large cooled van (like a Ducato van), which consumes 0.10 L/km of gasoline.
In the case of raw milk destined for the automatic dispensers, only two logistics structures are involved, the farm and the automatic dispenser, both of which are managed by the farmer who produces and sells the milk (
Scheme 1). The farmer delivers milk from the farm to the dispenser using a Ducato cooled van with a consumption of 0.10 L/km of gasoline.
Scheme 1.
Structures of the three milk supply chains analyzed.
Scheme 1.
Structures of the three milk supply chains analyzed.
Based on the information on the means of transport used and kilometers travelled during each step, the number of journeys carried out and the quantity of milk delivered, we estimated the transport related to each milk supply chain in terms of:
- -
tonnage distance (ton km) travelled in a round trip (total vehicle kilometers), supposing that this distance is driven on average with a half load (50%);
- -
food miles reflecting the actual distance travelled by milk (empty returns are not considered).
Then, we estimated total CO2 emissions caused by transport for each step of the three supply chains by multiplying round trip distance travelled by vehicles, fuel consumption per km and CO2 emissions per liter of fuel. The resulting value was then multiplied by the percentage of milk on total deliveries (30% or 100% based on what the interviewees said), in order to quantify the total emissions related to milk transport. The emissions per kg/liter of milk were obtained by dividing this value for the corresponding amount of milk delivered in each step of supply chain.
2.1.1. Purchase of Non-Regional Brands of Fresh Milk Coming from outside the Region (National Branded)
Fresh milk from outside Umbria is produced mainly by some national brands, such as Granarolo, Parmalat, and private labels (supermarket chains), like Conad and Coop, and secondly, by TreValli and Giglio. The distribution centers of these firms are located in different towns of the region. From these centers, milk is transported to the point of sale (this is the case for Coop) or to a transit point where it is put in a shipment with other food products, according to the orders received.
National dairy firms that work in the regional market differ in their production capacity and in distribution organization. In this study, we consider Granarolo, the leading milk brand in Italy and also the main competitor of Grifo Latte in Umbria, with 38% of the regional market share in the sector of fresh milk. In 2011 Granarolo had a turnover of 850 million euros, seven production plants and 1000 farms that produced nearly two million tons of milk per year.
The Umbrian market of fresh milk is supplied by the production plan of Anzio located in the Lazio region in the center of Italy, where 454 tons of milk are processed per year.
This milk is gathered by 30 Iveco Daily vehicles, for a total distances travelled of 7000 km (
Table 1).
Therefore, in this case, if 30 vehicles travel 7000 km every day, this means each collecting round is 233 km; on average, each liter of milk travels approximately 117 km, corresponding to 1,589,000 total ton kilometers. Granarolo fresh milk is transported from the processing plant in Anzio to the distribution center of Perugia by a cooled truck with a capacity of 7.5 tons, travelling a distance of 484 km.
Therefore, if 1 vehicle travels 484 km every day on average, the total quantity of milk travels approximately 242 km (1421 total ton kilometers).
In order to assess distances travelled from distribution centers to retailers, we used the same data that we applied to the Grifo Latte supply chain.
Table 1.
Transport of national-branded fresh milk, average daily data, 2011.
Table 1.
Transport of national-branded fresh milk, average daily data, 2011.
| | Vehicles | Numbers of vehicles | Number of firms served | Fresh milk tons | Total vehicle kilometers | Total ton kilometers related to daily transport of milk | Food miles: average number of kilometers travelled by milk |
|---|
| Transport a NFa-Npp | Iveco Daily with cooled storage van | 30 | 230 | 454 | 7000 | 1,589,000 | 117 |
| Transport b Npp-Lp | Cooled trucks | 1 | 1 | 5.87 | 484 * | 1421 | 242 |
| Transport c Lp-S | Ducato cooled van | 36 | 663 | 5.87 | 3893 | 11,429 | 54 |
2.1.2. Purchase of Local Fresh Milk Coming from the Region of Umbria (Regional Branded)
Fresh milk produced in the Umbria Region, processed and sold by the Grifo Latte cooperative of Perugia, is collected from 8 regional areas using 8 cooled tank trucks (Iveco Daily) that together cover a distance of 1345 km every day, collecting in total 129.79 tons of milk (126,000 liters) produced by 180 Umbrian farms (
Table 2).
Table 2.
Transport of Regional-branded fresh milk, average daily data, 2011.
Table 2.
Transport of Regional-branded fresh milk, average daily data, 2011.
| | Vehicles | Numbers of vehicles | Number of firms served | Fresh milk tons | Total vehicle kilometers | Total ton kilometers related to daily transport of milk a | Food miles: average number of kilometers travelled by milk |
|---|
| Transport Rfa-Rpp | Iveco Daily 35 with cooled storage van | 8 | 180 | 129.79 | 1345 | 87,283 | 84 |
| Transport
Lp-S | Ducato van | 36 | 663 | 7.19 | 3893 | 14,993 | 54 |
Therefore, if 8 vehicles travel 1345 km every day, this means each collecting round is 168 km, so on average, the total quantity of milk travels approximately 84 km (87,282 ton kilometers, considering a round trip).
The main distribution center is located near the milk-processing plant. It employs 31 sales representatives who work exclusively for Grifo, as well as two small distribution centers, which employ 5 other agents. The vehicles used (Ducato vans) are dedicated to the transport from the regional processing plant to retail and grocery stores of both fresh milk and cheese, based on a proportion of 30% and 70%, respectively.
Considering the average quantity of dairy products transported daily to the 663 retailers (23,870 tons of dairy products, 7194 tons of which are fresh milk, corresponding to 6984 L) and the average kilometers travelled in a day (3893 km), we estimated that fresh milk travels approximately 54 km (14,993 ton kilometers).
2.1.3. Purchase of Regional Raw Milk at Vending Machines (Local Branded)
In 2011 in Umbria, there were four vending machines for raw milk produced by two different regional farms. These machines, located near shopping center entrances, sell about from 90 to 110 L of milk on days the shopping centers are open and 40 liters on the days they are closed.
By selling directly, farmers offer consumers raw fresh milk (after milking), skipping processing plants and distribution channels. The environmental impact of transport depends on the quantity transported along with how far farms are from shopping centers. The two farms are 10 and 20 km away from shopping centers where automatic vending machines are located, while the amount of milk transported by each farm is 0.185 tons per day. Milk is usually transported in a Fiat Doblò without a cooled van with a load capacity up to 1 ton.
Therefore, in order to deliver 0.37 tons of fresh milk at vending machines, we estimated that 120 vehicle kilometers are travelled; they correspond to 22.25 total ton kilometers (
Table 3).
Table 3.
Transport of Local branded raw milk from farm to automatic vending machine, average daily data, 2011.
Table 3.
Transport of Local branded raw milk from farm to automatic vending machine, average daily data, 2011.
| | Vehicles | Numbers of vehicles | Number of firms served b | Fresh milk tons | Total vehicle kilometers | Total ton kilometers related to daily transport of milk | Food miles: average number of kilometers travelled by milk |
|---|
| Transport a RFa-Avm | Fiat Doblò | 2 | 4 | 0.37 | 120 | 22.25 | 30 |
3. Results: A Comparison of Energy Consumption and Emissions during Transport
The estimate of average fuel consumption and CO
2 emissions related to the daily transport of fresh milk shows that (
Table 4):
- -
The means of transport of National branded milk cover a distance of 11,367 km consuming 2260 liters of gasoline with 6000 kg of CO2 emissions in total, 87% of which can be attributed to milk delivery. The transport of one liter of national-branded milk generates 0.1146 kg of CO2 emissions;
- -
The means of transport of regional-branded milk cover a distance of 5238 km consuming 725 liters of gasoline, which implies the production of 1930 kg of CO2 emissions, 1200 of which are related to fresh milk. Based on the amount of milk delivered in each step, the transport of one liter of regional-branded milk along the entire food chain caused 0.0486 kg of CO2 emissions;
- -
The unique mean of transport of local-branded milk covers 120 km from farms to vending machines, consuming 9.6 kg of gasoline, which induces the emission of 25.5 kg of CO2, corresponding to 0.0670 kg per L of milk.
Based on these data, we can state that the transport of regional-branded milk is associated with the lowest CO2 emissions per liter of milk; they are 42% and 73% of those related to national- and local-branded milk respectively.
In particular, compared with the national one, the regional milk chain benefits from the regional location of milk farms, as well as the logistic platform, which is situated near the processing plant, while compared with the local milk supply chain, the economy of scale in terms of the amount of goods delivered allows one to compensate for the higher distances travelled. In this sense, the results confirm that the emerging milk alternative supply chains do not have necessarily less environmental burden in terms of CO2 emissions related to food transport.
Table 4.
Comparison of fuel consumption and CO2 emissions of the three milk supply chains.
Table 4.
Comparison of fuel consumption and CO2 emissions of the three milk supply chains.
| | Brand | Fresh milk tons | Total vehicle kilometers | Total fuel consumption (L) a | Total CO2 emissions (kgkm) | % of fresh milk on total deliveries | Total CO2 emissions related to milk (kgkm) c | Emission of CO2 (kg CO2/kg milk) b | Emission of CO2 (kg CO2/L milk) b |
|---|
| National branded | Granarolo | | 11,377 | 2260.3 | 6012.4 | - | 5287.5 | 0.1180 | 0.1146 |
| Transport a NFa-Npp | | 454 | 7000 | 1750.0 | 4655.0 | 100% | 4655.0 | 0.0102 | 0.010 |
| Transport b Npp-Lp | | 5.87 | 484 | 121.0 | 321.9 | 100% | 321.9 | 0.0548 | 0.0532 |
| Transport c Lp-S | | 5.87 | 3,893 | 389.3 | 1,035.5 | 30% | 310.7 | 0.0529 | 0.0514 |
| Regional branded | Grifo Latte | | 5238 | 725.6 | 1930.0 | - | 1205.1 | 0.0501 | 0.0486 |
| Transport Rfa-Rpp | | 129.79 | 1345 | 336.3 | 894.4 | 100% | 894.4 | 0.0069 | 0.0067 |
| Transport Lp-S | | 7.19 | 3893 | 389.3 | 1035.5 | 30% | 310.7 | 0.0432 | 0.0419 |
| Local branded | Uncle’s Milk | 0.37 | 120 | 9.6 | 25.5 | 100% | 25.5 | 0.0690 | 0.0670 |
In order to estimate kilometers travelled and emissions generated by domestic consumption in Umbria, we consider the average amounts of fresh milk purchased at large-scale retail trade and at grocery stores, in 2011, divided according to the three brand of milk considered, which cover 97% of household regional fresh milk consumption.
The total purchase of fresh milk equals 5000 tons per year, of which 53% is regional brand, 44% is national brand and 3% local brand. This consumption implies 1,168,000 kilometers of transport, diesel consumption of about 148,418 L and 394,792 kg of CO
2 emissions (
Table 5).
Then, we tried to assess how CO
2 emissions caused by milk transport would change if there were a variation in consumers’ purchasing choices towards raw milk sold in vending machines. In order to do this, we supposed two different scenarios:
- (1)
Regional-branded milk has the same market share it had in 2011; local milk accounts for 12% of the regional market, thanks to the opening of four more vending machines (eight in total) and to increases in sales (from 100 to 150 L of milk every day) (the average distance from farms to vending machines remains of 15 km.); national-branded milk loses 9% of its share after the increase in raw milk consumption.
- (2)
National-branded milk has the same market share it had in 2011; raw milk accounts for 12% of the regional market at the detriment of regional-branded milk, which loses 9% of its share.
In the first scenario, energy consumption and CO
2 emissions would be reduced by 5.48% (−21,630 kg of CO
2 emissions in a year) compared to the current situation, while in the second scenario, they would increase by 2.2% (+8361 kg of CO
2 emissions) (
Table 5).
Then, the lower part of
Table 5 shows a sensitivity analysis, based on the 2011 situation, considering three different scenarios of CO
2 emission changes of around 10%. The second one would be desirable, because it could increase the offer of the local-branded milk, allowing enough choice to consumers along with a strengthening of regional-branded milk market share.
Table 5.
CO2 emissions: comparison between milk purchases in 2011 and hypothetical scenarios.
Table 5.
CO2 emissions: comparison between milk purchases in 2011 and hypothetical scenarios.
| | Household consumption | | Reduction/Increase CO2 emissions |
|---|
| | Local branded | Regional branded | National branded | CO2 emissions (kg) | (kg) | (%) |
| Year 2011 | 3.0% | 53.0% | 44.0% | 394,792 | | |
| Scenario 1 | 12.0% | 53.0% | 35.0% | 373,162 | −21,630 | −5.48% |
| Scenario 2 | 12.0% | 44.0% | 44.0% | 403,153 | 8361 | 2.12% |
| Sensitivity analysis | 0.0% | 68.0% | 32.0% | 352,016 | −42,776 | −10.83% |
| Sensitivity analysis | 10.0% | 60.0% | 30.0% | 354,642 | −40,150 | −10.17% |
| Sensitivity analysis | 3.0% | 40.0% | 57.0% | 438,112 | 43,320 | 10.97% |
Some Reflections on Socio-Economic Implications
The assessment of food miles of three different types of milk production systems shows that the purchase of regional-branded milk involves lower CO2 emissions compared to the other two ways of purchase examined.
For the consumer, the purchase of raw milk produced by regional farmers is the most advantageous in terms of price, as it costs 23% less than milk from outside the region (national-branded milk) (
Table 6). Regional-branded milk also costs less than the national brands, but not markedly so, at just 2% less than national brands.
Table 6.
Comparison between environmental and economic performance.
Table 6.
Comparison between environmental and economic performance.
| | National branded | Regional branded | Local branded |
|---|
| Emissions of CO2, (kg CO2/kg milk) | 0.1180 | 0.0501 | 0.0690 |
| Emissions of CO2, (kg CO2/liter milk) | 0.1255 | 0.0516 | 0.0711 |
| Average cost of production of milk (Euro/liter) | 0.390 to 0.440 b | 0.390 to 0.460 a | 0.390 to 0.460 a |
| Average price paid to producers (Euro liter milk) | 0.330 to 0.360 b | 0.396 to 0.402 a | 1.00 a |
As already mentioned, the profitability of Italian dairy farms has decreased in recent years, since the average price paid by processing firms does not cover the dairy farmer’s production costs. However, the price the Umbrian processing firm pays for milk produced in the region is still 16% higher than the average price that other national processing firms pay for milk produced outside the region (
Table 6). This has allowed regional farmers to earn enough to cover production costs, which are similar to average production costs on the national level.
Therefore, the regional fresh milk system is more efficient from the environmental and economic point of view than the national fresh milk system, while automatic vending raw milk system is more advantageous, especially for farmers. In fact, direct sales of milk through vending machines offers dairy farmers an alternative sales channel that enables them to increase their profit margin. Based on the costs of opening a vending machine in Umbria 15 km from a farm, we estimated that: (1) the total production cost of one liter of milk is 0.39 Euros; and (2) 78 liters daily is the minimum amount of milk to sell in order to reach the break-even point when the price of milk is one Euro/liter.
From the consumer’s point of view, the purchase of raw milk costs less than regional or national fresh milk and is more convenient in the sense that even if stores are closed, the vending machines are operational.
Reflecting on the two scenarios proposed above, it is evident that from the socio-economic point of view, an increase in the market share of raw milk would be detrimental to the share held by regional-branded milk. This shift would also entail a number of negative consequences for the local milk production system.
First of all, local processing plants would be weakened, because they would be competing against the much larger Italian food businesses, such as Granarolo, which in some cases boast a 16-fold greater turnover or which control many parts of the food-distribution chains, and also against dairy farmers who have left the cooperative in order to sell their raw milk to consumers directly through vending machines.
In difficult economic times, the regional companies could not pay their members a profitable price for their milk, which has so far been 16% higher than the national price for milk. Secondly, should raw milk increase its market share, the environmental benefits that accrue from lower CO2 emissions for regional transportation of milk would be nullified, because the volume/distance ratio would be skewed unfavorably. Another related disadvantage for regional players would be the inability to maintain capillary distribution of regionally-produced milk. If, instead, raw milk increases its market share to the detriment of national-branded milk, different positive effects could accrue for the local milk production system. For example, in the second scenario, fuel consumption for milk transport would decrease, and the local production system would be strengthened because of the increased profits for dairy farmers from the eight vending machines. At the same time, these farmers could encourage more sustainable and responsible food consumption, which could also benefit regional branded milk.
4. Discussion and Conclusions
In recent years, the idea of limiting “food miles” became intuitively convincing, appealing and easy to communicate to consumers [
36], and many studies have revealed that consumers state positive preferences and are willing to pay for products produced locally and regionally, with fewer “food miles” [
3,
25,
26,
27,
37].
The literature on this topic presents many criticisms. Some authors argue that the concept of food miles is very simplistic and misleading, as it does not take into consideration the entire food system [
3] or consider total energy use, especially in the production of the product [
38]. Others have called into question the validity of the estimates about the reduction in CO
2 emissions, faulting the high variability used to perform the conversion rate between energy resources and CO
2 emissions, criticizing the exclusion of certain types of emissions [
39] and stressing the different dimensions of the considered areas [
10].
In any case, the validity of food miles as an indicator of the sustainability of local food systems depends on the use of a set of other indicators and on the possibility of considering social and economic aspects associated with these systems. Furthermore, additional research needs to be done to improve the logistical efficiency of the local food system and preserve the environmental benefits of shortening the distance travelled from production to consumption [
4]. Mundler and Rumpus (2012) suggest including geographical and social contexts in the analysis of the energy performance of food supply chains [
8].
Even if this single indicator for the total number of kilometers food is transported proves to be invalid for quantifying sustainability [
4], it nonetheless offers a tool for discussing a local food system.
In this paper, the environmental impact caused by the transport of three brands of fresh milk from production farms to point of sale was assessed using the indicator of food miles and CO
2 emissions. In order to do this, we considered household consumption recorded in Umbria, a region in central Italy. The brands we investigated come from production systems that differ in the origin of milk and distribution channels: the most important national brand of fresh milk (Granarolo), the most important regional brand (Grifo Latte), both of them sold at large-scale retail channels, and a brand of raw milk produced by a local farmer and sold locally at automatic milk vending machines. We examined the economic sustainability of each supply system by comparing the current retail price of each brand of milk and the price paid to farmers in each production system, to evaluate how profitable it is for the dairy farmer considering the average cost of milk production. The analysis showed that the regional production system of regional-branded milk can be considered the most efficient in terms of environmental impact, but limited to the transport phase, guaranteeing prices to farmers 16% higher than the national price for milk. Our results regarding food miles and CO
2 emissions are within the range of values found in some previous studies [
21,
40,
41], though not fully comparable, because, unlike this one, they used the “life cycle assessment” methodology: a recent American study [
21] comparing GHG emissions of fifty dairy processing plants found that the production of one kg of milk caused on average 0.203 kg of CO
2 eq, of which 0.058 was produced during the distribution phase from plants to point of sale.
Similarly, according to the Environmental Product Declaration of High Quality (HQ) fresh milk produced by Granarolo, the transport of one liter of this kind of milk caused 0.021 kg CO
2 eq from the processing phase to the logistics platforms [
40], while the same quantity of HQ milk produced by Coop caused 0.060 kg CO
2 eq from farm gates to the logistics platforms [
41]. If we consider that during the transport phase, the contribution to total global warming potential is mainly due to CO
2 if compared with CH
4 and N
2O [
42], it is reasonable to state that these values are comparable with the one in our results (according to the estimates conducted in 1990 on GHG emissions related to the transport of goods in Italy and expressed in terms of CO
2 eq, 98% is due to CO
2 emissions, 1% to CH
4 and 1% to N
2O [
43].
Furthermore, considering the impact of packaging, in our case study, if consumers dispense the raw milk into their own used and sterilized bottles, this savings of packaging material will mean a reduction of CO2 emissions related to production, transport and disposal of normal Tetra Pak, PET or other packaging. Specifically, we estimated that if consumers use the same one-liter bottle 11 times when they buy raw milk, the gap in CO2 emissions between the local milk system of automatic vending machines and the regional production system of milk would be nullified.
One limit to our study is that we did not include the impact of the round-trip distance travelled by consumers from home to point of sale and back. We did not include this factor because both the regional and national brands we investigated are widely distributed throughout the region. However, the question of round-trip distances travelled by consumers is receiving increased attention in the debate about sustainable food systems [
31], and it represents one of the reasons to reconsider the concept of localism, as suggested by Coley
et al. [
10].
Furthermore, it should be taken into consideration that not all new automatic milk vending machines can be located in proximity to shopping centers. This supports the regional distribution system of Grifo Latte fresh milk as the most sustainable of the three systems in environmental (although limited to transport) and social terms.
However, the comparison of these milk production systems to determine which is the most sustainable might benefit from taking into consideration broader issues. As Coley
et al. (2009) argued, “the most geographically local produce
per se does not necessarily mean the lowest carbon impact. Many factors are involved. Nor is carbon the only way to evaluate the impact of purchasing decisions. We might also need to factor in the implications for biodiversity and landscape, for local employment, for fair trade and for international social justice” [
10] (p. 154).


