Article

Influence of Agricultural Practices on Biotic Production Potential and Climate Regulation Potential. A Case Study for Life Cycle Assessment of Soybean (Glycine max) in Argentina

by
Roxana Piastrellini
1,2,*,
Bárbara María Civit
1,2 and
Alejandro P. Arena
1,2
1
CLIOPE-Universidad Tecnológica Nacional-Regional Mendoza, Coronel Rodríguez 273, M5502AJE Mendoza, Argentina
2
Consejo Nacional de Investigaciones Científicas y Tecnológicas CONICET-CCT Mendoza, Ruiz Leal, Parque Gral. San Martín, M5500 Mendoza, Argentina
*
Author to whom correspondence should be addressed.
Sustainability 2015, 7(4), 4386-4410; https://doi.org/10.3390/su7044386
Submission received: 24 December 2014 / Revised: 6 April 2015 / Accepted: 8 April 2015 / Published: 14 April 2015
(This article belongs to the Special Issue Sustainability of Resources)

Abstract

:
The aim of this study is to determine the impact potential of land use on biotic production and climate regulation in the agricultural phase of a product, taking into account the varied soil and crop management. Land occupation and transformation impacts of soybean production in Argentina for different agricultural systems are evaluated. The results indicate that the magnitude of occupation and transformation impacts is considerably reduced by implementing no-tillage instead of conventional tillage. Nevertheless, the methodologies adopted are unable to show any of the expected differences between rainfed or irrigation systems, crop sequences and delays in seed-planting, due to failures in the specific characterization factors. On the other hand, an uncertainty is demonstrated by the results associated with the choice of regeneration time corresponding to the different ecoregions over which soybean cultivation extends across the country. One of the recommendations that comes to the fore is to consider in the characterization factors increments in the soil organic carbon stock and in the mineralization rates, associated with the presence of the preceding crop and the greater availability of water in the soil of irrigated systems.

1. Introduction

The growing interest in environmental impacts linked to the production and consumption of goods and services have fostered the development of methodologies that enable quantifying the said impacts and evaluating the environmental advantages of alternative products. In this sense, one of the strongest tools is the Life Cycle Assessment (LCA), endorsed by the International Organization for Standardization through the ISO 14040 [1] e ISO 14044 [2] norms.
Land use and the associated potential impacts have lately gained relevance in LCA studies of agricultural products. The term “land use” refers to a classification of human activities that occupy a land area, while the expression “land use impacts” denotes changes of anthropic origin produced in the land quality, such as decreases in biodiversity, increased soil compaction or loss of nutrients [3], related to physical occupation and transformation of land areas. These cause modifications in the quality of ecosystems, meaning the capacity of bearing biodiversity and rendering services to society, such as the production of biomass and catching hydric resources [4]. The land occupation implies impacts over flora, fauna, soil and soil surface during a period which human activity is maintained, while the process of transformation, commonly known as “land use change” (LUC), denotes changes in the flora, fauna, soil or soil surface from an original state to an altered state [5].
Several authors have studied different indicators to evaluate land use impacts [6,7,8,9,10,11,12,13,14,15], considering aspects like the surface of occupied land, the influence over biodiversity, the life-support functions, soil productivity, and the capacity of ecosystems to dissipate exergy. However, it is not simple to apply these indicators in LCA studies of products, which is why the UNEP-SETAC Life Cycle Initiative has recently developed a methodological guide [5] to evaluate occupation and transformation impacts of the soil over biodiversity and ecosystem services with life cycle thinking, applicable to any planet region.
Most available studies on land use impacts in the life-cycle of agricultural products are focused on evaluating changes in greenhouse gas emissions resulting from crop expansion towards other ecoregions [16,17]. Others include indicators related to the changes in the soil organic matter, the acidification and the eutrophication [18], the soil erosion, the changes in soil structure and the loss in biodiversity [19]. A few studies use the methodology proposed by the UNEP-SETAC [5]. Among them are Milà i Canals et al. [20] and Antón et al. [21]. Milà i Canals et al. [20] study land use impacts over biodiversity and ecosystem functions of different crops used as raw material to manufacture margarine. Antón et al. [21] evaluate impacts of the biotic production, biodiversity and soil erosion of intensive (use of chemical fertilizers and pesticides) and extensive (includes organic manure application and the use of intermediate crops to catch excess nitrogen) crop production.
Nevertheless, the studies available do not contemplate possible modifications in impact results associated with the adoption of different tillage systems and conservationist practices.
One of the conservationist agricultural practices that has been adopted widely in recent years is that of no-tillage. This technology operates in the absence of any type of plowing and in the presence of a permanent soil covering with previous crop stubble. This practice allows production without damaging the soil, and very often improves its physical, chemical and biological conditions. At the moment, about 135 million hectares are produced around the world in no-tillage [22] concentrated in a few countries, the United States, Brazil and Argentina being among them.
No-tillage enables simplifying crop handling and incrementing productivity levels per hectare of occupied land, motivating a large number of producers to expand the cultivated surface. To incorporate new agricultural land involves not only the use of land, degraded or in disuse, but also the advance toward preservation areas of natural ecosystems and the transformation of cattle breeding areas or areas of lower income yield capacity, thus awakening a growing concern in different sectors of society.
The aim of this study is to determine the potential impact on biotic production and climate regulation due to the use of land during the agricultural phase of soybean (
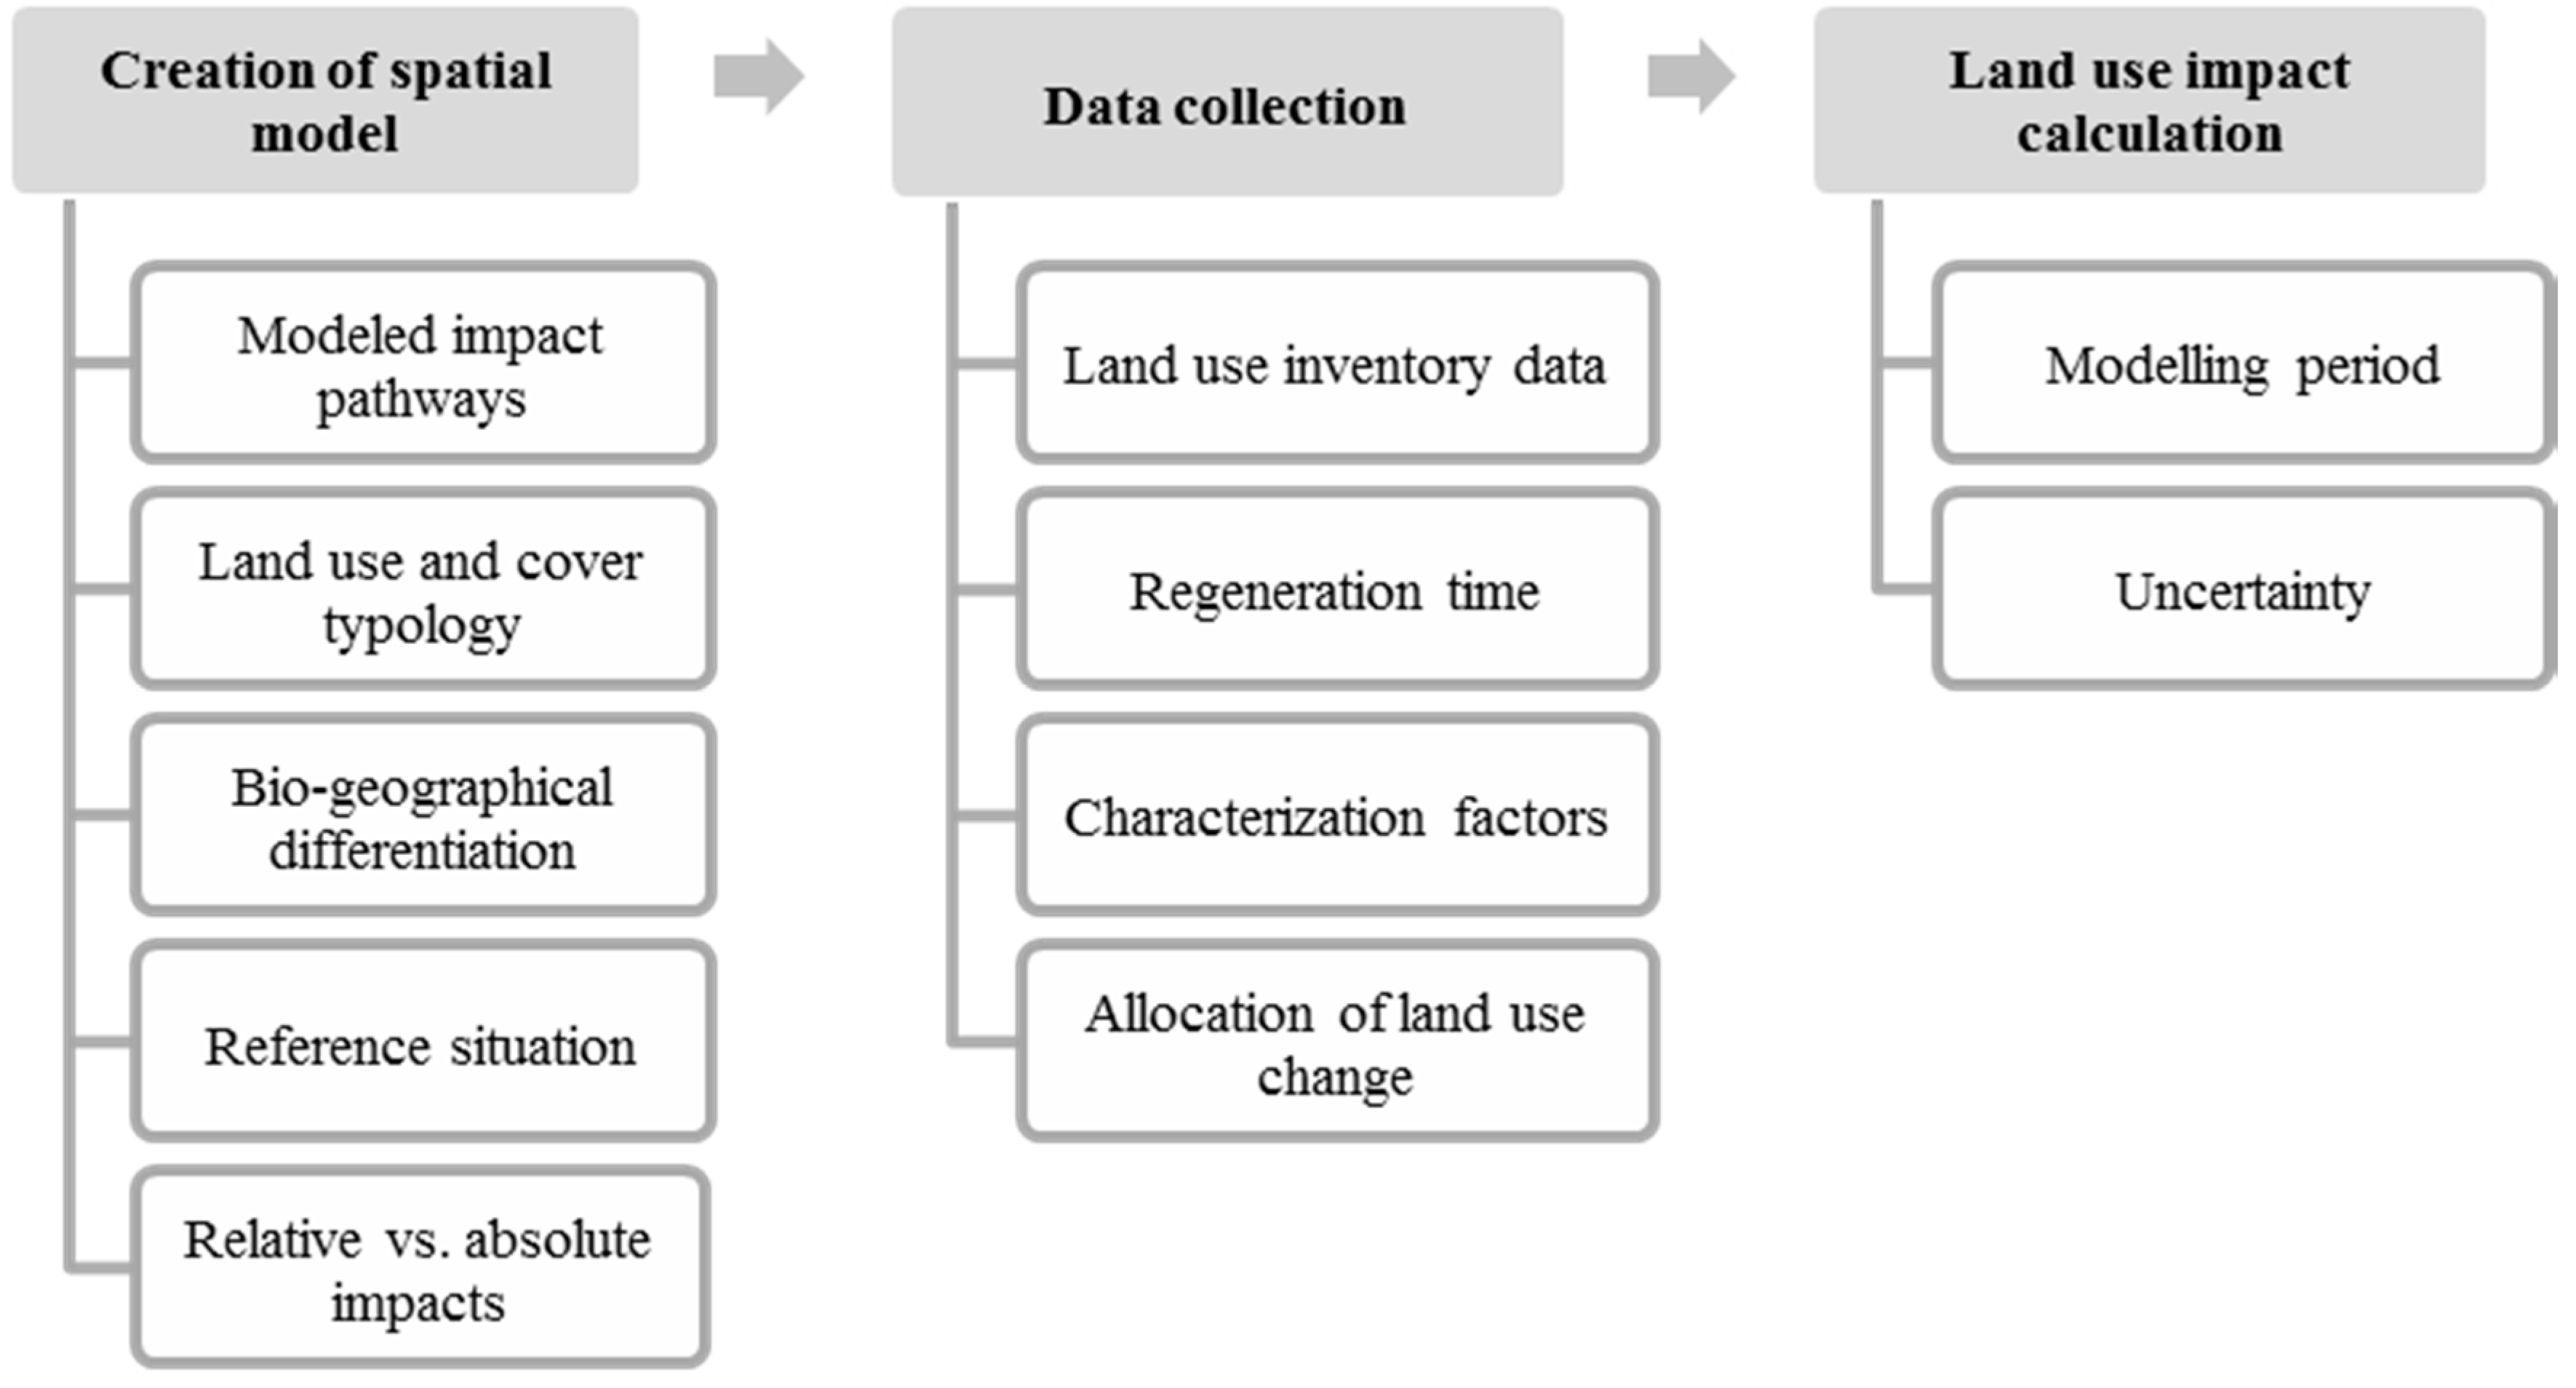
Glycine max) in Argentina, considering different practices in crop management. The impact caused by the occupation of land is calculated in the most common soybean cultivation conditions in the country: conventional tillage, no-tillage, rainfed cultivation and cultivation with supplementary irrigation. The impacts due to the transformation of land use from conservation areas to cultivated ones are also evaluated. The land use inventory methodology proposed by Koellner et al. [5] is considered. A regional approach is followed during the impact assessment phase, differentiating the intrinsic characteristics of the different ecoregions where the crop is cultivated in Argentina.

2. Materials and Methods

2.1. Life Cycle Assessment

Life Cycle Assessment (LCA) is a methodological tool to address the potential environmental impacts generated by human activities such as climate change or ecotoxicity impacts, and environmental aspects at each step of a product’s life cycle from raw material acquisition through manufacturing, use, end-of-life treatment, recycling and final disposal. LCA is a tool to support decision-making in many product systems [2,5,23].
LCA studies comprise four phases: (i) the goal and scope definition; (ii) inventory analysis; (iii) impact assessment; and (iv) interpretation [1]. The goal should clearly state the intended application, the reasons for carrying out the study and the audience to which it is expected to communicate the results to. The scope should be defined by considering the system functions and functional unit (FU). The FU is the amount of product needed to fulfill the main function of the system and provides a benchmark against which the input and output streams are recorded. LCA studies consider flows into and out of all stages of the life cycle; however, the scope of the study may be limited to certain stages, taking into account their degree of relevance. The inventory analysis refers to the collection and quantification of data for the inventory lifecycle. The inventory shall include the inputs and outputs of matter and energy (inputs, raw materials, products, emissions, solid waste, land occupied and/or transformed others) for each stage of the life cycle, taking as reference the FU. In the phase of evaluation of impacts, the magnitude and significance of the potential environmental impacts for the system under study is analyzed, using the results of the previous phase. The inventory data are assigned to different impact categories according to the expected environmental effect. Then, impact indicators are calculated for selected categories, using characterization factors. Characterization factors reflect the relative contribution of a life cycle inventory result to the impact category indicator result. In the life cycle interpretation phase, the findings of the inventory analysis and of the impact assessment are evaluated in relation to the defined goal and scope, in order to reach conclusions and recommendations.

2.2. Land Use Impacts in LCA

The study was developed following the recommendations of the UNEP-SETAC [5] Guideline. As show in Figure 1, the UNEP-SETAC Guideline distinguishes three necessary elements to carry out the land use impacts evaluation: (i) the creation of spatial model; (ii) the data collection; and (iii) the calculation of land use impacts. The creation of a spatial model implies choosing impacts indicators, land use and cover typology and bio-geographical differentiation level that will be used to define characterization factors (CF), specifications for a reference situation and the way to evaluate impacts (absolute changes or relative changes to a reference situation). The data collection implies the definition of inventory flows for land occupation and land transformation, the definition of regeneration time, the choice of generic characterization factors or the calculation of case-dependent characterization factors, and the definition of land use change allocation criteria (impacts from land transformation have to be amortized to functional unit arising from the new land use). The calculation of land use impacts includes choosing the period during which the calculation of land use occupation and transformation impacts is carried out, and the uncertainty analysis.
Figure 1. Elements of the UNEP-SETAC Guideline to build a land use impact assessment for biodiversity and ecosystem services. Adapted from [5].
Sustainability 07 04386 g001
The UNEP-SETAC [4] proposes a flexible system to incorporate the regionalization at land use inventory flows. The system consists of adopting different levels of detail: (i) level 1: differentiation between biomes; (ii) level 2: differentiation between climatic regions; (iii) level 3: classification for terrestrial, freshwater and marine biomes; (iv) level 4: classification for terrestrial and freshwater ecoregions; and (v) level 5: include exact geo-referenced information of land use. In this paper, in order to have an accurate land use impact assessment, the fourth level of regionalization is taken into account.
Land use impacts were estimated by relating the occupation and transformation elemental flows to effects over ecosystem services, using determined characterization factors based on general equations developed by Milà i Canals et al. [24]:
O I = Q × T o c × A o c
C F o c = Q
T I = 0.5 ×   Q × T r e g e n × A t r a n s
C F t r a n s = 0.5 × Q × T r e g e n
where OI is the impact of land occupation; TI is the impact of land transformation; ∆Q represents the difference in the ecosystems quality between a specific situation of land use and the reference situation; Toc is the occupation time; Tregen is the regeneration time; Aoc is the occupied area; Atrans is the transformed area; CFoc and CFtrans are the occupation and transformation characterization factors, respectively. The regeneration times refers to the number of years necessary for the soil characteristics and the present system vegetation to be similar to those corresponding to the type of former land use. The model assumes that transformation impacts are reversible and that ecosystems regeneration is linear. As to the reference situation, the UNEP-SETAC Guideline recommends adopting the (quasi-) natural land cover predominant for each biome or ecoregion.
The methodology of the UNEP-SETAC proposes two impact categories to assess the damage to biodiversity (species diversity and functional diversity) and five impact categories to assess the damage to ecosystem services (Biotic Production Potential, Climate Regulation Potential, Freshwater Regulation Potential, Erosion Regulation Potential and Water Purification Potential) [5].
Two of the main effects of no-tillage on the Pampean Region are the redistribution of organic matter in the soil profile and changing the potential to uptake C from air and storage in the soil as organic C [25]. The capacity of soils to store C depends on different factors such as soil type and climatic characteristics of the region. However, the most influential factors are the type of land use and the soil and crop management [26]. Studies developed in the Pampean Region show that, on average, no-tillage increases SOC stocks by up to 15% compared with conventional tillage. [27,28,29].
Others authors argue that no-tillage and the proper handling of stubbles provide others benefits compared to the conventional tillage besides C uptake, such as increased soil protection from solar radiation and consequently reducing surface evaporation [30,31], increased infiltration [32] and water retention in the soil profile [33], optimization of the soil structure and the porous system [34,35,36], variation the soil thermal regime [37], and reduction the erosion rates [38,39]. All these property changes affect the carbon balance of the soil [25]. For these reasons, in this paper only the ecosystem services included in the UNEP-SETAC Guideline that consider the carbon flows between soil and atmosphere (biotic production and climate regulation) are evaluated, through the impact categories Biotic Production Potential (BPP) and Climate Regulation Potential (CRP). Next, the calculation proceedings used to estimate characterization factors corresponding to these categories are described.

2.2.1. Biotic Production Potential

Biotic Production Potential measures the present land conditions that determine its capacity in the short, medium and long term to produce and sustain a useful bio-mass, such as food, wood, fiber, energy, medicinal species, ornamental species, others [40]. BPP depends on land use and ecosystems sensitivity where human activity develops. To calculate characterization factors of transformation (CFtrans) and occupation (CFoc) that allow evaluating impacts on the BPP, general equations were applied developed by Brandão and Milà i Canals [40] based on changes in the soil organic carbon (SOC) stock (Equations (5) and (6)). SOC is usually used to measure the soil organic matter (SOM) content [40]. SOM plays an important role as a soil constituent and as source of food and energy for soil biota. It affects most soil properties, including texture and structure, which together determine the general productivity of cropping systems by influencing the availability of nutrients [11]. For these reasons, SOC is chosen for Brandão and Milà i Canals [40] as indicator for BPP. The CFtrans and CFoc reflect the SOC deficit associated with each land-use intervention relative to the native SOC (Figure 2).
C F t r a n s = ( S O C p o t S O C L U 1 ) × ( T r e g e n 1 T i n ) + 1 2 ( T r e g e n 1 T i n ) × ( S O C L U 1 S O C L U 2 )
C F o c =   ( S O C p o t S O C L U 2 )
In Equations (5) and (6), SOCpot is the potential value of SOC when the land has not been disturbed (for example, with soil covered with native vegetation); SOCLU1 is the value of SOC for the type of land use previous to transformation or occupation; SOCLU2 is the value of SOC in the subsequent land use; Tin represents the moment when transformation occurs; Tregen indicates the moment when the SOC level has recovered to the state previous to land transformation. The values of SOC are expressed in kg C m−2, while the values of T are expressed in years.
The method assumes that the carbon stock changes associated with land use changes happen instantly, so the transformation impact can be fully ascribed to transformation processes, instead of occupation processes (Figure 2).
SOC stock depends on the type of soil and the climatic characteristics of the region. However, the most influential factors are the type of land use and the specific soil and crop management [26]. Soil management may cause a liberation effect of CO2 when conventional tillage practices are used, or organic C accumulation when conservationist tillage is applied. SOC changes were estimated using Guidelines for National Greenhouse Gas Inventories developed by the Intergovernmental Panel on Climate Change-IPCC [41]:
C m i n = ( S O C 0 S O C ( 0 T ) ) D
SOC = c , s , i S O C p o t c , s , i × F l u c , s , i × F m g c , s , i × F i c , s , i × A c , s , i
In Equation (7), ∆Cmin represents the annual change in carbon stocks in mineral soils (in t C year−1); SOC0 is the soil organic carbon stock in the last year of an inventory time period (in t C); SOC(0-T) is the soil organic carbon stock at the beginning of the inventory time period (in t C); T is the number of years over a single inventory time period; and D is the time dependence of stock change factors (commonly 20 years).
Figure 2. Calculation of impacts on biotic production potential measured by soil organic carbon. Source: [40].
Sustainability 07 04386 g002
In Equation (8), SOCpot represents the reference carbon stock (in t C ha−1); Flu is the stock change factor for land-use systems for a particular land use; Fmg is the stock change factor for management regime (e.g., different tillage practices); Fi is the stock change factor for input of organic matter; A is the land area of the stratum being estimated (in ha); c represents the climate zones; s the soil types; and i the set of management systems. The factors Flu, Fmg and Fi are dimensionless.
After obtaining characterization factors, impact over BPP was determined as a deficit of C in the soil, related to SOC conditions in natural conditions.

2.2.2. Climate Regulation Potential

The impact associated to Climate Regulation Potential was estimated considering the capacity of ecosystems to uptake carbon from air and the C flow change due to land use. For the calculation of characterization factors, the procedure developed by Müller-Wenk and Brandão [42] (Equations (9)–(11)) was adopted. The authors argue that the occupied or transformed areas by man may store reduced amounts of carbon in the soil and vegetation, in comparison to biomes in their natural state. Carbon that cannot be stored is transferred essentially to the atmosphere in the form of CO2, contributing to global warming. The magnitude of climatic impact is determined by the amount of C transferred to the atmosphere per hectare of occupied or transformed land for the length of carbon permanence in the air (Equations (9)–(11)).
C F t r a n s = C t a , t r a n s × d f
C F o c = C t a , o c × d f
d f = T l u T f c
In Equations (9) and (10), CFtrans and CFoc represent the characterization factors of transformation and occupation, respectively; Cta is the amount of C transferred to the air, due to the land occupation (Cta,oc) or land transformation (Cta,trans); and df is the duration factor. The reference unit is the duration the mean stay in air of carbon from fossil combustion and similar industrial processes. Therefore, CFtrans and CFoc are expressed in fossil-combustion-equivalent ton C per hectare (t Ce ha−1).
In Equation (11), df is calculated from the ratio between the average CO2 stay in air due to the land use (Tlu) and the average CO2 stay in air due to fossil combustion (Tfc). Tlu is considered equivalent to half the relaxation time (or regeneration time), that is to say, the moment when the natural ecosystem regenerates itself completely in a spontaneous way, inducing return flows of atmospheric CO2 toward vegetation and soil. The method assumes that the global warming effect of a CO2 quantity depend on its average stay in air. The average time that a CO2 molecule stays in air can be calculated only for a finite number of years. The climatic influence of CO2 after this cutoff point (time horizon) is considered to be negligible. Tfc corresponds to 47.5 years for a time horizon of 100 years and 157 years for a time horizon of 500 years.
Müller-Wenk and Brandão [42] publish values of Cta, df and characterization factors of land occupation and land transformation to assess the impacts on the CRP for different terrestrial biomes (tropical forest, temperate forest, boreal forest, tropical grassland and temperate grasslands) and land uses (artificial land, forest land, pastureland and cropland). However, these factors do not differentiate between agricultural practices. This method is adopted in this paper considering the impacts of occupation and land transformation depend on both the CF and yields of crops [23].

2.3. Description of the Case Studied

The study zone corresponds to the Pampean Region, situated in the center-east of Argentina (Figure 3). In this region, 86.5% of the total soybean production of the country is concentrated [43]. Meanwhile, 88% of the cultivated surface is carried out under no-tillage [44]. However, some systems coexist that respond to former production models like conventional tillage.
The Pampean Region belongs to the warm, temperate, dry climatic class [41] and the rainfall ratio enables soybean to be cultivated in rainfed conditions. Though, the cultivated surface under supplementary irrigation is constantly increasing.
Soybean is a summer crop. In October to November, early soybean is sown and its cycle lasts six months. Meanwhile, in the month of December, the late soybean is sown; thus named due to the delay following the optimum date. Crops planted in December are generally preceded by wheat (Triticum sp.), that are harvested a few days before sowing soybean; this allows for crop rotation. In the present work, the following agricultural production systems are considered: early soybean in no-tillage under rainfed conditions (no-till early), late soybean in no-tillage under rainfed conditions (no-till late), early soybean in no-tillage under supplementary irrigation (no-till irrigated), and early soybean in conventional tillage under rainfed conditions (till-early). In these systems, we assumed that all year only a complete cycle of soybeans is developed, so the soil remains crop free for the most part of the year. However, it is possible to increase the annual land occupation through cropping sequences, which involve vegetal species that can grow in the winter season. Therefore, an additional scenario of no-tillage under rainfed conditions with a double crop sequence wheat/late soybean (no-till rotation) is included in the land occupation impact assessment.
Figure 3. Dynamics of the agricultural frontier of production under rainfed conditions. The dark grey area corresponds to the Northwest Region and the light grey area corresponds to the Pampean Region. The inner solid lines represent provincial borders. The fronts represent mobile lines of contact between agriculture lands (annual crops under rainfed conditions) and conservation areas, grasslands and pastures. Lines with triangles and/or semicircles indicate the direction of the fronts. The higher density areas correspond to annual crops grown under rainfed conditions. Adapted from [45].
Sustainability 07 04386 g003
Even if the greater part of soybean production in Argentina is carried out in areas that have been modified for over 100 years [46], several authors such as Altieri and Pengue [47] and Viglizzo et al. [45] argue that there is also an advance in the agricultural frontier strictly linked to increased deforestation registered in the Northwest Region of Argentina, particularly in the Chaco forest and Yungas forest ecoregions (see Figure 3). In the present work, we include an analysis of a possible transformation in land use based on data presented by these authors, with the sole aim of emphasizing the important variations that the results may suffer when considering the LUC. According to the distribution of soybean production systems presented by [48], and the dynamics of an advance in the agricultural frontier published by [45], in this case, it is considered that the farming systems correspond to early soybean and rainfed conditions (no-till early and till-early systems).
The type of crop handling carried out implies important variations in grain yield. Technical reports carried out in Argentina [48,49,50,51,52] attribute falls of up to 20% in yields from conventional tillage with respect to a system based on a no-tillage, and a yield increase of 10% in cropping sequences and 14%–60% in systems that carry out additional fertilization of sulfur and phosphorus or that incorporate supplementary irrigation. These reports are part of the official publications of the Instituto Nacional de Tecnología Agropecuaria and consider average values of crop yield of at least 10 seasons. Based on these studies, the yields adopted in this work for each productive system are: 2800 kg ha−1 for no-till early; 2200 kg ha−1 for no-till late; 3800 kg ha−1 for no-till irrigated; 2380 kg ha−1 for till-early and 2420 kg ha−1 for no-till rotation. For all production systems, the FU defined is 1 kg of soybean.

2.3.1. Land Occupation

In order to incorporate the regionalization at land use inventory flows, terrestrial biomes published by [53] in [4] are taken into account, while the distribution of the main types of land cover and ecoregions is analyzed from Land Cover Classification System LCCS cartography from FAO/UNEP, offered by the Instituto Nacional de Tecnología Agropecuaria [54]. The ecoregions considered are: Espinal, Pampas and Humid Chaco, belonging to the following biomes: Temperate grasslands and Tropical grasslands. Two typologies of different land use were assumed: arable, irrigated and arable, and non-irrigated, based on the land use classification recommended by Koellner et al. [4]. In Table 1, the results of inventory of land occupation for each of agricultural systems studied are presented. For no-till early, no-till late, no-till irrigated and till early systems, a surface equivalent to 1 hectare planted wholly with soybean and an occupation time of one year (corresponding to annual crop) is considered. For no-till rotation system, is taken into account a relation of 0.9:1 between the months occupied by late-soybean and the months occupied by wheat [55]. To carry out the allocation, it is assumed that the occupation impact per hectare is similar during all the months of the year in which the land occupation occurs.
In the definition of the spatial model of the occupation impact over BPP, a long-term cultivated soil was taken into account and a medium ratio of inputs application, while to estimate the impact over CRP an average CO2 stay in air due to fossil combustion of 47.5 years was considered corresponding to a temporal horizon of 100 years. To estimate SOC, factors recommended by the IPCC [41] were adopted corresponding to warm temperate dry climate region, an existence of C with a 30 cm depth reference of high activity clay soils, changes in carbon stock for annual crops, and soil management practices linked to conventional tillage and no-tillage. The inventory data of SOC are presented in Table 2 and the parameter data derivations are summarized in Table 3.
Table 1. Inventory data of land occupation for soybean production in the Pampean Region and land transformation caused for the possible advance of soybean to the Northwest Region, Argentina.
Climate Region *Geographic RegionBiome *Eco-Region *SystemLand OccupationToc (Year)Aoc (m2 kg−1 Soybean)Land Use ChangeAtrans (m2 kg−1 Soybean)
Warm temperate dryPampean RegionTemperate grasslandsPampasNo-till earlyArable, non-irrigated13.57--
No-till late14.55--
Till-early14.20--
No-till rotation0.474.13--
EspinalNo-till earlyArable, non-irrigated13.57--
No-till late14.55--
No-till rotation0.474.13--
No-till irrigatedArable, irrigated12.63--
Tropical grasslandsHumid ChacoNo-till earlyArable, non-irrigated13.57--
Tropical dryNorthwest RegionDry tropical forestYungas forestNo-till earlyArable, non-irrigated13.57Forest, used-Arable, non-irrigated3.57
Till-early14.204.20
Tropical grasslandsChaco forestNo-till earlyArable, non-irrigated13.573.57
Till-early14.204.20
* Source: climate region [41], biomes [53], ecoregions [54].
Table 2. Inventory data of SOC for the soybean production in the Pampean Region and Northwest Region, Argentina.
BiomeSystemSOCpot (t C ha−1)FluFmgFiA (ha)SOClu (t C ha−1)SOClu (t C kg−1 Soybean)
Temperate grasslandsTill-early380.81.01.0130.400.0128
No-till early380.81.11.0133.440.0119
No-till late380.81.11.0133.440.0152
No-till irrigated380.81.11.0133.440.0088
No-till rotation380.81.11.0133.440.0138
Tropical grasslandsNo-till early380.81.11.0133.440.0119
Dry tropical forestTill-early380.581.001.0122.00.00924
No-till early380.581.171.0125.80.00921
Tropical grasslandsTill-early380.581.001.0122.00.00924
No-till early380.581.171.0125.80.00921
Table 3. Summary of parameter data derivation.
ParameterSource
Climatic regionsPublished data [41]
BiomesPublished data [53]
Land use/cover classPublished data [4,54]
Location of agricultural systemsPublished data [45,48,49,51]
Crop yieldsPublished data [48,49,50,51]
Flu; Fmg; FiPublished data [41]
SOCpot; DPublished data [41]
SOCLU1; SOCLU2Calculated
Cta; Tlu; TfcPublished data [42]
DfCalculated
Tin; TfinDerived from agricultural practices
TocDerived from agricultural practices. Published data [55] for no-till rotation system
TregenPublished data [40,41,42,56]
Criteria for allocation of land use changePublished data [4,40]
Aoc; AtransDerived from crop yields
CFoc; CFtransCalculated
OI; TICalculated

2.3.2. Land Transformation

As mentioned in Section 2.3, this work includes an analysis of the effect of possible changes in land use by the expansion of the agricultural frontier into the Yungas forests and Chaco forests. Once again, the types of soil cover considered were taken from Land Cover Classification System LCCS–FAO/UNEP [54]. The ecoregions considered were Chaco forest and Yungas forest, belonging to Tropical grassland and Dry tropical forest biomes, respectively [53]. The land use typologies assumed were: forest, used and arable, and non-irrigated [4]. A surface equivalent to 1 hectare completely sown with early soybean in no-tillage and conventional tillage is considered. In Table 1, the results of inventory of land transformation are presented.
For the definition of the spatial model of land transformation impacts on BPP, the tropical dry climatic region was considered according to the classification recommended by the IPCC [41]. A regeneration time of 20 years corresponding to agricultural land use [40,41] and a long-term cultivated soil in no-tillage and conventional tillage were considered. For the calculation of land transformation impacts on CRP, the values of regeneration time for each biome suggested by [42] (62 years for tropical forest and 97 years for tropical grassland) were considered. It was assumed that the transformation impact is similar during the first 20 years of land occupation [40]. Therefore, the allocation for each of the 20 years is carried out in an equal manner. The inventory data of SOC are presented in Table 2 and parameter data derivations are summarized in Table 3.

3. Results

3.1. Biotic Production Potential

3.1.1. Occupation Impact Assessment in Pampean Region

The results obtained after the application of the model described in the different systems are summarized in Table 4. It can be observed that soybean production in Pampean Region of Argentina causes a deficit of organic matter in the soil related to the land occupation process that affects biotic production, independently of the considered agricultural practices, although with important differences among them. In effect, till-early productive system duplicates the occupation impact value per kg of grain produced compared to the no-till early system. This increment is due to the increase in the characterization factor value associated with soil and crop handling (67% approximately) and the variations in the grain yield ratio between both systems.
Table 4. Characterization factors of occupation and land occupation impact assessment on Biotic Production Potential, according to the different production systems developed in Pampean Region, Argentina.
BiomeSystemCFoc (kg C Year m−2 Year−1)Toc (Year)Aoc (m2 kg−1 Soybean)IO (kg C kg−1 Soybean)
Temperate grasslandsNo-till early0.4613.571.63
No-till late0.4614.552.07
No-till irrigation0.4612.631.20
Till-early0.7614.203.19
No-till rotation0.460.474.130.89
Tropical grasslandsNo-till early0.4613.571.63
With respect to productive systems that use no-tillage, the most favorable result is no-till irrigated, while the one with the greatest impact is no-till late. Considering that the same characterization factors are used for all no-tillage systems, variations in occupation impact results are associated only with the differences in grain productivity.
The results analyzed in the previous paragraphs represent the land occupation impact potential assuming that during the whole year only one complete soybean cycle is developed. The impact results obtained by incorporating the alternative system that includes a double crop sequence or “wheat/late soybean” (no-till rotation) indicate that the occupation impact over biotic production diminishes 56.9% (from 2.07 kg C kg−1 soybean to 0.89 kg C kg−1 soybean) with respect to no-till late system. The 92% of the impact reduction is due to the short timeframe of land occupation, while the remaining 8% is explained by increased soybean yield achieved in the double cropping sequence.
Furthermore, the results do not show a difference in the land occupation impact on BPP when soybean is developed in the ecoregions belonging to temperate grassland and tropical grassland, because the same value of SOCpot was used to calculate the corresponding CF of each biome.

3.1.2. Occupation and Transformation Impacts Assessment in Northwest Region

The results of CFoc, CFtrans and potential impacts of land occupation and land transformation on BPP caused by the expansion of soybean towards the Northwest Region are summarized in Table 5. Just as Pampean Region, these values do not show variations in the land transformation impacts on BPP between the different ecoregions studied (Chaco forest and Yungas forest). Differences occur only between production systems. The characterization factor found for conventional tillage is 30.7% higher than the one corresponding to no-tillage, as a consequence of the decrease in organic C stock in the soil. The increment of characterization factor for till early system added to the differences in grain yield, cause an increase on the transformation impact of 50% respect to no-till early system. The Figure 4 shows the total land use impact on BPP, attributed to each of the first 20 years of cropping following transformation. The occupation process contributes in a 50% to the total impact on BPP, in spite of the fact that the land occupation characterization factors are significantly lower than the transformation ones. These results are attributed to the allocation procedure of the transformation process during the 20 years of land occupation.
Table 5. Characterization factors of occupation and transformation, land occupation impact and land transformation impact assessment on Biotic Production Potential, according to the different production systems studied for Northwest Region, Argentina.
BiomeSystemTregen (Year)CFoc (kg C Year m−2 Year−1)CFtrans (kg C Year m−2)Toc (Year)Aoc or trans (m2 kg−1 Soybean)IO * (kg C kg−1 Soybean)IT * (kg C kg−1 Soybean)
Dry tropical forestNo-till early201.2224.413.574.3687.2
Till-early201.6031.914.206.72134.1
Tropical grasslandNo-till early201.2224.413.574.3687.2
Till early201.6031.914.206.72134.1
* The occupation impact values are expressed per year of land occupied, while the values of the transformation impact correspond to the 20 years of land occupation.
Figure 4. Contribution of occupation and transformation processes of the total land use impact on BPP associated with the expansion of soybean crop into forest ecosystems, attributed to any of the first 20 years of cropping.
Sustainability 07 04386 g004

3.2. Climate Regulation Potential (CRP)

3.2.1. Occupation Impact Assessment in the Pampean Region

Table 6 shows the carbon flows between soil and atmosphere for different agricultural systems considered. As to agricultural systems developed in the region of temperate grasslands, the till early system occasions an occupation impact potential 18% higher than the impact associated with the no-till early system. However, of all the systems analyzed, the one causing greater impact in this region is the no-till late, while the process that incorporates supplementary irrigation has the least impact. It is noted that for the four systems analyzed the same characterization factors are obtained, so that the differences in evaluation results are attributed to the Aoc values per functional unit, resulting from variations in crop yields achieved by each agricultural system.
Table 6. Characterization factors of occupation and land occupation impact assessment on Climate Regulation Potential, according to the different production systems developed in the Pampean Region, Argentina.
Land UseBiomeSystemCta,oc (t C ha−1)Tlu (Year)Tfc for 100 Year (Year)dfCFoc (t Ce ha−1)Aoc (m2 kg−1 Soybean)IO (kg Ce kg−1 Soybean)
CroplandTemperate grasslandsNo-till early66147.50.0211.393.570.496
No-till late66147.50.0211.394.550.632
No-till irrigation66147.50.0211.392.630.366
Till early66147.50.0211.394.200.584
No-till rotation660.4747.50.0100.654.130.126
Tropical grasslandsNo-till early58147.50.0211.223.570.435
When the no-till early system is developed in the tropical grasslands region instead of the temperate grasslands, the impact is reduced by approximately 12%. This reduction is due to lower transfer rates of carbon between the soil and the air that occur in this region (Table 6).
In the same way as for BPP, the inclusion of a preceding crop (in this case, wheat) in the productive system of late soybean (no-till rotation) reduces the occupation impact on CRP. In this case, reduction reaches values of at least 65.5%. This consideration implies that the “wheat/late soybean” rotation system cause the least impact of all productive systems studied, in spite of reaching a low crop yield.

3.2.2. Occupation and Transformation Impacts Assessment in Northwest Region

The results of characterization factors and impacts of occupation and transformation on CRP occasioned by the possible advance of soybean crop toward the Chaco forests and Yungas forests are presented in Table 7 and Table 8. For both agricultural systems, the CFoc and IO values are at least 15% greater when the occupation Yungas forest occurs due to the higher transfer rate of C to the atmosphere associated with this process, compared to Chaco forest. On the contrary, the CFtransf and IT are greater when the soybean crop advances toward the Chaco forests than when it extends toward the Yungas forests. This variation is attributed to a longer stay in the air of C in the Chaco forests (48.5 years) than in the Yungas forests (31 years), in spite of the higher carbon transfer rate per hectare that occurs in this latter region.
Table 7. Characterization factors of occupation and transformation for Climate Regulation Potential, according to the different biomes and production systems studied for the Northwest Region, Argentina.
BiomeSystemCta,oc or trans (t C ha−1)Tlu for Occup. (Year)Tlu for Transf. (Year)Tregen (Year)Tfc for 100 Year (Year)df for Occup.df for Transf.CFoc (t Ce ha−1)CFtrans (t Ce ha−1)
Dry tropical forestNo-till early66.51316247.50.0210.651.4043.4
Till-early66.51316247.50.0210.651.4043.4
Tropical grasslandNo-till early58.0148.59747.50.0211.011.2258.6
Till early58.0148.59747.50.0211.011.2258.6
Table 8. Land occupation impact and land transformation impact assessment on Climate Regulation Potential, according to the different biomes and production systems studied for the Northwest Region in Argentina.
BiomeSystemToc (Year)Aoc or trans (m2 kg−1 Soybean)IO * (kg Ce kg−1 Soybean)IT * (kg Ce kg−1 Soybean)
Dry tropical forestNo-till early13.570.5015.5
Till-early14.200.5918.2
Tropical grasslandNo-till early13.570.4320.9
Till early14.200.5124.6
* The occupation impact values are expressed per year of land occupied, while the values of the transformation impact correspond to the 20 years of land occupation.
It is notable that although the method proposed by Müller-Wenk and Brandão [42] does not show differences in the values of CF between no-till early and till-early systems, the land transformation impact on CRP increments 18% when conventional tillage practices are adopted, related to no-tillage. This variation is attributed to the different crop yield among productive systems.
The Figure 5 shows the total land use impact on CRP, attributed to each of the first 20 years of cropping following transformation. Contrary to what occurs for the BPP, the transformation process contributes in a greater measure than the occupation process to the total impact of land use over the CRP (60.8% for Yungas forests and 70.6% for Chaco forests), independently of the agricultural handling implemented (Figure 5). This is related to the higher values reached by the duration factor (df) for the transformation process, thus significantly influencing results in the characterization factors.
Figure 5. Contribution of occupation and transformation processes of the total land use impact on CRP associated with the expansion of soybean crop into Yungas and Chaco forests, attributed to any of the first 20 years of cropping.
Sustainability 07 04386 g005

4. Discussion

From the analyses of methodologies adopted for estimating the CF of occupation and transformation impacts on BPP and CRP, it comes to light that there is a significant shortcoming in terms of availability of representative factors of biomes and ecoregions of Argentina, as well as regional agricultural practices. In the case of the methodology by Müller-Wenk and Brandão [42], the Cta and df coefficients differentiate the impacts of land use between biomes, but do not distinguish between different tillage methods. These authors suppose that the changes in the soil C stock related to the different handling practices are insignificant when compared to the changes associated with the bio-geographical region characteristics and the type of land use. Therefore, the inclusion of soil management practices does not substantially change the impacts’ evaluation results. However, the results obtained when adopting the Brandão and Milà i Canals methodology [
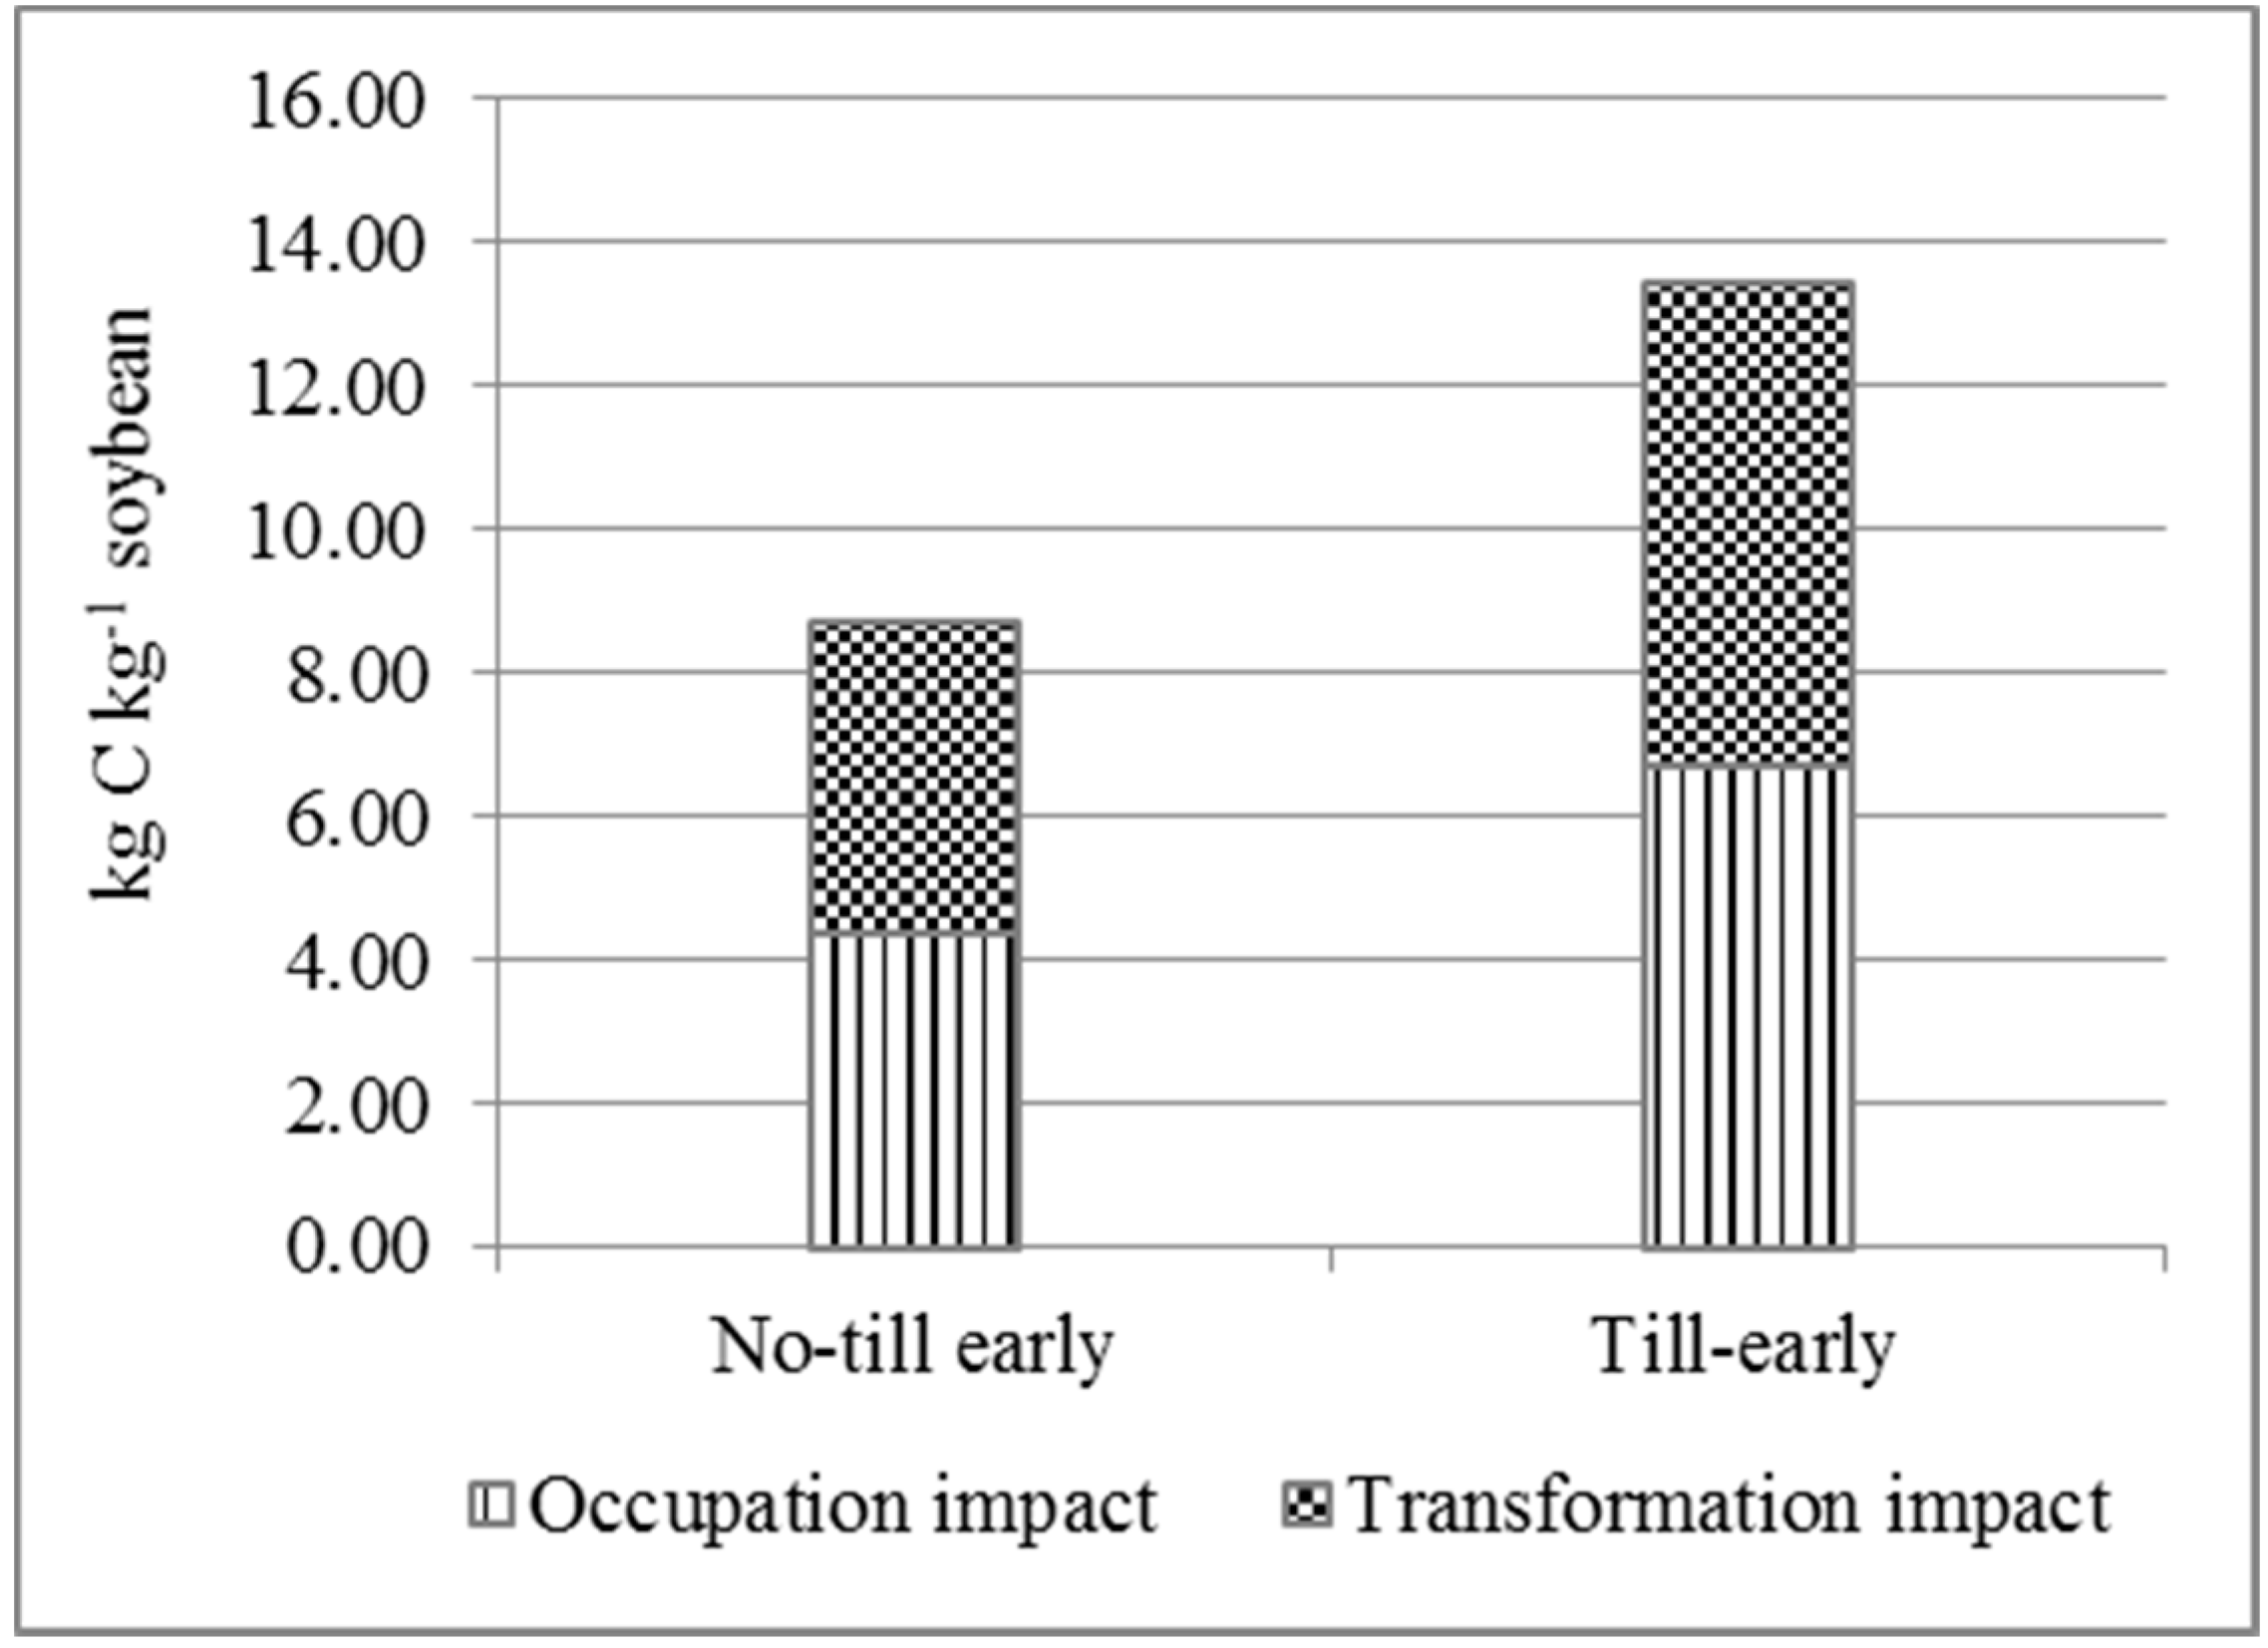
40], whose characterization factors incorporate the different types of tillage, show that there is a significant variation (between 31% and 67%) in the occupation and transformation impacts over the BPP, whether a no-tillage or a conventional tillage is adopted. This difference is explained by the soil capacity to store carbon according to the type of tillage. This allows to suppose that, just as for the BPP, to incorporate modifications in the SOC occasioned by distinct agricultural handling practices might modify impact evaluation results over the CRP, with worse results for conventional tillage systems than for no-tillage.
As mentioned in the previous paragraph, the method proposed for Brandão and Milà i Canals [40] presents factors that distinguish between no-tillage and conventional tillage. However, there are no factors for comparing systems in rainfed and irrigated conditions. Changes in land use impacts on ecosystem services evaluated between these systems are associated only with different crop yields. Nevertheless, this increment in yield promotes an increase in the amount of crop residues brought to the soil, which might result in a greater SOC stock [57,58,59]. On the other hand, the greater moisture availability in the soil associated with irrigation implementation accelerates the microbial activity and the organic matter mineralization, and, as a consequence, increases the CO2 flows toward the atmosphere. These additional flows of organic carbon entering the soil and the emissions of CO2 entering the atmosphere might be neutralized or result in positive balances [60,61] or in negative balances [62,63] of SOC. However, they are not considered in the calculus procedures of characterization factors both for the BPP as for the CRP. Regarding the no-till late productive system, a similar analysis can be performed, considering that low crop yield compared to no-till early system implies a detriment in crop residues applied to the soil and, therefore, lower organic carbon stock. This consideration in the calculation of the characterization factors might enlarge the difference in the impact results between no-till early and no-till late systems. Referring to cropping sequences, the presence of a preceding crop increases SOC input from the soil [64,65]; however, this aspect is also not considered in the calculation of the FC. Furthermore, it is noted that factors in land use and soil management and crop recommended by Brandão and Mila i Canals [40] to calculate the characterization factors for the BPP correspond to the values published in the IPCC Guidelines [41].
It is worth pointing out that the land use and soil and crop handling coefficients used in the calculation of characterization factors for the BPP are taken from the Guidelines for National Greenhouse Gas Inventories [41] following Brandão and Milà i Canals [40] recommendations. These factors lead to significant failures for certain classes of use and handling; for example, for long-term cultivation in the tropical dry climatic region, the error reaches values of (±) 61% [41], which would give imprecise results.
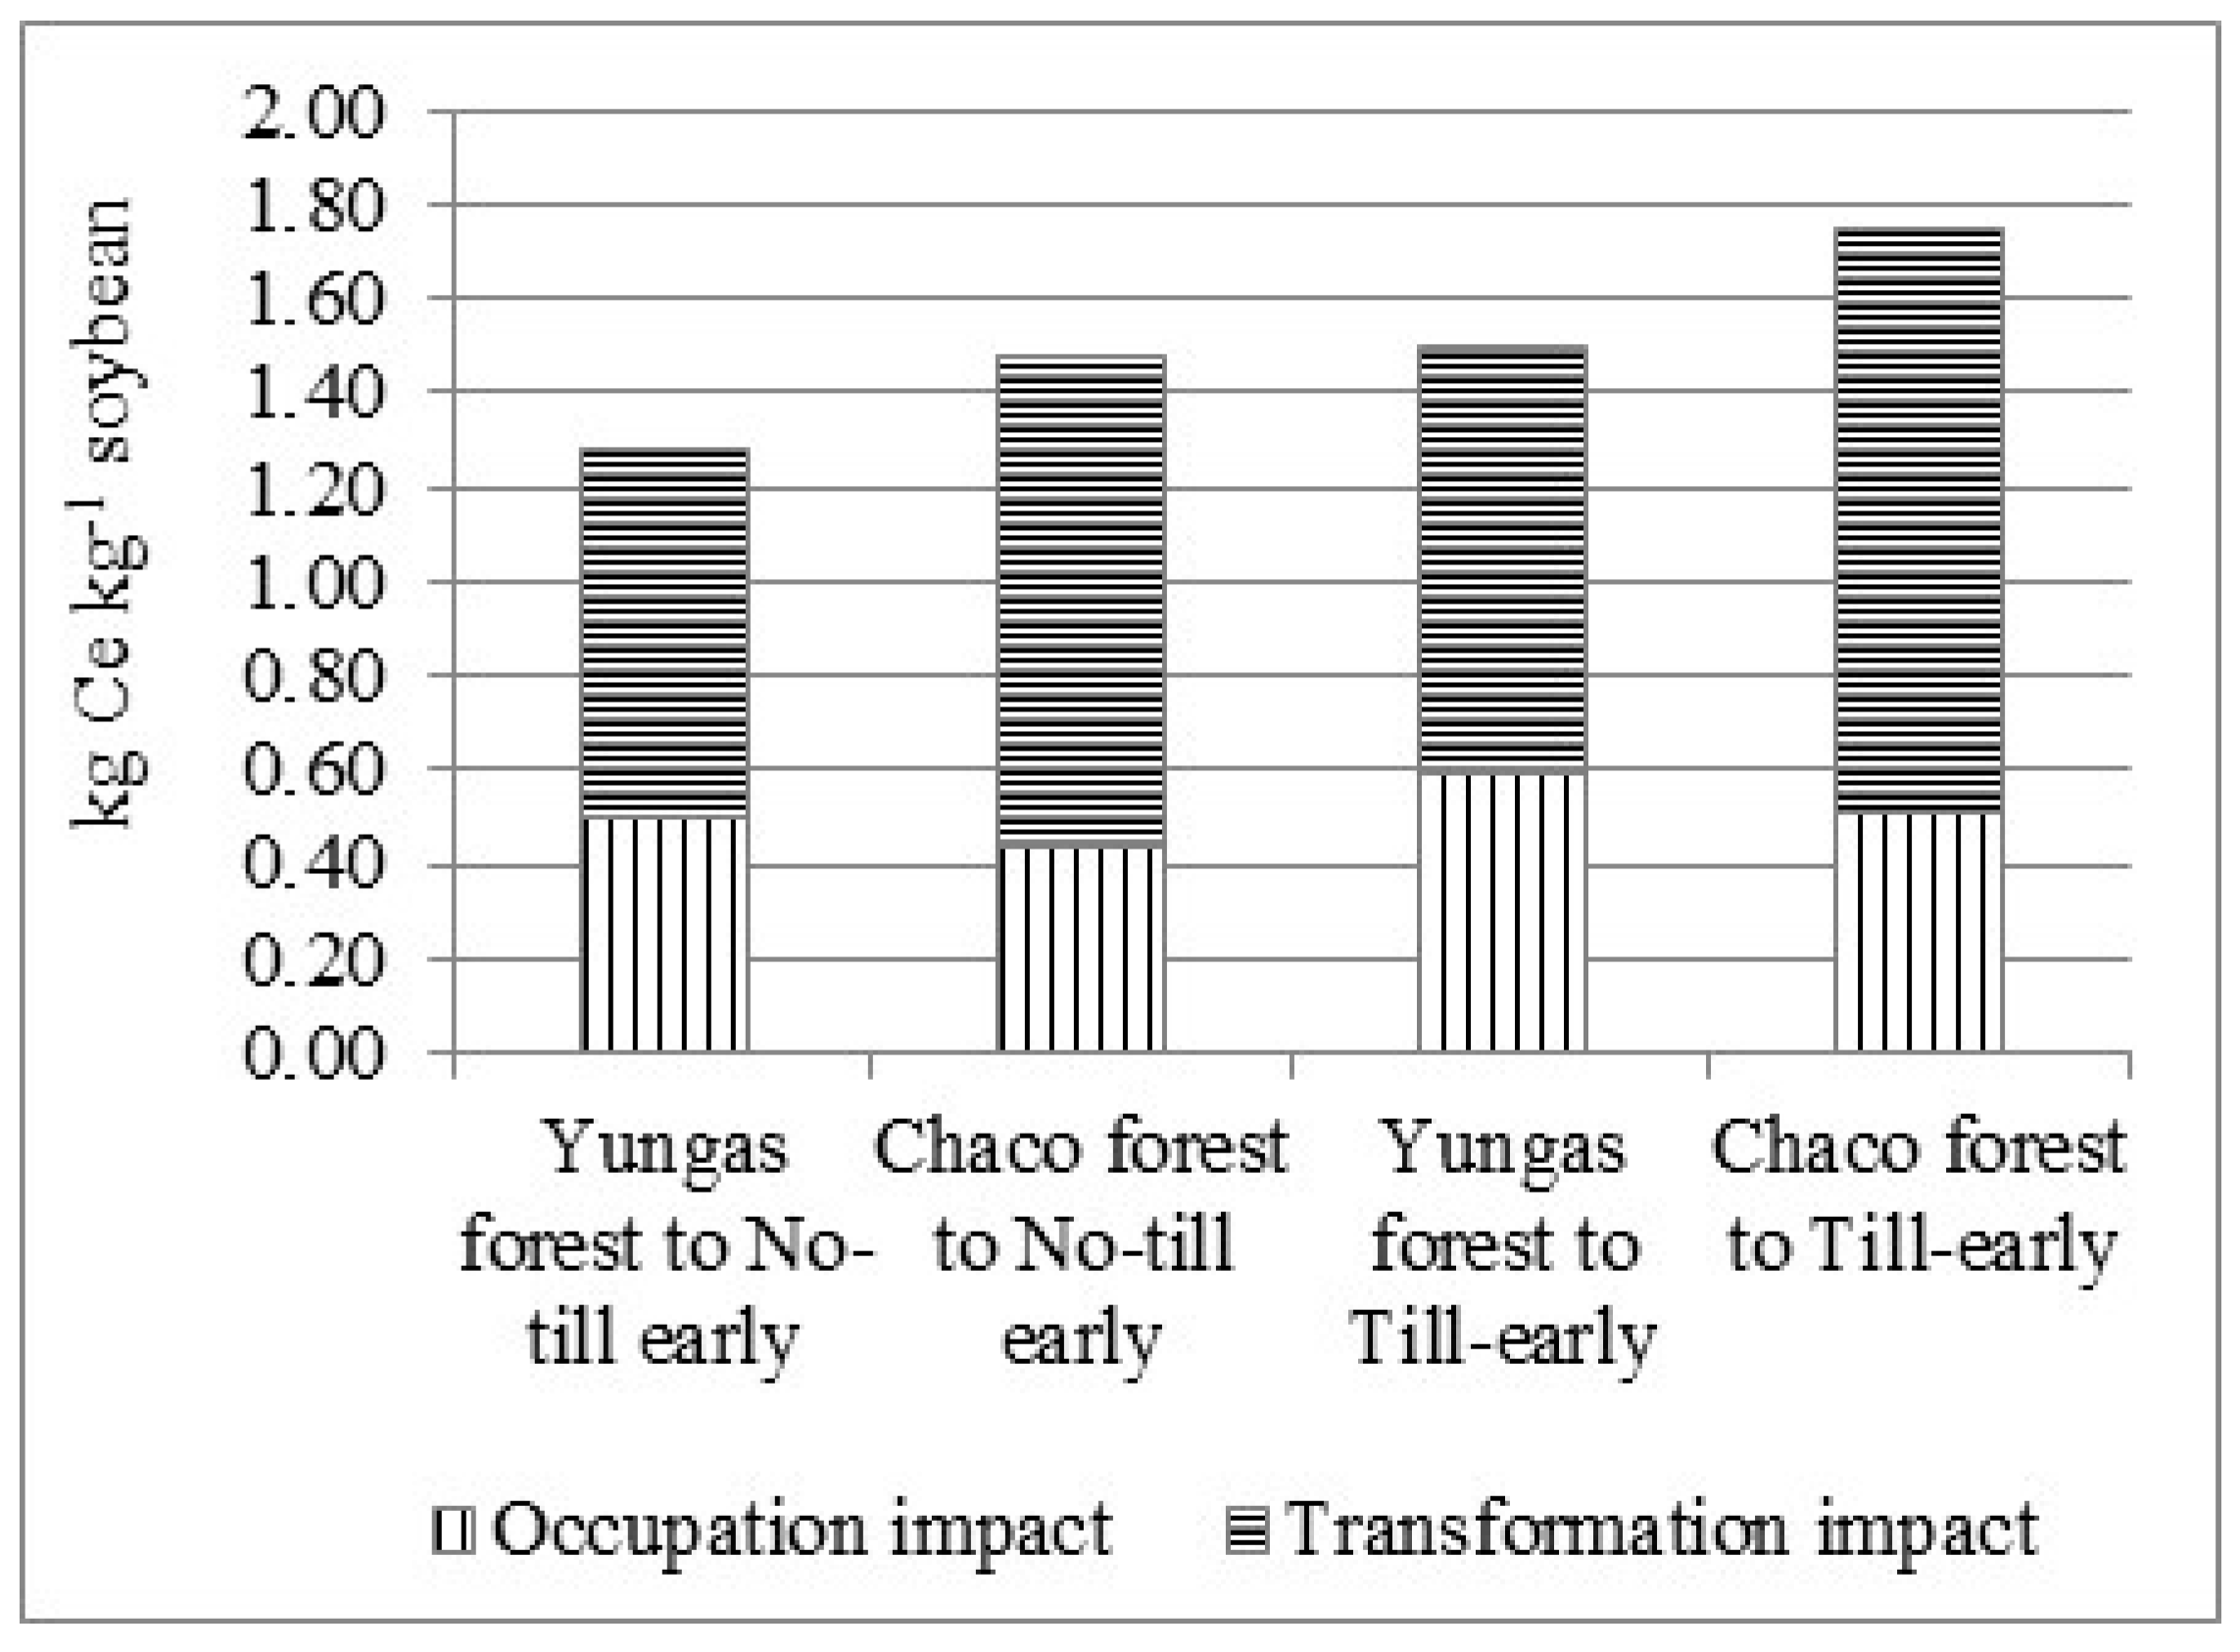
With respect to the transformation process, on evaluating the BPP, no distinction is observed in the magnitude of the impact when the soybean crop advances toward the Yungas forests or toward the Chaco forests. This is explained because the available values of SOCpot correspond to level 2 of differentiation proposed by Koellner et al. [4]. For the CRP, the CFtransf and consequently the magnitude of the impact on both ecoregions is strongly influenced by the C transfer rate per area unit associated with each of these levels. For the study case, the tropical grassland biome corresponds to the Chaco forest, which is assigned an average transfer rate of C of 58 t ha−1, while for the Yungas forest the corresponding biome is the tropical forest. The adopted methodology allows disaggregating this type of biome in wet tropical forest and dry tropical forest sublevels, with very different C transfer rates: 231 t C ha−1 for wet forests and 66.5 t C ha−1 for dry forests. If instead of using the specific C transfer value for dry forests (as carried out in Section 3.2.2) the mean value was used for both conditions of humidity—the same as for tropical grasslands—the results would change completely, reaching 2.85 kg Ce kg soybean−1 year−1 for no-till early and 3.36 kg Ce kg soybean−1 year−1 for till early system. That is, the most affected ecoregion through the expansion of soybean from the CRP point of view would clearly be the Yungas forests instead of the Chaco forests. Therefore, specific values have transfer rates of C for each biome and ecoregion would achieve greater objectivity in the results. By contrast, adopting global factors could lead to bad decisions as to the effects of production systems on ecosystem services of different ecoregions.
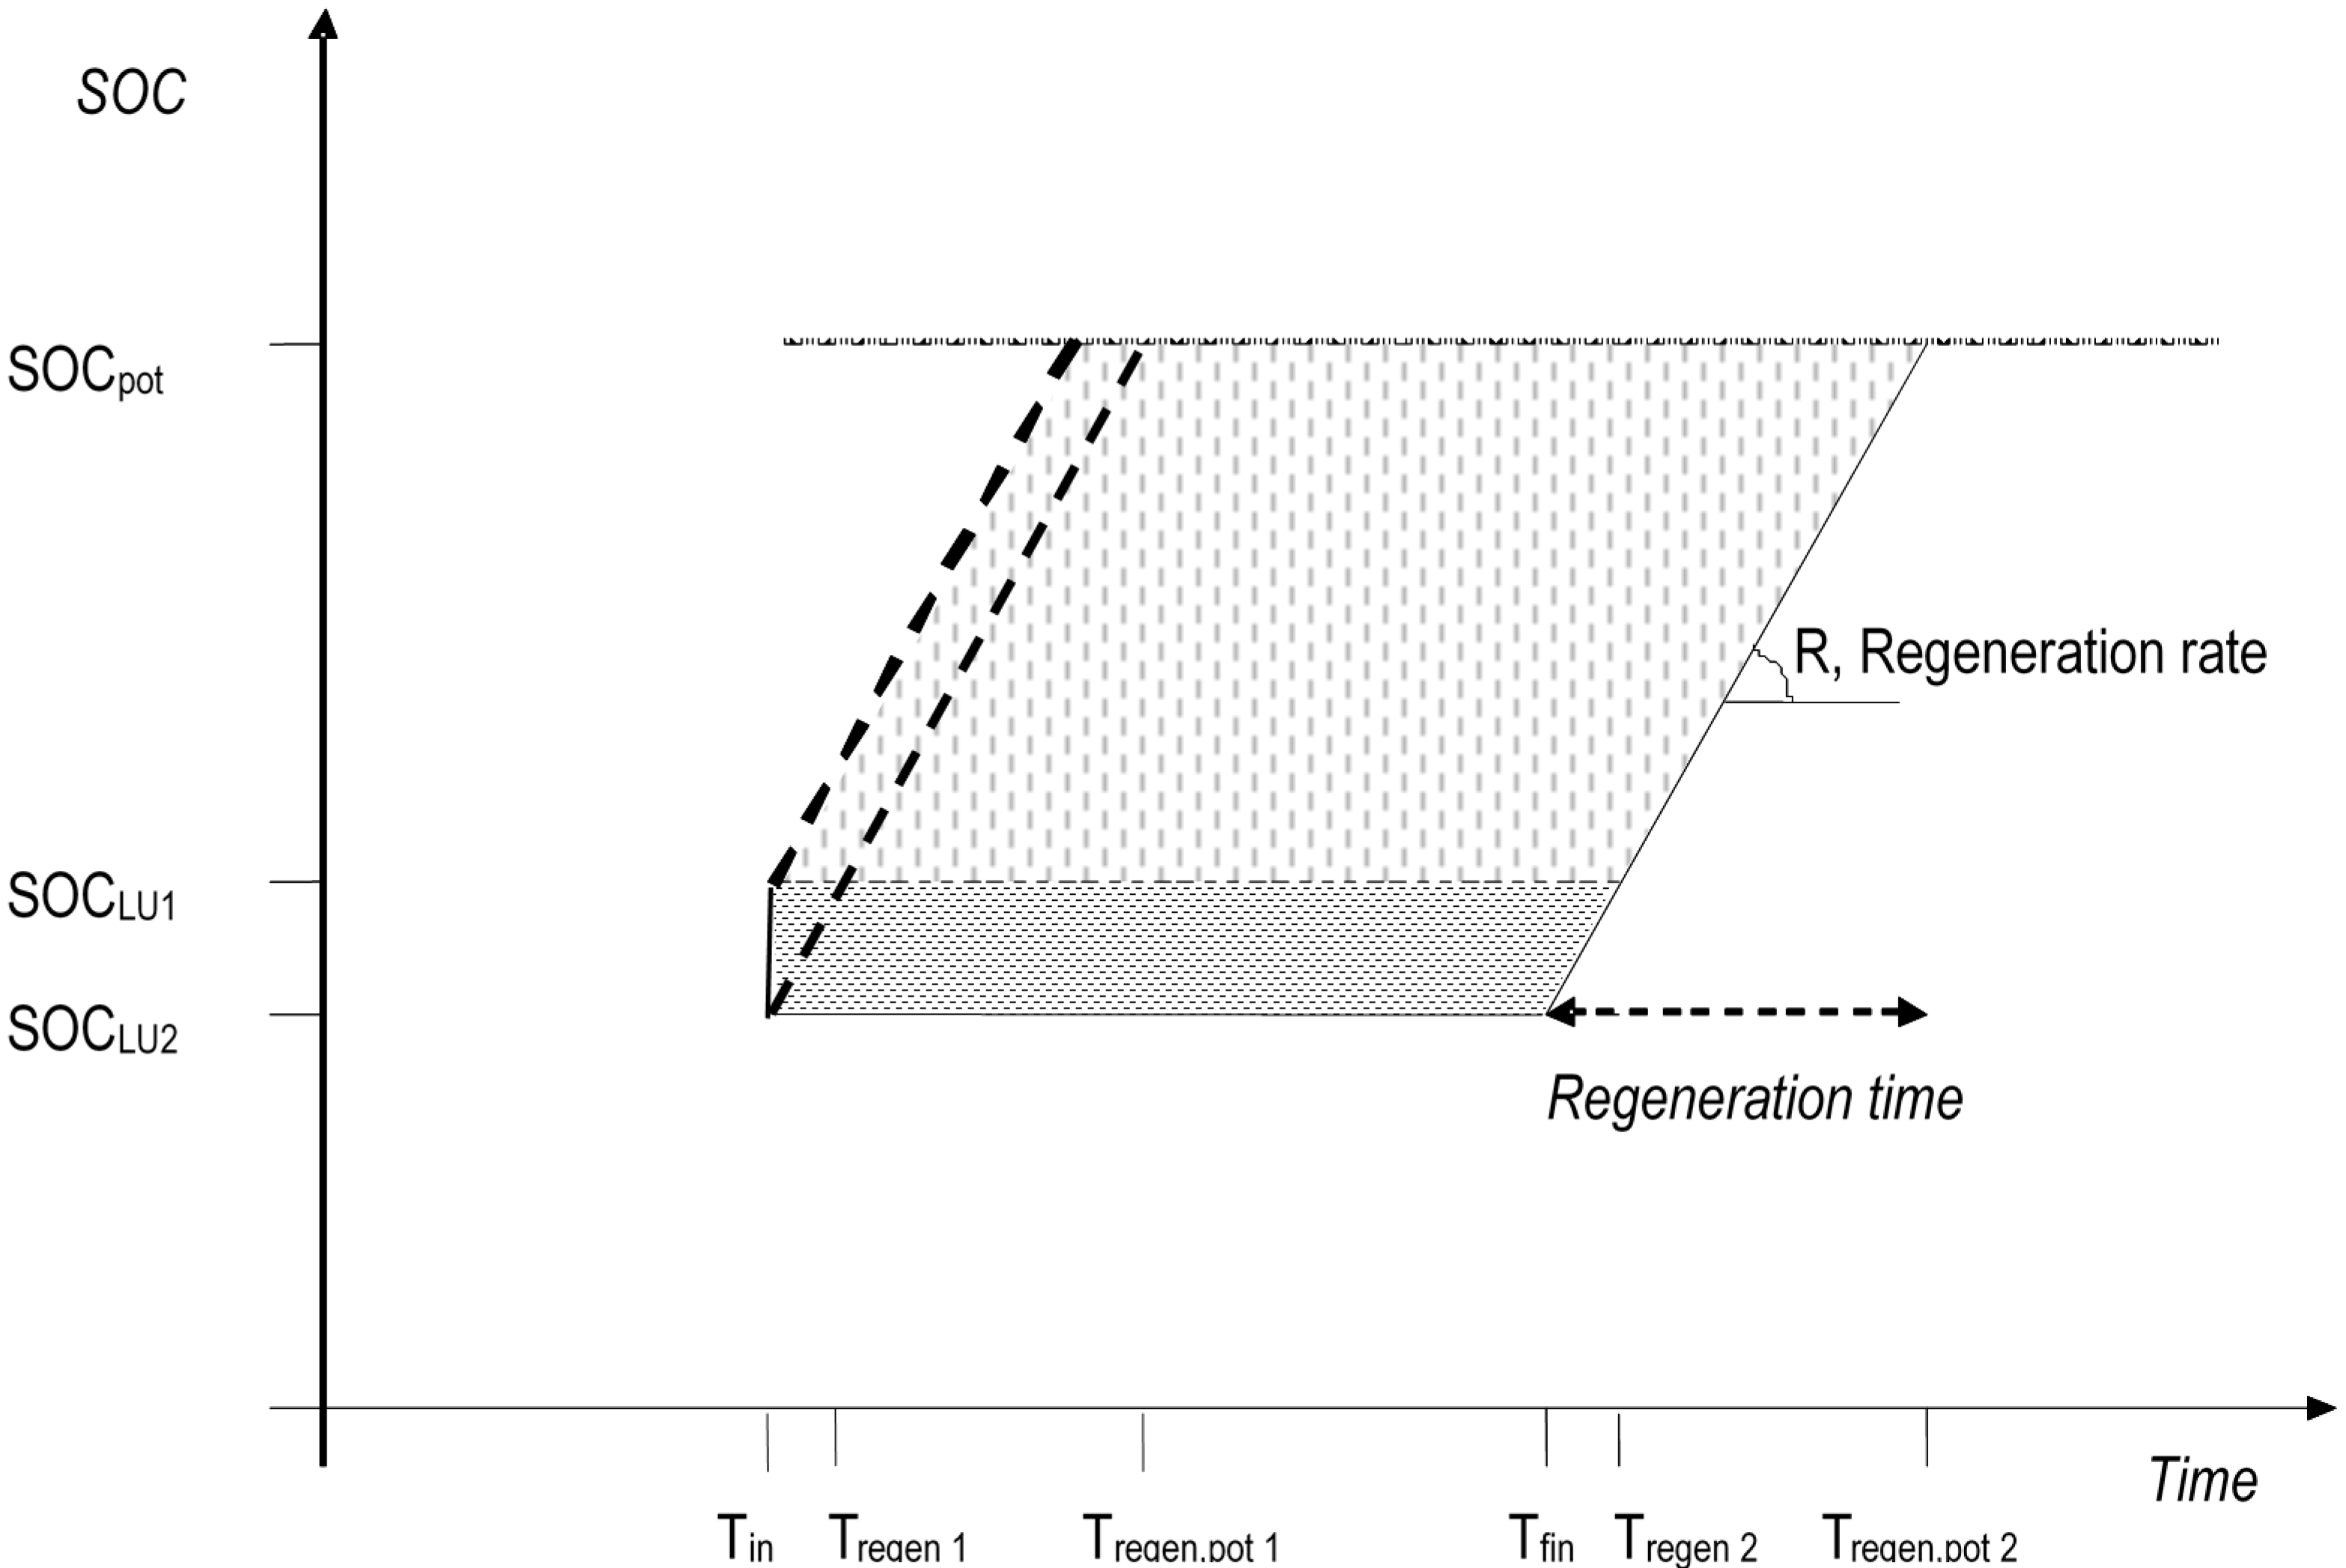
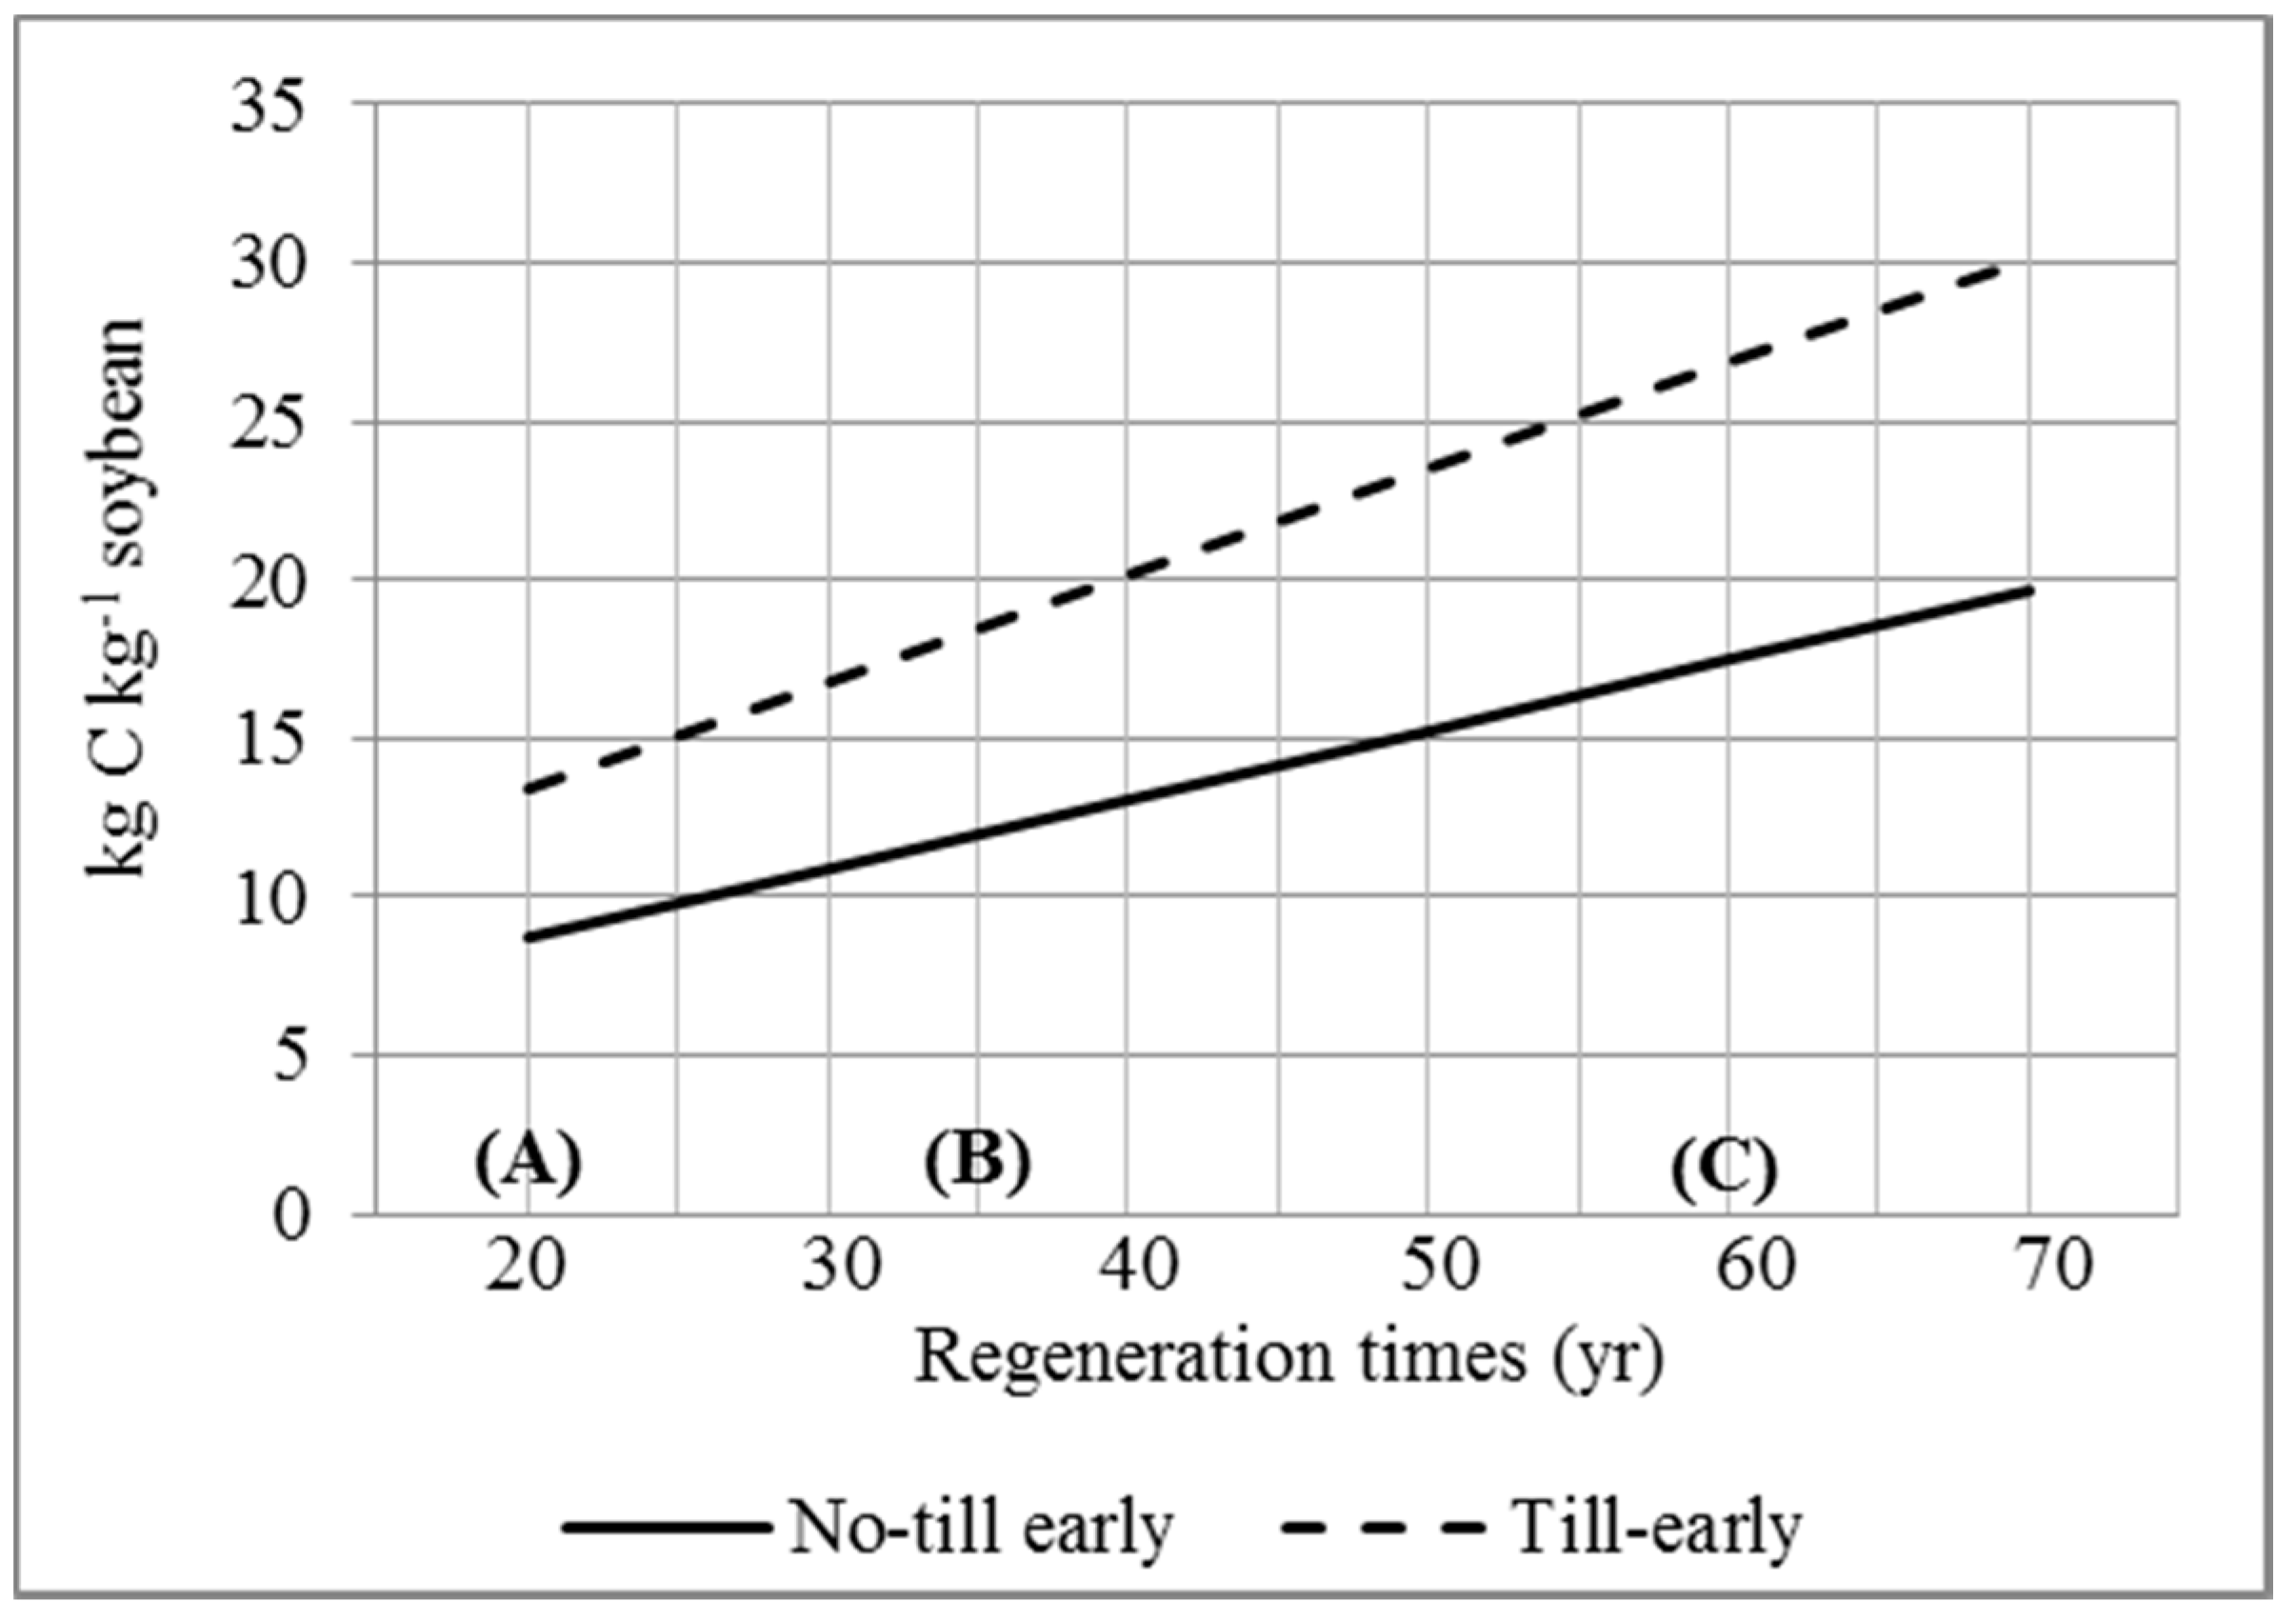
Another variable that significantly affects the results is the regeneration time. Brandão and Milà i Canals [40] recommend adopting a total of 20 years for transformation toward crop lands, independently of the biome that may represent the reference situation. Meanwhile, Müller-Wenk and Brandão [42] suggest more extensive and specific regeneration time and for each type of biome; for example, 62 years for tropical forests and 97 years for tropical grasslands. Specifically for Yungas forest, Grau et al. [56] determined that certain structural characteristics of mature forests, such as species diversity, richness of tree species, stem density and canopy height, are reached after 30–40 years of ecological succession over abandoned farmlands. Figure 6 shows the influence of the regeneration time in the results of transformation impacts for no-tillage system, up to the point in which the impact estimated with the regeneration time recommended by Müller-Wenk and Brandão [42] is similar to the impact associated with a conventional tillage system evaluated with the regeneration time suggested by Grau et al. [56].
Figure 6. Impacts of land transformation of soybean crop in the Yungas forests on Biotic Production Potential, considering the no-till early and till early farming systems, for regeneration times suggested by different authors: (A): [40]; (B): [56]; and (C): [42].
Sustainability 07 04386 g006

5. Conclusions

Land use occupation and transformation impacts were evaluated over the Biotic Production Potential and Climate Regulation Potential, in the life cycle soybean production in Argentina. The methodology recently developed by the UNEP-SETAC [5] was adopted and the differential characteristics of tillage and crop handling practices of major diffusion in the country were evaluated.
The results show that for all the systems studied, there exists an impact potential that negatively affects the ecosystem services of the region where the activity is developed, although with important differences among those related to soil carbon stock and grain yield reached. In effect, the impact magnitude is considerably reduced when implementing no-tillage instead of conventional tillage. This reduction is even greater when the system adopts supplementary irrigation.
As a consequence, it is recommended to continue expanding the soybean surface in no-tillage, thus replacing conventional tillage in the Argentinean Pampean Region, as a strategy to attenuate land use impacts. This would allow an impact reduction across the ecosystem services of up to 40% per hectare of soybean occupied land. It is necessary that the no-tillage expansion be complemented with an adequate crop sequences plan, since this system generates increments in environmental benefits of at least 50%. As to the irrigated system, it is recommended to carry out, prior to making decisions regarding its expansion, a total analysis that will take into account environmental benefits related to land use as well as water use impact potentials, energy balance and greenhouse gas emissions.
Although benefits in the balance of soil organic matter associated with conservationist practices are widely recognized in the technical and scientific world, they had never been previously considered for evaluating land use specific impact categories in LCA studies developed in Argentina. This work incorporates those aspects in the evaluation of land occupation and transformation impacts on Biotic Production Potential and Climate Regulation Potential of one of the country’s most relevant and controversial commodities, and confirms the benefits associated with no-tillage and cropping sequences.
As to the method adopted, the conclusion is that it is unable to show the expected differences between the distinct practices, given the weaknesses in data availability and in specific characterization factors. In some cases, the published factors present a high margin of error; in other cases, there are no particular values to determine soil and crop handling practices. Although the method applied to evaluate impacts over the Biotic Production Potential exhibits no-tillage advantages compared to conventional tillage, it does not count concrete characterization factors in differentiating rainfed or irrigation systems, delay or advances in tillage dates and cropping sequences. Furthermore, calculation procedures for the characterization factors used in evaluation impacts over Climate Regulation Potential does not allow any distinction among the different agricultural practices studied.
Therefore, it is absolutely necessary to develop characterization factors to include different management practices in methodologies for assessing impacts of land use. In order to do this it is suggested to consider SOC contributions in calculation procedures associated with a greater availability of crop residue, resulting in the adoption of no-tillage, cropping sequences and practices tending to increment harvest yield. In the same way, it is suggested to include in the determination of characterization factors the variations of the C mineralization ratio linked to irrigation water availability.
Another aspect worthy of considering in depth is how to determine the occupation and regeneration time for each type of land use and each ecoregion, in order to define common criteria in selecting and applying these study parameters for land occupation and transformation.

Acknowledgments

This research was funded by CONICET-Consejo Nacional de Investigaciones Científicas y Tecnológicas and UTN-Universidad Tecnológica Nacional.

Author Contributions

Bárbara Civit and Alejandro Pablo Arena designed the research. Roxana Piastrellini performed the research and analyzed and interpreted the results. All authors contributed to the writing the paper and have approved the final manuscript.

Conflicts of Interest

The authors declare no conflict of interest.

References

  1. ISO. Life Cycle Assessment: Principles and Framework-Environmental Management; ISO 14040:2006; European Committee for Standarization: Brussels, Belgium, 2006. [Google Scholar]
  2. ISO. Life Cycle Assessment-Requirements and Guidelines-Environmental Management; ISO 14044:2006; European Committee for Standarization: Brussels, Belgium, 2006. [Google Scholar]
  3. Weidema, B.P.; Lindeijer, E. Physical impacts of land use in product life cycle assessment. In Final Report of the EUROENVIRON-LCAGAPS Sub-Project on Land Use; Technical University of Denmark: Lyngby, Denmark, 2001. [Google Scholar]
  4. Koellner, T.; de Baan, L.; Beck, T.; Brandão, M.; Civit, B.; Goedkoop, M.; Margni, M.; Milà i Canals, L.; Müller-Wenk, R.; Weidema, B.; et al. Principles for life cycle inventories of land use on a global scale. Int. J. LCA 2013, 18, 1203–1215. [Google Scholar] [CrossRef]
  5. Koellner, T.; de Baan, L.; Beck, T.; Brandão, M.; Civit, B.; Margni, M.; Milà i Canals, L.; Saad, R.; de Souza, D.; Müller-Wenk, R. UNEP-SETAC guideline on global land use impact assessment on biodiversity and ecosystem services in LCA. Int. J. LCA 2013, 18, 1188–1202. [Google Scholar] [CrossRef] [Green Version]
  6. Müller-Wenk, R. Land use-The main threat to species. In How to Include Land Use in LCA, IWÖ-Diskussionbeitrag n.64, IWÖ; Universität St.: Gallen, Switzerland, 1998. [Google Scholar]
  7. Cowell, S.J.; Clift, R. A methodology for assessing soil quantity and quality in life cycle assessment. J. Clean. Prod. 2000, 8, 321–331. [Google Scholar] [CrossRef]
  8. Lindeijer, E. Review of land use methodologies. J. Clean. Prod. 2000, 8, 273–281. [Google Scholar] [CrossRef]
  9. Goedkoop, M.; Spriensma, R. The Eco-indicator 99: A Damage Oriented Method for Life Cycle Impact Assessment, Methodology Report, 3rd ed.; PRé Consultants: Amersfoot, The Netherlands, 2001. [Google Scholar]
  10. Vogtländer, J.G.; Lindeijer, E.; Witte, J.P.M.; Hendriks, C. Characterizing the change of land-use based on flora: Application for EIA and LCA. J. Clean. Prod. 2004, 12, 47–57. [Google Scholar] [CrossRef]
  11. Milà i Canals, L.; Romanyà, J.; Cowell, S.J. Method for assessing impacts on life support functions (LSF) related to the use of “fertile land” in Life Cycle Assessment (LCA). J. Clean. Prod. 2007, 15, 1426–1440. [Google Scholar] [CrossRef]
  12. Köellner, T.; Scholz, R.W. Assessment of land use impacts on the natural environment. Part 1: An analytical framework for pure land occupation and land use change. Int. J. LCA 2007, 12, 16–23. [Google Scholar] [CrossRef]
  13. Köellner, T.; Scholz, R.W. Assessment of land use impacts on the natural environment. Part 2: Generic characterization factors for local species diversity in central Europe. Int. J. LCA 2008, 13, 32–48. [Google Scholar]
  14. Kloverpris, J.; Wenzel, H.; Nielsen, P.H. Life cycle inventory modeling of land use induced by crop consumption. Part 1: Conceptual analysis and methodological proposal. Int. J. LCA 2008, 13, 13–21. [Google Scholar]
  15. Michelsen, O. Assessment of land use impact on biodiversity. Int. J. LCA 2008, 13, 22–31. [Google Scholar]
  16. Searchinger, T.; Heimlich, R.; Houghton, R.A.; Dong, F.; Elobeid, A.; Fabiosa, J.; Yu, T.H. Use of US croplands for biofuels increases greenhouse gases through emissions from land-use change. Science 2008, 319, 1238–1240. [Google Scholar] [CrossRef] [PubMed]
  17. Carballo, S.; Hilbert, J.A. Análisis de Metodologías Empleadas Para el Cálculo de Emisiones GEI Derivados del Cambio de uso del Suelo; INTA, N° Doc. BC-INF-13-10; Instituto Nacional de Tecnología Agropecuaria: Buenos Aires, Argentina, 2010. (In Spanish) [Google Scholar]
  18. Brandão, M.; Milà i Canals, L.; Clift, R. Soil organic carbon changes in the cultivation of energy crops: Implications for GHG balances and soil quality for use in LCA. Biomass Bioenerg. 2011, 35, 2323–2336. [Google Scholar] [CrossRef]
  19. Mattsson, B.; Cederberg, C.; Blix, L. Agricultural land use in life cycle assessment (LCA): Case studies of three vegetable oil crops. J. Clean. Prod. 2000, 8, 283–292. [Google Scholar] [CrossRef]
  20. Milà i Canals, L.M.; Rigarlsford, G.; Sim, S. Land use impact assessment of margarine. Int. J. LCA 2013, 18, 1265–1277. [Google Scholar] [CrossRef]
  21. Antón, A.; Núñez, M.; Camps, F.; Bonmatí, A.; Brandão, M. Assessing the land use impacts of agricultural practices on ecosystems. In Proceedings of the 9th International Conference LCA of Food, San Francisco, CA, USA, 8–10 October 2014.
  22. FAO-Food and Agricultural Organization. Available online: http://www.fao.org/nr/water/aquastat/data/query/index.html (accessed on 30 May 2014).
  23. Núñez, M.; Civit, B.; Muñoz, P.; Arena, A.P.; Rieradevall, J.; Antón, A. Assessing Desertification Risk Impact in LCA Part I: Methodological Aspects. Int. J. LCA 2010, 15, 67–78. [Google Scholar] [CrossRef]
  24. Milà i Canals, L.; Bauer, C.; Depestele, J.; Dubreuil, A.; Freiermuth, K.R.; Gaillard, G.; Michelsen, O.; Müller-Wenk, R.; Rydgren, B. Key elements in a framework for land use impact assessment in LCA. Int. J. LCA 2007, 12, 5–15. [Google Scholar] [CrossRef]
  25. Galantini, J.A.; Iglesias, J.O. Capacidad de secuestro de carbono y efecto de las prácticas agronómicas en suelos de la Región Pampeana de Argentina. In La Captura de Carbono en Ecosistemas Terrestres Iberoamericanos, 1st ed.; Gallardo Lancho, J.F., Ed.; Red POCAIBA, Red Iberoamericana de Física y Química Ambiental: Salamanca, Spain, 2007; Volume 1, pp. 169–182. (In Spanish) [Google Scholar]
  26. FAO-Food and Agricultural Organization. Captura de Carbono en los Suelos Para un Mejor Manejo de la Tierra. Informes Sobre Recursos Mundiales de Suelos n°96; Organización de las Naciones Unidas Para la Agricultura y la Alimentación: Roma, Italia, 2002. (In Spanish) [Google Scholar]
  27. Mandiola, M.; Studdert, G.A.; Domínguez, G.F.; Videla, C.C. Organic matter distribution in aggregate sizes of a mollisol under contrasting management. J. Soil Sci. Plant Nutr. 2011, 11, 41–57. [Google Scholar] [CrossRef]
  28. Galantini, J.A.; Rosell, R.A. Long-term fertilization effects on soil organic matter quality and dynamics under different production systems in semiarid Pampean soils. Soil Till. Res. 2006, 87, 72–79. [Google Scholar] [CrossRef]
  29. Steinbach, H.S.; Álvarez, R. Changes in Soil Organic Carbon Contents and Nitrous Oxide Emissions after Introduction of No-Till in Pampean Agroecosystems. J. Environ. Qual. 2006, 35, 3–13. [Google Scholar] [CrossRef] [PubMed]
  30. Van Donk, S.J.; Martin, D.L.; Irmak, S.; Melvin, S.R.; Petersen, J.L.; Davison, D.R. Crop residue cover effects on evaporation, soil water content, and yield of deficit-irrigated corn in west-central Nebraska. T ASABE 2010, 53, 1787–1797. [Google Scholar] [CrossRef]
  31. Klocke, N.L.; Currie, R.S.; Aiken, R.M. Soil water evaporation and crop residues. T ASABE 2009, 52, 103–110. [Google Scholar] [CrossRef]
  32. Ruan, H.X.; Ahuja, L.R.; Green, T.R.; Benjamin, J.G. Residue cover and surface-sealing effects on infiltration: Numerical simulations for field applications. Soil Sci. Soc. Am. J. 2001, 65, 853–861. [Google Scholar] [CrossRef]
  33. Mitchell, J.; Singh, P.; Wallender, W.; Munk, D.; Horwath, W.; Hogan, P.; Roy, R.; Hanson, B.; Wroble, J. No-tillage and high-residue practices reduce soil water evaporation. Calif. Agric. 2012, 66, 55–61. [Google Scholar] [CrossRef]
  34. Logan, T.J.; Lal, R.; Dick, W.A. Tillage systems and soil properties in North-America. Soil Tillage Res. 1991, 20, 241–270. [Google Scholar] [CrossRef]
  35. Layton, J.B.; Skidmore, E.L.; Thompson, C.A. Winter-associated changes in dry-soil aggregation as influenced by management. Soil Sci. Soc. Am. J. 1993, 57, 1568–1572. [Google Scholar] [CrossRef]
  36. Warkentin, B.P. The tillage effect in sustaining soil functions. J. Plant Nutr. Soil Sci. 2001, 164, 345–350. [Google Scholar] [CrossRef]
  37. Dec, D.; Dörner, J.; Horn, R. Effect of soil management on their thermal properties. J. Soil Sci. Plant Nutr. 2009, 9, 26–39. [Google Scholar]
  38. Grant, R.F. Changes in soil organic matter under different tillage and rotations: Mathematical modeling in ecosystems. Soil Sci. Soc. Am. J. 1997, 61, 1159–1175. [Google Scholar] [CrossRef]
  39. Buschiazzo, D.E.; Panigatti, J.L.; Unger, P.W. Tillage effects on soil properties and crop production in the subhumid Argentinean pampas. Soil Till. Res. 1998, 49, 105–116. [Google Scholar] [CrossRef]
  40. Brandão, M.; Milà i Canals, L. Global characterisation factors to assess land use impacts on biotic production. Int. J. LCA 2013, 18, 1243–1252. [Google Scholar] [CrossRef]
  41. IPCC-Intergovernmental Panel of Climate Change. In Guidelines for National Greenhouse Gas Inventories, Prepared by the National Greenhouse Gas Inventories Programme; Eggleston, H.S.; Buendia, L.; Miwa, K.; Ngara, T.; Tanabe, K. (Eds.) IGES: Hayama, Japan, 2006.
  42. Müller-Wenk, R.; Brandão, M. Climatic impact of land use in LCA—Carbon transfers between vegetation/soil and air. Int. J. LCA 2010, 15, 172–182. [Google Scholar] [CrossRef]
  43. SIIA-Sistema Integrado de Información Agropecuaria. Available online: http://www.siia.gov.ar/_informes//Estimaciones_Agricolas (accessed on 25 February 2014).
  44. AAPRESID-Asociación Argentina de Productores en Siembra Directa. Available online: http://www.aapresid.org.ar/wp-content/uploads/2013/02/aapresid.evolucionsuperficie_sd_%20argentina.%201977_a_2011.pdf (accessed on 12 August 2014).
  45. Viglizzo, E.; Carreño, L.V.; Pereyra, H.; Ricard, F.; Clatt, J.; Pincén, D. Dinámica de la frontera agropecuaria y cambio tecnológico. In Expansión de la Frontera Agropecuaria en Argentina y su Impacto Ecológico-Ambiental, 1st ed.; Viglizzo, E.F., Jobbágy, E., Eds.; INTA: Buenos Aires, Argentina, 2010; Volume 1, pp. 9–16. (In Spanish) [Google Scholar]
  46. PNUD-Programa de las Naciones Unidas para el Desarrollo. Caracterización de la Producción Agrícola en Argentina frente al Cambio Climático. In Proceedings of the Plataforma Nacional para Contribuir al Esfuerzo Global de Mitigación y Adaptación al Cambio Climático, Buenos Aires, Argentina, 30 November–1 December 2009.
  47. Altieri, M.A.; Pengue, W.A. La soja transgénica en América Latina. Una maquinaria de hambre, deforestación y devastación socio-ecológica. Biodiversidad 2006, 47, 14–19. [Google Scholar]
  48. Donato, L.; Huerga, I.; Hilbert, A. Balance Energético de la Producción de Biodiesel a Partir de Aceite de Soja en la Republica Argentina, INTA Report; N° Doc. IIR-BC-INF-08-08; Instituto Nacional de Tecnología Agropecuaria: Buenos Aires, Argentina, 2008. (In Spanish) [Google Scholar]
  49. Salinas, A.; Martellotto, E.; Giubergia, J.P.; Álvarez, C.; Lovera, E. Soja: Evaluación de Cultivares con Riego Suplementario. Available online: http://www.elsitioagricola.com/articulos/salinas/Soja%20-%20Evaluacion%20Cultivares%20Riego%20Suplementario%202008.asp (accessed on 12 February 2014). (In Spanish)
  50. Ferraris, G.N.; Couretot, L.A.; Urrutia, J. Fertilización fosforo-azufrada en soja. Estrategias de dosis, localización y momentos de aplicación. In Proyecto Regional Agrícola CRBAN-INTA Pergamino; Instituto Nacional de Tecnología Agropecuaria, Pergamino: Buenos Aires, Argentina, 2012. (In Spanish) [Google Scholar]
  51. Martelloto, E. Recursos hídricos para el sector rural. In Proceedings of the Ciclo de Seminarios sobre Agricultura y Recursos Naturales, Buenos Aires, Argentina, 11 September 2012. (In Spanish)
  52. Bacigaluppo, S.; Bodrero, M.; Salvagiotti, F. Producción de soja en rotación vs monocultivo en suelos con historia agrícola prolongada. Soja Mejor. Prod. 2009, 42, 53–55. (In Spanish) [Google Scholar]
  53. Olson, D.M.; Dinerstein, E.; Wikramanayake, E.D.; Burgess, N.D.; Powell, G.V.; Underwood, E.C.; D’Amico, J.A.; Itoua, I.; Strand, H.E.; Morrison, J.C.; et al. Terrestrial Ecoregions of the World: A New Map of Life on Earth a new global map of terrestrial ecoregions provides an innovative tool for conserving biodiversity. BioScience 2001, 51, 933–938. [Google Scholar] [CrossRef]
  54. INTA-Instituto Nacional de Tecnología Agropecuaria. Sistema de Clasificación de la cobertura del suelo (Land cover classification system- LCCS). In Proyecto Nacional de Cobertura y uso del Suelo de la REPÚBLICA Argentina; INTA PNECO 1643; Instituto Nacional de Tecnología Agropecuaria: Buenos Aires, Argentina, 2009. (In Spanish) [Google Scholar]
  55. Vivas, H.S.; Vera Candioti, N.; Albrecht, R.; Martins, L.; Hotián, J.L. Beneficios productivos y económicos en trigo/soja por la fertilización con P y S en una rotación trigo/soja-maíz-soja. Relación con el P extractable. R. Soja Mejor. Prod. 2010, 45, 73–79. (In Spanish) [Google Scholar]
  56. Grau, H.R.; Arturi, M.F.; Brouwn, A.D.; Aceñolaza, P.G. Floristic and structural patterns along a chronosequence of secondary forest succession in Argentinean subtropical montane forests. For. Ecol. Manag. 1997, 95, 161–171. [Google Scholar] [CrossRef]
  57. Lal, R. Crop residues and soil carbon. In Proceedings of the Conservation Agriculture Carbon Offset Consultation, Lafayette, IN, USA, 23–30 October 2008.
  58. Halvorson, A.; Wienhold, B.J.; Black, A.L. Tillage, nitrogen and cropping system effects on soil carbon sequestration. Soil Sci. Soc. Am. J. 2002, 66, 906–912. [Google Scholar] [CrossRef]
  59. Salinas-Garcia, J.R.; Matocha, J.E.; Hons, F.M. Long-term tillage and nitrogen fertilization effects on soil properties of an Alfi sol under dryland corn/cotton production. Soil Till. Res. 1997, 42, 79–93. [Google Scholar] [CrossRef]
  60. Giubergia, J.P. Efectos del Riego Complementario Sobre Propiedades del Suelo en Sistemas de Producción con Siembra Directa. Thesis of Magister en Ciencias del Suelo, Escuela para Graduados Ing. Agr. Alberto Soriano, Facultad de Agronomía, Universidad de Buenos Aires, Buenos Aires, Argentina, 2012. [Google Scholar]
  61. Bhattacharyya, R.; Kundu, S.; Pandey, S.C.; Singh, K.P.; Gupta, H.S. Tillage and irrigation effects on crop yields and soil properties under the rice-wheat system in the Indian Himalayas. Agric. Water Manag. 2008, 95, 993–1002. [Google Scholar] [CrossRef]
  62. Nunes, J.M.; López-Piñeiro, A.; Albarrán, A.; Muñoz, A.; Coelho, J. Changes in selected soil properties caused by 30 years of continuous irrigation under Mediterranean conditions. Geoderma 2007, 139, 321–328. [Google Scholar] [CrossRef]
  63. De Bona, F.D.; Bayer, C.; Dieckow, J.; Bergamaschi, H. Soil quality assessed by carbon management index in a subtropical Acrisol subjected to tillage systems and irrigation. Soil Res. 2008, 46, 469–475. [Google Scholar] [CrossRef]
  64. Potter, K.N.; Jones, O.R.; Torbert, H.A.; Unger, P.W. Crop rotation and tillage effects on organic carbon sequestration in the semiarid southern Great Plains. Soil Sci. 1997, 162, 140–147. [Google Scholar] [CrossRef]
  65. Wright, A.L.; Hons, F.M. Soil aggregation and carbon and nitrogen storage under soybean cropping sequences. Soil Sci. Soc. Am. J. 2004, 68, 507–513. [Google Scholar] [CrossRef]

