Article

Relationship between Quarry Activity and Municipal Spatial Planning: A Possible Mediation for the Case of Sardinia, Italy

Department of Civil and Environmental Engineering and Architecture, DICAAR, University of Cagliari, via Marengo, 3, Cagliari 09123, Italy
*
Author to whom correspondence should be addressed.
Sustainability 2015, 7(12), 16148-16163; https://doi.org/10.3390/su71215801
Submission received: 29 September 2015 / Revised: 23 November 2015 / Accepted: 25 November 2015 / Published: 4 December 2015
(This article belongs to the Special Issue Life Cycle Assessment on Green Building Implementation)

Abstract

:
Despite its economic importance, quarrying activity for the production of natural aggregates (sand, gravel, and crushed stone) can result in overexploitation of the natural environment. This paper investigates the current state of natural and recycled aggregates in Sardinia Italy and how to limit the production of natural aggregates (NA) and increase the use of recycled aggregates (RA). The municipalities of Cagliari, Sant’Antioco and Tortolì of Sardinia, Italy, were chosen as case studies because they fall within a particular territorial context. Owing to its geographic condition, the island of Sardinia must produce its own raw materials. The results of this research show how the combined use of NA and RA can help meet local and regional demand for aggregates. This proposal is derived from a needs assessment of NA based on urban masterplans for each municipality. Possible strategies for limiting the consumption of NA, as well as the use of RA, are also described.

1. Introduction

Designing with industrial and recyclable materials leads to more sustainable buildings. Most certificates for green building recommend such practices; two of the best-known certification systems are the US Green Building Council’s Leadership in Energy and Environmental Design (LEED) rating system and the Green Globes Green Building Initiative. The introduction of these systems encourages the incorporation of many environmentally friendly programs in urban masterplans (UMPs). With this work, we intend to introduce a methodology processes of transition that addresses both certification systems.
Natural resources, which are inherently non-renewable, have been overexploited for centuries. Mining and quarrying are industrial activities that can cause irreversible changes to the earth’s surface, leading to the degradation of the environment [1,2,3]. Improper management of these activities, particularly in the industrial processing and waste management stages, can result in dangerous consequences for the environment. Despite its economic importance, quarrying activity for the production of natural aggregates (NA) (sand, gravel and crushed stone) is a significant source of environmental degradation.
Aggregates are used primarily in the construction sector, both without being laboriously processed (road or railway ballast), and in the production of other high-quality materials such as concrete, asphalt or pre-cast products. The European Union produces approximately two billion cubic meters of aggregates per year in order to meet the demand for this material [4]. Since 2007, the per capita production of construction aggregates in Europe increased from approximately 6 tons/inhabitant [5]. One possible solution to the environmental costs of aggregate production is to satisfy a part of the demand for construction aggregates with construction and demolition waste (CDW), as determined by Directive 2008/98/EC of the European Union (19 November 2008) and international research [6,7,8].
Recycled aggregates (RA) can be produced from CDW and reused in the construction sector. This practice tends to be common in those countries where high residential density and a shortage of raw materials reduce the opportunity for new quarry sites. European regulation also strongly recommends using RA to meet natural resource demand [8,9]. This regulation states that members states should reach a waste recovery rate of 70% by weight by 2020. Since the regulation was established, the recycling of aggregates increased in some European countries. In fact, some States, including Denmark, the Netherlands, and Germany, have been able to recycle more than 70% of their CDW since the mid-nineties [8]. Germany, for example, had a recycling rate of 89.2% in 2007 [10], and Denmark recently adopted a landfill tax to further encourage the recycling of CDW. However, in some other countries, such as Italy, this practice is still so little diffused that it is very difficult to determine the amount of RA obtained from the recycling of CDW. Furthermore, the use of RA in concrete is virtually non-existent.
This paper analyses the use of CDW as RA in the Sardinia region, where CDW amounted to approximately 1,127,644 tons in 2008 [11]. The Sardinia region must supply the demand for aggregates with the extraction of its own raw materials because of its particular insular geographic condition. Therefore, the Sardinia region can be considered a “closed system” in regard to the supply of NA and RA.
This work is a part of an extensive research project on the recovery of inert waste [12], in which the use of recycled aggregates is integrated into the urban masterplans (UMPs) [13], inspired by international literature, in particular a new approach to waste management demolition in China [14]. In addition, this paper attempts to innovate the urban masterplan (UMP) [13] to create more sustainable development strategies that utilize the measurement and evaluation of the use of RA.
This study aims to investigate the production and recycling of natural aggregates (NA) using the UMPs [13] of three different urban areas in Sardinia, Italy (Cagliari, Sant’Antioco and Tortolì) as a tool for evaluating demand. These three case studies were chosen because they represent the three major urban typologies of Sardinia. Cagliari is the regional capital of Sardinia and has the densest urban configuration. Tortolì and Sant’Antioco are two different costal municipalities with widespread urban configurations. The authors compared the results of this study with similar municipalities in other countries, but found difficulty comparing data, usingthe diversity evaluation method [15,16,17,18]. The proposed methodology provides valuable insights, useful at the local, national, and international levels. In fact, this methodology identifies a correlation between the materials demand and urban planning processes on an international level, through the main planning tool of urban government, the UMP [13]. This relationship is especially important in urban contexts with population and economic growth because optimizes the flow of materials in a sustainable environmental lens.
This paper is divided into two parts. In the first part, the CDW streams that can be reused in Sardinia are estimated through a census of recycling facilities in Sardinia and compared by interpreting the demand for aggregates from each municipality’s UMP [13]. In the second, the authors focus on the definition of the amount of natural aggregates (NA)that can be used in combination with RA to meet the municipal demand for aggregates. This ratio is also derived from each UMP. In all three case studies, the UMP is valid for 10 years. The paper concludes by analysing the study’s findings.

2. Estimation and Comparison of Natural and Recycled Aggregates in Sardinia, Italy

According to the Regional Waste Management Plan (Piano Regionale Gestione Rifiuti (PRGR)), Sardinia has a per capita CDW production rate of approximately 670 kg/inhabitant/year. This production rate is significantly lower than the national average of approximately 900 kg/inhabitant/year [19]. The region of Sardinia has proven to be sensitive to the problem of proper management of the materials produced in CDW by adopting the PRGR. However, this policy still does not cover the recycling of materials. Despite lacking means for the import and export of CDW in Sardinia, the use of certified RA for the construction of public and private works, is possible. The Regional Plan of Extractive Activities (Piano Regionale Attività Estrattive (PRAE)) [20] does not identify any initiative aimed at limiting the extraction of NA. Although these plans are closely related, there are no initiatives with a unified and sustainable vision for the territory. As such, the authors intend to outline a proposal for orienting initiatives towards the concept: less quarrying, less landfill. In particular, this proposal optimizes the flow of materials derived from construction activities (RA) to their use as a substitute for NA.

2.1. Natural Aggregates and Recycled Aggregates in the Construction Sector. A Comparison between Italy and Other European States

Inert materials [21] are of primary importance for the construction industry. In industrialized countries, inert materials represent 10% of the gross national product (prodotto interno lordo [PIL]). The analysis conducted at the European level reveals that the average quantity of extracted aggregates amounted to 2.95 billion tons/year, which corresponds to approximately 7.9 tons/year per capita [22].
In Italy, 62.2% of mining is inert. Gravel, sand, and limestone for cement make up 27% of the industry. This confirms the close and long-established correlation between mining and construction activity, which from the second post-war characterized the building of the historic Italian city [23].
There was a substantial decline in aggregate production from 142 million cubic meters in 2009, to 89 million cubic meters in 2010, and to approximately 80 million cubic meters in 2012. This decline is likely linked to the economic crisis in the housing market, which has affected Italy in particular.Nevertheless, Italy remains the third largest European producer of aggregates, after Germany and France [24].
In addition, the construction industry and urban architecture are based, as in all national and international cities, on the principle of availability of construction materials: aggregates, ornamental rocks and concrete [25]. In Italy, these materials are strictly inert, ornamental rocks and cement.
In 2012, Italy has held the record for the greatest cement consumption per capita, at 4322 kg against the EU average of 314 kg [26].
Although the economic crisis drastically reduced production and consumption (Table 1), demand remained high. In fact, all urban renovation projects generate a strong demand for materials and provide the opportunity to utilize recycled materials in the building process [27]. The “extraordinary maintenance” sector plunged in 2011 (Table 1) due to crisis in the international real estate market, then grew to an estimated +21% in 2015. The “extraordinary maintenance” sector is the only sector with a positive trend compared to others in Table 1. In addition, Table 1 shows how the construction sector in Italy is particularly oriented to urban renewal through “extraordinary maintenance” (recovery of existing buildings), which overshadows all other types of building intervention.
Table 1. Investments in the construction sector [26,28].
2014 Millions (€)% Variations in Quantity
200820092010201120122013201420152008–20142008–2015
Buildings135,332−2.4−8.6−4.7−4.2−7.6−6.9−3.5−2.4−32.0−33.6
Houses66,482−0.4−8.1−0.1−2.9−6.4−5.7−2.4−1.3−28.7−29.7
  • New 
20,565−3.7−18.7−6.1−7.5−17.0−19.0−10.2−8.8−62.3−65.6
  • Extraordinary Maintenance 
45,9173.53.14.80.60.82.91.52.018.520.9
Non-Residential68,850−4.4−9.1−9.4−5.7−9.1−8.0−4.6−3.5−35.0−37.2
  • Private 
43,357−2.2−10.7−6.9−2.1−8.0−7.2−4.3−3.0−23.6−25.9
  • Public 
25,493−7.2−7.0−12.6−10.5−10.6−9.3−5.1−4.3−48.1−50.3
Meanwhile the European Commission [9] required the recovery of inert materials from CDW to reach 70% by 2020. Governments could take the following initiatives concerning the reuse of products and preparing for reuse of waste to uphold this directive (Legislative Decree of 3 December 2010, n. 205, article 6):
(i)
Use of economic instruments;
(ii)
Logistical measures, such as the establishment and support of accredited centres and networks of repair/reuse; or
(iii)
Adoption of the framework of procedures for granting public contracts.
Some member states are close to, or have already met, the minimum target for the recovery of waste from construction and demolition imposed by the CE directive [9]. For Italy, however, this is a particularly ambitious target. The trend in Italy is to consider the business of mining and digging easier and more profitable than the business of recovery and reuse.
Lacking a unified building code under the Law of 11 November 2014, n. 164 (also called Unlock Italy—simplification of planning rules), the authors note that many municipalities have introduced specific measures for the use of CDW through zoning laws. Although scattered and uncoordinated, the initiatives suggested by the CE directive listed above assist in the reduction of land consumption [29]. In fact, use of recycled aggregates can reduce the amount of land occupied by levy mining and landfills.
In this sense, evaluating the annual demand forNA and RA, asreported to the civil and public construction sector in reference to the UMP, is the first step to identifying possible strategies for an environmental compromise.

2.2. CDW Management in Sardinia, Italy

The tool used to analyse CDW management in Sardinia is the Regional Special Waste Plan (il Piano Regionale dei Rifiuti Speciali (PRRS)), approved on 21 December 2012 [30]. Thisannual report considers allwaste produced, processed, transported or sent for disposal in the region. According to these data, CDW production amounted to a total of 658,676,965 kg, which accounts for 9% of the total regional production of hazardous waste, and corresponds to 670 kg per capita. It should be noted, however, that this production is considered only part of CDW; this is just the amount that is declared by treatment plants. The production of CDW in Sardinia (approximately 670 kg/individual/year) appears to be under-valuedas compared to the national average (approximately900 kg/inhabitant/year), and by comparison with the data obtained from the Model of the Environmental Declaration (Modello Unico di Dichiarazione Ambientale (MUD) [31]) for other territories in the national context.
Table 2 shows that most of this type of waste in Sardinia is subject to recovery (295,092,875 kg, approximately 53% of the total) and the remaining share, 258,736,682 kg, is destined for disposal.
Table 2. CDW production in Sardinia.
DescriptionProduction
Waste mixed construction and demolition waste352,314,211 kg
Mixture of concrete, bricks, tiles and ceramics120,371,652 kg
iron and steel120,371,652 kg
cement79,337,576 kg
bituminous mixtures35,051,773 kg
The Regional Special Waste Plan (PRRS) does not include items of import/export for CDW in Sardinia. This plan sets objectives forthe recovery and disposal of this waste as indicated in Table 2. In 2008, material recovery was 53%, 12 percentage points below the 2015 objective goal of 65% (Table 3). The rate of landfilling is still too high to be overlooked. In addition, Table 3 indicates that the percentage of recycling should be distributed, according to the objectives for 2015 and 2020.
Based on Table 3, the authors decided to focus on how to increase the current recovery rates in Sardinia, for material recovery in particular. The authors quantified the demand for aggregate from the UMP, to evaluate the possibility of replacing the use of NA with RA from CDW. However, before doing so, it was necessary to understand Sardinia’s situation.
Table 3. Recovery rate for CDW in Sardinia (2008), and Objectives for 2015 and 2020 [32].
Current Recovery Rate in Sardinia2015 Objective2020 Objective
Material recovery53.00%65.00%70.00%
Energy recovery0.10%0.00%0.00%
Treatment46.70%35.00%30.00%
Disposal46.00%0.00%0.00%
Total 100.00%100.00%

3. Strategies to Reduce Quarrying Activity in Sardinia

The sustainable cycle of development represents an important part of green building materials, in fact establishes a beneficial reutilization of waste resources. In this context, reducing not only mining activity but also its impact on the landscape is urgent. Data from other European countries demonstrate that it is possible to reduce the amount of material extracted through a policy of reuse of waste from the construction industry. This is, currently, the only possible way to give a future to many areas that may otherwise be condemned to increasingly degraded identities and landscape quality. The countries leading in using RA (United Kingdomand Denmark) demonstratethat it is possible to promote innovative new jobs associated with the mining industry, including green jobs in the recovery of aggregates, that further contributes to the protection of the landscape [24].
The following actions are required in order to reduce quarry activity in Sardinia:
(i)
Define a maximum threshold of demand.
(ii)
Return to legalizing the transfer of inert materials.
(iii)
Introduce concession fee for levy mining of aggregates, which is widespread in Sardinia and the main source of aggregates production.
The authors note that the first two points are subject to extensive research and the introduction of a monetary counterpart is completely absent in some Italian regions (Basilicata, Liguria and Sardinia). In this regard, it is important to show the situation in Italy by regions (Table 4).
Table 4. Revenues of royalties and profits from the sale of sand and gravel in Italy [33].
Regions Geographical DistributionsThe Annual Revenue from the Royalties (in Euros)Annual Business Volume from Mining Activities with Sales Prices (in Euros)Revenues of Royalties Compared to the Selling Price for Sand and Gravel (%)
Piedmont5,384,980137,371,9623.9
Aosta Valley62,4002,600,0002.3
Lombardy9,728,796173,728,5005.6
Trentino-Alto Adigeno data10,875,000-
Bolzano-Bozen471,35011,783,7503.9
Veneto3,786,89176,348,6254.9
Friuli Venezia Giulia420,3389,553,1374.4
Liguria00-
Emilia-Romagna3,593,71678,809,5624.5
Tuscany1,434,55437,358,1873.8
Umbria229,8677,662,2502.9
Marche811,71814,290,8125.6
Lazio4,494,150187,256,2502.4
Abruzzo2,119,32620,069,37510.5
Molise414,8865,186,0757.9
Campania118,9501,486,8757.9
Puglia827,410129,282,8870.7
Basilicata010,051,2500
Calabria420,00014,975,0002.9
Sicily208,33710,416,8752.1
Sardinia059,625,0000
ITALY34,527,669998,731,372
Table 4 shows the different weights that individual regions attributed to royalties, which indicates a lack of unified national vision for aspects of mining, environmental protection and trade.
In the international scenario, similar conditions occur. However, the cases of Denmark and the United Kingdom are interesting [24]. Denmark has been struggling with how to reduce quarry extraction and promote the recovery of waste from construction and demolition for over 20 years, while the United Kingdom presents uniform royalties in single regions that are 5–6 times higher than the Italian average.
The fragmented Italian approach distorts the market for aggregates, encouraging higher production and sales in territories not subject to (or subject to modest) royalties. This will inevitably lead to the enlargement of the rays of action between places of origin and destination.

4. Evaluation of the Demand for Natural and Recycled Aggregates Resulting from Implementation of the Urban Masterplan

Green buildings represent a great market opportunity and, in this sense, that the assessment of the aggregate resulting from the UMP should contribute. In fact, the demand for aggregates in Cagliari, Sant’Antioco and Tortolì was derived from forecasts in the UMP for each municipality by (i) quantitative and qualitative analysis of the CDW flow in the Sardinian Region; and (ii) the amount of RA that may be used to meet the demand.
More specifically, the authors proceeded by following these steps:
  • analyze flow of the Regional Special Waste Plan of Sardinia (il Piano Regionale dei Rifiuti Speciali (PRRS)) of 2012;
  • census Sardinian inert material treatment facilities;
  • interview operators and catalogue plants;
  • sample the CDW physical and chemical analysis system periodically [34];
  • derive the aggregate demand from forecasts in UMP; and
  • compare quantities produced and estimated demand, derived from the UMP tool.

4.1. Assessment of the Demand for Inert Materials in Cagliari, Sant’Antioco and Tortolì

In order to meet the demand for aggregates in a local context, a crucial step is to know the amount of material consumed in the territory of interestduring a specified period. Mining plans use this information to estimate the demand for aggregates of a territory. Recently, these plans play a major role inmeeting demand for natural materials by using aggregates in the construction industry. The primary purpose of these plans is to understand the demand for aggregates and facilitate the use of recycled material from CDW in place of NA.
The demand for aggregates within a territory is destined primarily to private construction and public works, since the construction sector is the primary field of application for aggregates. Badino et al. [
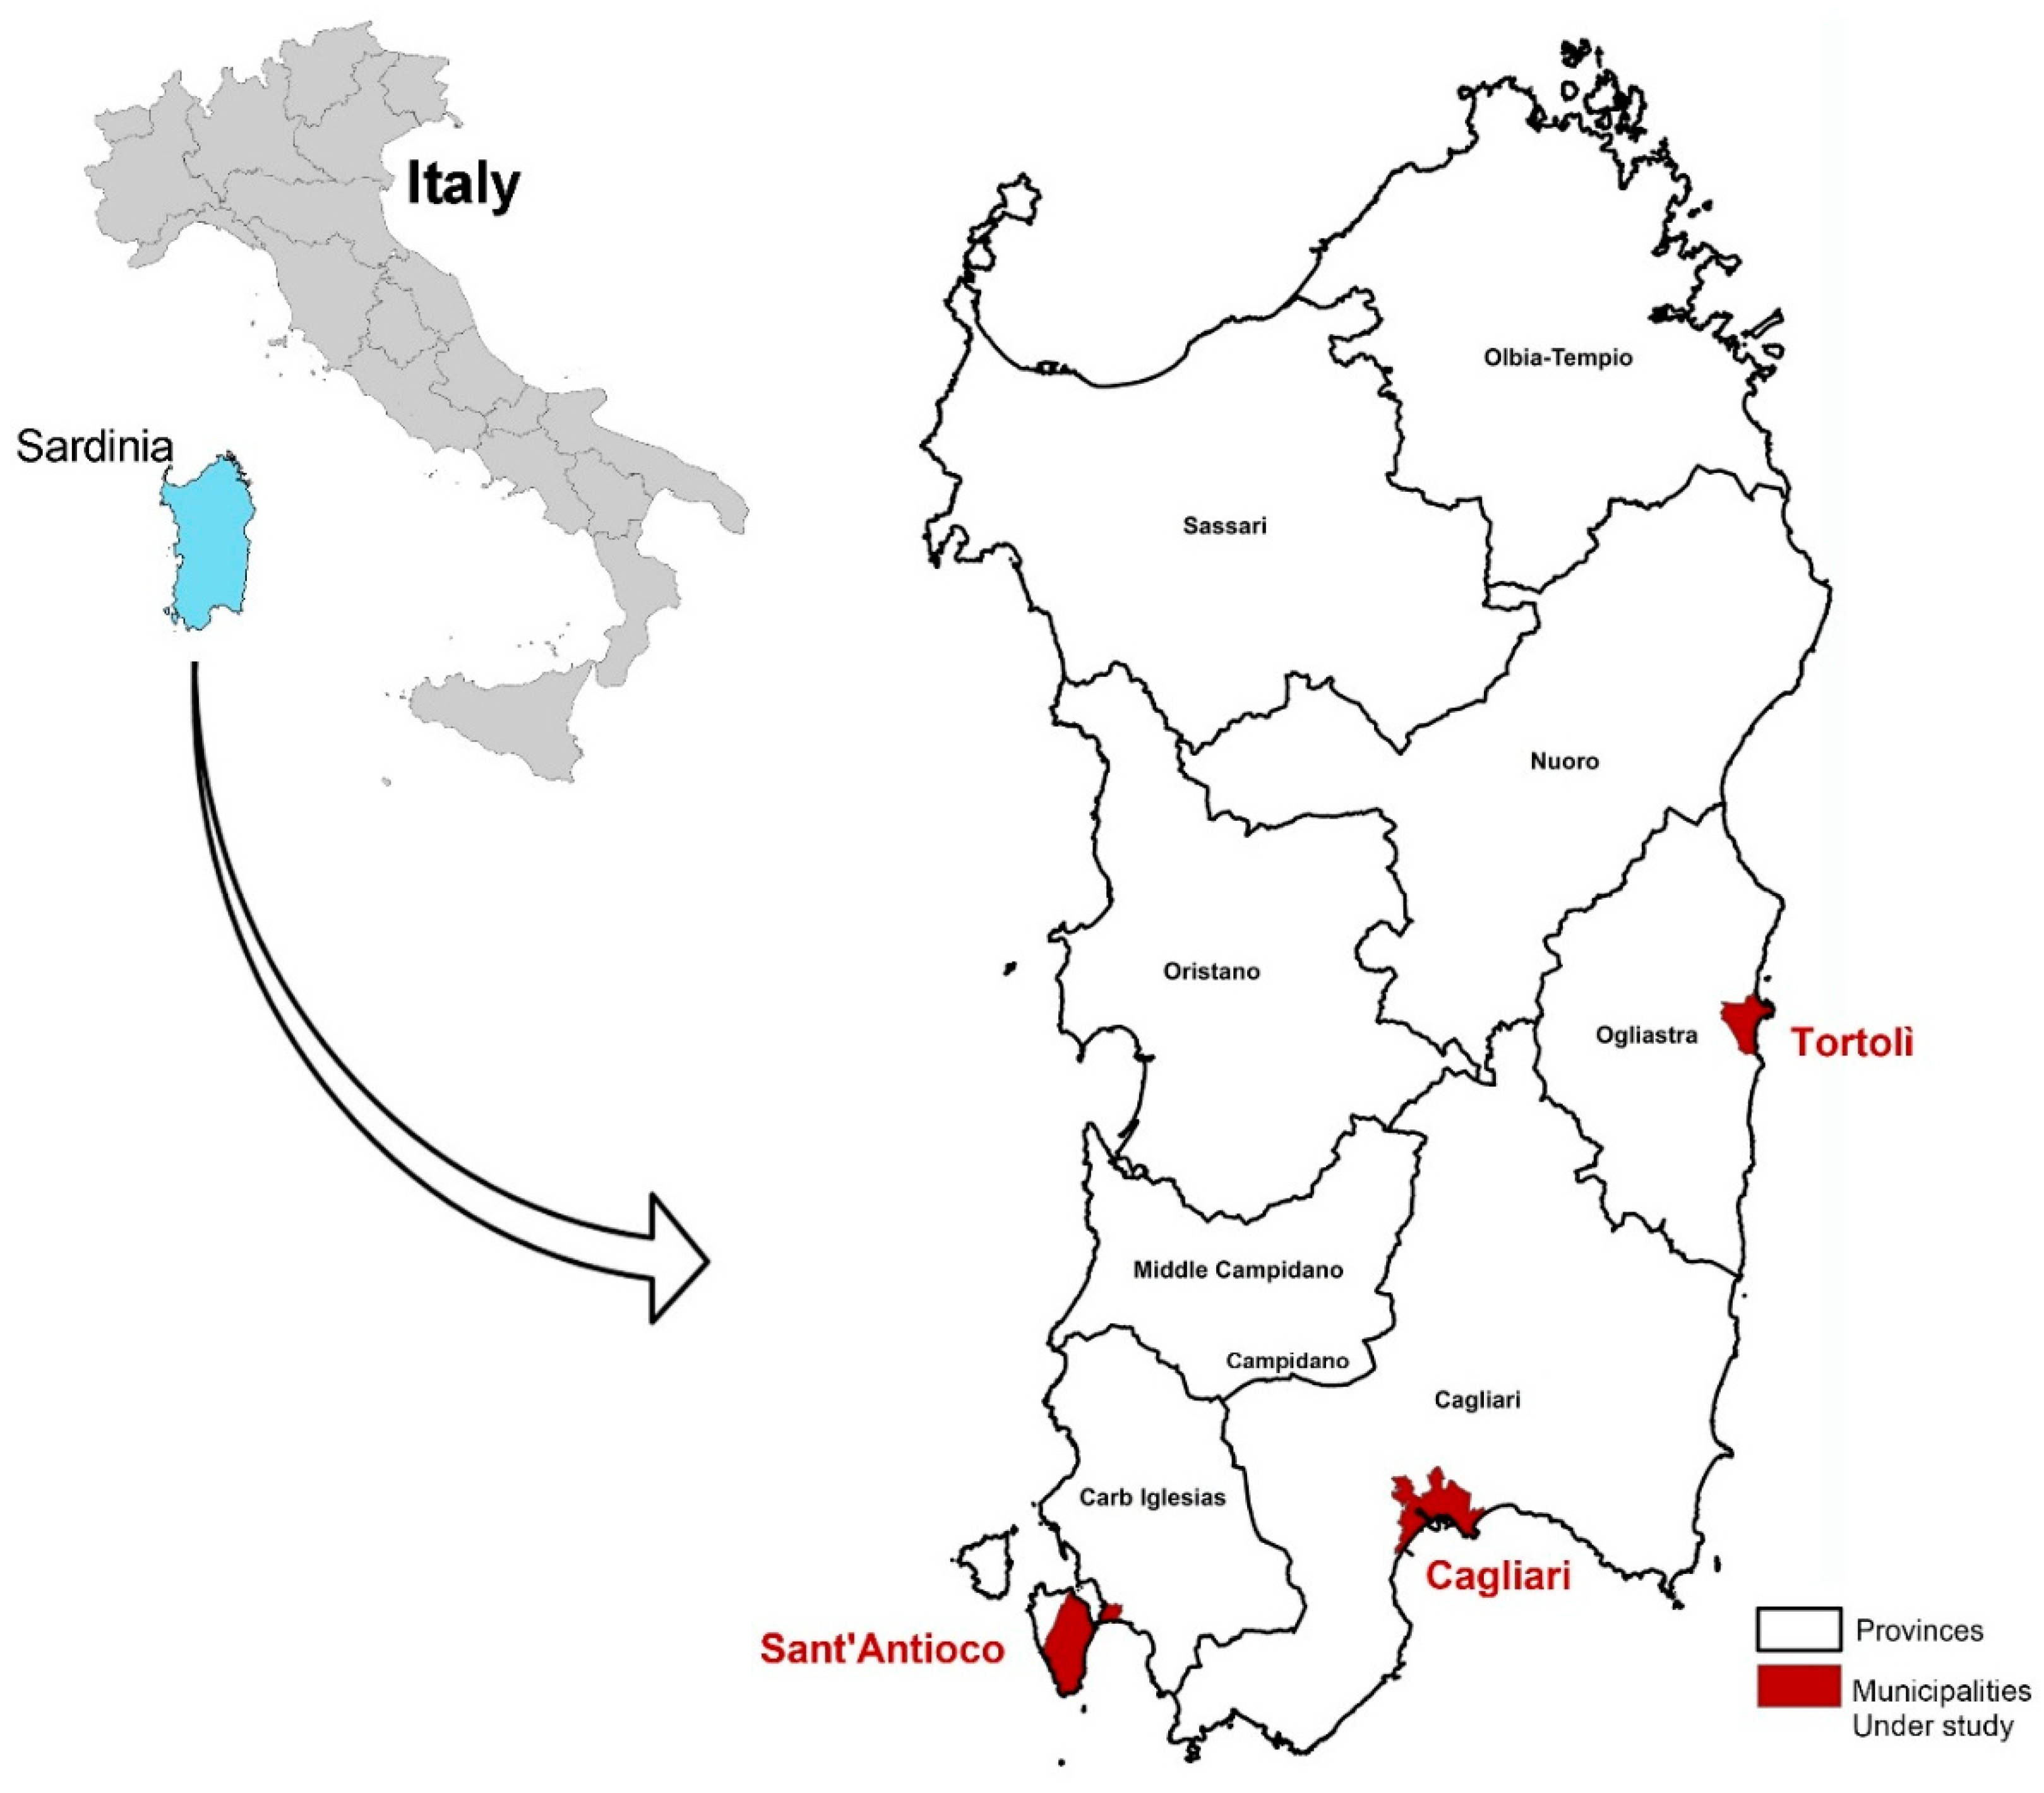
35] identified a number of approaches for assessing the demand for aggregates, which include using local planning tools (UMP), the method that was adopted in this paper . This method is based on the estimation of the possible consumption of minerals. In each case study (Cagliari, Sant’Antioco and Tortolì, Figure 1), the hypothesis that land consumption is equivalent to the demand for aggregates, appears to be supported. In fact, Sardinia can only count on its own resources due to the low market value of aggregates and to the high costs of transport to and from the island. Therefore, the market of inert materials is fully represented at the local level in insular regions and, consequently, land consumption appears to be closely linked to the UMP forecast.
Figure 1. The Municipalities of Cagliari, Sant’Antioco and Tortolì.
Sustainability 07 15801 g001
In Italy, the UMP usually applies to a period of 10 years, which is also the period used to assess demand for aggregates [36]. According to the adopted methodology, the demand for aggregates is derived from expected aggregate volumes. In accordance with the regional legislation and to Zoppi et al. [37] the zoning rules of cities’ masterplans categorize urban areas (expressed in square meters) using the following abbreviationsin parentheses:
  • Historic centre zone (“A” zone);
  • Residential completion zone (“B” zone);
  • Residential expansion zone (“C” zone); and
  • Tourism zone (“F” zone)
The achievable volumes were calculated for every homogeneous zone (A, B, C and F zones) for each municipality by adding the existing volume to the maximum realized volume (Table 5). Subsequently, the coefficients of use were applied according to Italian and Regional law These coefficients define the relationship betweenhomogeneous areas and the percentage of aggregates required by the corresponding building sector. In this way, the authors deduced the amount of materials required for the execution of works envisaged by the UMP [38]. The estimated demand for aggregates (deduced from the indices of use) for the municipalities of Cagliari, Sant’Antioco, and Tortolì are outlined in Table 5. In particular, Table 5 shows for each homogeneous area of each municipality under studied the urban planning volumes, established by the legislation of the UMP, from which we can deduct the amount of aggregates required to realize them (for instance, new construction and maintenance of construction (construction of buildings, public works, private works, etc.) and road infrastructure), The authors determined the results presented in Table 5 using conversion coefficients calibrated to the final function of the building. Because these coefficients are numerous and have a complex application, the table shows only the results in the last two columns [39,40,41].
Table 5. Estimation of the demand for aggregates in Cagliari, Sant’Antioco and Tortoli based on UMP forecasts (Source: data from UMPs under study).
CagliariDemand Estimation (Aggregates for New Construction and Maintenance (Cubic Meters))Estimation of Required Aggregates For Max Expected Inhabitants and for Homogeneous Zone
Homogeneous ZoneExisting VolumeMax Realizable VolumeVolume to be RealizedInhabitantsMax Expected InhabitantsConstruction for Homogeneous ZoneViabilityAggregates Per Capita (Total Estimation of Aggregates Demand/Max Expected Inhabitants (Cubic Meters/Inhabitants))
(Vex)(Vmax_R)(Vmax_r-Vex)(Data from UMP)(Data from UMP)
A zone5,522,0435,522,043018,20818,65433,13261850.2110.554
B zone26,514,75228,317,4891,802,737141,141159,168519,63627,8350.343
C zone1,222,6863,116,6551,893,96912,65930,599386,130102,2911.5961.596
TOTAL33,259,48136,956,1873,696,706172,008208,421938,898136,3112.150
Sant’AntiocoDemand estimation (Aggregates for new construction and maintenance (cubic meters))Estimation of required aggregates for max expected inhabitants and for homogeneous zone
Homogeneous ZoneExisting VolumeMax Realizable VolumeVolume to be RealizedInhabitantsMax Expected InhabitantsConstruction for Homogeneous ZoneViabilityAggregates Per Capita (Total Estimation of Aggregates Demand/Max Expected Inhabitants (cubic meters/inhabitants))
(Vex)(Vmax_R)(Vmax_r-Vex)(data from UMP)(data from UMP)
A zone120,500135,50015,00080090037234140.4601.270
B zone2,544,2592,544,259025,44225,44215,26652490.810
C zone485,032884,862399,8304851884982,87641,8591.4104.059
F zone174,124985,080810,956290216,418163,236271,5962.649
TOTAL3,323,9154,549,7011,225,78633,99551,609265,101319,1185.329
TortoliDemand estimation (Aggregates for new construction and maintenance (cubic meters))Estimation of required aggregates for max expected inhabitants and for homogeneous zone
Homogeneous ZoneExisting VolumeMax Realizable VolumeVolume to be RealizedInhabitantsMax Expected InhabitantsConstruction for Homogeneous ZoneViabilityAggregates Per Capita (Total Estimation of Aggregates Demand/Max Expected Inhabitants (cubic meters/inhabitants))
(Vex)(Vmax_R)(Vmax_r-Vex)(data from UMP)(data from UMP)
A zone548,737548,7370 1960329211,4690.7530.975
B zone1,410,8151,410,8150 5039846527130.222
C zone1,388,5532,119,832731,278 8231154,587483,4077.7518.543
F zone483,001629,484224,024 11,74947,70345,3870.792
TOTAL3,831,1064,708,868955,302026,979214,047542,9769.518
In order to focus on the residential completion (“C” zone) and tourism areas (“F” zone), the authors did not consider the enterprise and industrial areas (“D” zone) and recreational and service areas (“G” zone). In this way, we could compare C and F zones with the remaining residential areas that have a predominantly historic fabric (A and B zones). This analysis allowed us to understand how to contain both the consumption and demand for soil resulting from expansion in these zones. The authors identified that the highest territorial indices (TI) [42] correspond to A and B zones, while the remaining zones (C and F) correspond lower values (Table 6). The values in Table 6 were obtained by total area and maximum achievable volume (extracted from the values declared by each UMP). An average value of TI is thus obtained for each homogeneous zone. This average value can express compactness or spread of the urban configuration of each homogeneous zone in the three municipalities studied.
Table 6. TI Distribution for A, B, C and F zones in Cagliari, Sant’Antioco and Tortolì, based on UMP forecasts (Source: data from UMPs under study).
Cagliari
Homogeneous Zone(TA) Total AreaVmax_RTI =Vmax_R/TA (Cubic m/sqm)
A zone1,237,0075,522,0434.46
B zone5,567,05928,317,4895.09
C zone2,846,6033,116,6551.09
F zone000.00
Total9,650,66936,956,187
Sant’Antico
Homogeneous Zone(TA) Total AreaVmax_RTI =Vmax_R/TA (Cubic m/sqm)
A zone41,501135,5003.26
B zone1,049,8232,544,2592.42
C zone1,292,324884,8620.68
F zone6,459,541985,0800.15
TOTAL8,843,1894,549,701
Tortolì
Homogeneous Zone(TA) Total AreaVmax_RTI =Vmax_R/TA (Cubic m/sqm)
A zone131,262548,7374.18
B zone541,3521,410,8152.61
C zone24,446,2622,119,8320.09
F zone1,999,102629,4840.31
TOTAL27,117,9784,708,868
High values of TI correspond to an urban form more compact than those associated with low TI values, which correspond to a dispersed configuration. The building and urban density, which is a measure of building volume per square meter of territorial surface (TS), is determined by the manufacturability of territorial indices (TIs). Land use decisions with compact, dense configurations have greater environmental sustainability in terms of the energy use reduction [43] and building material selection [39]. However, these choices are strongly influenced by national and regional legislation [44] that can affect decisions made by the designer and the planner.

4.2. Valuation Assumptions for the Maximum Limit of the Demand for Aggregates

The above analysis shows that the only way to limit levy mining aggregates is through an urban design that favours compact configurations over dispersed. This is because it is not possible to encourage the use of CDW when the distance between production centres and product destinations exceeds (30 km [45]).
Aligning local planning (UMP) forecasts for the reuse of materials with the targets that the region of Sardinia has established for itself in the period 2015–2020 (Table 3) is not possible. The primary obstacle lies in the distance between the places of production and those of potential destination. Therefore, rather than acting only on reuse it is important also to consider limiting the average requirement per capita per year, making an appropriate reduction of 35%, in line with the guidelines restricting land consumption [46].
To allow for reduction in per capita demand on the implementation of the UMP, the authors argue that a specific parameter associated with the UMP should be introduced. This specific parameter expresses the maximum demand for aggregates, that, for simplicity, we will call “Da-max (UMP)”.
A generic municipality (n) with a UMP has a demand for aggregates, Da-n (UMP), that can have the following conditions:
(1)
Da-n (UMP) > Da-max (UMP), implies environmental incompatibility
(2)
Da-n (UMP) = Da-max (UMP), implies environmental neutrality
(3)
Da-n (UMP) < Da-max (UMP), implies environmental compatibility
The best place for discussion about the definition of the parameter “Da-max (UMP)” is within the Strategic Environmental Assessment (SEA), which delegates the definition of policies for environmental sustainability. Pursuant to Legislative Decree no. 152/2006 (Art. 6 and subsequent amendments), all plans that can have significant impacts on the environment, including UMPs and mining activities must perform a SEA.
The SEA is a process that accompanies the development and adoption of the UMP in order to ensure the integration of environmental aspects. The SEA requires that from the earliest stages of UMP development both local and regional environmental externalities must be accounted for.
Three possible scenarios are formulated in the UMPs for Sant’Antioco and Tortolì. Cagliari constitutes a special case because it lacks C zones.
All scenarios include a compact configuration of A and B zones for which no reduction is made in relation to the potential levy. Configurations in the remaining zones were considered based on the reduction of the potential levy. A brief description of the three proposed scenarios is shown below.
  • Scenario 1: Widespread urban form for the residential C zones, and compact urban form for the tourism F zone.
  • Scenario 2: Equivalent urban form between C and F zones.
  • Scenario 3: Compact urban form for C zones and widespread urban form for F zones.
These scenarios represent the unique assets of urban form that are possible in the drafting process of a UMP.
This proposal builds on limiting the use of natural materials.
The additional contribution that the authors intend to introduce is a portion of RA use in the implementation of the UMP. The inter-ministerial decree D.M. 203/2003 states that public offices and companies with a majority public capital should cover the annual demand of manufactured goods, and goods with a portion of products made from recycled material in not less than 30% of the same demand.
In regards to the construction industry, the procedures for implementing these prescriptions are contained in the Circular of the Italian Ministry of the Environment No. 5205 of 15/07/2005 [47]. This Circular defines the technical and performance criteria that recycled materials should possess, including the frequencies of control.Furthermore, the annexes of Circular specify the values of the technical and environmental characteristics of the products, with respect to its destination.
In this sense, the Green Public Procurement (GPP), as defined by the Action Plan for the environmental sustainability of consumption in the field of public administration (Decree of 10 April 2013), plays an important role. The GPP is defined by the European Commission as “[…] the approach by which Public Bodies integrate environmental criteria into all stages of their procurement process, thus encouraging the spread of environmental technologies and the development of environmentally sound products, by seeking and choosing outcomes and solutions that have the least possible impact on the environment throughout their whole life-cycle” [48].
New construction and maintenance viability can be an important test case for two reasons. First, because these are works for which the literature and recycling technologies are widely used and second because these are works for which it is easier to overcome cultural mistrust.
The imposition in the reuse of RA in UMPs through the GPP, referring to transport structures with a margin of 30% compared to the demand, is an important test case for the pursuit of environmental sustainability for public administrations.
Specifically the three case studies as described in Table 7 would occur.
Table 7. Optimizing the use of recycled aggregates.
Aggregates for New Construction and Maintenance (Cubic Meters)—NA30% of RA (Cubic Meters)Total Demand of NA
Homogeneous ZoneViabilityViabilityViability
Cagliari938,8981,363,31140,89395,418
Sant’antioco265,101319,11895,735223,383
Tortolì214,047542,976162,893380,083
Total 299,522698,884
In other words, a saving of NA equal to about 300,000 cubic meters—that would be replaced by RA, not necessarily coming from a local basin—could be experienced, thereby breaking the insularity that has always characterized aggregates.

5. Conclusions

Resource conservation is a national effort to conserve energy and other resources and reduce greenhouse gas emissions by managing materials more efficiently. Industrial materials recycling (IMR) helps accomplish these goals by conserving natural resources and decreasing energy use and greenhouse gas emissions. The authors estimated and evaluated the demand for natural and recycled aggregates, and focused on the correlation between implementation of the UMP and its demand for building materials, which is little discussed in the literature.
This document reviewed the current literature on the relationship between the aggregate materials demand and urban planning, in order to analyse the Italian situation and, in particular, the Sardinian Region condition, which is a special case due to its insularity. In this regard, this paper shows how the assessment of demand for aggregates, linked to the implementation of the UMP, can provide insight into the definition of the urban form and planning process. In fact, the urban case studies of Cagliari, Sant’Antioco and Tortolì, which are representative of the remaining urban areas in Sardinia, confirmed that the historic areas (A zone) require lower quantities of aggregates, compared to the surroundings residential expansion (C zone) and tourism (F zone). The case study of Cagliari is emblematic of demand in the A zone, equal to about 5522 thousand cubic meters, compared to 31 million cubic meters for the remaining B and C zones.
The authors have shown that compact and dispersed city forms are associated with different per capita demands for aggregates. Low demand per capita is associated with a compact urban form. The relationships identified above show that we have the opportunity to quantitatively orient the urban form, by defining the achievable Da-max (UMP), for every UMP.
Furthermore, the proposed approach allows full control of land use resulting from the municipal development plan, in accordance with international requirements of the Europe 2020 Strategy.
This methodological approach to the evaluation of the demand for natural aggregates associated with the UMP is also consistent in today’s national [49] and international [50] debate. The correlation with mining, arising from building activities and the urban planning sector, can no longer be ignored or neglected. Strategic objectives must be pursued to address these issues. Finding the point of balance between the form of the city and the delayed impact—that the same city generates in order to be implemented—is the key to this work. In addition, introducing the compulsory use of RA, at least for minor works, is a realistic possibility.
In addition, the control of the ecological footprint of aggregate mining through urban spatial planning constitutes a new approach to pursuing strategic objectives for environmental sustainability that is repeatable in national and international contexts.

Acknowledgments

This study is supported by the Autonomous Regions of Sardinia (Regione Autonoma della Sardegna, RAS) through a project entitled The recovery of inert waste for the packaging of recycled aggregates to be used in concrete. Experiments and applications in the provinces of Cagliari and Carbonia-Iglesias. This project is financed through the “Sardinia PO FSE 2007–2013” funds and provided according to the L.R. 7/2007 for the “Promotion of the Scientific Research and of the Technological Innovation in Sardinia”. We authorize the RAS to reproduce and distribute reprints for Governmental purposes notwithstanding any copyright notation thereon. Any opinions, findings and conclusions or recommendations expressed in this material are those of the authors and do not necessarily reflect the views of the RAS.

Author Contributions

This paper is the result of the joint work of the authors. In particular, Ginevra Balletto wrote Section 1, Section 2 and Section 4.2; Giovanni Mei wrote Section 3; and Chiara Garau wrote Section 4, Section 4.1 and Section 5.

Conflicts of Interest

The authors declare no conflict of interest.

Glossary

Construction and Demolition Waste (CDW): Unwanted material produced directly or incidentally by the construction industry. This includes building materials such as aggregates, many of which can be recycled.
Gross Domestic Product (GDP) (prodotto interno lordo (PIL)): The value of everything a country produces. The size of a country’s PIL is very important in assessing the health of an economy.
Green Public Procurement (GPP): An environmental policy tool that aims to encourage voluntary development of a market for products and services with reduced environmental impact through the leverage of public demand. Public authorities that undertake GPP streamline purchasing and consumption increase the environmental quality of their supplies and credit lines (The handbook: Buying Green—http://ec.europa.eu/environment/gpp/pdf/handbook.pdf).
Model of the Environmental Declaration (MUD) (Modello Unico di Dichiarazione Ambientale): A collection of statements, presented annually by different actors such as landfills, waste producers and transporters.
Natural aggregate (NA):The component of a composite material that resists compressive stress and provides bulk to the composite material (e.g., the particles of stone used to make concrete typically include both sand and gravel). For efficient filling, aggregate should be much smaller than the finished item, but have a wide variety of sizes.
Regional Plan of Waste Management Special Sardinia (PRRS)(Piano Regionale dei Rifiuti Speciali): The document represents a major updating of the document "Section Special waste" approved by resolution No. 13/34 of 30/04/02. It is the result of a thorough analysis of the current situation of the installation and logistics of the regional system of treatment of this category of waste and is aimed, above all, at a further determination of the needs and to plant more incentive for its recovery, with regard to the general guidelines set by the EU and national legislation.
Recycled Aggregate (RA): A broad category of coarse particulate material used in construction, including sand, gravel, crushed stone, slag, recycled concrete and geosynthetic aggregates. Aggregates are the most mined materials in the world. Aggregates are a component of composite materials such as concrete and asphalt concrete; the aggregate serves as reinforcement to add strength to the overall composite material.
Strategic Environmental Assessment (SEA): A fundamental tool that supports decision-making processes that characterizes the urban masterplan document. (Directive 2001/42/CE- D.G.R. n. 8/1563 del 22/12/2005).
Territorial Indices (TI): The ratio between the manufacturable volume, expressed in cubic meters, and the land area, measured in square meters.
Territorial Surface (TS): Surface area including the areas earmarked for development in public use sectors. It considers areas of primary and secondary urbanization, including roads.
Urban Masterplan (UMP): A complex planning tool owned by a city that regulates and protects the urban and territorial processes of transformation, in accordance with the Italian National Law no. 1942/1150. This tool has a relevance of at least one decade. Every Italian municipality, from small village to sprawling municipality, can have an urban masterplan. Small communities will hire a private planning firm to prepare a plan and submit it to the local government for approval. In larger cities or metropolises, the city administrative planning sector prepares the urban masterplan.

References and Notes

  1. Pavan, V. Quarry Architecture; Faenzaindustrie Grafiche: Faenza (RA), Italy, 2010. [Google Scholar]
  2. Gisotti, G. Le Cave. Recupero e Pianificazione Ambientale (Quarries. Recovery and environmental planning); Dario Flaccovio Editore: Palermo, Italy, 2008. (In Italian) [Google Scholar]
  3. Nautiyal, H.; Shree, V.; Khurana, S.; Kumar, N. Recycling Potential of Building Materials: A Review. In Environmental Implications of Recycling and Recycled Products; Springer: Singapore, 2015; pp. 31–50. [Google Scholar]
  4. UEPG (European Aggregates Association). Annual Review 2011–2012; UEPG Aisbl: Brussels, Belgium, 2012; Available online: http://www.uepg.eu (accessed on 30 January 2015).
  5. Furcas, C.; Balletto, G. Effects of quarrying activity and the construction sector on environmental sustainability. A brief report on the rapid growth of emerging Central and Eastern European States. Diam. Appl. Tecnol. 2012, 70, 74–81. [Google Scholar]
  6. Pani, L.; Francesconi, L. Influence of Replacement Percentage of Recycled Aggregates on Recycled Aggregate Concrete Properties. In Proceedings of the Fib Symposium, Prague, Czech Republic, 8–10 June 2011.
  7. Ding, T.; Xiao, J. Estimation of building-related construction and demolition waste in Shanghai. Waste Manag. 2014, 34, 2327–2334. [Google Scholar] [CrossRef] [PubMed]
  8. European Parliament, Policy Department Economy and Science DG Internal Policies. Impact Assessment of Recycling Targets in the Waste Framework Directive (IP/A/ALL/FWC/2006-105/Lot4/C1/SC3). Available online: http://www.pedz.uni-mannheim.de/daten/edz-ma/ep/08/EST21011.pdf (accessed on 9 November 2015).
  9. European Parliament and Council. Directive 2008/98/EC on Waste. Available online: http://ec.europa.eu/environment/waste/framework/ (accessed on 30 Novermber 2015).
  10. Spies, S. German Technical Cooperation. 3R in Construction and Demolition Waste (CDW), potentials and constraints. In Proceedings of the Inaugural Meeting of the Regional 3R Forum in Asia, Tokyo, Japan, 11–12 November 2009; Available online: www.uncrd.or.jp (accessed on 15 September 2015).
  11. Autonomous Region of Sardinia (Regione Autonoma della Sardegna—RAS, 2012). Available online: http://www.regione.sardegna.it (accessed on 30 August 2015).
  12. This broader work (called Recovery of inert waste in recycled aggregates for use in concrete) is divided into two main lines of research. The first has a technical character and deals with the evaluation of the mechanical, physical and chemical properties of the RA in some urban masterplans of Sardinia. The second aims to investigate the consequences of the containment requirements of aggregates (NA) and of the recycling of CDW for the production of RA in some municipalities of Sardinia. This document will explain the first results of the second line of intervention.
  13. The urban masterplan (UMP)is a complex planning tool owned by a city that regulates and protects the urban and territorial processes of transformation, in accordance with the Italian National Law No. 1942/1150. This tool has a valence of at least one decade.
  14. Wu, H.; Wang, J.; Duan, H.; Ouyang, L.; Huang, W.; Zuo, J. An innovative approach to managing demolition waste via GIS (geographic information system): A case study in Shenzhen city, China. J. Clean. Prod. 2015, 99, 1–10. [Google Scholar] [CrossRef]
  15. Horvath, A. Construction materials and the environment. Annu. Rev. Environ. Resour. 2004, 29, 181–204. [Google Scholar] [CrossRef]
  16. Chau, C.K.; Yik, F.W.H.; Hui, W.K.; Liu, H.C.; Yu, H.K. Environmental impacts of building materials and building services components for commercial buildings in Hong Kong. J. Clean. Prod. 2007, 15, 1840–1851. [Google Scholar] [CrossRef]
  17. Bribián, I.Z.; Capilla, A.V.; Usón, A.A. Life cycle assessment of building materials: Comparative analysis of energy and environmental impacts and evaluation of the eco-efficiency improvement potential. Build. Environ. 2011, 46, 1133–1140. [Google Scholar] [CrossRef]
  18. Tam, V.W.; Zuo, J.; Zhu, J. Designers’ attitude and behaviour towards construction waste minimization by design: A study in Shenzhen, China. Resour. Conserv. Recycl. 2015, 105, 29–35. [Google Scholar]
  19. RAS (Autonomous Region of Sardinia). Regional Waste Management Plan (Piano Regionale Gestione Rifiuti); Oikosprogetti: Milano, Italy, 2008. (In Italian) [Google Scholar]
  20. Regional Plan of Extractive Activities (Piano Regionale Attività Estrattive). Available online: https://www.regione.sardegna.it/documenti/1_82_20080627104231.pdf (accessed on 30 November 2015).
  21. Varghese, P.C. Building Materials; PHI Learning Pvt. Ltd.: Delhi, India, 2015. [Google Scholar]
  22. Competitiveness Report on the Productive Sectors (Rapporto sulla competitività dei settori produttivi) ISTAT. 2013. Available online: http://www.istat.it/it/files/2013/02/Rapporto-competitivit%C3%A0.pdf (accessed on 29 September 2015).
  23. Balletto, G.; Naitza, S.; Mei, G.; Furcas, C. Compromise between mining activities and reuse of recycled aggregates for development of sustainable local planning. Available online: http://www.seekdl.org/nm.php?id=6135 (accessed on 30 November 2015).
  24. The Numbers, the Regulatory Framework, the Point on the Economic and Environmental Impact of Mining in the Italian Territory (Rapporto Cave 2014. I Numeri, il Quadro Normativo, il Punto Sull’impatto Economico e Ambientale Dell’attività Estrattiva nel Territorio Italiano). Available online: http://www.legambiente.it/sites/default/files/docs/rapporto_cave_2014_web_2.pdf (accessed on 9 November 2015). (In Italian)
  25. Hesse, M. Cities, material flows and the geography of spatial interaction: Urban places in the system of chains. Glob. Netw. 2010, 10, 75–91. [Google Scholar] [CrossRef]
  26. AITEC (Associazione Italiana Tecnico Economica Cemento). Relazione Annuale 2013. Available online: http://www.aitecweb.com/Portals/0/pub/Repository/Area%20Economica/Pubblicazioni%20AITEC/Relazione_annuale_2013.pdf (accessed on 9 November 2015).
  27. Endl, A.; Berger, G. Sustainable raw materials management: A perspective on stakeholders roles and policy strategies. In Proceedings of the 2nd Symposium for Urban Mining, Bergamo, Italien, 19–21 May 2014.
  28. AITEC (Associazione Italiana Tecnico Economica Cemento). Relazione Annuale 2014. Available online: http://www.aitecweb.com/Portals/0/pub/Repository/Area%20Economica/Pubblicazioni%20AITEC/Relazione_Annuale_2014.pdf(accessed (accessed on 9 November 2015).
  29. Jaeger, J.A.G.; Soukup, T.; Madriñán, L.F.; Schwick, C.; Kienast, F. Landscape Fragmentation in Europe; European Environment Agency: Copenhagen, Denmark, 2011. [Google Scholar]
  30. Data from this instrument refer to the statement Model of the Environmental Declaration (Modello singolo di Dichiarazione Ambientale (MUD)) of 2009, which collects 2008 data (Law 70/94).
  31. The Model of the Environmental Declaration (Modello singolo di Dichiarazione Ambientale (MUD)) identifies a whole set of statements, presented annually by different actors such as landfills, waste producers and transporters.
  32. Regional Special Waste Plan (il Piano Regionale dei Rifiuti Speciali). Sardegna, Italy, 2008. Available online: http://www.regione.sardegna.it/documenti/1_106_20120423163058.pdf (accessed on 2 September 2015).
  33. Author’s elaborations on Data of [24].
  34. Pani, L.; Balletto, G.; Naitza, S.; Francesconi, L.; Trulli, N.; Mei, G.; Furcas, C. Evaluation of mechanical, physical and chemical properties of recycled aggregates for structural concrete. In Proceedings of the 14th International Waste Management and Landfill Symposium, Sardinia, Italy, 30 September–4 October 2013; CISA Publisher: Cagliari, Italy, 2013. [Google Scholar]
  35. Badino, V.; Blengini, G.A.; Garbarino, E. Technical analysis—Environmental—Economic aggregates for the construction industry in Italy. Part 2. Needs estimation (Analisi tecnico—Economico—Ambientale degli aggregati per l’industria delle costruzioni in Italia. Parte 2. La stima dei fabbisogni). Geam 2006, 3, 5–16. [Google Scholar]
  36. In reality this condition does not always come true, and actions by the UMP may be modified or delay and cover much longer periods of time.
  37. Zoppi, C.; Argiolas, M.; Lai, S. Factors influencing the value of houses: Estimates for the city of Cagliari, Italy. Land Use Policy 2015, 42, 367–380. [Google Scholar] [CrossRef]
  38. Balletto, G. A Cura di, La Pianificazione Sostenibile Delle Risorse (Sustainable planning of environmental resources); Franco Angeli: Milano, Italy, 2005. [Google Scholar]
  39. Pauleit, S.; Duhme, F. Assessing the environmental performance of land cover types for urban planning. Landsc. Urban Plan. 2000, 52, 1–20. [Google Scholar] [CrossRef]
  40. Drew, L.J.; Langer, W.H.; Sachs, J.S. Environmentalism and natural aggregate mining. Nat. Resour. Res. 2002, 11, 19–28. [Google Scholar] [CrossRef]
  41. Balletto, G.; Naitza, S.; Mei, G.; Furcas, C. Compromise between mining activities and reuse of recycled aggregates for development of sustainable local planning. (Sardinia). In Proceedings of the 3rd Intnational Conference on Advances in Civil, Structural and Mechanical Engineering—CSM, Birmingham, UK, 26–27 April 2015; pp. 136–142.
  42. TI (territorial index—Cubic meters/sqm) = It is the ratio of the volume (V) maximum achievable in a given area and the territorial surface (TS) of the zone.
  43. Vaccaro, V. Energia nel paesaggio: Sistemi di produzione di energia elettrica da fonte rinnovabile a Pantelleria (Energy in the landscape: Systems of electricity production from renewable sources in Pantelleria). In A cura di, Atlante Delle Smart City; Riva Sanseverino, E., Riva Sanseverino, R., Vaccaro, V., Eds.; Franco Angeli: Milano, Italy, 2015; pp. 283–308. [Google Scholar]
  44. Bressi, G.; Volpe, G.; Pavesi, E. La produzione di aggregati riciclati da rifiuti inerti. I manuali di SARMa. In The Production of Recycled Aggregates from Inert Waste. The Manuals of SARMa; Centro Stampa Regione Emilia-Romagna: Bologna, Italy, 2011; Available online: http://www.sarmaproject.eu/index.php?id=1964 (accessed on 15 September 2015).
  45. It should be specified that the situation observed in the municipalities of Cagliari, Sant’Antioco and Tortolì (but likewise also for all the remaining 362 municipalities of Sardinia) is mainly due to the regional legislation (Decree of 22 December 1983 No. 2266/U—Called also “Floris” Decree), and to the national legislation (ministerial decree April 2, 1968, n. 1444). In particular the aforementioned regional law establishes for C zones a TImax (cubic m/sqm) equal to 1 for municipalities up to 10,000 inhabitants and a TImax (cubic m/sqm) of 1.5 for municipalities with more than 10,000 inhabitants.
  46. General Report of the Regional Plan of Extractive Activities (Piano Regionale Attività Estrattive). Available online: http://www.regione.sardegna.it/documenti/1_82_20080110174612.pdf (accessed on 11 November 2015).
  47. Ministry of Environment Guidelines for operation in the construction industry, road and environment, according to DM 08/05/2003, 203, OJ of 25.07.2005 n. 171.
  48. Bouwer, M.; Jonk, M.; Berman, T.; Bersani, R.; Lusser, H.; Nappa, V. Green Public Procurement in Europe 2006: Conclusions and Recommendations. 2006. Available online: http://ec.europa.eu/environment/gpp/pdf/take_5.pdf (accessed on 20 September 2015).
  49. In particular, we mention the following Draft law emerged in 2014 from the national debate “Containment of land consumption and reuse of soil built” (Contenimento del consumo del suolo e riuso del suolo edificato).
  50. We refer to BREEAM (BRE Environmental Assessment Method or “methodology of the BRE Environmental Assessment”). It is the first and most widely used environmental assessment protocol in the world. BREEAM was born in London, for the Olympics of 2012 and establishes the evaluation criteria used to represent the environmental performance of a building. Available online: http://www.breeam.org/about.jsp?id=66 (accessed on 15 September 2015).

