
Quantitative Assessment of the Human Appropriation of Net Primary Production (HANPP) in the Coastal Areas of Jiangsu, China

Abstract
:
1. Introduction
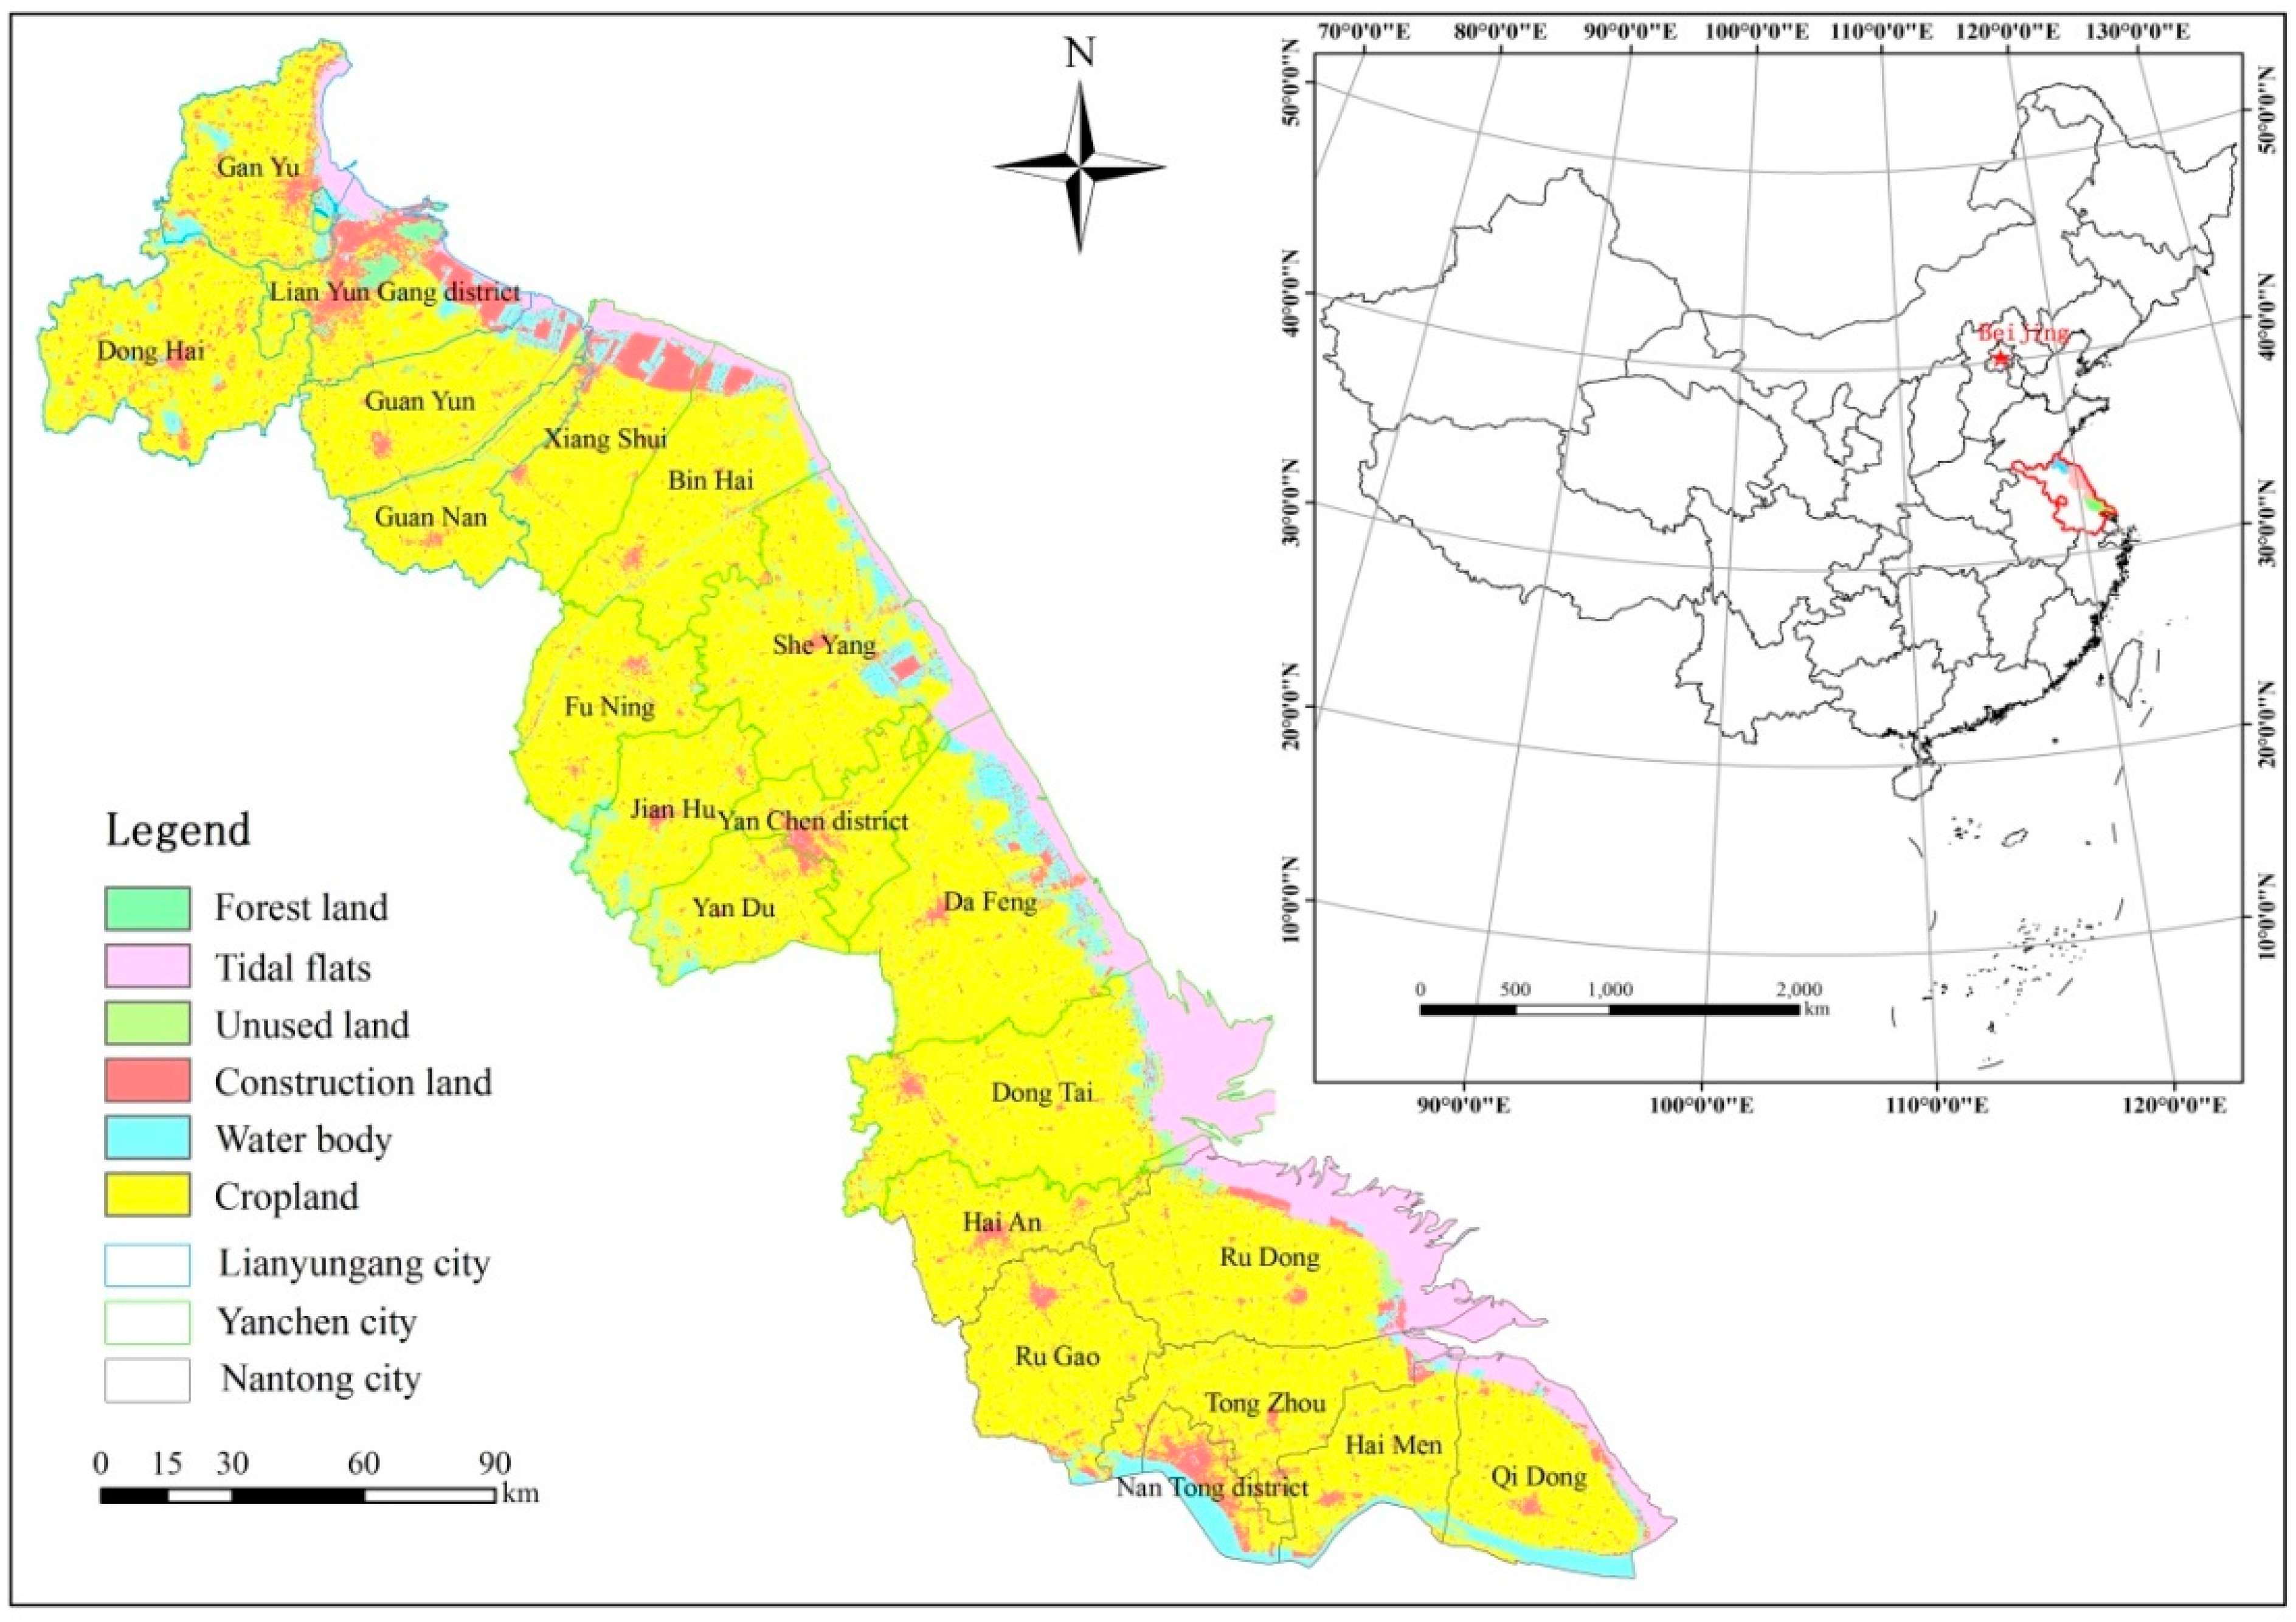
2. Materials and Methods
2.1. Definition and Calculation of HANPP
2.2. Estimation of HANPPharv

| Crops, Product | Residue: Economic Product Ratio Riry | Dry Matter Fraction (%) | Carbon Fraction | |
|---|---|---|---|---|
| Ficy | Ficr | |||
| Wheat, grain | 1.38 | 87 | 0.39 | 0.49 |
| Barley, grain | 1.04 | 86.5 | 0.39 | 0.49 |
| Broad bean, bean | 1.17 | 87.5 | 0.40 | 0.45 |
| Pea, bean | 1.17 | 87.5 | 0.40 | 0.45 |
| Rice, grain | 1.04 | 88 | 0.38 | 0.42 |
| Maize, grain | 1.00 | 83.5 | 0.39 | 0.47 |
| Soybean, bean | 1.38 | 87.5 | 0.40 | 0.45 |
| Potatoes, tuber | 0.53 | 20 | 0.39 | 0.42 |
| Peanut, tuber | 1.26 | 88.5 | 0.38 | 0.38 |
| Rapeseed, seed | 2.85 | 90 | 0.42 | 0.45 |
| Sesame, seed | 2.01 | 85 | 0.40 | 0.45 |
| Cotton, unginned | 2.61 | 91 | 0.40 | 0.39 |
2.3. Estimation of NPPpot and NPPact
2.4. Statistical Analysis
2.4.1. Trend Analysis
2.4.2. Correlation Analysis
3. Results
3.1. NPPpot and NPPact
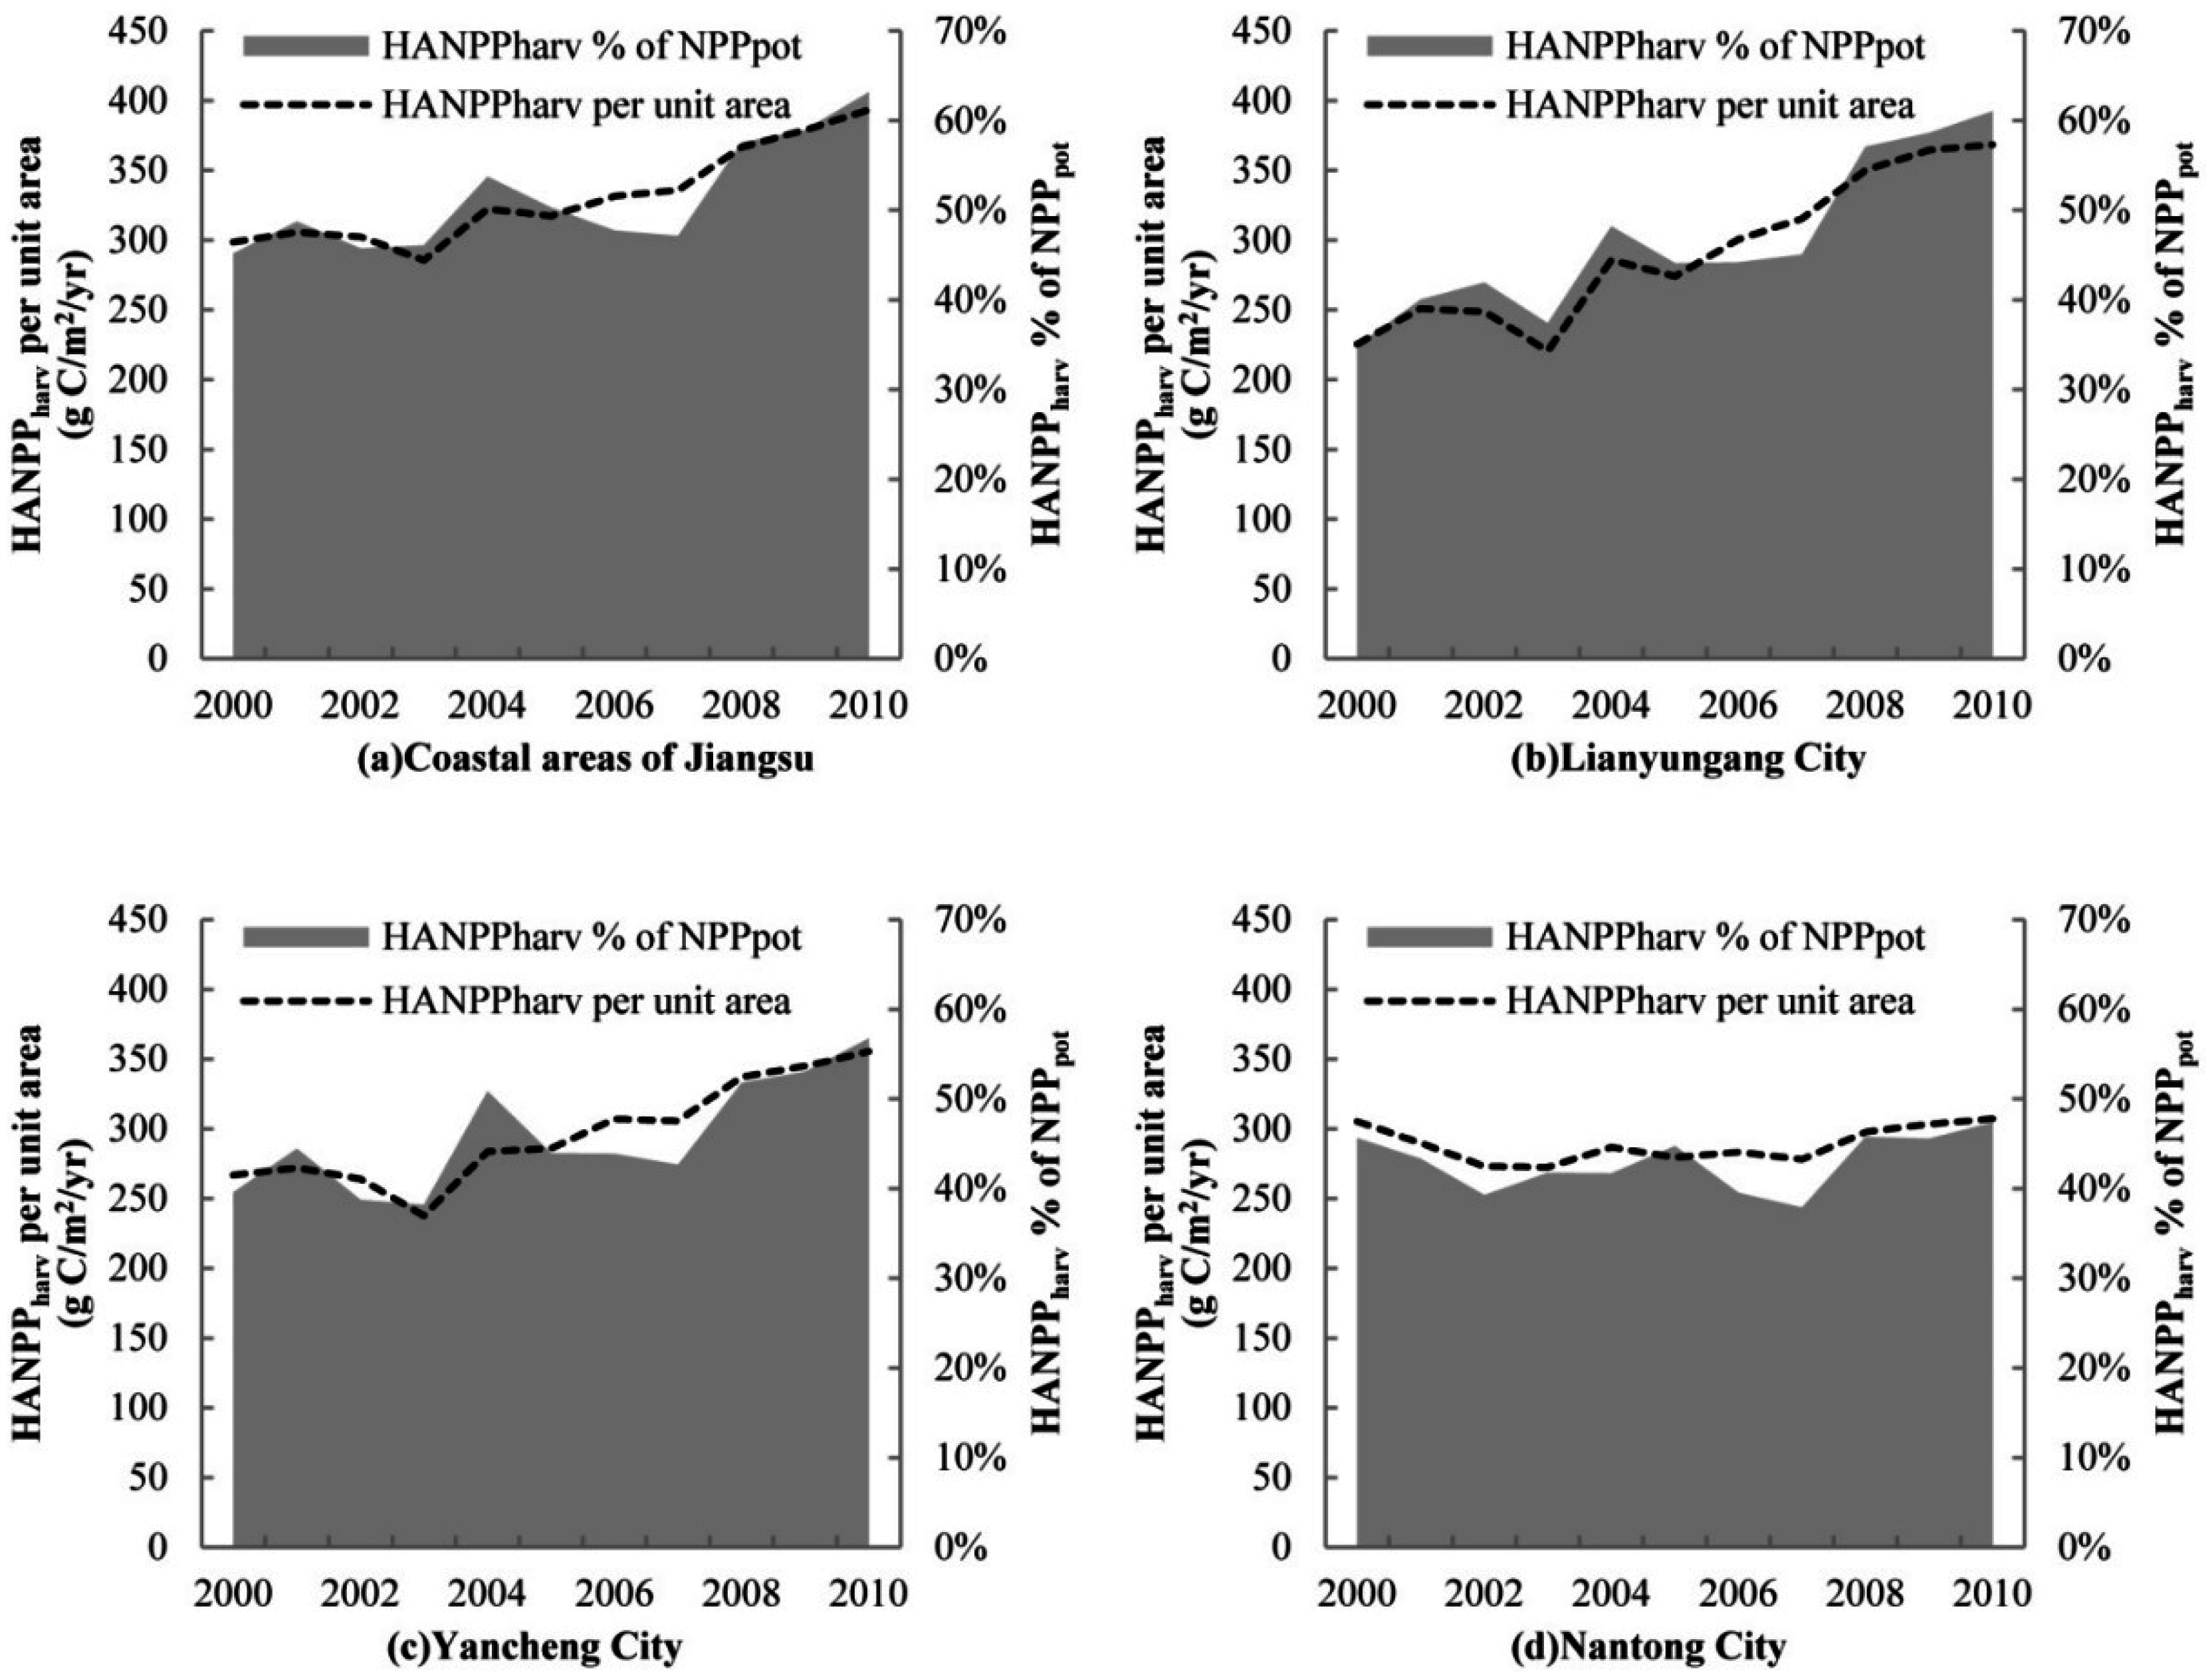
3.2. HANPPharv

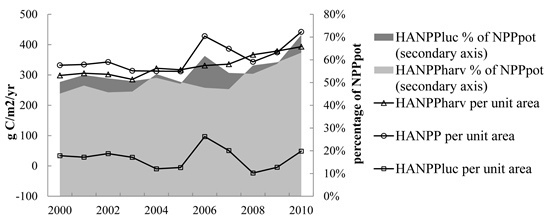
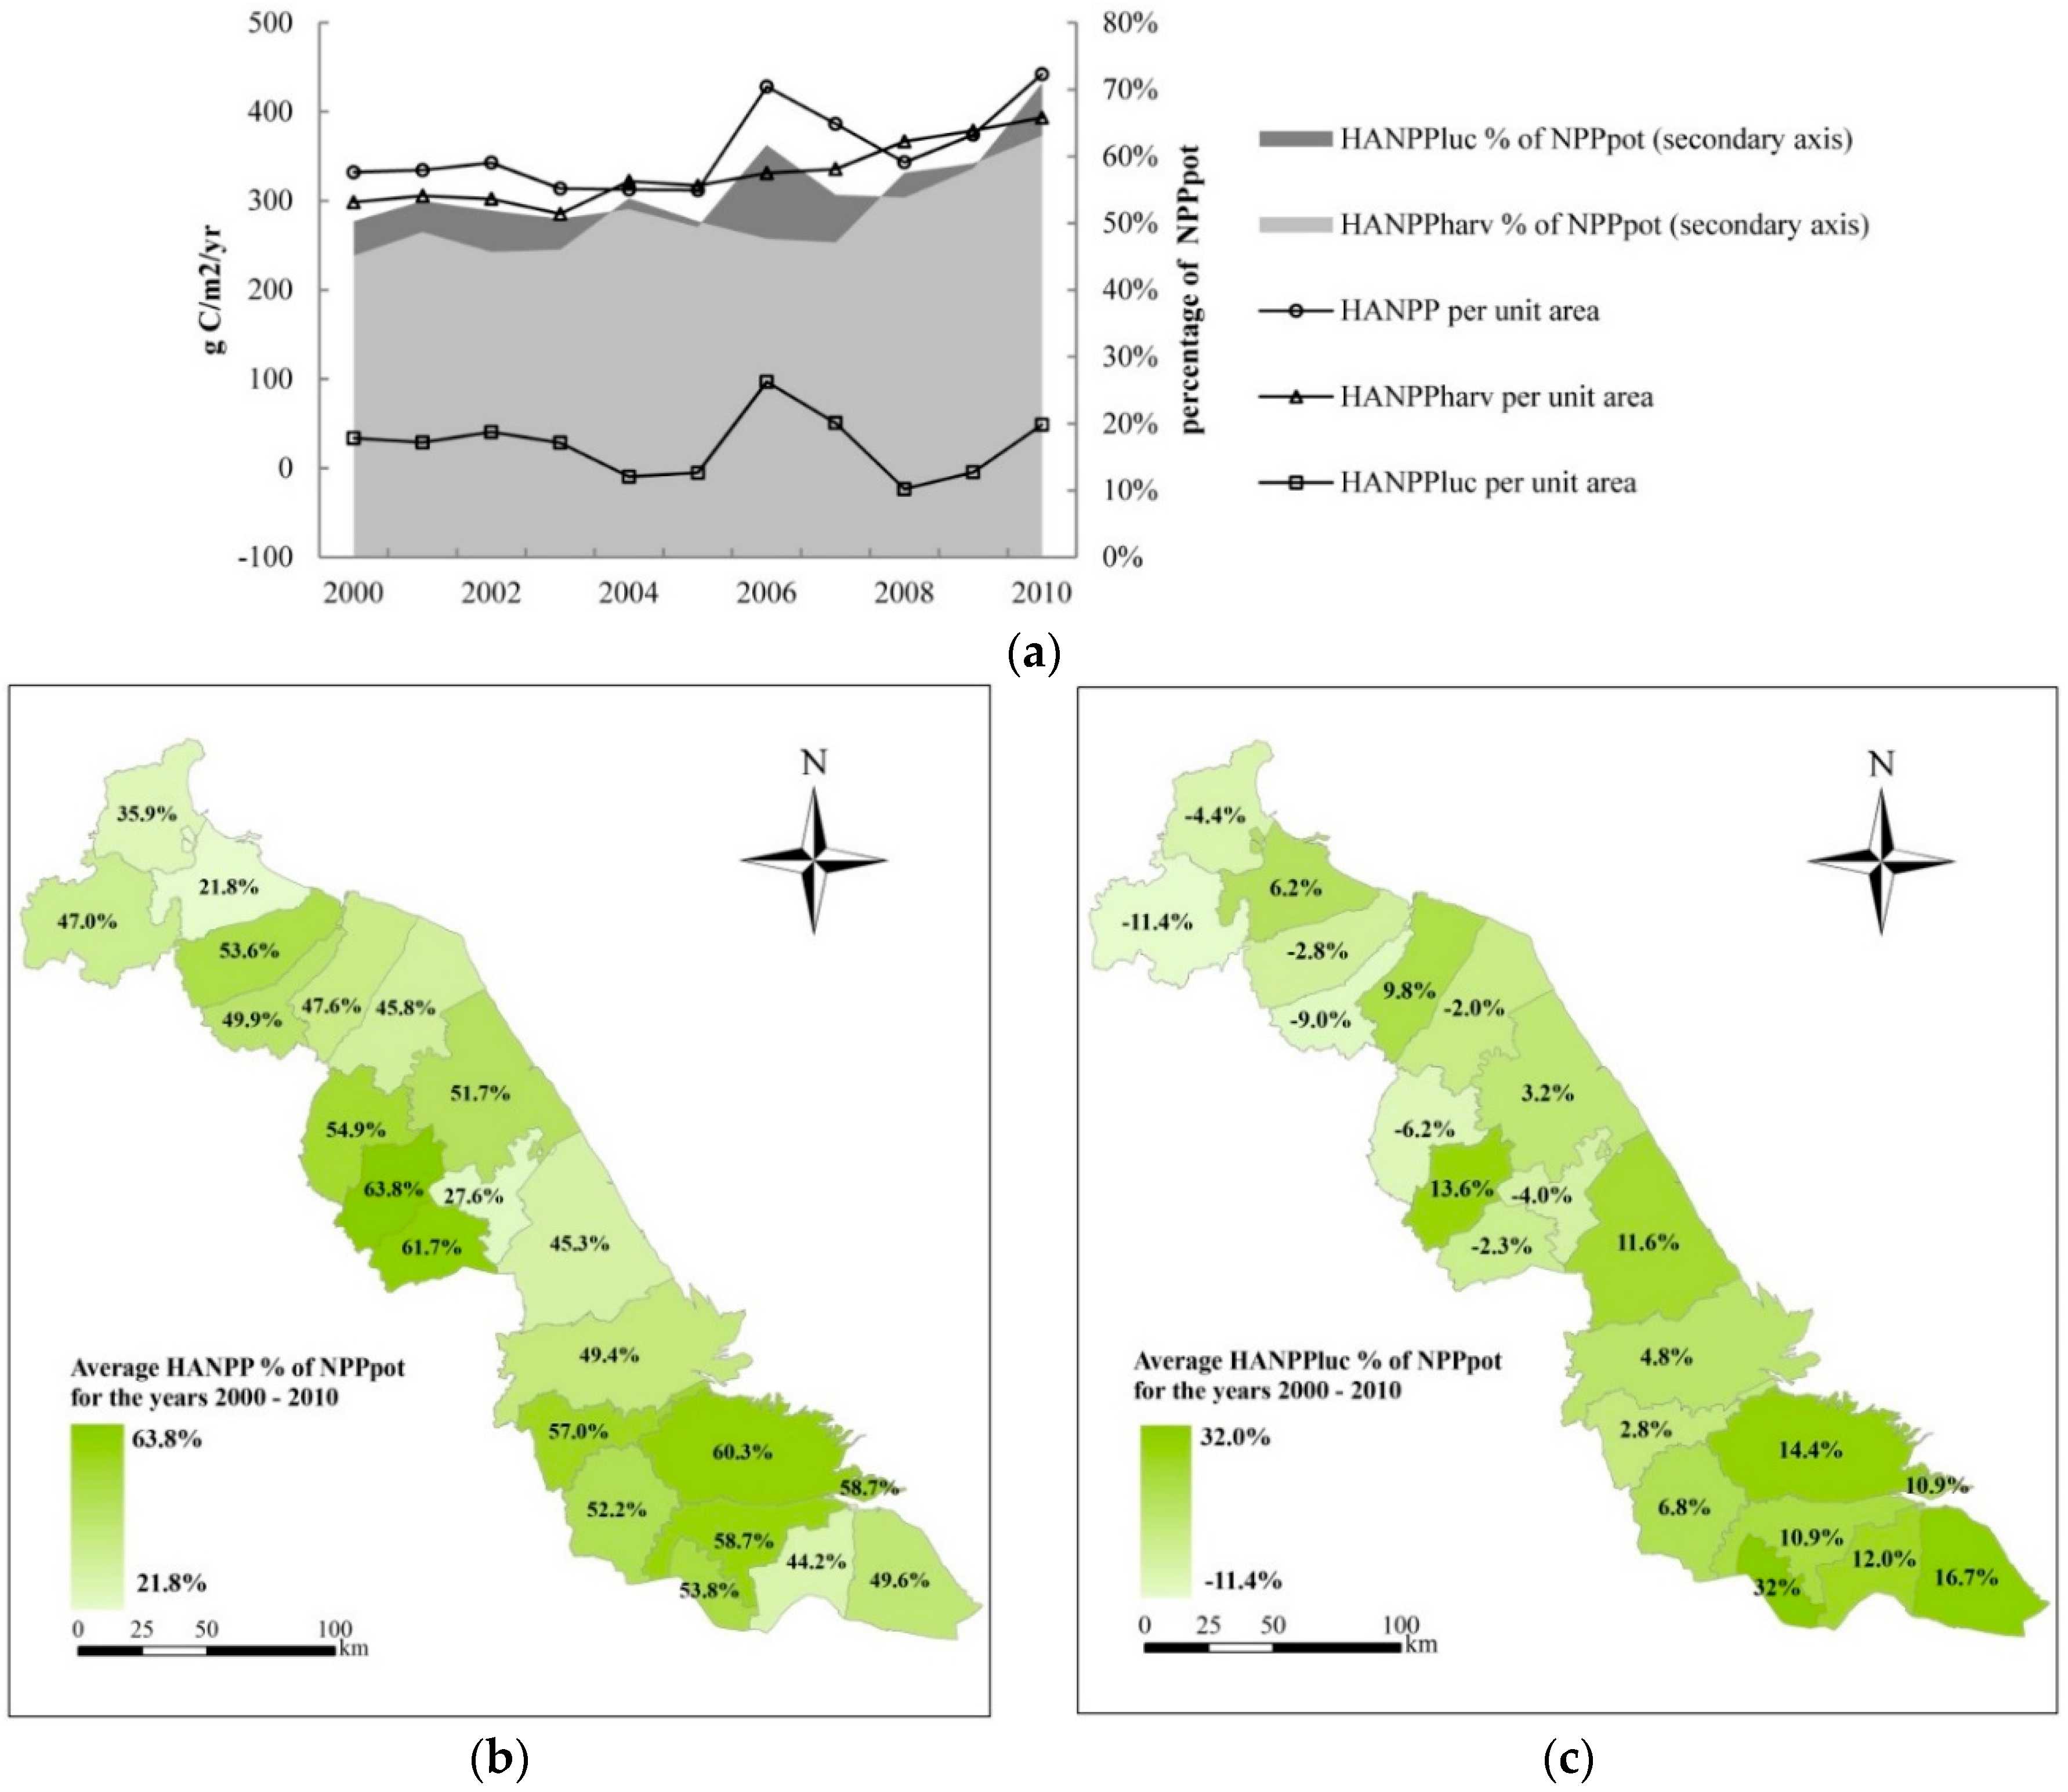
3.3. HANPP

4. Discussion
4.1. Comparison with Previous Studies
| References | Study Scale | Year | HANPP% of NPPpot |
|---|---|---|---|
| Vitousek [9] | Global | 1970s | 30.7(3.8–38.8) |
| Rojstaczer [32] | Global | 1980s–1990s | 32(10-55) |
| Imhoff [10] | Global | 1995 | 20.3(14.1–26.07) |
| Haberl [33] | Global | 2000 | 23.8 |
| Ma et al. [34] | Global | 2000 | 28 |
| Haberl [35] | Austria | 1950–1995 | 50 |
| Musel [36] | United Kingdom | 1800–2000 | 71–68 |
| Kastner [37] | Philippines | 1910–2003 | 35–62 |
| Schwarzlmüller [38] | Spain | 1955–2003 | 67–61 |
| Kohlheb and Krausmann [39] | Hungary | 1961–2005 | 67–49 |
| Niedertscheider [40] | South Africa | 1961–2006 | 21–25 |
| Niedertscheider [41] | Italy | 1884–2007 | 78–56 |
| Fetzel et al. [42] | New Zealand | 1860–2005 | 34–32 |
| Vackar and Orlitova [43] | Czech Republic | 2006 | 56 |
| Chen et al. [8] | China | 2001–2010 | 49.5–57.8 |
| O’Neill [44] | Nova Scotia (Canada) | 1999–2003 | 25.5 |
| This study | Coastal areas of Jiangsu (China) | 2000–2010 | 50.3–71.0 |
4.2. Influence of Climate Conditions on HANPP
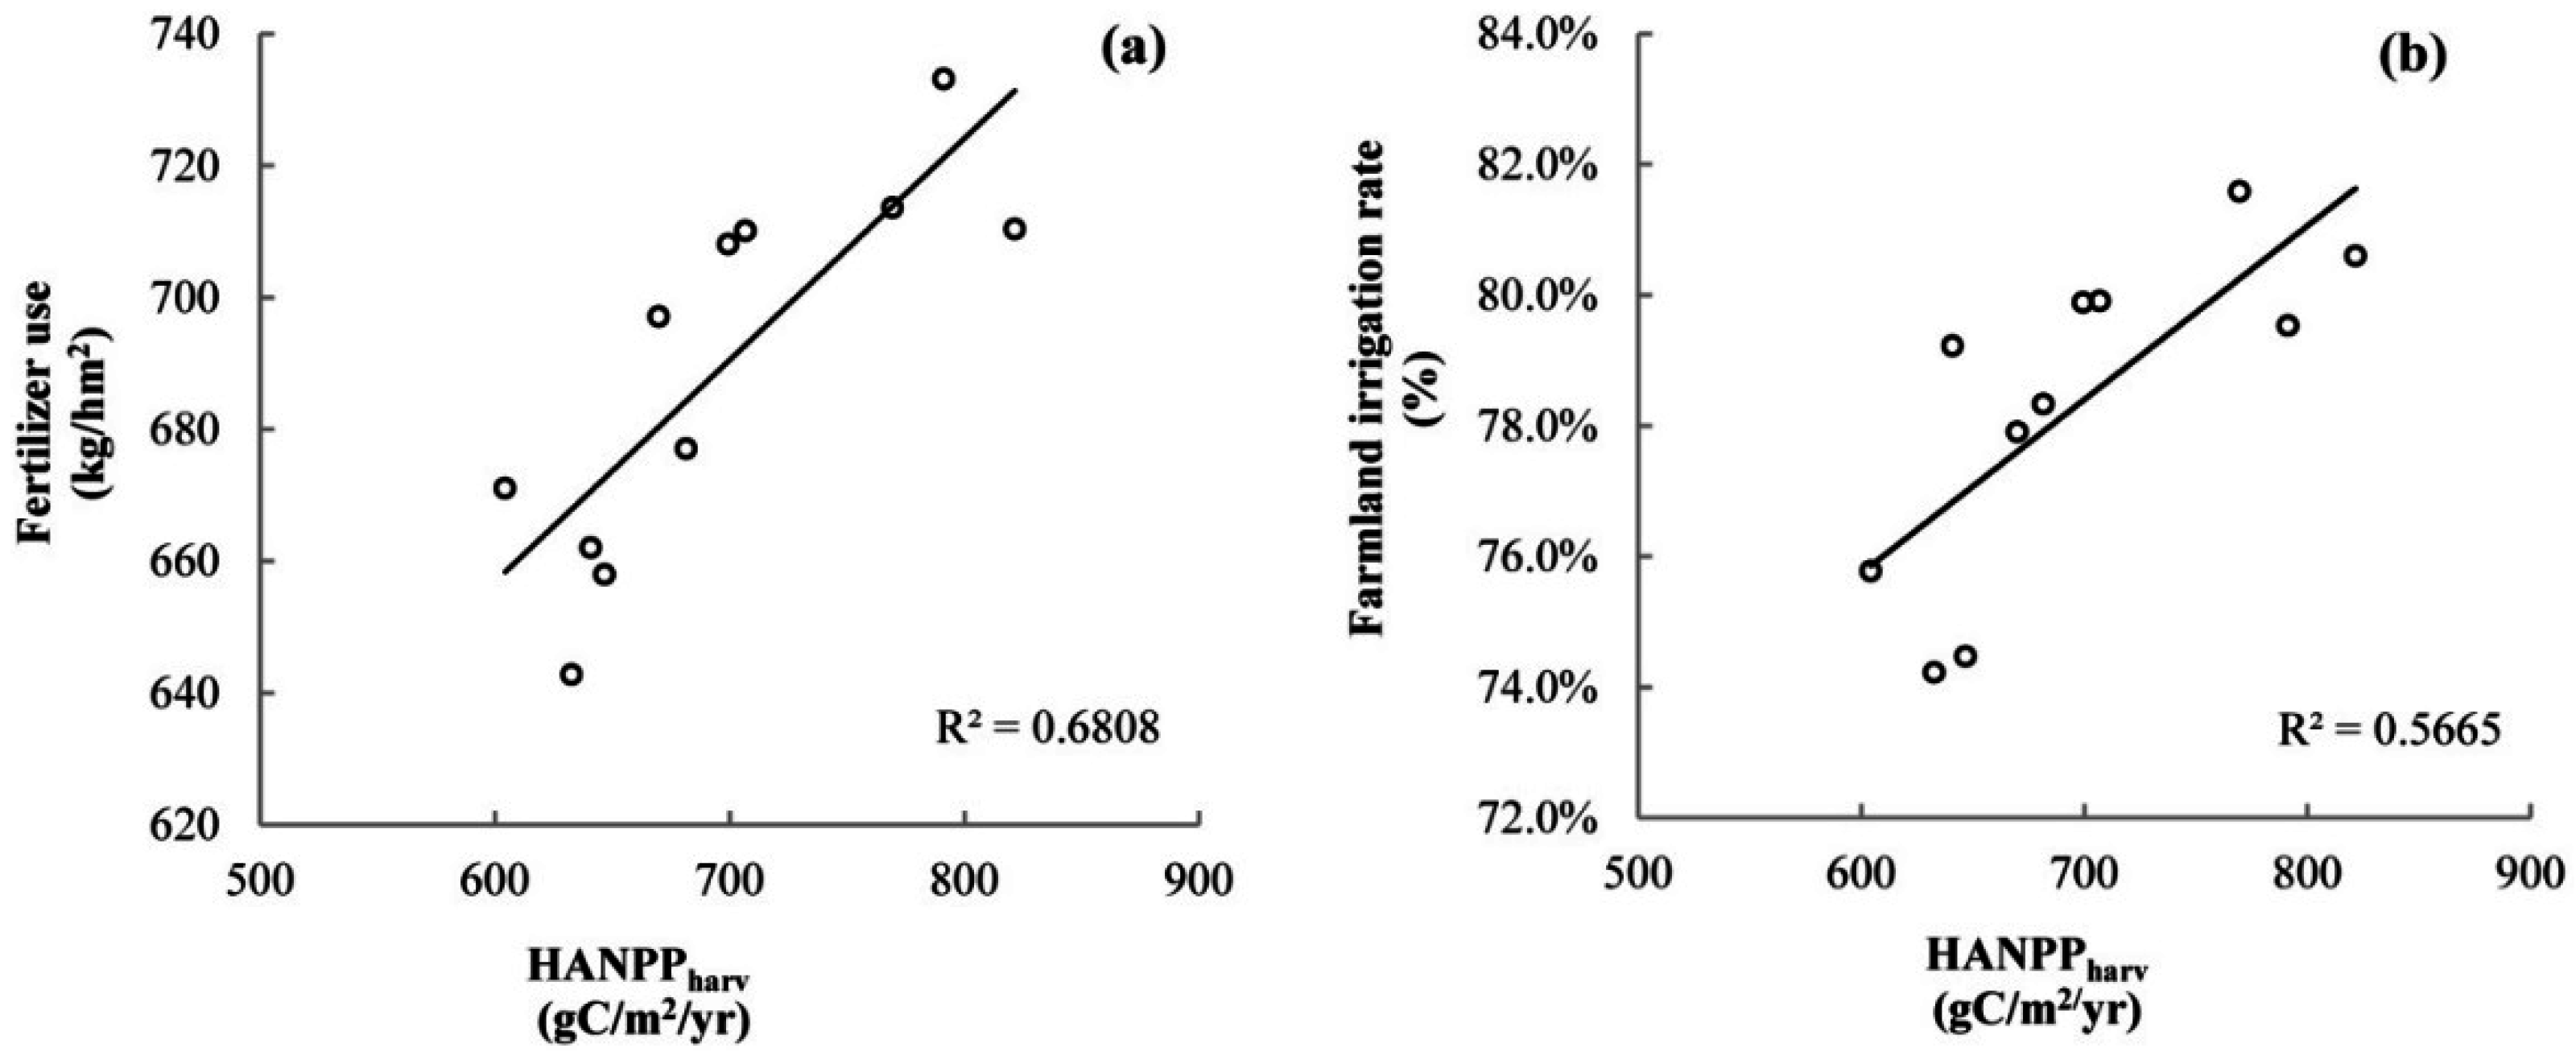
4.3. Influence of Agricultural Production Conditions on HANPP

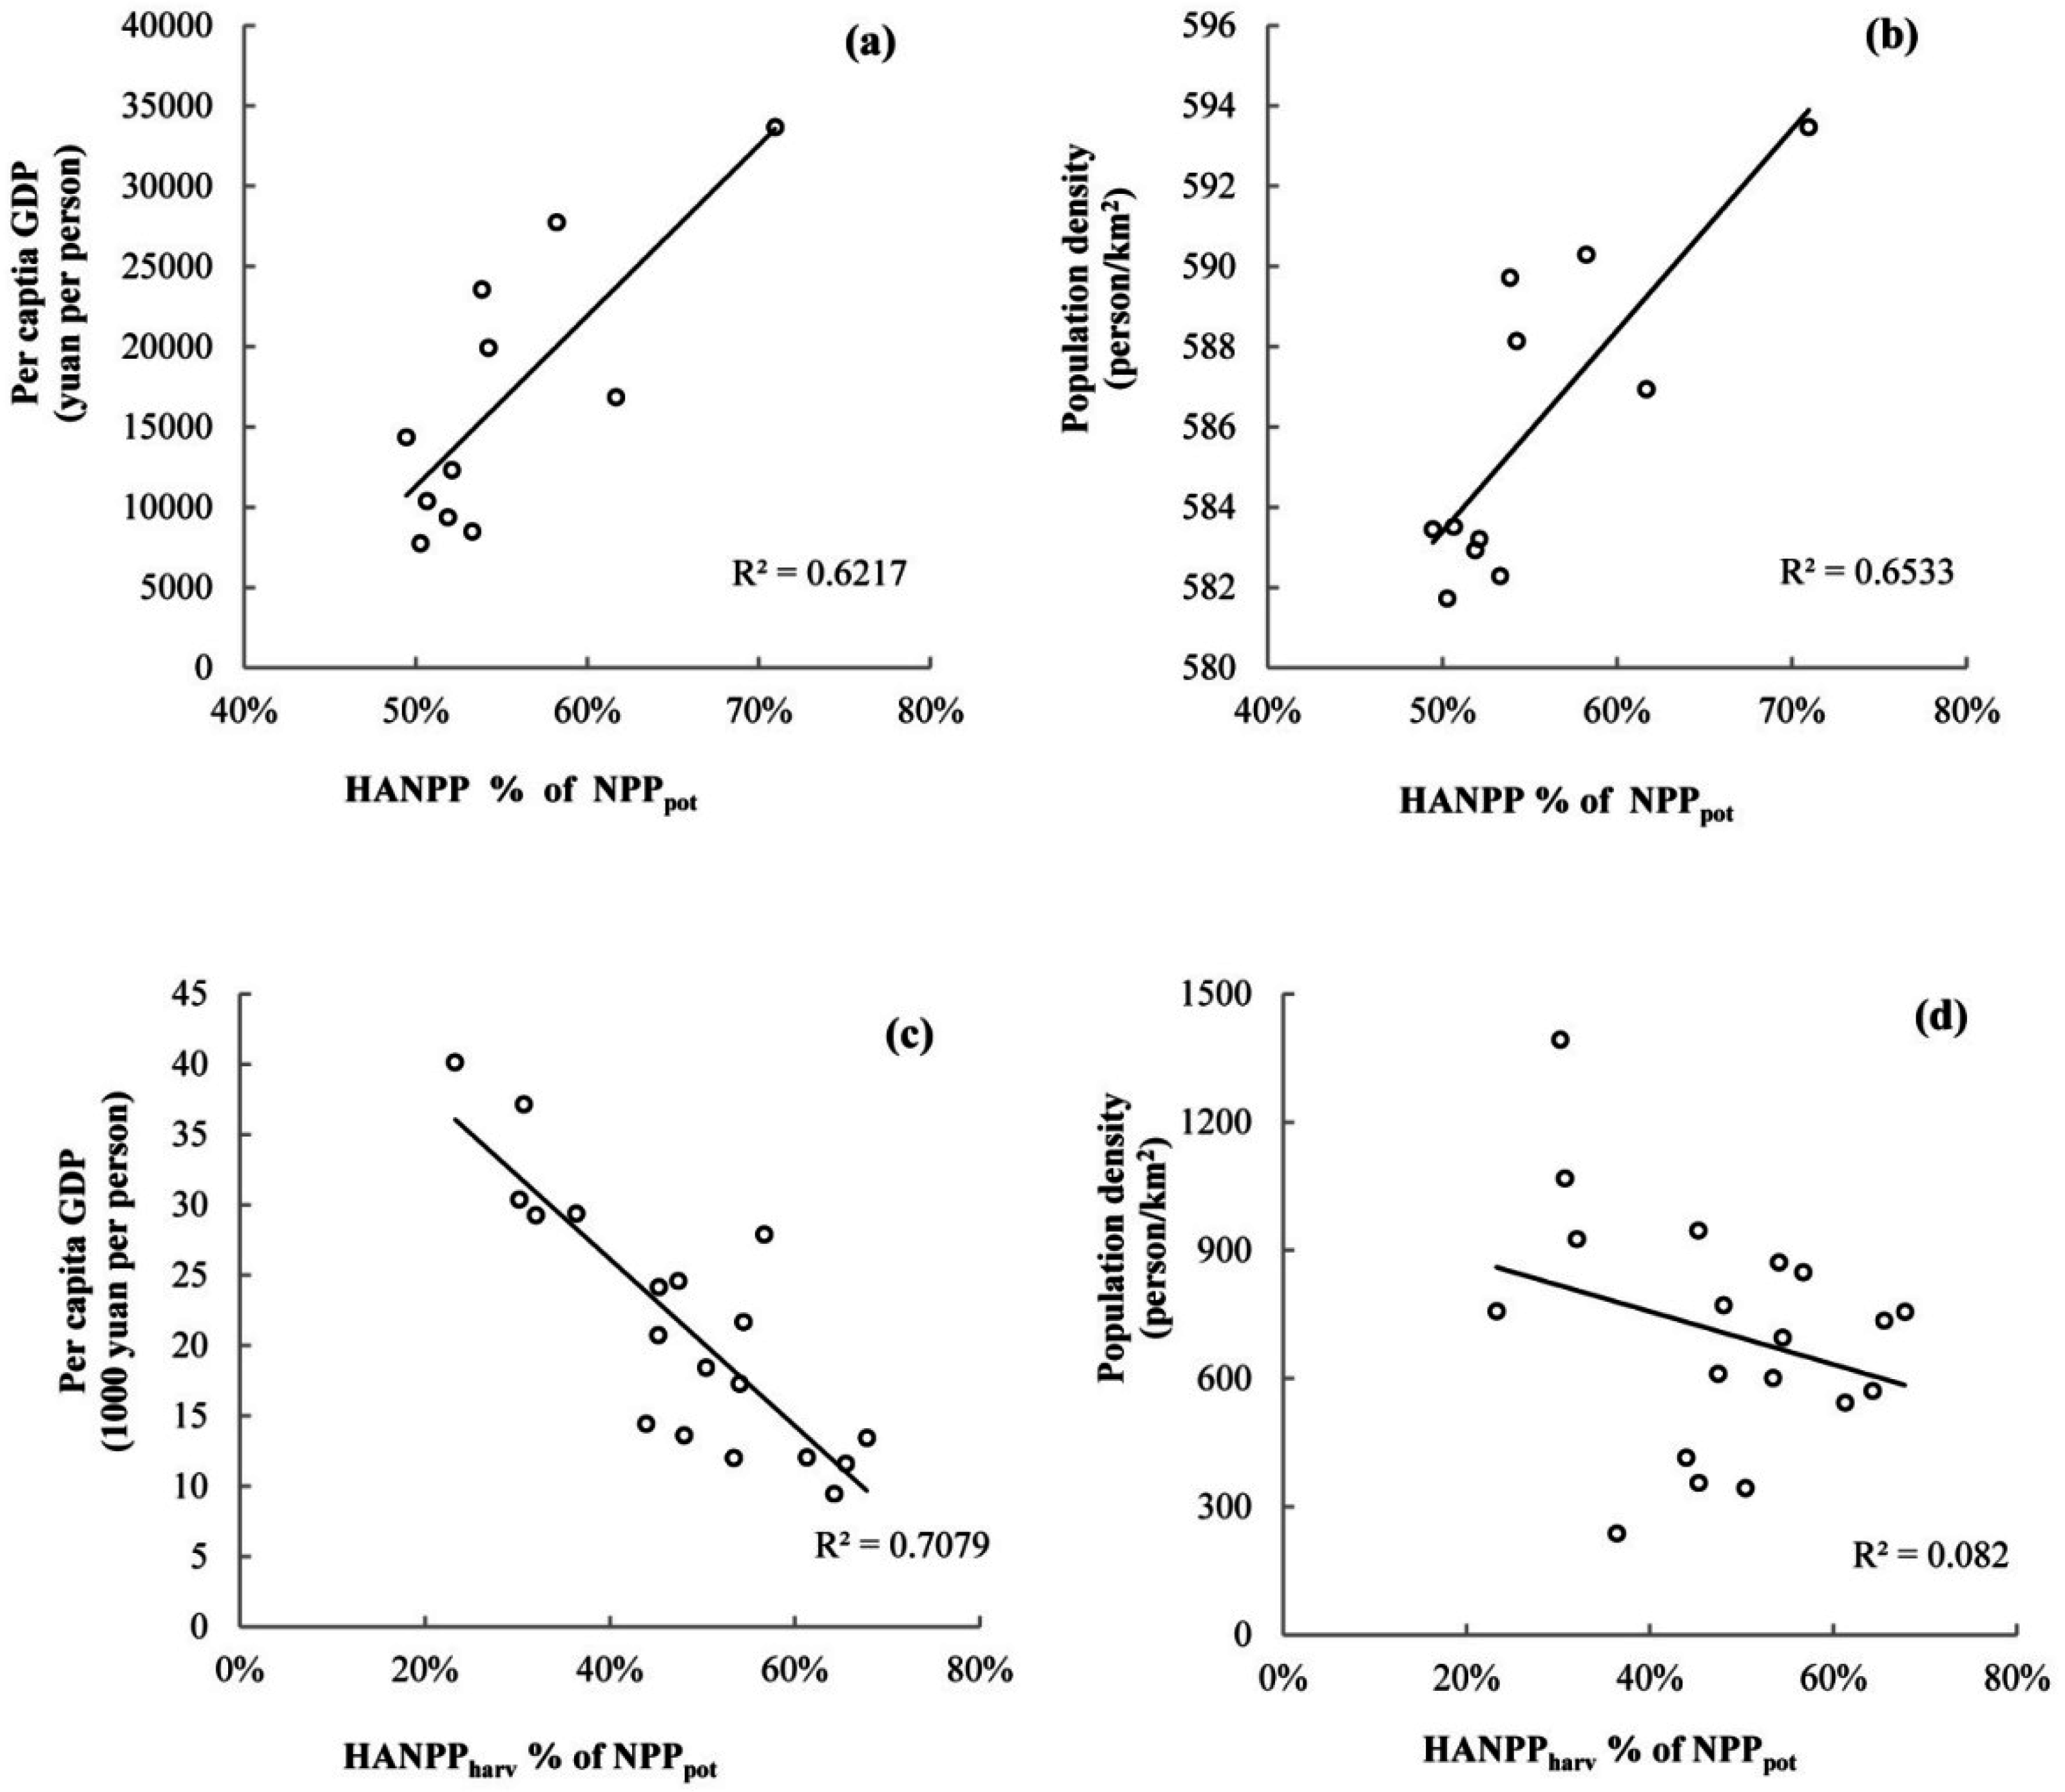
4.4. Influence of Socio-Economic Conditions on HANPP

5. Conclusions
Supplementary Files
Supplementary File 1Acknowledgments
Author Contributions
Conflicts of Interest
References
- Millennium Ecosystem Assessment. Ecosystems and Human Well-Being: Synthesis; Island Press: Washington, DC, USA, 2005. [Google Scholar]
- Krausmann, F.; Haberl, H.; Erb, K.-H.; Wiesinger, M.; Gaube, V.; Gingrich, S. What determines geographical patterns of the global human appropriation of net primary production? J. Land Use Sci. 2009, 4, 15–33. [Google Scholar] [CrossRef]
- Vitousek, P.M.; Mooney, H.A.; Lubchenco, J.; Melillo, J.M. Human domination of earth’s ecosystems. Science 1997, 277, 494–499. [Google Scholar] [CrossRef]
- Costanza, R. Ecosystem services: Multiple classification systems are needed. Biol. Conserv. 2008, 141, 350–352. [Google Scholar] [CrossRef]
- Wang, Q.; Jin, X.; Zhou, Y. Dynamic analysis of coastal region cultivated land landscape ecological security and its driving factors in Jiangsu. Acta Ecol. Sin. 2011, 31, 5903–5909. [Google Scholar]
- Wang, Q.; Li, Z.; Fan, J.; Hao, X.; Yuan, X. The change and its ecological responses of cultivated land intensive use in Jiangsu coastal district. Chin. Agric. Sci. Bull. 2012, 28, 186–191. [Google Scholar]
- Xiao, J.; Chen, D.; Xu, M.; Yu, Q.; Zhou, S.; Zhao, F. Evaluation of the loss values of the tidal wetlands ecosystem services by sea reclamation projects: A case of Jiangsu province. Trans. Oceanol. Limnol. 2010, 4, 95–100. [Google Scholar]
- Chen, A.; Li, R.; Wang, H.; He, B. Quantitative assessment of human appropriation of aboveground net primary production in China. Ecol. Model. 2015, 312, 54–60. [Google Scholar] [CrossRef]
- Vitousek, P.M.; Ehrlich, P.R.; Ehrlich, A.H.; Matson, P.A. Human appropriation of the products of photosynthesis. Bioscience 1986, 36, 368–373. [Google Scholar] [CrossRef]
- Imhoff, M.L.; Bounoua, L.; Ricketts, T.; Loucks, C.; Harriss, R.; Lawrence, W.T. Global patterns in human consumption of net primary production. Nature 2004, 429, 870–873. [Google Scholar] [CrossRef] [PubMed]
- Haberl, H. Human appropriation of net primary production as an environmental indicator: Implications for sustainable development. Ambio 1997, 26, 143–146. [Google Scholar]
- Gingrich, S.; Niedertscheider, M.; Kastner, T.; Haberl, H.; Cosor, G.; Krausmann, F.; Kuemmerle, T.; Müller, D.; Reith-Musel, A.; Jepsen, M.R.; et al. Exploring long-term trends in land use change and aboveground human appropriation of net primary production in nine European countries. Land Use Policy 2015, 47, 426–438. [Google Scholar] [CrossRef]
- Haberl, H.; Erb, K.H.; Krausmann, F. Human appropriation of net primary production: Patterns, trends, and planetary boundaries. Annu. Rev. Environ. Resour. 2014, 39, 363–391. [Google Scholar] [CrossRef]
- Bi, Y.; Gao, C.; Wang, Y.; Li, B. Estimation of straw resources in China. Trans. Chin. Soc. Agric. Eng. 2009, 25, 211–217. [Google Scholar]
- Wang, X.; Xue, S.; Xie, G. Value-taking for residue factor as a parameter to assess the field residue of field crops. J. China Agric. Univ. 2012, 17, 1–8. [Google Scholar] [CrossRef]
- Xie, G.; Han, D.; Wang, X.; Lv, R. Harvest index and residue factor of cereal crops in China. J. China Agric. Univ. 2011, 16, 1–8. [Google Scholar]
- Zhang, F.; Zhu, Z. Harvest index for various crops in China. Sci. Agric. 1990, 23, 83–87. [Google Scholar]
- Huang, Y.; Zhang, W.; Sun, W.J.; Zheng, X.H. Net primary production of chinese croplands from 1950 to 1999. Ecol. Appl. 2007, 17, 692–701. [Google Scholar] [CrossRef] [PubMed]
- Lobell, D.B.; Hicke, J.A.; Asner, G.P.; Field, C.B.; Tucker, C.J.; Los, S.O. Satellite estimates of productivity and light use efficiency in United States agriculture, 1982–1998. Glob. Chang. Biol. 2002, 8, 722–735. [Google Scholar] [CrossRef]
- Lieth, H. Primary production: Terrestrial ecosystems. Hum. Ecol. 1973, 1, 303–332. [Google Scholar] [CrossRef]
- Haberl, H.; Schulz, N.B.; Plutzar, C.; Erb, K.H.; Krausmann, F.; Loibl, W.; Moser, D.; Sauberer, N.; Weisz, H.; Zechmeister, H.G.; et al. Human appropriation of net primary production and species diversity in agricultural landscapes. Agric. Ecosyst. Environ. 2004, 102, 213–218. [Google Scholar] [CrossRef]
- Cramer, W.; Kicklighter, D.W.; Bondeau, A.; Moore, B.; Churkina, G.; Nemry, B.; Ruimy, A.; Schloss, A.L.; The Participants of the Potsdam NPP Model Intercomparison. Comparing global models of terrestrial net primary productivity (NPP): Overview and key results. Glob. Chang. Biol. 1999, 5, 1–15. [Google Scholar] [CrossRef]
- Del Grosso, S.; Parton, W.; Stohlgren, T.; Zheng, D.; Bachelet, D.; Prince, S.; Hibbard, K.; Olson, R. Global potential net primary production predicted from vegetation class, precipitation, and temperature. Ecology 2008, 89, 2117–2126. [Google Scholar] [CrossRef] [PubMed]
- Raich, J.W.; Rastetter, E.B.; Melillo, J.M.; Kicklighter, D.W.; Steudler, P.A.; Peterson, B.J.; Grace, A.L.; Moore, B.; Vorosmarty, C.J. Potential net primary productivity in south-america—Application of a global-model. Ecol. Appl. 1991, 1, 399–429. [Google Scholar] [CrossRef]
- Zaks, D.P.M.; Ramankutty, N.; Barford, C.C.; Foley, J.A. From miami to madison: Investigating the relationship between climate and terrestrial net primary production. Glob. Biogeochem. Cycles 2007, 21. [Google Scholar] [CrossRef]
- Potter, C.S.; Randerson, J.T.; Field, C.B.; Matson, P.A.; Vitousek, P.M.; Mooney, H.A.; Klooster, S.A. Terrestrial ecosystem production—A process model-based on global satellite and surface data. Glob. Biogeochem. Cycles 1993, 7, 811–841. [Google Scholar] [CrossRef]
- Los, S.O. Linkages between Global Vegetation and Climate: An Analysis Based on Noaa Advanced very High Resolution Radiometer Data; National Aeronautics and Space Administration, Goodard Space Flight Center: Greenbelt, MD, USA, 1998. [Google Scholar]
- Field, C.B.; Randerson, J.T.; Malmström, C.M. Global net primary production: Combining ecology and remote sensing. Remote Sens. Environ. 1995, 51, 74–88. [Google Scholar] [CrossRef]
- Piao, S.; Fang, J.; Guo, Q. Application of casa model to the estimation of chinese terrestrial net primary productivity. Acta Phytoecol. Sin. 2001, 25, 603–608. [Google Scholar]
- Zhu, W.; Pan, Y.; He, H.; Yu, D.; Hu, H. Maxim light use efficiency of typical vegetation in China. Chin. Sci. Bull. 2006, 51, 700–706. [Google Scholar] [CrossRef]
- Zhang, J.; Feng, X.; Ni, J. Calculation of maxim solar radiation base on regression analysis in China. Resour. Sci. 1981, 3, 38–46. [Google Scholar]
- Rojstaczer, S.; Sterling, S.M.; Moore, N.J. Human appropriation of photosynthesis products. Science 2001, 294, 2549–2552. [Google Scholar] [CrossRef] [PubMed]
- Haberl, H.; Erb, K.H.; Krausmann, F.; Gaube, V.; Bondeau, A.; Plutzar, C.; Gingrich, S.; Lucht, W.; Fischer-Kowalski, M. Quantifying and mapping the human appropriation of net primary production in earth’s terrestrial ecosystems. Proc. Natl. Acad. Sci. USA 2007, 104, 12942–12945. [Google Scholar] [CrossRef] [PubMed]
- Ma, T.; Zhou, C.H.; Pei, T. Simulating and estimating tempo-spatial patterns in global human appropriation of net primary production (HANPP): A consumption-based approach. Ecol. Indic. 2012, 23, 660–667. [Google Scholar] [CrossRef]
- Haberl, H.; Erb, K.H.; Krausmann, F.; Loibl, W.; Schulz, N.; Weisz, H. Changes in ecosystem processes induced by land use: Human appropriation of aboveground NPP and its influence on standing crop in Austria. Glob. Biogeochem. Cycles 2001, 15, 929–942. [Google Scholar] [CrossRef]
- Musel, A. Human appropriation of net primary production in the United Kingdom, 1800–2000 changes in society’s impact on ecological energy flows during the agrarian-industrial transition. Ecol. Econ. 2009, 69, 270–281. [Google Scholar] [CrossRef]
- Kastner, T. Trajectories in human domination of ecosystems: Human appropriation of net primary production in the Philippines during the 20th century. Ecol. Econ. 2009, 69, 260–269. [Google Scholar] [CrossRef]
- Schwarzlmuller, E. Human appropriation of aboveground net primary production in spain, 1955–2003: An empirical analysis of the industrialization of land use. Ecol. Econ. 2009, 69, 282–291. [Google Scholar] [CrossRef]
- Kohlheb, N.; Krausmann, F. Land use change, biomass production and HANPP: The case of hungary 1961–2005. Ecol. Econ. 2009, 69, 292–300. [Google Scholar] [CrossRef]
- Niedertscheider, M.; Gingrich, S.; Erb, K.H. Changes in land use in South Africa between 1961 and 2006: An integrated socio-ecological analysis based on the human appropriation of net primary production framework. Reg. Environ. Chang. 2012, 12, 715–727. [Google Scholar] [CrossRef]
- Niedertscheider, M.; Erb, K. Land system change in Italy from 1884 to 2007: Analysing the north-south divergence on the basis of an integrated indicator framework. Land Use Policy 2014, 39, 366–375. [Google Scholar] [CrossRef] [PubMed]
- Fetzel, T.; Gradwohl, M.; Erb, K.H. Conversion, intensification, and abandonment: A human appropriation of net primary production approach to analyze historic land-use dynamics in New Zealand 1860–2005. Ecol. Econ. 2014, 97, 201–208. [Google Scholar] [CrossRef]
- Vackar, D.; Orlitova, E. Human appropriation of aboveground photosynthetic production in the Czech Republic. Reg. Environ. Chang. 2011, 11, 519–529. [Google Scholar] [CrossRef]
- O’Neill, D.W.; Tyedmers, P.H.; Beazley, K.F. Human appropriation of net primary production (HANPP) in Nova Scotia, Canada. Reg. Environ. Chang. 2007, 7, 1–14. [Google Scholar] [CrossRef]
- Krausmann, F.; Gingrich, S.; Haberl, H.; Erb, K.H.; Musel, A.; Kastner, T.; Kohlheb, N.; Niedertscheider, M.; Schwarzlmuller, E. Long-term trajectories of the human appropriation of net primary production: Lessons from six national case studies. Ecol. Econ. 2012, 77, 129–138. [Google Scholar] [CrossRef] [PubMed]
© 2015 by the authors; licensee MDPI, Basel, Switzerland. This article is an open access article distributed under the terms and conditions of the Creative Commons by Attribution (CC-BY) license (http://creativecommons.org/licenses/by/4.0/).
Share and Cite
Zhang, F.; Pu, L.; Huang, Q. Quantitative Assessment of the Human Appropriation of Net Primary Production (HANPP) in the Coastal Areas of Jiangsu, China. Sustainability 2015, 7, 15857-15870. https://doi.org/10.3390/su71215793
Zhang F, Pu L, Huang Q. Quantitative Assessment of the Human Appropriation of Net Primary Production (HANPP) in the Coastal Areas of Jiangsu, China. Sustainability. 2015; 7(12):15857-15870. https://doi.org/10.3390/su71215793
Chicago/Turabian StyleZhang, Fangyi, Lijie Pu, and Qing Huang. 2015. "Quantitative Assessment of the Human Appropriation of Net Primary Production (HANPP) in the Coastal Areas of Jiangsu, China" Sustainability 7, no. 12: 15857-15870. https://doi.org/10.3390/su71215793