1. Introduction
Food waste is a significant phenomenon that is currently at the heart of academic debates, civil society initiatives, and political agendas. The issue is addressed through different approaches and disciplines [
1]. These factors and the lack of research attention so far have not allowed the development of shared terminology to clearly define food waste. This, in turn, affects the general debate, the definition of the concept, and the identification of possible remedies [
2,
3,
4,
5,
6,
7]. In this respect this work identifies as food waste all the products discarded from the food chain while still preserving their nutritional value and complying with safety standards. The literature related to the production and retailing stages is rather significant [
5,
8,
9,
10,
11,
12,
13], suggesting some consensus over the major issues related to this segment of the food chain. On the other hand, what is missing is information at the consumption level (catering, domestic consumption,
etc.), which is where a number of scientists and reports locate the higher share of food waste—but there is no consensus about its quantitative dimension [
3,
11,
12,
14,
15].
Engström and Carlsson-Kanyama [
16] analyzed waste in the catering industry, providing insight and data about this issue with a case study on Sweden. WRAP [
17] conducted an investigation in a number of schools in England in order to understand the nature and causes of waste in this sector and the potential impact of corrective actions. Sonnino and McWilliam [
18] argued how scientific studies have been dealing with the topic mainly from a climate change perspective and focused their attention on food services with a case study on Welsh hospital catering services. An additional work aimed at assessing the amount of food waste by meal components was carried out by Byker
et al. [
19], who identified the highest rate of food waste in vegetables (51.4%), followed by the main entrée (51%). When converted to cups, the amount of waste seems to be extremely significant: 38.2 out of 130.5 cups of fruit and 92.6 cups of veggies out of 139.8 were wasted. Particular attention has to be given to the “Portuguese school” that presents several works addressing food waste in food catering services. Ferreira
et al. [
20] evaluated food waste in a Portuguese university to assess the efficiency of the service. They identified an index of waste/consumption (%) obtained as the ratio between plate waste and the quantity of distributed food, subtracting the weight of leftovers. Results suggest an index of waste/consumption at approximately 24%. Liz Martins
et al. [
21] compared the visual estimation method with the weighing method, finding that the visual estimation method is not as accurate as the weighing method in assessing nonselective aggregated plate waste. Dânia
et al. [
22] investigated plate waste as a potential indicator of portion inadequacy at school lunch. Within this study plate waste (%) was calculated as the ratio of food discarded to food served to the children.
In the past decade private companies and public service providers made significant efforts to increase the sustainability of their operations. Within this framework, to improve the efficiency and quality of school catering services, the Italian public administration essentially focused on two elements: the preparation of meals with organic and locally-sourced produce, and the design of healthy diets following the guidelines of the Italian National Research Institute for Food and Nutrition and the Ministry of Education, University and Research [
23]. The guidelines do not address food waste directly but include a set of recommendations on purchase decisions and consumption behaviors [
24] directly related to a number of food waste drivers [
25].
At the European level, the aforementioned WRAP study suggests that “in England, over a school year (40 weeks), a total of 55,408 tons of food waste is generated by primary schools and 24,974 tons by secondary schools, giving a total food waste weight of 80,382 tons” [
17]. A significant amount of food waste in catering services was also identified by Sonnino and McWilliam [
18] who––in the case study carried out in the Welsh hospital catering services––suggested food waste ranging between 19% and 66% per meal. This phenomenon should be regarded as an indicator of the (in)efficiency of the catering industry. If the highest system efficiency implies the complete transformation of the supplied food into consumed food, waste could then be considered a shortfall in the system’s output, leading to an efficiency decrease. In other words, a system is efficient when the resources are utilized in an economic manner whereas, according to Pareto’s concept, efficiency means reaching an allocation of resources that does not allow further improvements [
26]. Consequently, the more meals unconsumed and thus wasted, the higher the inefficiency.
In July 2003, the intensification of the food waste debate led to the approval of Italian law 155, “Regulation on the distribution of foodstuffs for social purposes”, the so-called “Good Samaritan Law.” This legislative measure simplifies the rules on the recovery of foodstuffs for non-profit organizations or an equivalent. This law boosted the number of recovery activities and the amounts of recovered food, for charitable purposes, from school and company canteens all over the country [
27].
This paper investigated food waste in school catering in order to assess the operational efficiency of the food services and to contribute to the understanding of food waste dynamics. By analyzing the school catering system’s features and collecting quantitative evidence and information, this paper attempted to analyze the amount of food waste (i.e., food processed and still perfectly edible, but not served during the meals) and to investigate the main causes that lead to the identified amount of unserved food and so to assess the operational efficiency of the food services to suggest a recovery intervention model in order to reduce waste amounts and improve a rational (economic) use of resources.
2. Material and Methods
A research protocol was designed to combine a systematic data collection from six school canteens with a number of non-structured interviews carried out with caterers and teachers during three focus groups [
28,
29,
30].
2.1. Case Study Identification
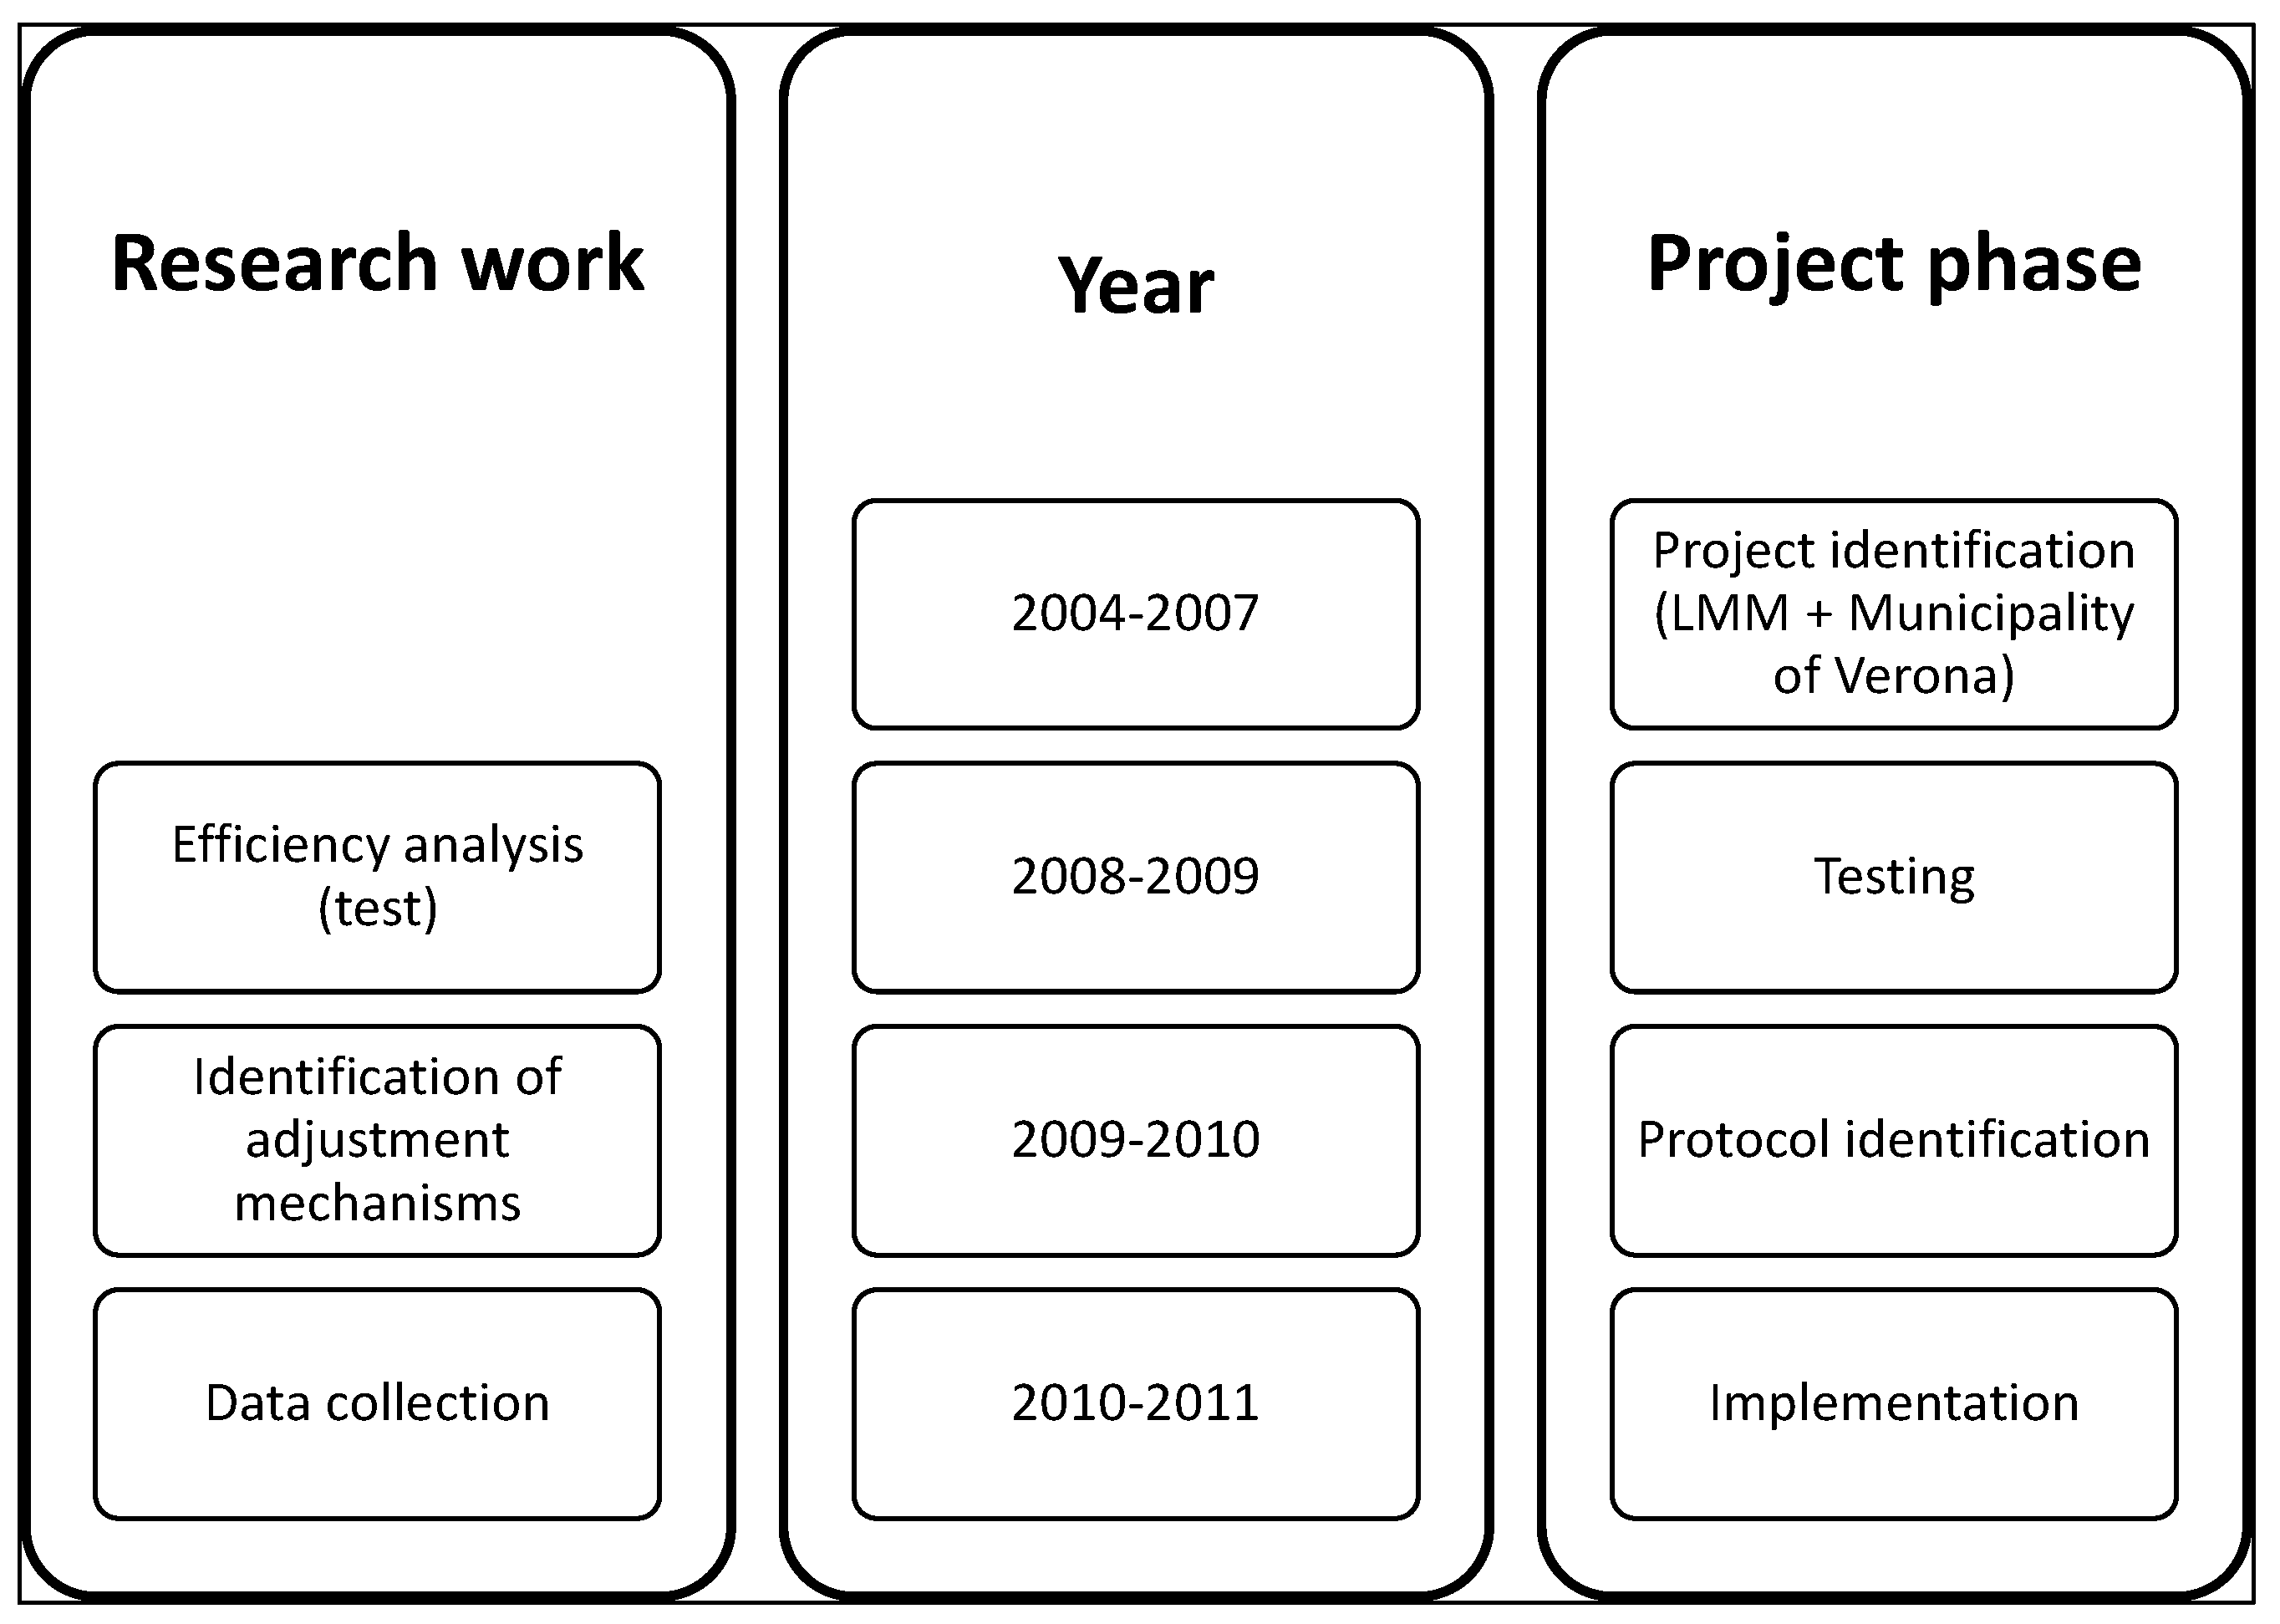
In 2005, the municipality of Verona and Last Minute Market (LMM), a subsidiary of the University of Bologna, signed an agreement to identify a joint solution for food waste reduction in public school canteens (see
Figure 1).
The approach included the recovery and distribution of unserved meals, perfectly fit for consumption, to low-income brackets of the population, following the LMM model based not only on the prevention of food waste, but also on the recovery of discarded edible food.
The food recovery model designed and implemented by LMM is based upon the principle of proximity [
31,
32]. This means that a donor (the school canteen) and a beneficiary (a body or association helping vulnerable people) need to be located in the same neighborhood or in the near vicinity. The aim is to reduce the distance and the duration of transport. This principle is relevant to increase the safety of an operation carrying a high contamination risk owing to the health and hygiene aspects. In this respect, the municipality of Verona and LMM, with the support of the local health authorities, implemented a set of appropriate measures to ensure the safety of the products.
Schools were chosen according to their location, in order to establish a restricted area of operation and thus facilitate recovery activities. Six schools, consisting of three primary (Primary 1, Primary 2, and Primary 3) and three first grade secondary schools (Secondary 1, Secondary 2, and Secondary 3) were identified.
Meals were produced in a centralized cooking facility and then distributed to each school. The products, transported in isothermal steel food containers (Gastronorm), were then portioned and served at tables to the children. Once the service was completed, unserved meals were made available for collection by the charitable organizations’ volunteers.
The actors involved in the study included 480 students from six primary and first grade secondary schools; 18 caterers, three per school; 12 teachers, two per school; four municipal managers; four beneficiary charitable organizations, their volunteers, and aid recipients; the LMM working group, consisting of three people who regularly monitored the correct implementation of the given protocols and the health and hygiene standards of the recovered food; and the research team, consisting of three people responsible for the accuracy of the data collection.
Figure 1.
Research rationale.
Figure 1.
Research rationale.
2.2. Data Collection
This paper analyzed data for three scholastic years, from 2008 to 2011. During the first year (2008–2009), as a pilot project in two schools, a preliminary analysis of the efficiency of the canteen management system was conducted. Data were collected to categorize the quantity and the nutritional characteristics of the food processed (prepared) but not served, and disposed of as waste. For five days a week (from Monday to Friday), each portion of unserved food was weighed. Its temperature was then measured and recorded. In order to gather additional qualitative information on consumption and distribution modalities, data collection was integrated by a number of non-structured interviews carried out within three focus groups (focus group participants: two researchers from the University of Bologna (one as facilitator); 12 teachers (two per each school); four municipal managers; two representatives for each of the charitable organizations) [
28,
29,
30].
During the second year (2009–2010), corrective actions to reduce inefficiencies were identified on the basis of the results obtained in the preliminary analysis. Remedial actions can be divided in two categories: a theoretical/didactical one aimed at reducing the causes of food waste, and an applied one aimed at identifying alternative uses of the food that is still edible. In particular, a procedure for product recovery, in compliance with hygienic and sanitary regulations, and for its distribution to charitable organizations that deliver food to disadvantaged people, was defined.
In order to apply corrective actions comprehensively, a protocol for food recovery was set, aiming at ensuring the nutritional value, physical integrity, and hygienic standard of the food distributed to the final beneficiaries.
During the third year (2010–2011), data and information were collected along with food recovery. School catering generally lasts from the beginning of October to the end of May. During October 2010, all the stakeholders were informed about the results of the preliminary analysis (of year one) and the identified remedial actions (of year two). Particular attention was given to the canteen staff and the charitable organizations involved in the collection of the unserved food, and the entire month was devoted to training them and testing the corrective actions. Food recovery and data collection began in November 2010 and concluded at the end of May 2011. The overall duration of the survey is particularly significant, considering that the studies listed in the existing literature have often been limited to a few weeks [
16,
18].
Collected data focused on food recovery, treatment, and transport. Related operations and processes were repeated each day, from Monday to Friday, in all the pilot schools. The only exception was Secondary School 3, where the catering service was functioning only three days a week (Tuesday, Wednesday, and Friday). Moreover, an inefficiency index of the catering system was calculated as a percentage of wasted food compared to the amount of processed food.
Canteen staff followed the guidelines to keep the unserved food, received from the kitchen in steel Gastronorm containers, in good condition. Association members involved in the recovery operation were asked to observe the typology, the weight, the temperature, and other relevant parameters of each food portion. Collected data was then discussed in a weekly briefing between canteen and association staff and the research group.
At the end of each day, unserved food was transferred to other insulated containers in order to maintain its physical characteristics. In the case of warm food, the proper conservation temperature was set to at least 65 °C, while for cold food it was not to exceed 4 °C. When the indicated limits were not observed, food was not recovered.
All the portions (pasta and soups, meat and fish, fruit, and bread) were kept separately during the entire process and placed in different stations (school and association canteens). In the canteens of the charitable organizations, food was immediately consumed by the final beneficiaries or, after cooling down, stored for later consumption. The process allowed for the identification of the amount of recovered portions and the inefficiencies of the catering management system.
Lunch menus were divided into two main typologies: summer and winter. The winter menu was served from October to March for a total of 92 days. The summer menu was served from April to May for a total of 33 days. The main difference between the two menus was the variation in fruit and vegetables depending on their seasonality. Menus consisted of the same food categories: a warm (pasta, rice, or soup) or cold (pasta or rice) entrée; a main warm course (meat, cheese, fish, or eggs) with the exception of certain cheeses such as mozzarella or Monte Veronese (a local cheese); a warm or cold seasonal side dish; seasonal fruit; and bread. One day every two weeks, pizza, along with charcuterie, was served instead of the usual entrée.
Among the recovered products, there were no beverages, since during the meals only water was served from dispensers.
Furthermore, in accordance with the guidelines on balanced meals [
23], portions were composed as follows: 0.2 kg for an entrée, 0.12 kg for a main course, 0.12 kg for a side dish, 0.15 kg for fruit, and 0.08 kg for bread.
Partially consumed portions of food were not taken into account since they do not respect the minimum sanitary and hygienic standards to be considered as edible food, hence they do not fit the definition of ‘food waste’ utilized within the present work.
3. Results
The analysis suggested that during the period of investigation the catering service management had a high level of inefficiency, measured as the amount of food processed but not served. This amount represented an average of 15.31% (6523.35 kg) of the overall processed food.
Side dishes had the highest percentage of food waste: 24.67% (1883.06 kg) of the total vegetables delivered to the cafeterias, with a prevalence of cooked vegetables (1202.10 kg) over raw vegetables (680.96 kg), as the former were served more frequently than the latter. In absolute terms, the entrée had the highest number of unconsumed portions, with the total of 2533.60 kg representing 19.92% of the processed entrées. Risotto had the highest degree of inefficiency with waste amounting to 629.15 kg, followed by pasta with tomato ragout (462.71 kg), and soups or pasta in broth (440.73 kg). Bread was also characterized by a high percentage of waste for a total of 900.58 kg, corresponding to 17.7% (see
Table 1).
Main courses and fruit presented results below the average. In the case of main courses, unconsumed portions amounted to 12.59%, corresponding to 960.84 kg. In this category, the dish with the highest number of unconsumed portions was beef (241.62 kg), followed by eggs (138.53 kg). Fruit was characterized by a limited number of unconsumed portions, representing 1.51% (114.26 kg) of the total. The limited amount of remaining portions can be explained by action taken by the catering management: while leaving the canteen students were encouraged to take remaining fruit that could be consumed during the afternoon.
In a comparison between the summer and the winter menu, it appears that the percentage of unconsumed portions is not significantly different (15.00% and 16.08%, respectively), whereas the absolute values diverged considerably (4579.07 kg against 1944.28 kg, respectively). The difference in absolute values is related to the duration of the period under investigation: 92 days during winter and 33 days during the summer period. On an average basis, the quantity of unserved food was 49.77 kg per day during winter and 58.92 kg per day during summer.
Waste increase was strongly linked to wastage of side dishes, which rose from 16.97% to 44.12% (see
Table 2). This indicated that raw vegetables, mostly present in the summer menu, often remained unserved. By contrast, the survey indicated a reduction of the amount of waste for entrées (about from 21.75 to 15.29) and main courses (from 13.43 to 10.46). Thus, excluding vegetables, cold courses were characterized by a lower amount of waste than warm courses.
Table 1.
Processed food (kg) and unserved food (kg and %)––from November 2010 to May 2011.
Table 1.
Processed food (kg) and unserved food (kg and %)––from November 2010 to May 2011.
| Category | Processed Food | Unserved Food | Inefficiency Index |
|---|
| Total kg | Average kg Per Day | Average Portions Per Day | Total kg | Average kg Per Day | Average Portions Per Day | (%) |
|---|
| Entrée | 12720 | 101.76 | 509 | 2533.60 | 20.27 | 101 | 19.92 |
| Pasta meat ragout | 1774.88 | 104.40 | 522 | 307.47 | 18.09 | 90 | 17.32 |
| Pasta fish ragout | 295.81 | 98.60 | 493 | 135.27 | 45.09 | 225 | 45.73 |
| Pasta tomato ragout | 2070.70 | 90.03 | 450 | 462.71 | 20.12 | 101 | 22.35 |
| Pasta vegetables ragout | 1479.07 | 92.44 | 462 | 289.27 | 18.08 | 90 | 19.56 |
| Soup | 2366.51 | 102.89 | 514 | 440.73 | 19.16 | 96 | 18.62 |
| Risotto | 2662.33 | 110.93 | 555 | 629.15 | 26.21 | 131 | 23.63 |
| Pasta with oil | 2070.70 | 108.98 | 545 | 268.99 | 14.16 | 71 | 12.99 |
| Main course | 7632.00 | 61.06 | 509 | 960.84 | 7,69 | 64 | 12.59 |
| Beef | 1347.8 | 58.60 | 488 | 241.62 | 10.51 | 88 | 17.94 |
| Turkey | 748.24 | 62.35 | 520 | 116.12 | 9.68 | 81 | 15.52 |
| Chicken | 1346.82 | 64.13 | 534 | 160.14 | 7.63 | 64 | 11.89 |
| Pork | 299.29 | 59.86 | 499 | 39.77 | 7.95 | 66 | 13.29 |
| Pizza | 748.24 | 62.35 | 520 | 47.47 | 3.96 | 33 | 6.34 |
| Cold cut | 598.59 | 66.51 | 554 | 39.58 | 4.40 | 37 | 6.61 |
| Fish | 897.88 | 56.12 | 468 | 91.72 | 5.73 | 48 | 10.21 |
| Eggs | 748.24 | 62.35 | 520 | 138.53 | 11.54 | 96 | 18.51 |
| Cheese | 897.88 | 59.86 | 499 | 85.89 | 5.73 | 48 | 9.57 |
| Side dish | 7632.00 | 61.06 | 509 | 1883.06 | 15.06 | 126 | 24.67 |
| Raw vegetables | 2598.13 | 55.28 | 461 | 680.96 | 14.49 | 121 | 26,21 |
| Cooked vegetables | 5033.87 | 64.54 | 538 | 1202.10 | 15.41 | 128 | 23,88 |
| Fruit/Yogurt | 9540.00 | 76.32 | 509 | 144.26 | 1.15 | 8 | 1.51 |
| Bread | 5088.00 | 40.70 | 509 | 900.58 | 7.20 | 90 | 17.70 |
| Other * | | | | 101.01 | | | |
| Total | 42612.00 | 340.90 | 509 | 6523.35 | 51.37 | 389 | 15.31 |
The quantity of unserved bread showed a decrease (see
Table 2) during the summer, thanks to specific actions introduced to reduce the inefficiencies, as in the case of fruit. In particular, the quantity of bread delivered to schools during summer was 5%–6% lower than in winter. The share of recovered bread, which already stood at a rather low level in the winter period, decreased by an additional 1.62% in the summer. This suggests that the measures taken to curb bread waste had positive results.
Table 2.
Comparison between winter and summer menus: processed and unserved food, and inefficiency index.
Table 2.
Comparison between winter and summer menus: processed and unserved food, and inefficiency index.
| Category | Winter Menu (92 Days) | Summer Menu (33 Days) |
|---|
| Processed Food (kg) | Unserved Food (kg) | Inefficiency Index | Processed Food (kg) | Unserved Food (kg) | Inefficiency Index |
|---|
| A | B | (B/A %) | C | D | (D/C %) |
|---|
| Entrée | 9110.00 | 1981.80 | 21.75 | 3610.00 | 551.80 | 15.29 |
| Main course | 5466.00 | 734.24 | 13.43 | 2166.00 | 226.60 | 10.46 |
| Side dish | 5466.00 | 927.44 | 16.97 | 2166.00 | 955.62 | 44.12 |
| Fruit/Yogurt | 6832.50 | 134.84 | 1.97 | 2707.50 | 9.42 | 0.35 |
| Bread | 3644.00 | 712.39 | 19.55 | 1444.00 | 188.19 | 13.03 |
| Other * | -- | 88.36 | -- | -- | 12.65 | -- |
| Total | 30518.50 | 4579.07 | 15.00 | 12093.50 | 1944.28 | 16.08 |
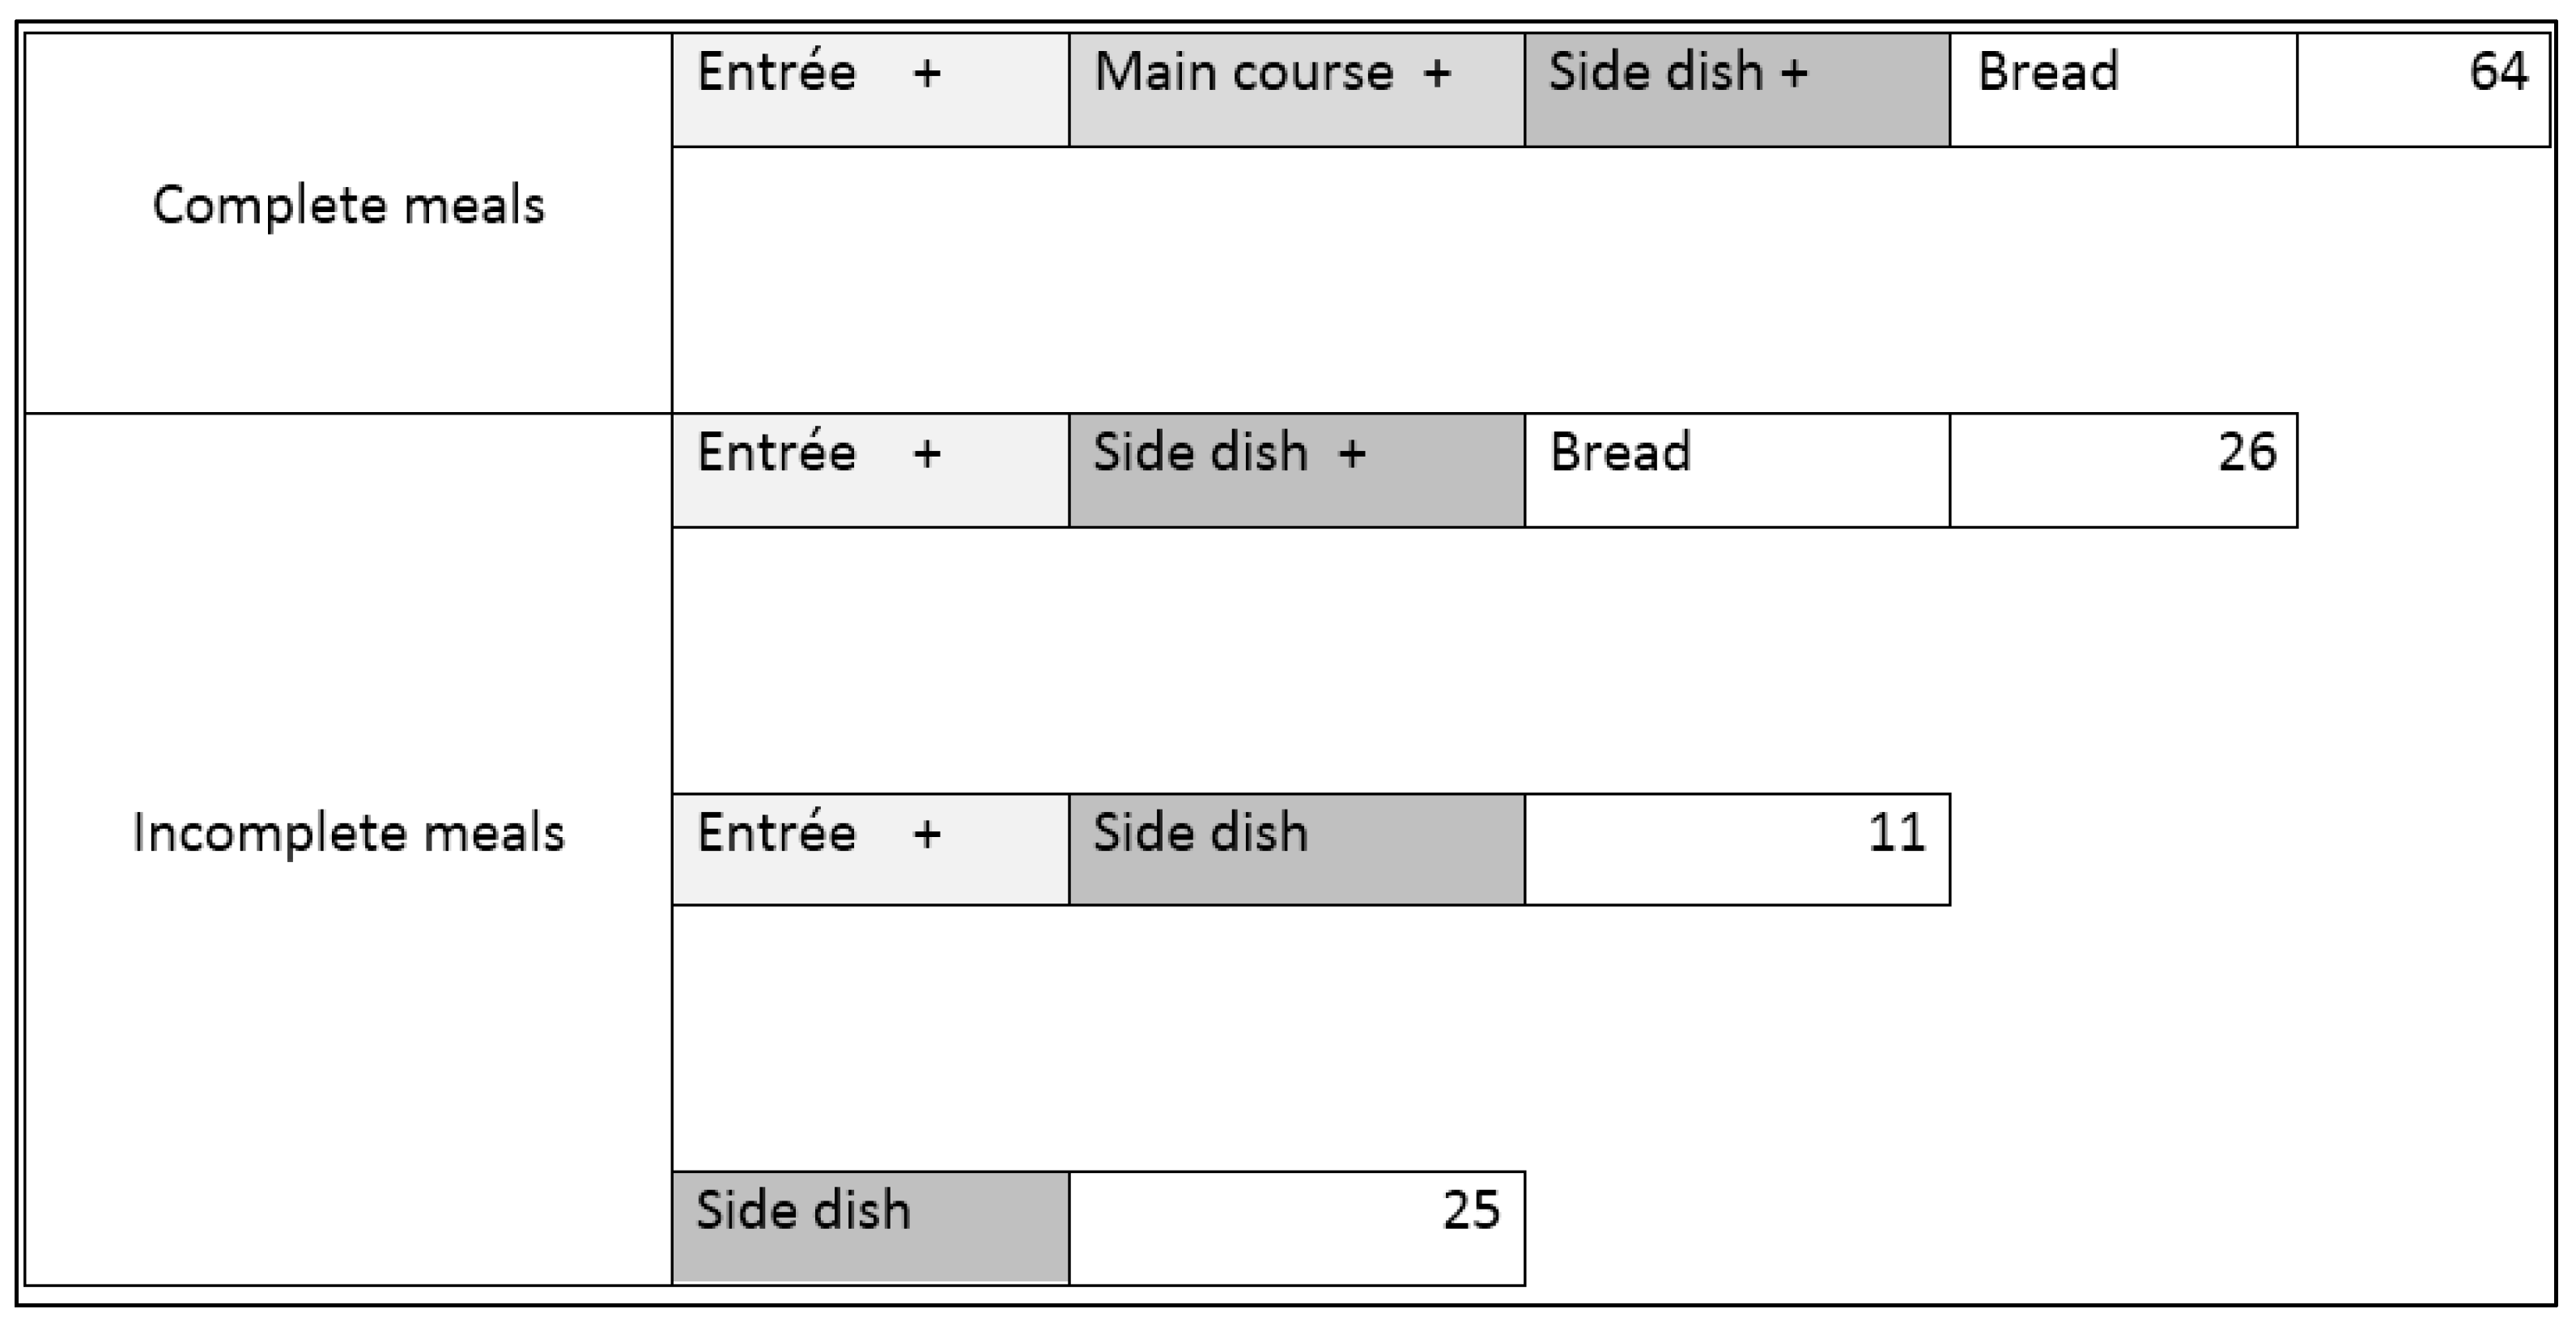
From October to May an average of 510 meals a day were delivered to schools to serve about 480 children. The number of meals in excess was 5% to 6% to satisfy any possible request for additional food. During the period under analysis the food waste per student was 13.59 kg. Considering that a medium portion is equal to 0.134 kg, the total waste was about 101 portions per person.
Overall, one portion out of eight was not consumed by students. Results suggest that on a daily basis, 101 portions of entrées, 64 of main courses, 126 of side dishes, eight of fruit, and 90 of bread were not consumed. These unserved but fully edible portions would constitute an additional 64 complete––excluding fruit––and 62 incomplete meals per day (see
Figure 2).
Figure 2.
Daily meals obtained from the recovery of unserved food.
Figure 2.
Daily meals obtained from the recovery of unserved food.
Given that a complete meal, without fruit, has a cost of 4.30 euros, without a recovery system the overall amount of unserved but fully edible portions would represent a loss of 381.90 euros per day (see
Table 3). With the recovery system in place there are no additional charges for the school canteen while the beneficiary organizations have an economic benefit represented by the value of the recovered meals that they do not need to purchase.
Table 3.
Recovered economic value.
Table 3.
Recovered economic value.
| Entrée | Main Course | Side Dish | Bread | Meal | Economic Value |
|---|
| Quantity (num) | Unit Cost (€) | Quantity (num) | Unit Cost (€) | Quantity (num) | Unit Cost (€) | Quantity (num) | Unit Cost (€) | Cost (€) | Average Daily Cost Recovered (€) |
|---|
| 101 | 1.50 | 64 | 1.80 | 126 | 0.70 | 90 | 0.30 | 4.30 | 381.90 |
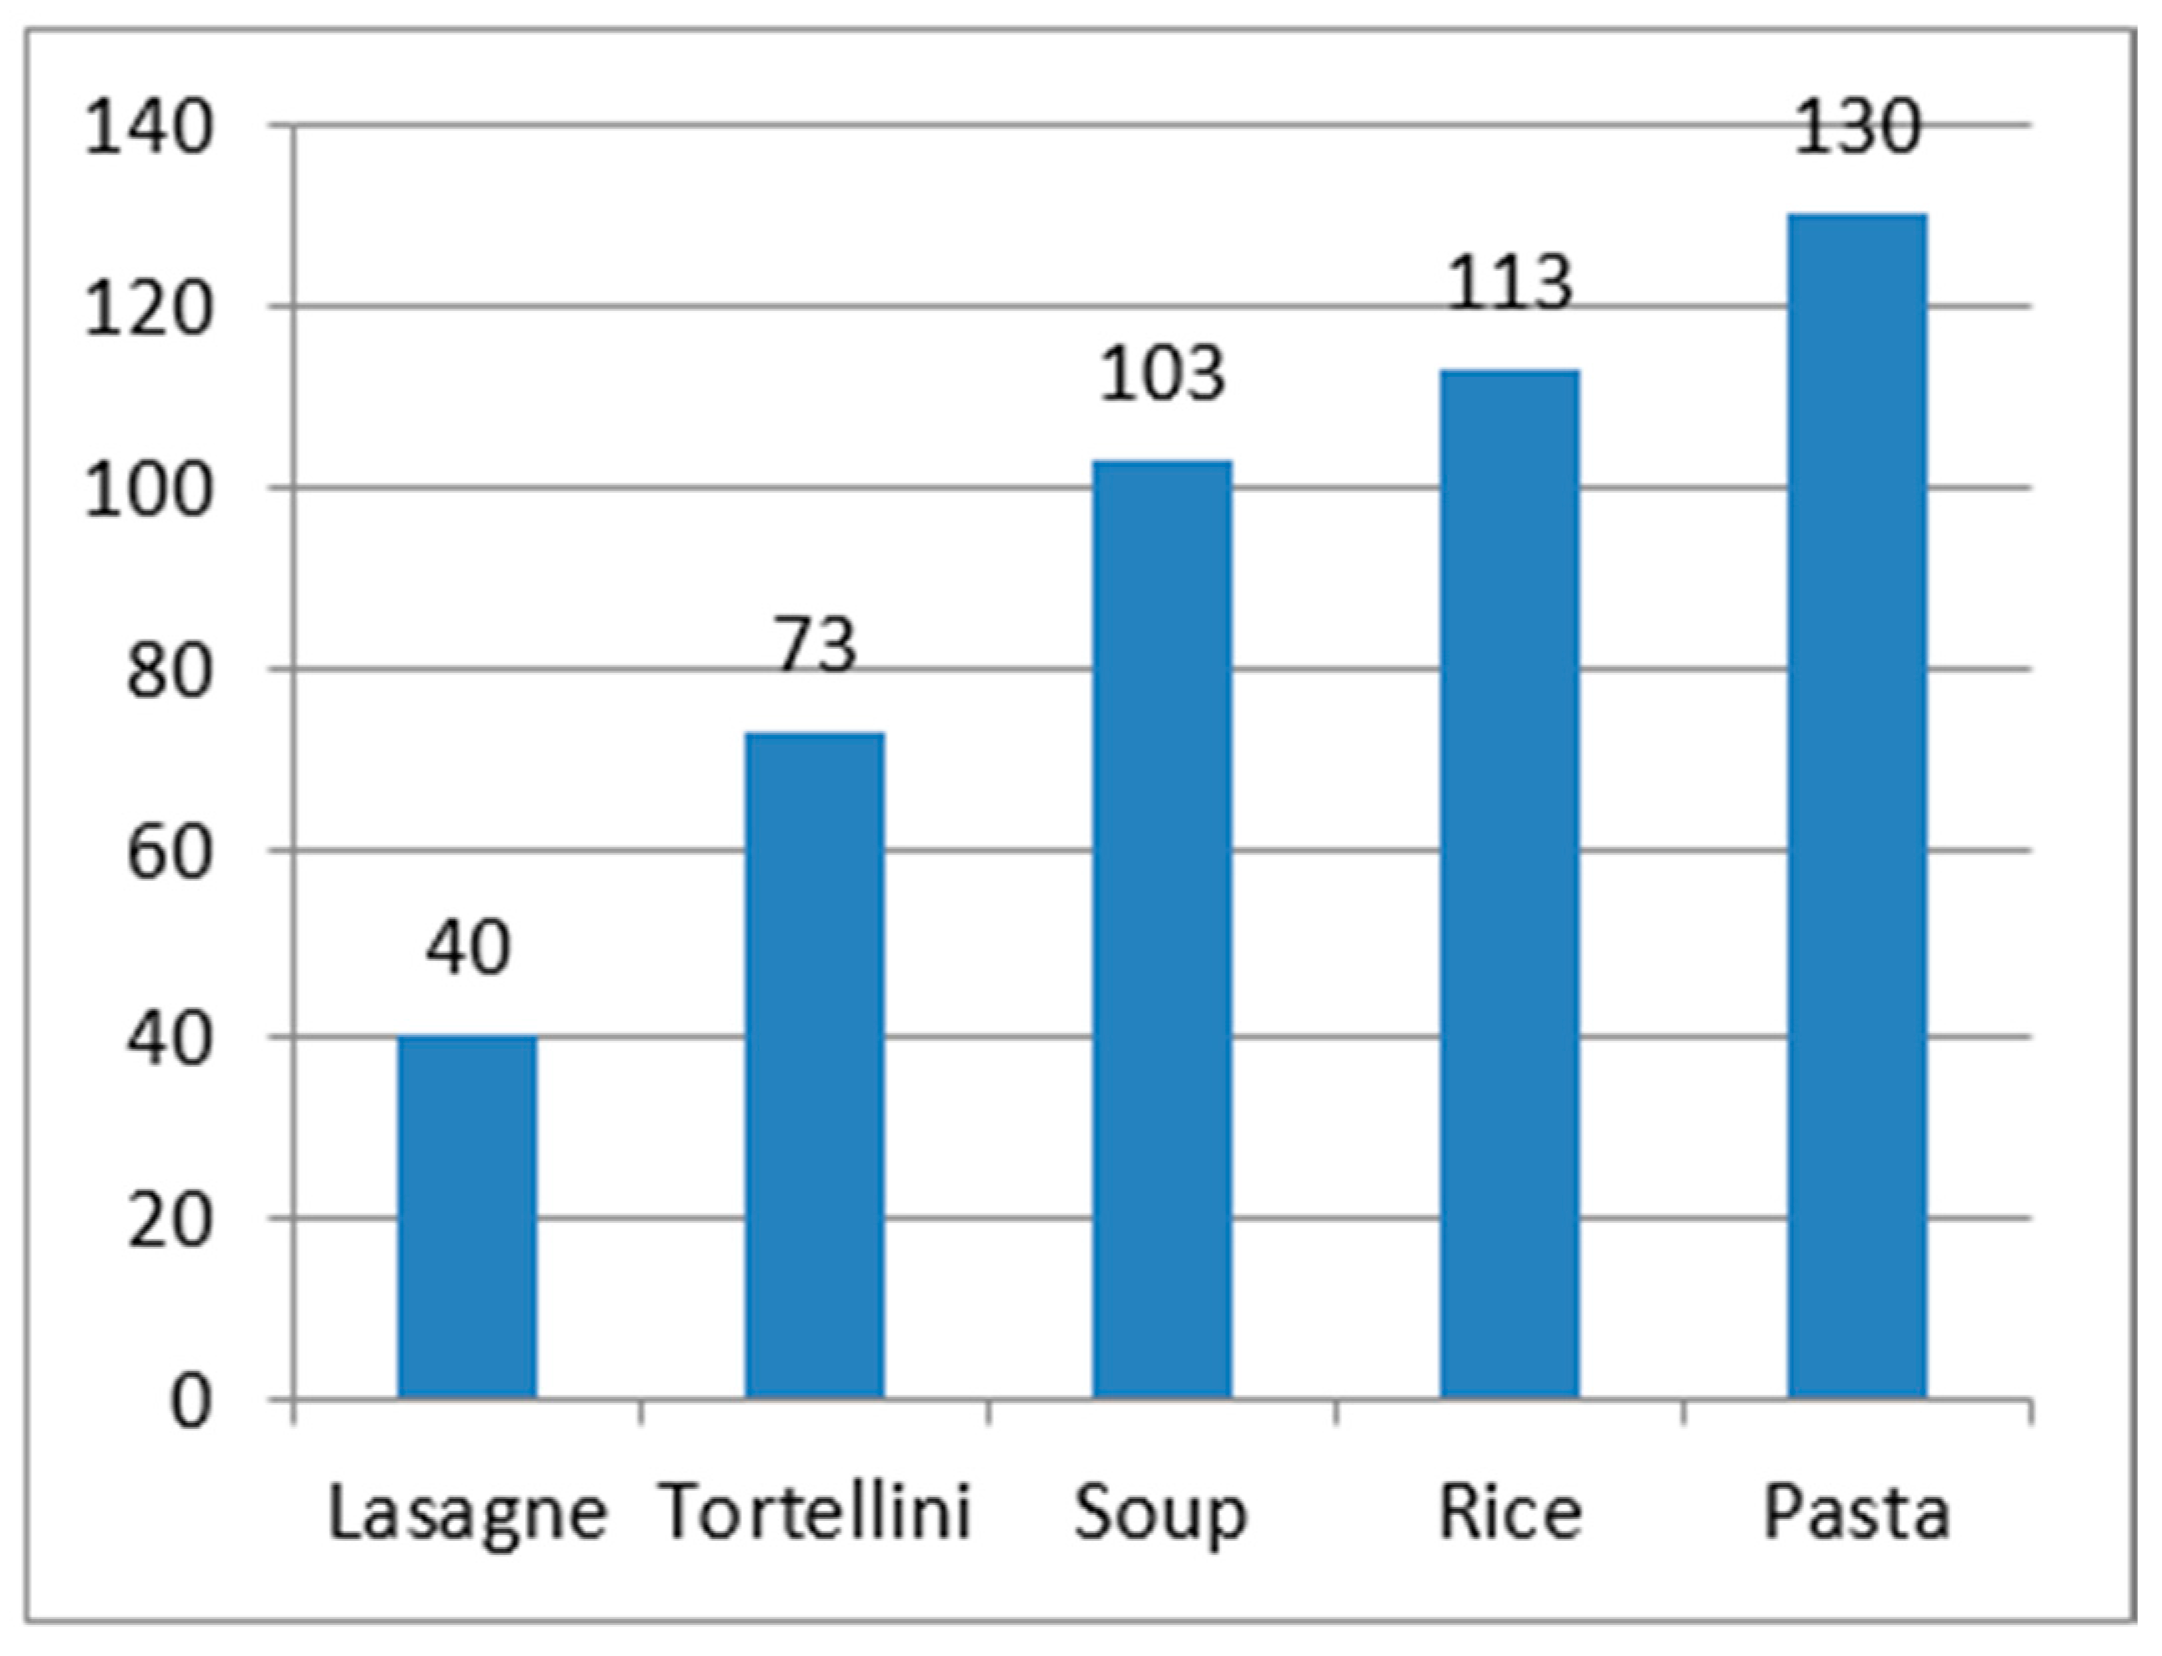
Efficiency levels were also diversified within each food category. Considering the weighted average of every single dish, among the entrées, lasagna and tortellini showed the best results: in the case of lasagna the average number of unserved portions was 40, while for tortellini it was 73 (see
Figure 3). These items were followed by soup, with an average of 103 unserved portions. Pasta and rice presented the worst results, with 113 and 130 portions remaining unconsumed.
Figure 3.
Average number of unserved portions of entrées (per day).
Figure 3.
Average number of unserved portions of entrées (per day).
During the interviews, attendants reported that students claimed to eat pasta and rice rather often at home, hence they did not wish to eat them in the canteen.
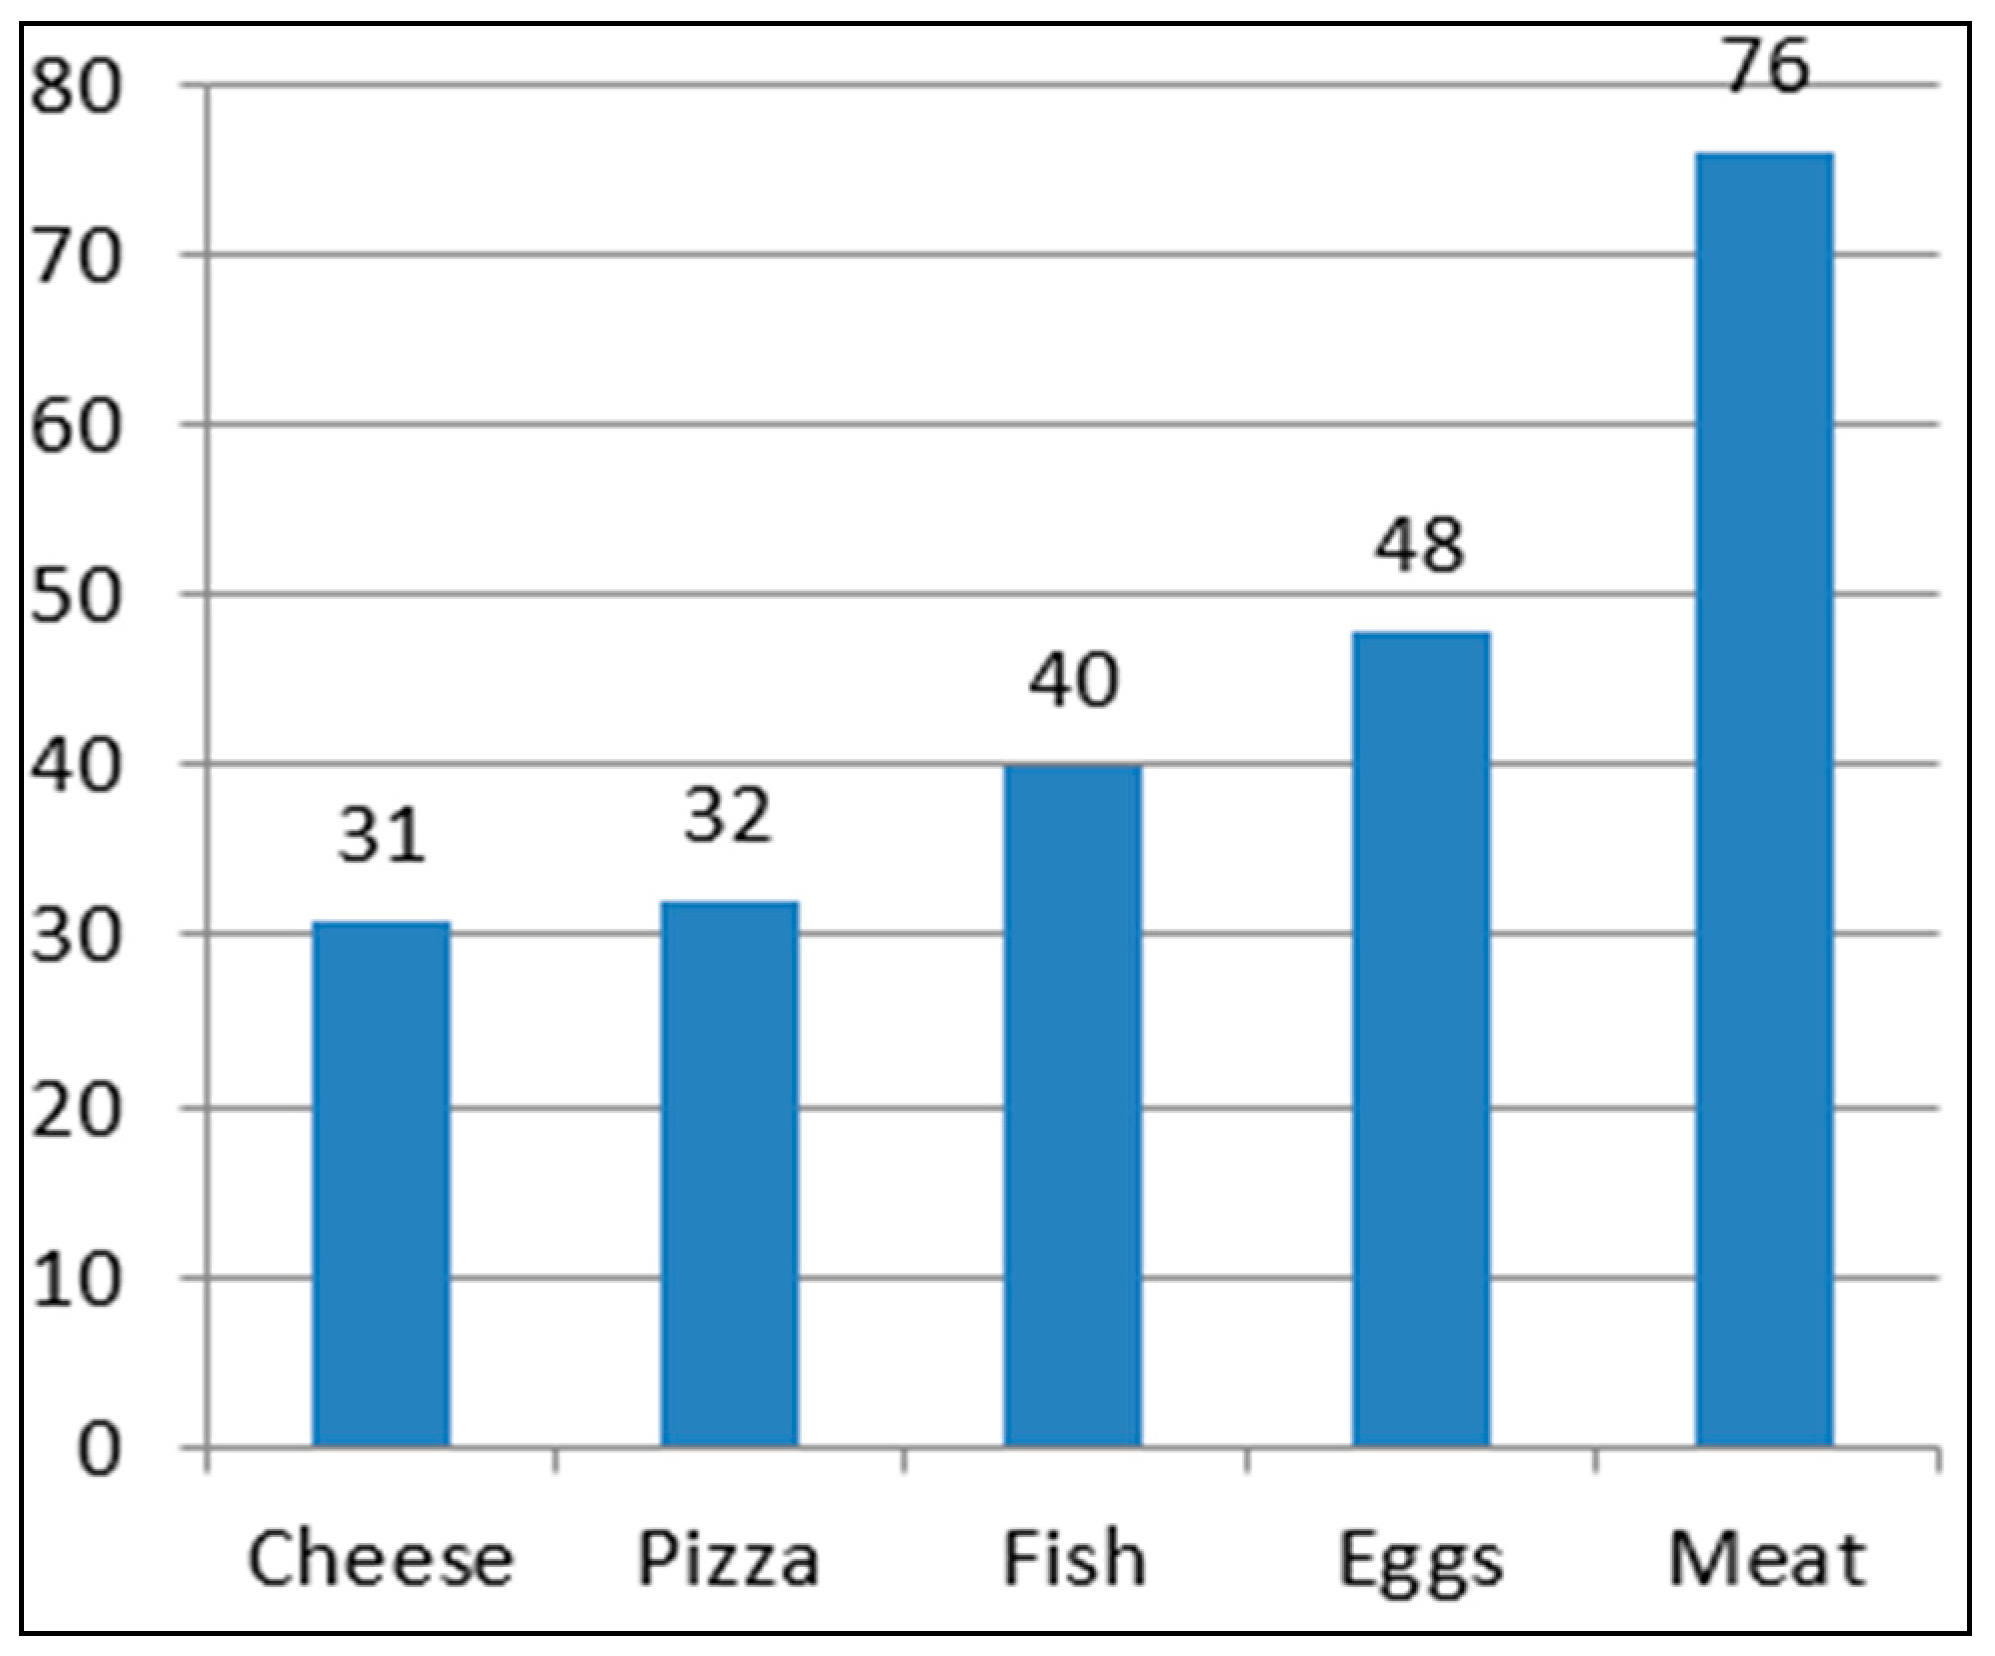
With regard to the main courses, cheese presented the lowest number of unserved portions (31), followed by pizza (32) and fish (40). Eggs (48) and meat (76) had the highest number of unserved portions (see
Figure 4). Also in this case attendants reported that students used to eat those dishes rather frequently at home.
Food efficiency can be based on the composition of daily menus as well. The winter menu, which included pizza accompanied by meat, or cheese and raw vegetables, reported the lowest percentage of waste and hence, it was the most efficient. In this composition vegetables showed a lower surplus, while bread reported a higher number of unserved portions. The significant surplus of bread can be explained by the presence of pizza––an alternative––in the same menu. The quantity of bread served together with pizza did not change owing to the procurement specifications that were provided for standard rations for each type of product (see
Table 4).
Figure 4.
Average number of unserved portions of main courses (per day).
Figure 4.
Average number of unserved portions of main courses (per day).
Table 4.
Comparison between the more and less efficient compositions in the winter menu (kg and number of unserved portions).
Table 4.
Comparison between the more and less efficient compositions in the winter menu (kg and number of unserved portions).
| Winter Menu |
|---|
| | Composition | Processed Food | Unserved Food | Inefficiency Index |
|---|
| Total kg (November to March) A | Average kg Per Day | Average portions Per Day | Total kg (November to March) B | Average kg Per Day | Average Portions Per Day | B/A (%) |
|---|
| More Efficient | Entrée | Pizza margarita | 249.6 | 62.4 | 520 | 8.89 | 2.22 | 19 | 4 |
| Main course | Ham steak | 268.8 | 67.2 | 560 | 7.75 | 1.94 | 16 | 3 |
| Side dish | Raw vegetables | 249.6 | 62.4 | 520 | 37.14 | 9.29 | 47 | 15 |
| Fruit | | 305.4 | 76.35 | 509 | - | - | - | 0 |
| Bread | | 162.88 | 40.72 | 509 | 44.38 | 11.10 | 139 | 27 |
| Less Efficient | Entrée | Risotto with vegetables | 416 | 104 | 520 | 135.17 | 33.79 | 169 | 32 |
| Main course | Turkey escalope with sage | 249.6 | 62.4 | 520 | 37.05 | 9.26 | 77 | 15 |
| Side dish | Green beans with oil | 249.6 | 62.4 | 520 | 53.80 | 13.45 | 112 | 22 |
| Fruit | | 305.4 | 76.35 | 509 | 2.93 | 0.73 | 5 | 1 |
| Bread | | 162.88 | 40.72 | 509 | 40.89 | 10.22 | 128 | 25 |
The menu composition with the highest percentages of surplus, and therefore the highest rate of inefficiency, was the one that included risotto with vegetables, turkey escalope, green beans, and bread.
In the menu with tortellini in broth (one of the entrées with the lowest share of waste), boiled beef showed the highest surplus among the main courses at 84.63 kg, corresponding to 705 portions. Considering that tortellini broth is prepared with beef, the latter should be processed differently, in order to be more attractive.
In the summer menu one of the more efficient menus included pizza combined with a cold cut or cheese and raw vegetables. In this case bread waste was lower than in the winter period because of the smaller amount of product delivered to the canteen.
An additional similarity between the two seasonal menus is related to the combinations of dishes presenting the highest amount of unserved portions. The two combinations present rather similar food preparations: cold rice with vegetables, sliced turkey, and tomatoes for the summer menu and rice with vegetables, turkey escalope, and green beans for the winter menu (see
Table 5).
Table 5.
Comparison between the more and less efficient summer menu (kg and number of unserved portions).
Table 5.
Comparison between the more and less efficient summer menu (kg and number of unserved portions).
| Summer Menu |
|---|
| | Composition | Processed Food | Unserved Food | Inefficiency Index |
|---|
| Total kg (April to May) A | Average kg per Day | Average Portions per Day | Total kg (April to May) B | Average kg per Day | Average Portions per Day | B/A (%) |
|---|
| More Efficient | Entrée | White pizza with grana | 62.4 | 62.4 | 520 | 4.10 | 4.10 | 34 | 7 |
| Main course | Mozzarella | 67.2 | 67.2 | 560 | 1.58 | 1.58 | 13 | 2 |
| Side dish | Raw vegetables | 62.4 | 62.4 | 520 | 14.90 | 14.90 | 75 | 24 |
| Bread | | 40.72 | 40.72 | 509 | 14.02 | 14.02 | 175 | 34 |
| Less Efficient | Entrée | Rice with vegetables | 208 | 104 | 520 | 44.27 | 22.14 | 111 | 21 |
| Main course | Sliced turkey with rosemary | 124.8 | 62.4 | 520 | 31.15 | 15.58 | 130 | 25 |
| Side dish | Tomatoes | 124.8 | 62.4 | 520 | 9.37 | 4.69 | 39 | 8 |
| Bread | | 81.44 | 40.72 | 509 | 6.43 | 3.22 | 40 | 8 |
In the analysis of the performances of the selected schools, the highest surplus per student (
i.e., the lowest degree of efficiency) was recorded in Primary School 2, which had almost 15 kg of waste per capita. Secondary School 2 followed with 14.5 kg of waste per capita; Primary 3 and Primary 1 with 14 kg; Secondary 3 with 10.5 kg and Secondary 2 with 9 kg (see
Table 6). Food waste in Secondary Schools 3 and 1 was significantly lower than in the other institutions. This difference could be related to the fact that the two schools are located in one of the lower-income neighborhoods of Verona. As reported by the teachers during the interviews, for some of the students, lunch at the canteen was the only complete meal of the day.
Table 6.
Comparison among the six case studies: inefficiency index per school.
Table 6.
Comparison among the six case studies: inefficiency index per school.
| School | Processed Food | Unserved Food | Inefficiency Index |
|---|
| Total kg (November to May) A | Average kg Per Day | Total kg (November to May) B | Average kg Per Day | B/A (%) |
|---|
| Primary 1 | 6515 | 52.12 | 1371.33 | 10.97 | 21.05 |
| Primary 2 | 6512 | 52.09 | 793.13 | 6.35 | 12.18 |
| Primary 3 | 6514 | 52.12 | 2224.01 | 17.79 | 34.14 |
| Secondary 1 | 6517 | 52.14 | 296.54 | 2.37 | 4.55 |
| Secondary 2 | 6512 | 52.10 | 1219.09 | 9.75 | 18.72 |
| Secondary 3 | 6512 | 52.09 | 609.51 | 4.88 | 9.36 |
4. Discussion: The Causes of Food Waste
This paper highlights the relevance of food waste as defined in the case study. Unserved food amounts to 15% to 16% of the total amount of food delivered to the six schools under analysis. Food waste causes are numerous and diverse [
25]; however, students’ and households’ lack of attention to dietary habits has to be included among the most relevant ones (see
Table 7). Teacher interviews suggested that the majority of students consume packaged sweet and salty snacks, as well as sweetened sparkling beverages, during the mid-morning break. This type of food, which is not included in the healthy and balanced diet suggested by the Ministry [
23], is often characterized by a high caloric content that affects the energy balance and often leads to a loss of appetite at lunchtime [
33]. According to the interviews, during the lunch meal, students having packaged snacks and sweetened sparkling beverages during the mid-morning break consumed less food than students who had different types of food during the break. Therefore, results suggested that a significant group of students refused food because of a sense of satiety felt at the beginning of lunch.
An additional cause of food waste in school catering is related to the menu composition. A representative case is the menu including both bread and pizza; these are alternative products and should not be served in the same menu. A corrective action to prevent food waste could be avoiding the presence of alternative products in the same menu, as shown by the data.
A further element is the rigidity of the procurement specifications that set a fixed quantity for each product. Daily observations led to the identification of a number of critical situations. For instance, in the case of pizza and bread served together, food waste reduction could be ensured by adjusting bread quantities.
In some cases, it may be relevant to address the way food is presented. Boiled meat presents a significant level of inefficiency but it is also a basic ingredient for the preparation of tortellini (pasta), a dish with one of the lowest number of unserved portions. Despite the evidence, no corrective measures have been taken by the catering service. Beside these specific factors, there is also a general lack of tools to adjust system inefficiencies. Throughout the study period, the same menus were characterized by similar levels of waste. The rigidity of procurement specifications and the extremely limited flexibility in adjusting the different food preparations reduced the possibility of identifying actions based on students’ consumption habits. The introduction of corrective measures produced significant results in terms of improved managerial efficiency. The case of fruit distribution provides significant evidence: the remaining fruit was distributed to students as snacks during the afternoon. An additional example is the case of bread, where the revision of the purchased quantity resulted in a significant reduction of the amount of leftovers.
These interventions can be classified as preventive measures. The EU Waste Framework Directive [
34] identifies a “waste hierarchy” based on five steps, ranked according to their environmental impact: prevention, reuse, recycling, recovery, and disposal. Prevention is clearly the primary objective, while the other options should be considered in the order indicated by the EU Directive. An alternative measure for managing the food waste remaining after the adoption of the necessary prevention strategies––as indicated in the case study identification section is represented by the recovery model based on the proximity principle designed and implemented by LMM.
Table 7.
Food waste drivers in school catering.
Table 7.
Food waste drivers in school catering.
| Food waste driver | Description |
|---|
| Menu composition | Some menus present products with similar characteristics (i.e., bread and pizza) that should be considered as alternative dishes |
| Rigid procurement practices | The standard quantity of each food product cannot be easily modified |
| Lack of attention to dietary habits | Families do not pay attention to balanced dietary habits |
| Meal presentation | Food is presented in an unattractive manner |
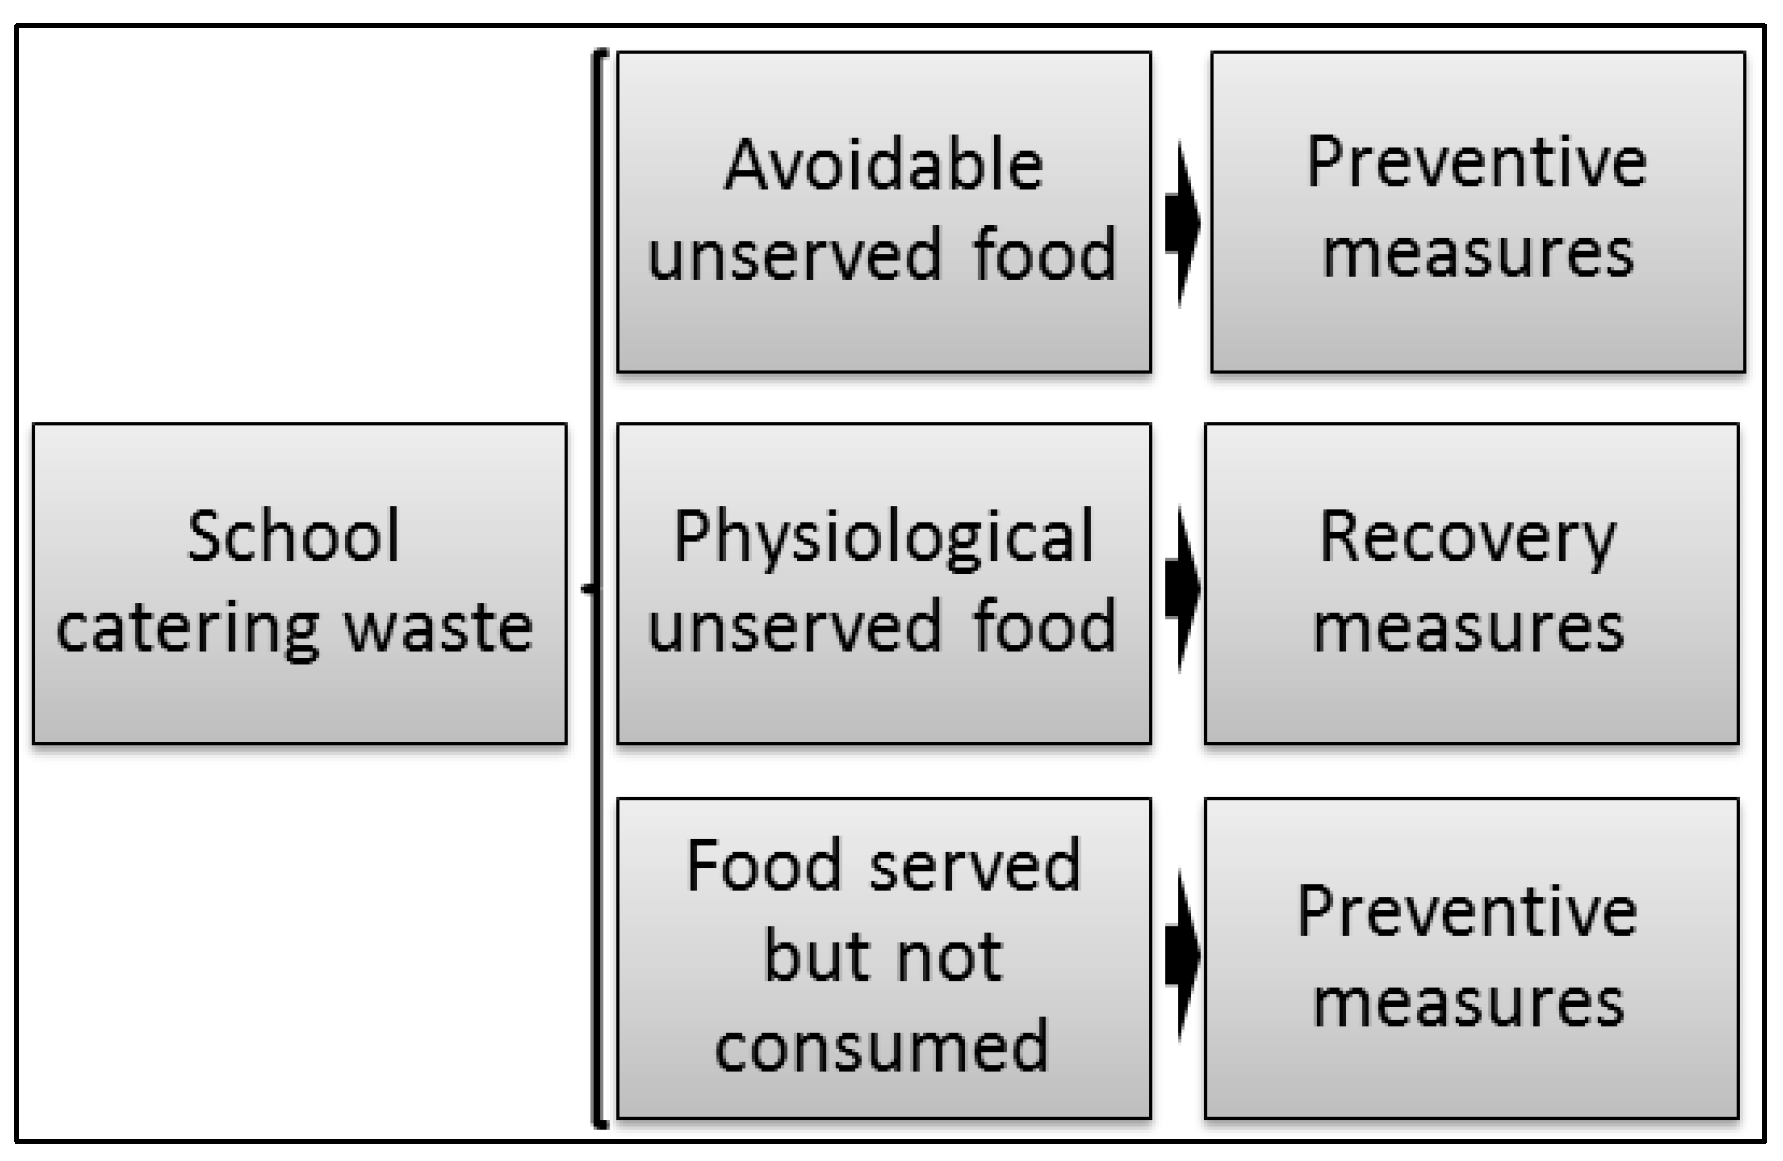
In light of the data that have been collected, school catering food waste might be divided in three categories (see
Figure 5):
- (a)
“avoidable” unserved food––unserved food thrown away because there is a lack of attention to dietary habits, limited flexibility in procurement, food is presented in an unattractive manner, or there are alternative products on the same menu;
- (b)
“physiological” unserved food––unserved food, cooked in excess to ensure some extra portions to satisfy any possible requests for additional food, for facilitating the portioning activity;
- (c)
food served but not consumed––waste arising from food served during the catering service but not completely consumed by students (dish leftovers).
In conclusion, as discussed above, from the point of view of food waste reduction, on points (a) and (c) it is possible to intervene with preventive measures, while on point (b) it is possible to intervene with recovery measures.
Figure 5.
Typology of school catering waste, and corrective measures.
Figure 5.
Typology of school catering waste, and corrective measures.
5. Conclusions
The work identified a significant level of inefficiency in the school catering service, measured as the amount of food processed and still perfectly edible but not served. The volume of food waste represented about 15.3% (6523.35 kg) of the total processed food. In other terms, 64 complete meals and 62 incomplete meals were wasted each day.
Among the causes identified in this study, four of them are more relevant than others because of their implications and impact on prevention: lack of attention to dietary habits, rigid food procurement specifications, menu composition, and meal presentation.
In order to increase catering efficiency, the study suggested an integrated strategy that involves the catering service and other key stakeholders such as families and local and national administrations. On the catering side, the research showed the need for at least two types of intervention: reduction of the rigidity of standard rations for each food type, to adjust the quantity of food when it is excessive; and revision of the menus to avoid alternative products being served on the same menu.
An additional measure to increase efficiency is represented by information campaigns aimed at improving dietary habits so as to decrease the consumption of products with high caloric content, such as sweet and salty snacks and sparkling beverages, which were identified as one of the reasons why students refuse meals.
Prevention alone is not sufficient to achieve an optimal allocation of resources; it should be integrated with recovery mechanisms to intervene and adjust the additional failures of the catering system. The work showed that a food recovery intervention model could lead to higher efficiency and to an economic use of resources, and therefore to an allocation of resources that does not allow for further improvements. Finally, the study suggested the need for further academic investigations into the different––and interrelated––dimensions of food waste including economic, environmental, nutritional, sociocultural, and technological aspects.


