Abstract
While partial energy transitions have been observed in the past, the complete transition of a fossil-based energy system to a sustainable energy one is historically unprecedented on a large scale. Switching from an economy based on energy stocks to one based on energy flows requires a social paradigm shift. This paper defines Sustainable Energy Transition (SET) and introduces a set of five propositions that prescribe its sustainability. The propositions are comprehensive, spanning environmental constraints, resource availability, equity, and the transition dynamics from an energy and economic accounting perspective aimed at addressing all three pillars of sustainability. In order to rigorously define the constraints of SET a theoretical energy economy framework is introduced along with the concept of the renewable energy investment ratio. The paper concludes with a practical application of the SET propositions on the global energy system and identifies an order of magnitude underinvestment in the renewable energy investment ratio in comparison to the estimated level needed for a controlled transition that satisfies all propositions. The option of drastically increasing this ratio in the future may not be available as it would reduce societally available energy, imposing unacceptably high energy prices that would induce either fossil resource extraction beyond the safely recoverable resources or energy poverty.
1. Introduction
The successful completion of a sustainable energy transition (SET) is a defining moment for the long-term sustainability of societies based predominantly on resource-limited fossil fuels. It marks the transformation of an economy based on (depleting) energy stocks to an economy based on renewable energy flows. The former is limited by extraction capacity in the short term but exhibits ample margins to increase power availability before the peaking of the resource; while the latter has a hard power limit—the yield of the extant renewable energy generation capacity at given environmental conditions plus any storage capacity. While there is a substantial volume of discussion on the impacts of fossil fuels on environmental sustainability and there is an increasing amount of proposals for the possibility to maintain industrialized societies on renewable energy, limited attention has been paid on the large-scale dynamics of the transition and especially on quantifying the investment required to complete a SET in energy terms.
This paper provides a formal definition of sustainable energy transitions, presents a quantitative formulation of the sustainability conditions for a SET—highlighting the energy balance and economic coupling of the transition, and discusses the primary dynamics of SET for the case of a closed energy economy (relevant for a global SET).
1.1. Theories of Energy Transitions
There is no experience for a large scale SET as no modern society has yet to undertake one. Past energy transitions were never absolute in primary energy resource terms. For example, while it is commonly perceived that the fossil fuel era has supplanted the use of biomass, traditional biomass remains a significant primary energy resource exceeding nuclear primary energy [1] on a global scale. The same is true for the transitions from coal to petroleum and natural gas. In other words, the transitions occurred in certain economic sectors (e.g., there are no commercial coal steam ships or rail locomotives) but the resource remained in use in other sectors (electricity) due to price and availability. Even this partial transition needed 100 years of innovation and more than 50 years of diffusion to scale sufficiently [2].
The study of historical energy transitions is a fairly nascent field. Grubler [3] identifies three key insights:
- (1)
- Energy end-use capacity, as a rule, is much larger than generation capacity. This means that transitions in energy services are able to lead the energy supply transitions. It also means that the energy using equipment stock may create lock-in for the energy supply.
- (2)
- Energy transition rates vary across nations—they are usually slower in large, developed economies but faster in smaller ones—which by implication have a smaller, less extensive infrastructure.
- (3)
- The patterns of energy transitions are similar to generic s-curve technology diffusion processes (cf. [4,5]): a long experimentation phase with limited uptake, emergence of dominant design(s) that slowly move upward from niche to general adoption, a parallel move down the cost curve through standardization, scale and network economies, and eventual spreading from the lead innovation adopter countries to the periphery countries.
Economic theory anticipates that energy transitions should be smooth, relying on the switching between substitute goods as scarcity of one resource raises its cost and drives the utilization of another similar to the past partial energy transitions. However, empirical evidence corroborate that complexities in the energy system (further discussed in Section 2) create significant inertia in the price-response mechanism with, for example, oil prices exhibiting non-linear behavior with regard to diminishing energy return on energy invested [6,7]. This non-linearity and inertia in the energy system behavior poses an important policy problem on the global and regional scale as policy intervention is required to address the potential of market failure in a successful energy transition additionally bounded by climate change considerations [2].
1.2. Energy Transition Cases
While individual countries like Germany and Denmark have included energy transition in their explicit policy objectives (e.g., the Energiewende policy as described by [8]), the goals and pacing of the transition were arbitrarily set and they are certainly not representative globally.
The Dutch research group DRIFT has run an extensive study of energy transitions and its potential long-term impacts on the society and overall sustainability, including a multi-level model for innovation [9]. Country-level transitions and their societal implications [10] are further extended to policies [11], infrastructures [12], and the energy system as a whole [11]. Raven [13] extends the qualitative study on the implementation side by proposing a project management method for implementing a successful energy transition. This conceptual framework developed by DRIFT researchers for the Netherlands is also applied for the case of Greece [14].
The qualitative work of the DRIFT research group is valuable for describing the sustainability of the energy transition, as it encompasses a lot of key aspects of that need to align for SET, including policies, institutions, research and innovation, infrastructures, ecology and others [15].
1.3. Approach and Outline of the Paper
This paper complements the qualitative assessments discussed previously by proposing a rigorous, quantitative, framework for assessing the sustainability of energy transitions with significant novel additions that relate the transition to the economic domain. This perspective can help guide large-scale energy planning by evaluating the specific pace of the transition grounded in the reality of the actual constraints as opposed to arbitrary targets. In other words, it can explain why a renewable energy target should be set at a given level—something that cannot be assessed conventionally given the market failures in pricing fossil fuel depletion and climate constraints, as outlined in Section 2.
In order to ground the concept of energy transitions, Section 2 develops a framework for describing the basic interactions between the energy and economy. The framework draws from concepts of system dynamics energy models in order to provide a simplified but comprehensive description of the energy economy system in concise equations using energy as the reference unit. Section 3, uses the energy economy framework to present and rigorously define the five propositions of SET. Finally, Section 4 provides a first attempt at applying the SET propositions in the context of the global energy system using aggregate approximations for both energy sources (fossil fuels and renewables) estimating the sufficient level of the renewable energy investment ratio under different assumptions.
2. Framework and Terminology for Energy Transitions: A Broad View of the Energy Economy System
Conventional economists do not readily recognize the tight coupling between energy and the economy primarily because of the perceived abundance of fossil fuels that has allowed energy to be considered a necessary economic factor of production but in sufficient reserve quantities, that, like oxygen, can be accessed as necessary. This fallacious perception has been showcased by several energy researchers [16,17,18,19], which place energy flows at the foundation for the operations of open, thermodynamic systems that include the economic system.
Following this view, we adopt an energy-oriented framework that captures the dynamics of energy flows of an economic system in a simple but comprehensive approach. While the emergy concept provides similar perspectives [20,21,22] it uses a more complicated accounting structure basing fossil energy on solar flux thus making the representation of the energy economy system unnecessarily complex for our purposes. Focusing on the energy available for technical transformation (fuel) as opposed to subsistence (food), we identify three main areas critical for modeling the energy transition: fossil energy extraction, renewable energy capacity, and the energy demand system. The framework represents a closed economy (i.e., one with no economic imports/exports) which is a characteristic of the global energy economy system.
The global energy-economy system is complex, exhibiting strong feedback mechanisms. A useful way of visualizing and modeling such systems is system dynamics (SD) [23] with applications on energy systems (e.g., Fiddaman 2002) and global resource metabolism [24]. These models consist of a large number of differential equations and can only be solved numerically through simulation.
Since the aim of this paper is to abstract the basic energy metabolism relations and use them to define the principles that should guide a controlled SET we opt for representing these relations as a small number of equations that can be analytically solved. This approach allows for robust and unequivocal conclusions on the total available energy at the cost of using simplifying assumptions for the solution. Nevertheless, in developing the energy economy framework we use causal loop diagrams for visualizing and qualitatively representing the primary causal links between the key variables. These diagrams act as the logical precursors of the equation development (extensively documented Appendix 1 in Supplementary). As a final step, in order to apply the SET principles in the current global energy system context we use a simple SD model to explore future energy availability scenarios. This model is based entirely on the energy supply equations developed in the framework and the parameters representing forecasts for different fossil fuel reserves, population, energy efficiency and per capita energy demand are exogenously defined (cf. Appendix 2 in Supplementary).
2.1. Fossil Energy Sub-System
Fossil energy is energy stored underground and, for all types of fossil fuels, (coal, petroleum, natural gas) is characterized, in its broader form, by three stocks: the undiscovered reserves, the discovered reserves, and the total resource extracted (cf. Figure 1). Demand and extraction are tightly coupled, but, prior to peaking, the rate of extraction (power) of a finite resource is primarily demand-driven—i.e., it is limited by the amount and utilization of existing demand-side capital infrastructure that can use/combust it (i.e., boilers, internal combustion engines, and turbines as discussed in Section 2.3) than by the availability of extraction capacity (i.e., oil and gas rigs and coal mining equipment). As demand expands lower-quality resources are accessed and, as a result, the marginal amount of energy required for extraction of the same quantity of energy increases as measured by the energy return on energy invested—EROEI [25,26]. In a market system, the marginal energy required for extraction signals the base “price” of the energy resource (e.g., the price of internationally traded crude oil cannot be lower than the production cost of the marginal producers like heavy oil and tar sand extraction in the current energy system) and balances the demand for the resource when compared to alternatives. The actual energy delivered from the fossil fuel subsystem depends on the average EROEI, which is changing at a slower pace (indicated by the double-line delay mark in Figure 1 between marginal and average EROEI).
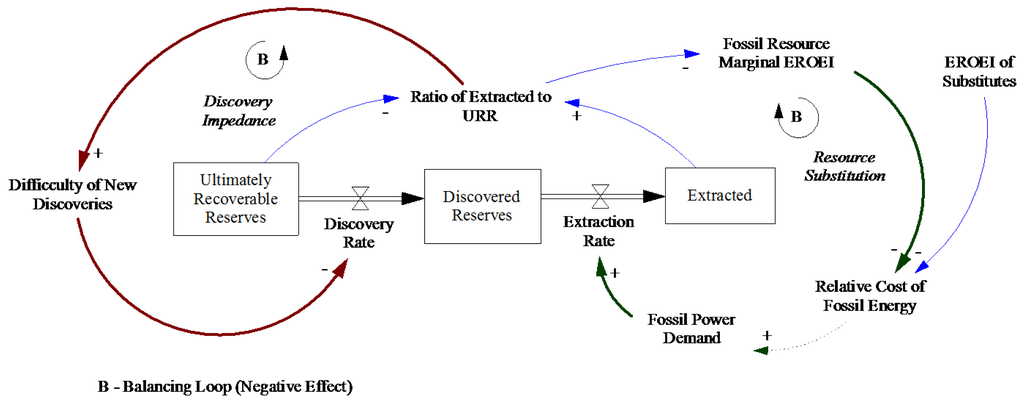
Figure 1.
Fossil energy subsystem.
It is important to note that the slow pace of the demand-side capital investment turnover rate and systemic inertia (primarily because of the financial system) can significantly delay the adoption of alternative resources even if they offer a higher marginal EROEI. Nevertheless, it has been empirically observed that the dynamics between the difficulty of extraction/scarcity of a given fossil resource (the Discovery Impedance balancing loop in Figure 1) and the availability of alternatives/change in the demand-side infrastructure (the “Resource Substitution” balancing loop) reliably create a pattern known as Hubbert curve [27]. When multiple resource types are involved (e.g., land-based crude, deep-sea crude, tight oil, tar sands, etc.), a composite Hubbert curve can also be created [28]. This well-established curve provides a useful first order approximation for the projected extraction rate of the fossil resources.
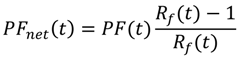
Using the Hubbert model, the cumulative extraction of a finite resource with ultimately recoverable resources (URR) can be considered as following a logistic curve [29]. The instantaneous extraction rate (PF) under this assumption is:
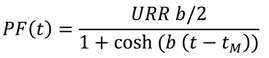 with b constant and tM the year of the peak production. The net primary power (PFnet) of the resource has a net declining average EROEI Rf(t) through a combination of the increase in technological efficiency and the decrease in the quality of the remaining resource [30]. Net primary power can be written in relation to EROEI as:
2.2. Renewable Energy Sub-System
Renewable energy (with the exception of biomass) acts as an energy extender—it allows an upfront energy investment to provide energy returns (equal to the EROEI times the initial investment) over the lifetime of the installation as shown graphically in SD notation in Figure 2.
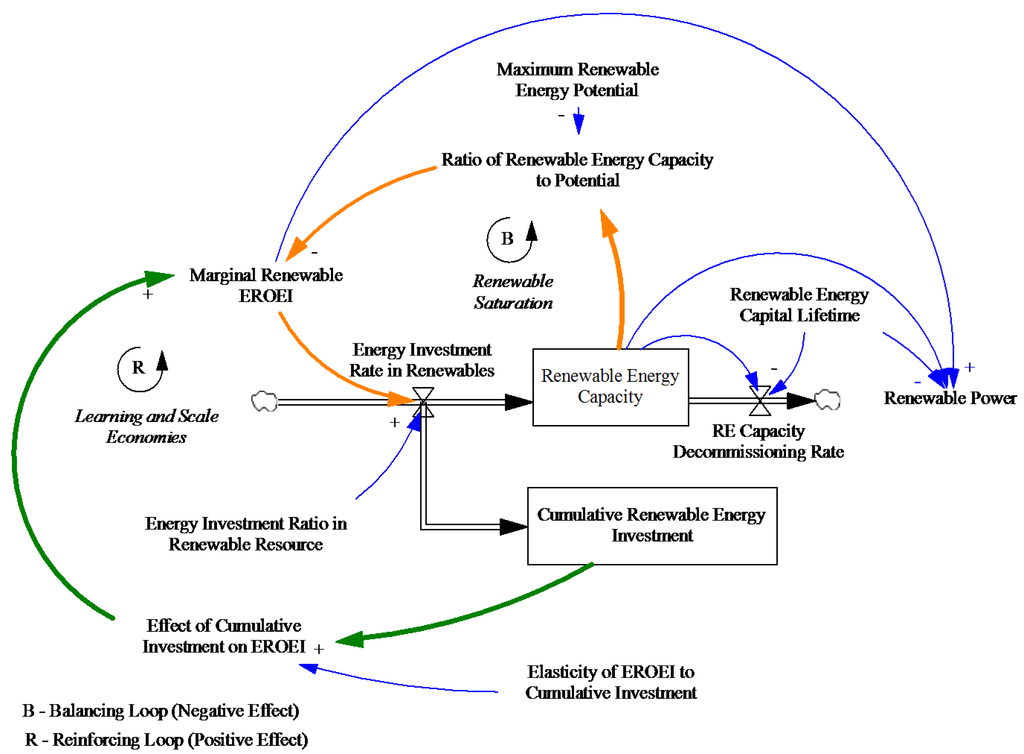
Figure 2.
Renewable energy subsystem.
Renewable energy generation is dependent on the cumulative capacity that has been built since the time that the first renewable energy infrastructure was installed (t0) minus the capacity that has been decommissioned at the end of its lifetime L (Equation (3))—i.e., the existing stock of renewable energy generating capacity. Every period t approximately 1/L of capacity is decommissioned [31], The renewable energy EROEI (Rr) is a composite subject to a reinforcing feedback due to economies of scale and learning and a balancing feedback due to the installation of renewable resources in the prime locations first. Since the absolute maximum renewable energy potential (PRmax) is several orders of magnitude larger than the installed capacity on a global scale (e.g., [32]) we ignore the renewable saturation loop and assume an increasing EROEI (Rr) due to a learning curve with elasticity to installation volume γ (Equation (3)). The two parts of Equation (3) can be combined to form Equation (4) which calculates the amount of renewable power available on average in year t.
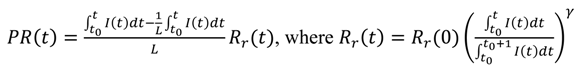
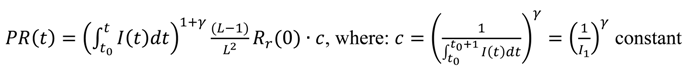
We assume that at the point that a society commences the deployment of renewables on a commercial scale (already happened in our case), the initial R&D and pilot scale phase are complete. We can therefore consider the average EROEI and cost over the first n years, and replace the term Rr(0) · c in Equation (4) with Rr(ñ).
Unlike fossil fuels that need a continuous energy investment stream but also provide immediate energy return, most renewable energy options introduce a significant delay between the time of the investment and its return [33]. In addition, output variability and the cost of energy storage make renewable energy harder to integrate as a dominant resource in a demand-driven energy paradigm. As a result, substantial demand-side infrastructure investment is required to transition to the supply-constrained energy paradigm of SET.
2.3. Energy Economy Sub-system
The energy provided by the two energy subsystems is made available to the economy (PSgross). It is equal to the total production by both renewable energy and fossil resources. This energy though is not fully available to society as a portion must be reinvested in further energy recovery—i.e., building renewable (I) and non-renewable new energy generation infrastructure, with the remainder being available for societal needs—e.g., agriculture, non-energy manufacturing, and services (net social surplus—PSnet). Surplus energy is the key flow that allows a civilization to thrive—it is what permits recreation, experimentation, development and entrepreneurship. In an energy economy representation, we can also identify the portion of PSnet that is invested in building or replacing energy-consuming capital—the infrastructure and equipment that transforms secondary energy into desirable energy services (a flow that we represent as Ib). In equation form, the net social power is captured in Equation (5).
PSnet(t) = PFnet(t) + PR(t) − I(t)
We define the following two characteristic parameters:
- the renewable energy investment ratio (ε)—i.e., the ratio of energy invested in renewable energy generation I(t) over the total primary available energy as shown in Equation (6), and
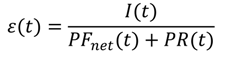
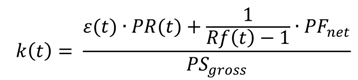
- the energy cost ratio (k)—which is the marginal energy investment cost weighted by energy output. It combines the energy cost of finite energy resources (summarily represented by the ratio of energy invested in fossil extraction to net available) that exhibits the desired non-linearity as Rf(t) tends to 1 plus the ratio of the available energy that is directed to renewable energy investment (ε(t)) as shown in Equation (7).
Populating Equation (5) by combining Equations (1), (2), (4) and (6) and assuming that ε(t) = ε constant after the algebraic transformation shown in Appendix 1 we get a recursive equation for the supply-side of the societally available primary energy PSnet (Equation (8)).

Equation (8) represents the net energy available from fossil and renewable sources in a way that is agnostic to final energy use. This is a simplification based on the assumptions that (i) the energy consuming capital—further discussed below—is retrofitted or replaced in order to utilize the available forms of energy; (ii) sufficient storage and demand side management methods utilize renewables fully despite their variability; and (iii) the resources are adjusted for varying energy quality over time—similar to the process described by Wall [34].
Viewed from the demand-side, energy consumption depends on the size and utilization of the energy consuming capital stock (i.e., infrastructure like roads, railways, buildings, etc. as well as equipment—e.g., vehicles, appliances, chillers etc.). In turn, the size and vintage of the energy consuming stock is dependent on the past investment (Ib) and the associated final energy services capacity of the constructed energy-consuming capital (D)—a measure of the final energy capacity that is added per unit of investment. The vintage of the energy consuming capital stock impacts primary energy demand as it changes the technologically dependent conversion efficiency (n) of primary energy to final energy services [35],The cumulative active installed capacity on the demand side can then be described as the difference between the cumulative installed capacity minus the cumulative depreciated capacity (Equation (9)).
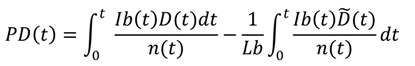
Utilization of the stock (u) measures the ratio of time that the stock operates at nominal power and is dependent on the elasticity of the demand for energy with regards to effective energy prices (Equation (10)). As a result it is dependent on the market price p of the available energy. In the case of an unconstrained free market for energy, the price p would be monotonically correlated to ratio k (cf. Equation (7)) for a given level of energy demand. In practice, the energy market can be regulated to incorporate externalities associated with the use of a certain resource (e.g., emissions taxes and caps) or, conversely, subsidized. Internalization of externalities increases the effective price (p > k) constraining the utilization of available energy.
PSnet(t) = PD(t)u[p(k,t)]
Rising energy prices (p) reduce the consumption of surplus energy, but also trigger the retirement of inefficient capital stock and its replacement with improved alternatives (increasing the average energy conversion efficiency). In addition, they incentivize the exploration of alternative generation resources. A significant delay may exist between the rising price of energy and the adoption of alternative energy resources or improving the efficiency of its utilization. The source of this delay can be found in three distinct interactions: (i) the sunk cost in the existing capital infrastructure can make its use more competitive against the option of investing in new, higher efficiency, capital that can use alternative energy resources; (ii) the financial superstructure can mask the true cost of using non-renewable resources through debt issuance; and (iii) the psychological inertia and familiarity with the current energy system can delay adjusting the perception of users and investors regarding future energy availability.
3. Definition of and Propositions for Sustainable Energy Transitions
Having established a framework for an energy-economy system, we can now proceed in defining SET within this framework. As discussed in Section 1, SET differs from past energy transitions on the desired extent but also pace and scale in the replacement of the prior energy sources. Specifically, a SET aims at the full replacement of the fossil fuel resource.
We define SET as: a controlled process that leads an advanced, technical society to replace all major fossil fuel primary energy inputs with sustainably renewable resources while maintaining a sufficient final energy service level per capita. Under this framing, a return to a hunter-gatherer society in a massively depopulated planet cannot be considered as a SET; a SET requires a coordinated transformation of both the energy supply and the energy demand side (economy) while the per capita energy service levels (equity) are sufficiently maintained for the duration and the environmental constraints are met (environment).
To holistically address the sustainability requirements for a SET as briefly described above, we present five propositions, or criteria, that collectively span the environment, society and economy aspects of sustainability (cf. e.g., [36]). Daly [37] proposed three prescriptive principles for sustainable resource management: social, environmental and economic sustainability. This paper formalizes the Daly principles for an energy context and extends them in order to capture the vital causal connections between economic activity, societal functions and energy availability. The five propositions can be outlined as:
- (1)
- The rate of pollution emissions is less than the ecosystem assimilative capacity.
- (2)
- Renewable energy generation does not exceed the long-run ecosystem carrying capacity nor irreparably compromises it.
- (3)
- Per capita available energy remains above the minimum level required to satisfy societal needs at any point during SET and without disruptive discontinuity in its rate of change.
- (4)
- The investment rate for the installation of renewable generation and consumption capital stock is sufficient to create a sustainable long-term renewable energy supply basis before the non-renewable safely recoverable resource is exhausted.
- (5)
- Future consumption commitment (i.e., debt issuance) is coupled to and limited by future energy availability.
In the remainder of this section, we discuss each proposition in the context of the sustainability of the energy economy system deriving rigorous constraints from each.
3.1. Environmental Sustainability of SET
Propositions I and II are directly related to the environmental sustainability of the energy system and are directed respectively to the non-renewable and renewable generation sources.
● Proposition I: The rate of pollution emissions is less than the ecosystem assimilative capacity.
PI considers the environmental constraints that can impose limits to the extraction and use rate of a polluting resource. Emissions from the use of non-renewable, fossil-based energy sources should be contained within the ecosystem’s ability to assimilate them and if they exceed that limit they should not be used or alternatively should be artificially captured and sequestered (CS). While there are multiple pollutants from energy sources, the proposition is of critical significance for greenhouse gas emissions (GHG). PI prescribes that GHG atmospheric concentration is maintained lower than a threshold that, if exceeded, entails large-scale climate disruptions.
As a result, the aggregate emissions from non-renewable resources (i) with emission intensity (ci) may not be the ultimately recoverable resources (URR) but instead the safely recoverable resources (SRR). In other words, even if extraction can continue beyond the SRR towards the URR it would be unsafe, entailing unwarranted risk of intolerable climate change and environmental impacts. In SRR we include the reserves burned without pollution control (ER), plus the amount that can be economically used in systems that capture the pollutants (CS). The existence of CS technology with efficiency (eCS) allows the SRR to be higher but at a cost, as the final available energy is further reduced by the parasitic losses of the CS process. In constraint form, PI is shown in Equation (11).
∑iERi · ci < Cmax
● Proposition II: Renewable energy generation should not exceed the long-run ecosystem carrying capacity nor irreparably compromise it.
Renewable energy sources should only be exploited up to the level that their impact on the ecosystem’s ability to regenerate is not irreversible. While clearly applicable for biomass harvesting for energy purposes, it also can be applicable on other renewable energy flux harvesters (solar panels, wind-turbines, tidal turbines etc.) as their installation can be detrimental to their environment especially when massively scaled. The latter impact the environment as installations but also as in the material resources that are extracted in their lifecycle. For most RE technologies, there are advanced methods of recovering toxic or rare material from the structure at the end-of-life for reuse (e.g., [38,39]) the energy costs of which can be included in the EROEI estimate. As a result, we will focus on the installation impacts.
The estimation of the carrying capacity is not a purely objective exercise, depending on the technology, location and perceived intrusiveness, and research is ongoing to establish upper limits for different renewable resources j (e.g., [32]). Nevertheless, a technology-dependent maximum installed capacity/power level (PRmax) can be assumed, as shown in Equation (12).
PRj(t) < PRj_max
3.2. Societal Sustainability of SET
Reflecting the equity leg of the sustainability tripod, a SET should provide a lower threshold of available energy per capita as described by Proposition III.
● Proposition III. Per capita energy consumption remains above the minimum level required to satisfy societal needs at any point during SET and its rate of change is free of disruptive discontinuities.
P III views societal energy availability from the demand side and effectively tries to ensure that the energy available is not so expensive as to cause economic dislocation. The distributional aspect—how much energy is actually provided on a per person basis—is entirely dependent on the socio-economic system; in a perfectly equal society, this principle would require less total energy to meet than in an unequal society. In more general terms, for an available energy threshold per capita (PDmin) and population size (N) the constraint can be added on the demand side augmenting Equation (9). The addition of an upper limit (lim) in the absolute rate of change of utilization factor u that would cause undue social dislocation if exceeded completes the translation of PIII into Equation (13).
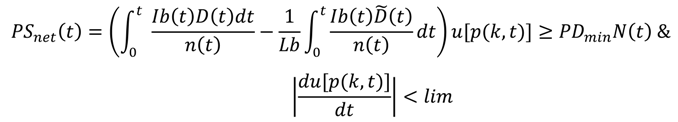
Such a constraint implies that the cost of energy should not reach to a point of demand destruction (reduction in the utilization of energy-consuming infrastructure) that induces energy poverty. Since energy cost k is proportional to the renewable energy investment ratio ε and utilization u is inversely proportional to k (utilization diminishes with higher costs), this constraint creates an upper bound for ε. As the EROEI of fossil fuels rises it causes an increase in the cost k raising price p. Similarly, if there are constraints on fossil fuels due to emissions externalities the energy price p would rise. Either case means that the maximum amount of energy that could be diverted for renewables, as indicated by the sustainable energy investment ratio ε, becomes progressively lower. The same mechanism will also affect the rate of investment in more efficient energy consuming capital (Ib).
3.3. Energetic and Economic Sustainability of SET
The two remaining principles provide the critical conditions for a controlled SET from a physical or thermodynamic perspective. They ensure that the energy and economy system can adjust smoothly to the transition. Focusing on the energy system, Proposition IV indicates the appropriate energy investment rates so that, during a SET, sufficient investment in energy resources occurs to meet societal expectations. Proposition V constrains the economic system from setting up accumulated future commitments (debt) that would be beyond the capacity of the energy system to support.
● Proposition IV: The investment rate for the installation of renewable generation and consumption capital stock is sufficient to create a sustainable long-term renewable energy supply basis before the non-renewable safely recoverable resource is exhausted.
PIV views energy availability from the supply side ensuring that there is sufficient energy available to cover more than the minimum level of societal energy requirements. It does so by monitoring the rate of investment in renewable energy in conjunction with the fossil fuel energy depletion rate. As such, it is a variant of the “Hartwick rule” [40], as it prescribes a minimum renewable energy investment ratio ε for a given renewable installation starting time (t0) that allows sufficient net societally available energy PSnet as fossil fuel production winds down. The actual desired limit can vary and will depend on the conversion efficiency of the energy consuming capital stock in a dynamic interaction with Equation (13) (cf. Principle III). PIV creates a constraint on the energy supply side and is applied on Equation (8).

In other words, PIV is complementing PIII providing a lower boundary for the renewable energy investment ratio ε. The two constraints combined provide an upper and lower threshold for renewable energy investment that preempts the possibility that insufficient investment in renewables at the right time will create a vicious cycle of constantly diminishing energy availability and demand destruction. This dynamic behavior is a form of an energy trap for fossil-dependent industrial societies [41].
● Proposition V: Future consumption commitments (i.e., debt issuance) is coupled to and limited by future energy availability.
This last principle couples the economic system with the realities of a resource constrained-world by limiting the levels of committed consumption as represented by public and private debt issuance (FD) to the future availability of resources. At a very basic level, debt represents the ability of the debt issuer to defer consumption in return for a promise of future consumption at the time debt is repaid. Although, the current financial system is more complicated than this sentence suggests, and a detailed discussion extends beyond the scope of this paper, we note that an important element in both the initiation of SET and its successful conclusion should take into account the financial superstructure [41]. Treating debt solely as a social construct is not sufficient as debt servicing efforts can lead to predatory tendencies that erode both environmental conditions and social norms [42]. Therefore, a smooth energy transition should not rely on hyperinflation or cascading bankruptcies to adjust financial commitments to resource-constraints but should, instead, proactively anticipate such future.
PV is based on the premise that the ability to service new debt requires a proportional amount of energy in the future to fuel the economic engine and create sufficient wealth to pay it off. As a result, we can estimate the energy investment required for future wealth creation by noting the current economy energy intensity and projecting future energy efficiency (n). For a fossil-based society before the peaking of the fossil resource, it was generally possible to easily expand the energy supply sufficiently to service debt (as evidenced by the continuous global economic expansion experienced between 1750 and approximately the year 2000). In a post peak-fossil world this presumption is not valid, as renewable energy and efficiency become the only available means of energy expansion. Therefore, the rate of net debt issuance needs to be proportional to the renewable energy investment ratio and the evolution of the energy intensity of the economy. Energy intensity is the ratio of the value of current consumption (Y) equivalent to GDP and annual energy consumption (E). We can represent this constraint in an equation form for annual debt issuance in year t0 FD(t) as shown in Equation (15) utilizing Equation (4) for the renewable energy generation stream.
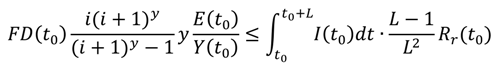
Equation (15) ensures that the energy required to generate wealth equal to the annuity of the debt is sufficiently provided by the investment in renewable energy (I) that occurs in the same time as the debt. In the calculation of the annuity, i reflects the interest rate of the debt minus the expected rate of change in energy efficiency (dn/dt) and y is the number of years to debt maturity. Substituting the key variables using Equation (6), we can write Equation (16).

After the algebraic transformation of Equation (16) and considering ε constant using the same assumption as for Equation (8), we arrive to a constraint for the new debt to GDP ratio based on the value of the renewable energy investment ratio shown in Equation (17).
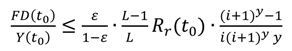
Equation (17) indicates the maximum level of debt at interest rate i (assuming constant energy efficiency n) that can be sustained without write-offs by the energy economy system in a post peak-fossil world for a given renewable energy investment ratio.
In the following section, we present an initial application of the five SET propositions on the current energy economy system and discuss the resulting dynamics.
4. Application of SET Propositions in the Global Energy Transition: Dynamics and Observations
We discuss the implications of each of the five propositions described in Section 3 to evaluate the potential evolution of SET on a global scale. Our intention is to demonstrate how the propositions can inform each other as well as to draw some fundamental conclusions on the desired rate of SET. For simplicity and clarity, in this iteration we use aggregate figures for fossil resources and for renewable energy technologies and, where needed, make assumptions to simplify the dynamic feedback mechanisms of the energy economy system.
Application of Proposition I allows us to provide an estimate for the safely recoverable resources with direct emissions. Estimates for GHG concentrations stabilization targets to prevent catastrophic climate change range from 550 ppm to 350 ppm CO2eq but in either case, long-term stabilization implies reaching a near-zero net rate of anthropogenic emissions (cf. [43]). The fifth IPCC assessment report [44] estimated the upper threshold of anthropogenic carbon emissions should be 4440 Gt CO2 for a fifty percent chance of remaining below 2 °C. This translates into 3010 Gt CO2 when accounting for non-carbon forcings. With estimated cumulative emissions of 1890 Gt CO2 by 2011, a safe emissions budget for the remaining 21st century is 1120 Gt CO2, assuming that the SET is completed by the end of the century.
Proposition II provides a binding constraint when regional SET is discussed especially for regions and countries with disproportionally small geographic area compared to their economies and populations. This is not the case for the global energy system where the estimated upper boundaries of the renewable resources are order of magnitude higher than current energy use (e.g., [32]).
Consideration of Proposition III requires three steps: (i) setting a net available energy per capita threshold; (ii) modeling the evolution over time of the average (fleet) efficiency of the energy-consuming capital stock; and (iii) ensuring that the costs imposed by the energy system do not prevent the utilization of the minimum threshold.
For setting the threshold level, the concept of a 2000 W society (per person) has been proposed as a target for industrialized countries [45] implying a reduction from 50% to 90% of per capita energy consumption from current figures. While this number was originally conceived as gross available energy and does not distinguish the energy investment as does the energy economy framework discussed in Section 2, it is reasonable to adopt it as a minimum net available energy threshold. One significant insight of the transition problem that is directly addressed by the formulation of PIII is that it is not only the absolute magnitude of the energy that matters but the rate at which change happens—particularly when the cost of energy increases inducing demand destruction and social dislocation even if final demand consumption remains higher than the threshold.
Modeling and calibrating the dynamic relationship between energy prices, equipment turnover, technology development and utilization is a complex undertaking. Representing the demand side of the energy economy systems requires modeling the dynamic feedbacks (discussed in Section 2.3) using complex models (similar to Fiddaman 2002 and [24]—an undertaking that extends beyond the scope of this initial analysis. To address this constraint in a preliminary way, we instead bound both the rate of change of the energy cost ratio (k) and the absolute value of k which should not become exceedingly large. We also set the minimum net available power (PSnet) per capita to 2000 W, i.e.,
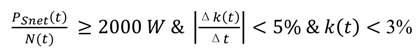
Instead, for this analysis, we focus primarily on the energy supply side for which we can solve numerically using Equation (14) for a given renewable energy investment rate (ε). This simple but powerful approach allows us to clearly show how social energy availability evolves until the end of the century under uncapped and capped carbon emissions constraints for a range of values for ε. We use a numerical simulation model of the global energy system developed from the causal loop diagrams and equations of Section 2.1 and Section 2.2. The model is presented fully in Appendix 2 of the supplementary and is available online [46]. The feedback dynamics discussed in Section 2.3 are represented through exogenous projections. These assumptions, detailed in Appendix 2, include: population levels (mid-line UN projections [47]), technical efficiency of the energy consuming capital (aggressive rate in energy efficiency improvements—almost doubling from 2000 levels by 2100), and significant demand response (15% lower per capita energy demand at the end of the century for BAU).
On the fossil fuel side, there are several estimates for the URR of the primary fossil fuels (oil, coal and natural gas). For the fossil fuel reference we use the best guess estimates by [48] for natural gas, [49] for coal and the two-curve model of [28] for oil. The specific peak year and URR assumptions are shown in Appendix 2. A composite fossil EROEI (Rf) curve based on Gupta and Hall [50] and Gagnon et al. [51] was created for the cases of the uncapped and capped carbon emissions. The analysis extends for one hundred fifty years starting in 1950. Using a similar time-horizon (1940–2100), as a starting point, we estimate the global equivalent renewable energy investment additions (availability adjusted) at 34.3 GW in 2010, while the global fossil power output was 13.4 TW and total power output ~15.8 TW giving a current value for ε of approximately 0.22% [52] (based on data from [53]). As a crosscheck, the same order of magnitude value for ε (0.32%) can be confirmed by using the ratio of renewable energy investment as a proxy ($227 billion USD in 2010) over global GDP ($71 trillion USD in 2010) [54].
We present the dynamic response of the energy economy system for uncapped emissions in Figure 3 and capped emissions as per PI (3010 Gt CO2 total anthropogenic) in Figure 4. The possibility of capture and storage technologies (CCS) could provide additional breathing space between the two options but would be closer to the capped scenario than the uncapped [55] and as a result is not discussed in this first exposition. Three renewable energy investment ratios (ε) targets are evaluated: near BAU (0.375%), S1 (1.5% = 4 × BAU), S2: (3% = 8 × BAU). Average renewable EROEI in the beginning of the SET policy is set to 20, which is pn the higher end of the current portfolio of resources [50], lifetime (L) is set at 25 years, and the learning effect (γ) at 0.07.
Figure 3 demonstrates that even an uncapped carbon scenario implies a significant drop in the per capita available energy for BAU energy investment ratio, barely meeting the 2000 W society when the (ε) is 4× the current. Furthermore, this situation is not in an equilibrium but in a steeply declining slope. In any case, there is a significant overshoot of the PI constraint on carbon emissions. When the carbon constraint is enforced, as shown in the capped scenarios in Figure 4, the ability to cross even the minimum energy threshold is handicapped—only when ε reaches 3% the PIV constraint is satisfied for the 2000 W society scenario. The drastic decline of the energy cost (k) metric in Figure 4 indicates that the actual energy price (p) is dependent on the externality pricing of the carbon emissions that is enforcing the emissions cap.
In order to further demonstrate the effects of delay in renewable energy investment, Figure 5 shows two cases: (i) where the BAU continues until 2050 and then accelerates; and (ii) the sensitivity of the results to the EROEI assumption using Rr = 15. In both cases, it is shown that it is impossible to satisfy PI, PIII and PIV concurrently implying that (i) any delays in renewable energy investment cannot possibly be compensated by late acceleration and (ii) much higher investment rates would be required if the average renewable EROEI is lower.
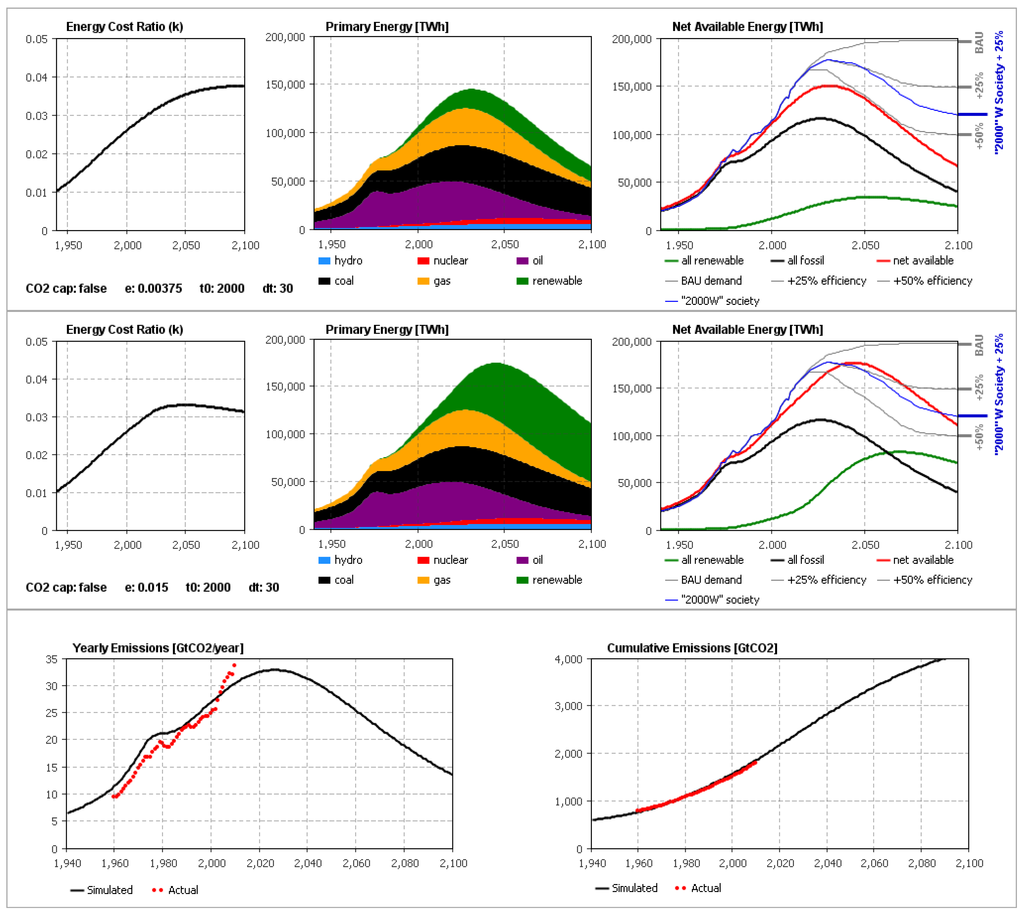
Figure 3.
Primary Energy Supply (Gross, Net, and Energy Cost Ratio) and Carbon Dynamics for Uncapped Carbon Emissions and Variable Renewable Energy Investment Ratios.
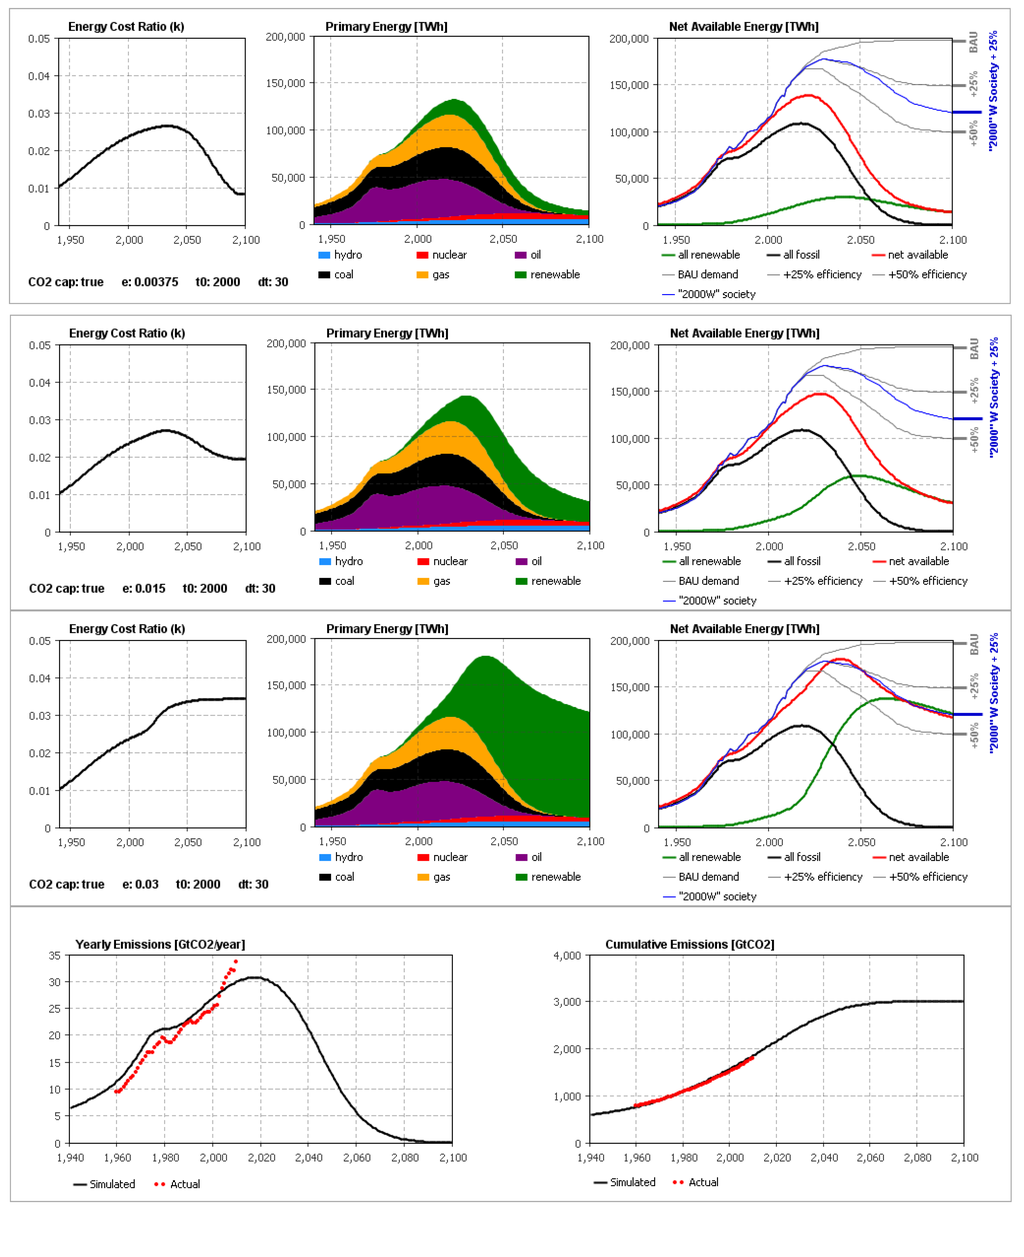
Figure 4.
Primary Energy Supply (Gross, Net, and Energy Cost Ratio) and Carbon Dynamics for Capped Carbon Emissions and Variable Renewable Energy Investment Ratios.
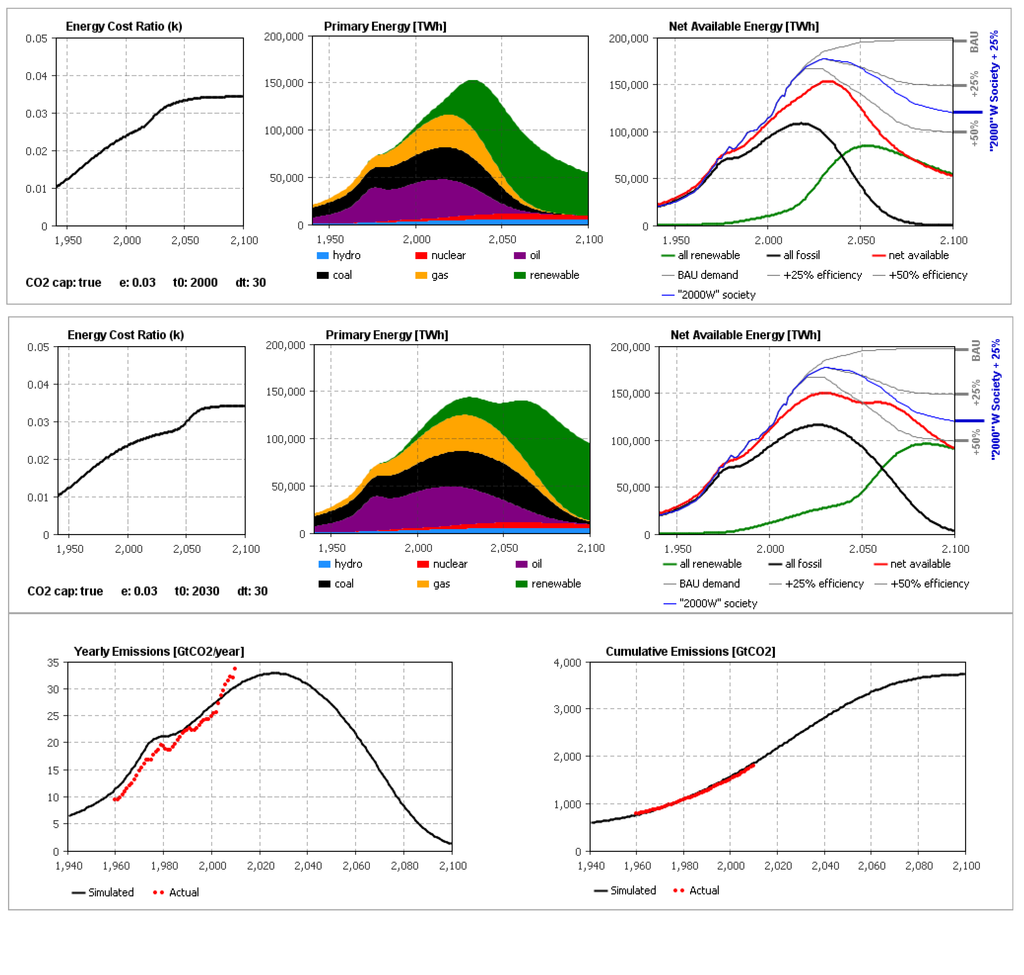
Figure 5.
Primary Energy Supply (Gross, Net, and Energy Cost Ratio) for Capped Carbon Emissions and: (a) EROEI Rr = 15; (b) postponing of ε acceleration until 2050.
Closing the preliminary application of the SET propositions, Proposition V is a prescriptive constraint that ties debt issuance to future energy availability providing a relationship between debt issuance and the energy investment ratio. As such it can be applied in the current setting by solving inequality in Equation (17). Assuming an interest rate of 5% and 20 years to debt maturity, the percentage of new debt to GDP ratio should be lower than 4.5%. A separate analysis of the debt and energy relationship is forthcoming.
5. Conclusions
Experience with historical energy transitions seems insufficient to guide a controlled sustainable energy transition (SET) towards a global zero carbon society in time to prevent catastrophic climate change. Despite strong growth in renewable energy investment in recent years, we demonstrate that significant increase in the renewable energy investment ratio (ε), ranging from 4 to 10 times higher than its current value, is required to meet the constraints imposed by the five SET propositions that we have identified as critical in completing a SET. These propositions holistically cover the sustainability attributes of an energy transition as viewed from the environmental, societal, and economic perspectives.
The environmental side, covered by Propositions I and II, presents limits on the pollutant emissions from the energy resources (mainly fossil fuels) but also on the amount of installed renewable energy capacity. The societal and equity side, represented by Proposition III, limit the perceived energy costs to maintain social functioning and allow citizens to consume above a minimum energy threshold (indicated by the 2000 W limit). This limit can be interpreted as an upper bound on the absolute value and the rate of change of the energy cost ratio (k). This ratio includes both the cost of renewable energy investment (through the renewable investment ratio (ε)) and the energy investment in fossil fuel extraction. As a result, a delayed accelerated response later into the century is barely able to meet the supply-side of energy provision, i.e., it is physically possible to install sufficient available energy capacity to meet the minimum threshold of a 2000 W society by the end of the century but at a cost of severe social dislocation. Energy costs, as represented by the energy cost ratio (k), would reach to values that substantially exceed any previously experienced during the fossil fuelled growth period and could trigger demand destruction if infrastructure investment to allow for the full utilization of the renewable energy supply base is not in place by the time SET matures. The earlier price signals given by a well-timed SET, shown to be the only feasible option in this paper, have the added benefit of instigating the energy-consuming infrastructure transition.
The economic side (in physical and financial terms) is captured by the last two propositions. PIV—the ability to maintain sufficient energy supply—is significantly challenged when a (generous) cap is placed on emissions (3010 Gt CO2 total—which implies a 50% chance of avoiding 2 °C average global temperature increase) while current debt obligations exceed the energy capacity of the energy-economy system to service them without partial default. Dynamic modeling of the energy economy system and disaggregation of the renewable energy sources will be able to further illuminate the possible pathways of the SET evolution.
Acknowledgments
This work was financially supported by the Masdar Institute of Science and Technology and benefitted from conversations with numerous colleagues and of course from the reviewers’ very perceptive comments.
Author Contributions
Sgouris Sgouridis developed the concept and the propositions and wrote the text. Denes Csala developed the model, cross-checked the equation development and wrote the appendices. Sgouris Sgouridis verified the model. Sgouris Sgouridis and Denes Csala developed the scenarios and parameter estimates.
Supplementary Materials
Supplementary materials can be accessed at: http://www.mdpi.com/2071-1050/6/5/2601/s1.
Conflicts of Interest
The authors declare no conflict of interest.
References and Notes
- International Energy Agency (IEA). World Energy Outlook; IEA: Paris, France, 2013. [Google Scholar]
- Fouquet, R. The slow search for solutions: Lessons from historical energy transitions by sector and service. Energy Policy 2010, 38, 6586–6596. [Google Scholar] [CrossRef]
- Grubler, A. Energy transitions research: Insights and cautionary tales. Energy Policy 2012, 50, 8–16. [Google Scholar] [CrossRef]
- Christensen, C. The Innovator’s Dilemma: When New Technologies Cause Great Firms to Fail; Harvard Business Press: Watertown, MA, USA, 1997. [Google Scholar]
- Wilson, C.; Grubler, A. Lessons from the history of technological change for clean energy scenarios and policies. In Natural Resources Forum; Wiley: New York, NY, USA, 2011; Volume 35, pp. 165–184. [Google Scholar]
- King, C.W.; Hall, C.A. Relating financial and energy return on investment. Sustainability 2011, 3, 1810–1832. [Google Scholar] [CrossRef]
- Heun, M.K.; de Wit, M. Energy return on (energy) invested (EROI), oil prices, and energy transitions. Energy Policy 2012, 40, 147–158. [Google Scholar] [CrossRef]
- Rolle, C.; Rendschmidt, D. Transition to Renewables as a Challenge for the Industry—The German Energiewende from an Industry Perspective. In Transition to Renewable Energy Systems; Stolten, D., Scherer, V., Eds.; Wiley-VCH: Weinheim, Germany, 2013; pp. 67–74. [Google Scholar]
- Kemp, R. The Dutch Energy Transition Approach. In International Economics of Resource Efficiency; Bleischwitz, R., Welfens, P.J.J., Zhang, Z., Eds.; Physica-Verlag HD: Heidelberg, Germany , 2011; pp. 187–213. [Google Scholar]
- Verbong, G.; Geels, F. The ongoing energy transition: Lessons from a socio-technical, multi-level analysis of the Dutch electricity system (1960–2004). Energy Policy 2007, 35, 1025–1037. [Google Scholar] [CrossRef]
- Verbong, G.; Loorbach, D. Governing the Energy Transition: Reality, Illusion or Necessity? Routledge: New York, NY, USA, 2012. [Google Scholar]
- Frantzeskaki, N.; Loorbach, D. Infrastructures in transition role and response of infrastructures in societal transitions. Proceedings of the 2008 First International Conference on Infrastructure Systems and Services: Building Networks for a Brighter Future (INFRA).
- Raven, R.P.J.M.; Jolivet, E.; Mourik, R.M.; Feenstra, Y.C.F.J. ESTEEM: Managing societal acceptance in new energy projects: A toolbox method for project managers. Technol. Forecast. Soc. Chang. 2009, 76, 963–977. [Google Scholar] [CrossRef]
- Michalena, E.; Frantzeskaki, N. Moving forward or slowing-down? Exploring what impedes the Hellenic energy transition to a sustainable future. Technol. Forecast. Soc. Chang. 2013, 80, 977–991. [Google Scholar] [CrossRef]
- Smith, A.; Kern, F. The transitions storyline in Dutch environmental policy. Environ. Polit. 2009, 18, 78–98. [Google Scholar] [CrossRef]
- Hall, C.A.S.; Klitgaard, K.A. Energy and the Wealth of Nations: Understanding the Biophysical Economy; Springer: New York, NY, USA, 2011. [Google Scholar]
- Tainter, J.A. The Collapse of Complex Societies; Cambridge University Press: Cambridge, UK, 2004. [Google Scholar]
- Fiddaman, T.S. Exploring policy options with a behavioral climate–economy model. Syst. Dyn. Rev. 2002, 18, 243–267. [Google Scholar] [CrossRef]
- Georgescu-Roegen, N. Energy and Economic Myths: Institutional and Analytical Economic Essays; Pergamon Press: Oxford, UK, 1976. [Google Scholar]
- Brown, M.; Ulgiati, S. Emergy-based indices and ratios to evaluate sustainability: Monitoring economies and technology toward environmentally sound innovation. Ecol. Eng. 1997, 9, 51–69. [Google Scholar] [CrossRef]
- Brown, M.; Herendeen, R. Embodied energy analysis and EMERGY analysis: A comparative view. Ecol. Econ. 1996, 19, 219–235. [Google Scholar] [CrossRef]
- Hau, J.L.; Bakshi, B.R. Promise and problems of emergy analysis. Ecol. Model. 2004, 178, 215–225. [Google Scholar] [CrossRef]
- Sterman, J. Business Dynamics; Irwin-McGraw-Hill: New York, NY, USA, 2000. [Google Scholar]
- Meadows, D.H.; Randers, J.; Meadows, D.L. Limits to Growth: The 30-Year Update; Earthscan: Oxford, UK, 2005. [Google Scholar]
- Murphy, D.J.; Hall, C.A.; Dale, M.; Cleveland, C. Order from chaos: A preliminary protocol for determining the EROI of fuels. Sustainability 2011, 3, 1888–1907. [Google Scholar]
- Brecha, R. Ten Reasons to Take Peak Oil Seriously. Sustainability 2013, 5, 664–694. [Google Scholar] [CrossRef]
- Hubbert, M.K. Nuclear Energy and the Fossil Fuels; Shell Development Company: Houston, TX, USA, 1956. [Google Scholar]
- Maggio, G.; Cacciola, G. A variant of the Hubbert curve for world oil production forecasts. Energy Policy 2009, 37, 4761–4770. [Google Scholar] [CrossRef]
- Cavallo, A.J. Hubbert’s petroleum production model: An evaluation and implications for world oil production forecasts. Nat. Resour. Res. 2004, 13, 211–221. [Google Scholar] [CrossRef]
- Dale, M.; Krumdieck, S.; Bodger, P. Net energy yield from production of conventional oil. Energy Policy 2011, 39, 7095–7102. [Google Scholar] [CrossRef]
- This is strictly true for a steady state when the installed capacity is significantly higher than the installation rate or for t >> (t0+L) but it is a sufficiently accurate approximation for this model
- De Vries, B.J.M.; van Vuuren, D.P.; Hoogwijk, M.M. Renewable energy sources: Their global potential for the first-half of the 21st century at a global level: An integrated approach. Energy Policy 2007, 35, 2590–2610. [Google Scholar]
- Dale, M.; Benson, S.M. Energy Balance of the Global Photovoltaic (PV) Industry—Is the PV Industry a Net Electricity Producer? Environ. Sci. Technol. 2013, 47, 3482–3489. [Google Scholar]
- Wall, G. Exergy conversion in the Japanese society. Energy 1990, 15, 435–444. [Google Scholar]
- To illustrate this concept we can use a simple example for lighting. D is the amount of usable energy services (lumens) that can be produced if we invest Ib in constructing the lightbulb with efficiency n. The primary energy demand of a higher efficiency n* lightbulb (e.g., LED) would be lower all else being equal
- Brown, B.J.; Hanson, M.E.; Liverman, D.M.; Merideth, R.W., Jr. Global sustainability: Toward definition. Environ. Manag. 1987, 11, 713–719. [Google Scholar]
- Daly, H.E. Beyond Growth: The Economics of Sustainable Development; Beacon Press: Boston, MA, USA, 1996. [Google Scholar]
- Fthenakis, V.M. End-of-life management and recycling of PV modules. Energy Policy 2000, 28, 1051–1058. [Google Scholar] [CrossRef]
- Martinez, E.; Sanz, F.; Pellegrini, S.; Jimenez, E.; Blanco, J. Life cycle assessment of a multi-megawatt wind turbine. Renew. Energy 2009, 34, 667–673. [Google Scholar]
- Hartwick, J.M. Intergenerational equity and the investing of rents from exhaustible resources. Am. Econ. Rev. 1977, 67, 972–974. [Google Scholar]
- Sgouridis, S. Defusing the Energy Trap: The Potential of Energy-Denominated Currencies to Facilitate a Sustainable Energy Transition. Front. Energy Res. 2014. [Google Scholar] [CrossRef]
- Graeber, D. Debt: The First 5,000 Years; Melville House: Brooklyn, NY, USA, 2011. [Google Scholar]
- Matthews, H.D.; Caldeira, K. Stabilizing climate requires near-zero emissions. Geophys. Res. Lett. 2008, 35. L04705. [Google Scholar] [CrossRef]
- Stocker, T.; Dahe, Q.; Plattner, G.-K. Climate Change 2013-the Physical Science Basis: Working Group I Contribution to the Fifth Assessment Report of the IPCC; Cambridge University Press: Cambridge, UK, 2013; Volume 4. [Google Scholar]
- Marechal, F.; Favrat, D.; Jochem, E. Energy in the perspective of the sustainable development: The 2000 W society challenge. Resour. Conserv. Recycl. 2005, 44, 245–262. [Google Scholar] [CrossRef]
- The SET model is available online for user access at following link. Sustainable Energy Transitions Dynamic Test Mode—Ecosystem Dynamic. Available online: http://www.runthemodel.com/models/1418/ (accessed on 9 November 2013).
- United Nations (UN). World Population to 2300; UN: New York, NY, USA, 2004. [Google Scholar]
- Mohr, S.H.; Evans, G.M. Long term forecasting of natural gas production. Energy Policy 2011, 39, 5550–5560. [Google Scholar] [CrossRef]
- Mohr, S.H.; Evans, G.M. Forecasting coal production until 2100. Fuel 2009, 88, 2059–2067. [Google Scholar] [CrossRef]
- Gupta, A.K.; Hall, C.A.S. A Review of the Past and Current State of EROI Data. Sustainability 2011, 3, 1796–1809. [Google Scholar] [CrossRef]
- Gagnon, N.; Hall, C.A.S.; Brinker, L. A Preliminary Investigation of Energy Return on Energy Investment for Global Oil and Gas Production. Energies 2009, 2, 490–503. [Google Scholar] [CrossRef]
- The calculation is based on a simple extension of the EROEI definition:
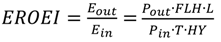 where Pout is nameplate capacity installed in a given year, Pin is the average power representing the energy investment for the production and installation of the nameplate capacity, FLH is full load hours per year, L is lifetime in years, and HY is hours in a year. Solving for Pin and assuming: T=1 year, FLH = 3000 hours, L = 25 years, EROEI and Pout = 113 GW for 2012 (based on a $2/W installation cost and investment of US$227 billion) we find Pin = 34.3 GW. A rough estimate of the total world gross power output is 15.8 TW giving a renewable energy investment ratio for 2012 ε = ~0.22%.
 - McCrone, A.; Usher, E.; Sonntag-O’Brien, V.; Moslener, U. Global Trends in Renewable Energy Investment 2013; United Nations Environmental Program: Nairobi, Kenya, 2013. [Google Scholar]
- The equivalent metric for fossil fuels is $674 billion USD [55] for the declared capital expenses of fossil fuel extraction firms or three times larger!
- Leaton, J.; Ranger, N.; Ward, B.; Sussams, L.; Brown, M. Unburnable Carbon: Are the World’s Financial Markets Carrying a Carbon Bubble; Carbon Tracker Initiative: London, UK, 2013. [Google Scholar]
© 2014 by the authors; licensee MDPI, Basel, Switzerland. This article is an open access article distributed under the terms and conditions of the Creative Commons Attribution license (http://creativecommons.org/licenses/by/3.0/).