Article

Exploring the Impact of Complementary Assets on the Environmental Performance in Manufacturing SMEs

Korea Advanced Institute of Science and Technology, 291, Daehak-ro, Yuseong-gu, Daejeon 305-701, Korea
*
Author to whom correspondence should be addressed.
Sustainability 2014, 6(10), 7412-7432; https://doi.org/10.3390/su6107412
Submission received: 18 July 2014 / Revised: 30 September 2014 / Accepted: 20 October 2014 / Published: 23 October 2014
(This article belongs to the Section Economic and Business Aspects of Sustainability)

Abstract

:
As the impact of small and medium-sized enterprises (SMEs) on the environment increases, there is a need for effective environmental policies to sustain their development. Under this condition, SMEs implement innovation to meet environmental regulations and to achieve environmental competitiveness in sustainability. We examine the impact of environmental innovation on labor productivity in SME manufacturers. The literature shows that complementary assets help SMEs to increase their performance in environmental innovation. Therefore, we study the interactive effects of the SMEs’ business-group affiliation and the listing status on the relationship between environmental innovation and labor productivity. We add these interaction terms to multivariate regressions by using the 2010 Korea Innovation Survey. The results show that SMEs are able to use environmental innovation as a business strategy for green growth with improved labor productivity. Also, the results highlight that the business-group affiliation and the listing status as the complementary assets positively moderate the performance of the environmental innovation of the SMEs.

1. Introduction

The idea of committing to environmentally sound practices has attracted considerable attention associated with small and medium-sized enterprises (SMEs) in the manufacturing industry because these firms generate a large amount of pollution and have a significantly negative effect on the environment [1]. There are three main factors currently affecting the SMEs’ environmental activities: environmental regulations, stakeholders’ pressure, and competitive advantage [1,2,3]. First, environmental regulations can curb pollution levels by motivating or even requiring polluting firms to decrease their emissions [4,5,6]. However, environmental regulations have exhibited limitations regarding both the distribution of environmental technologies to the SMEs and the composition of readily understandable regulations for the SMEs [1,7]. Therefore, research should further examine the effective ways for policy makers to help the SMEs implement environmental management. Second, an increase in the stakeholders’ environmental concerns results in the implementation of environmental practices, even though the level of institutional pressure is different depending on the organizational structure [8,9]. The purposes behind the environmental efforts of SMEs are not only to meet the needs of environmental activities from stakeholders and the regulations but also to achieve a competitive advantage for sustainable development in the emerging green market [2,10,11]. Nevertheless, even in the presence of these motivating factors, SMEs are afraid to implement environmental activities because of lack of resources [1]. In spite of the circumstance, SMEs develop environmental innovation for sustainable development to obtain competitiveness in their future market. In order to successfully motive them to undertake environmental practices, studies are needed that examine the relationship between environmental innovation and performance in SMEs and complementary assets to improve their environmental performance that previous studies have not dealt with. Hence, this study poses the following question:
How Do Complementary Assets Support SMEs to Improve Their Environmental Performance? 
Complementary assets are existing resources that catch the value of other resources or enable firms to obtain the benefits of a practice [12]. Christmann [13] mentioned that complementary assets could moderate the relationship between environmental activities and competitive advantage. This study considers the complementary assets as business-group affiliation and listing on the financial market, because these activities are feasible for SMEs to increase their environmental performance by overcoming their shortcomings [14,15].
With regard to environmental practices, Brammer et al. [16] and Brammer and Pavelin [17] argue that most research have focused on large and listed firms because the environmental performances of these firms can have significant effects on marketplace variables. However, business-oriented empirical studies of the SMEs’ environmental management are few in number. Researchers in this field should fill in this gap by examining the SMEs’ environmental innovation because SMEs account globally for at least 80% of the firms and thus significantly influence manufacturing [18,19]. Some research has found that SMEs frequently have difficulty adopting environmental practices owing to both insufficient resources and limited awareness of the practices’ benefits [16]. By contrast, other research has found that SMEs can strengthen their environmental innovation and practices by sharing resources within private-sector networks and by establishing a degree of flexibility in their organizational structure [20]. The results of our study will contribute to environmental research by focusing on the environmental innovation of SMEs in the manufacturing sector.
As one of the complementary assets in this study, business-group affiliation refers to an association of legal independent firms in various sectors that are connected to each other with formal (e.g., equity) and informal (e.g., family) ties [21]. Some studies discussed the relationship between this norm and corporate performance [22,23]. The affiliated firms can strengthen their own financial performance by reducing transaction costs and by sharing both resources and risks with one another [24,25]. The benefits stemming from business-group structures as complementary assets can also increase the outcome of firms’ environmental innovation [13].
The listing status is whether a firm is publicly traded (listed firm) or privately held (non-listed firm) [26]. The listing status is another complementary factor with which SMEs can improve their environmental performance. Listed firms should clearly disclose their environmental performance to reduce stakeholders’ environmental concerns [27]. That is, such disclosure can increase the transparency of firms’ eco-friendly efforts, thereby helping to establish a good reputation for the firms among their internal and external investors [28]. In this vein, our study extends the environmental research by examining the moderating effects of business-group affiliation and listing status on the relationship between environmental innovation and labor productivity for SME manufacturers.
In terms of the necessity of studying Korean SMEs, there are three distinctive-characteristics compared to SMEs in other countries. First, the role of the SMEs in manufacturing has continuously increased since the late 1970s. In 2010, SMEs accounted for 99.9% of the manufacturing firms and 87.7% of the employment in South Korea’s manufacturing sector [29]. Second, South Korean SME manufacturers have developed their competitiveness according to various methods that target the rapid expansion of capital. For example, these firms have implemented technology upgrades and penetrated international markets. In addition, the firms have undertaken rapid growth with cooperation from large enterprises or business affiliations [30]. Lastly, support from external sources—whether in the private or public sector—has led to the sustainable growth of these SMEs. The South Korean government has supported SMEs with policies geared toward tax relief and resource assistance. The SME R&D Support Plan of 2010, announced by Korea’s Small and Medium Business Administration, exemplifies the kind of help that SMEs have been receiving, which in this case involves the acquisition of advanced technology suitable for eco-friendly emerging markets [29]. Therefore, research on South Korean SMEs can serve as a useful guideline for private-sector managers and public-sector policymakers.
The remainder of this paper is organized as follows. In Section 2, we demonstrate the theoretical background. Section 3 explains the moderating effects with two hypotheses. Section 4 provides our methodology. Section 5 presents our results. In Section 6, we discuss the results of this study and present political and business strategic contributions.

2. Environmental Innovation of SMEs

2.1. Environmental Innovation and Labor Productivity

According to the resource-based view (RBV), firms can achieve competitive advantages, such as cost-reduction and differentiation benefits, by obtaining valuable resources [31]. Hart [32] extended the RBV by suggesting the natural resource-based view (NRBV), which firms can also create new competitive opportunities by applying environmental activities to business practices for sustainable management, such as pollution prevention and product stewardship. In other words, firms can likely increase their corporate performance with these environmental practices in the future. Environmental innovation is one of representative environmental activities, and it works by developing new technologies for reducing pollution or by recycling. For example, hundreds of new patents that are related to this innovation are listed in the US market [33]. Hence, this paper focuses on the impact of environmental innovation on labor productivity. The reason why this paper uses labor productivity instead of other financial performance measures is that environmental innovation not only increases sales through delivering improved service but also environmental process innovation reduces the labor force to produce and deliver products or services [34,35]. Much of the literature has empirically supported the advantages of environmental innovation [36,37,38,39,40]. For instance, Al-Tuwaijri, Christensen and Hughes [36] find that firms increase their economic performance by using pollution-abatement processes and reducing the amounts of toxic waste that result from simultaneous equation models. In addition, Chiou, Chan, Lettice and Chung [38] highlight the potential benefits of environmental innovation by showing how the firms will be able to gain the same entry barriers as their competitors in the future and to reduce the external environmental pressure. The authors claim that these benefits result in a global competitive advantage.
However, there are controversies regarding the relationship between environmental innovation and the corporate performance of SMEs. As a negative perspective, Wilson, Williams and Kemp [1] show that a number of SMEs identify environmental innovation as a financial burden and do not understand the importance of corporate social responsibility (CSR) and environmental performance. With respect to innovative capability, SMEs lack the financial and labor resources to invest in green innovation and technologies compared to those of large companies [16]. Some SMEs might consider the implementation of environmental innovation not as a business strategy for sustainability but as the compulsory requirements of environmental regulation. On the other hand, Lee [18] finds that SME manufacturers have recently been able to achieve a competitive advantage by adopting green management through strategic and organizational changes. Furthermore, SMEs have an organizational advantage because of their flexible structure that can respond to changes in the environment and efficiently communicate to the organization. The SMEs also have a horizontal management style that helps with the adoption of innovative activities [20].
Hence, we empirically examine the relationship between environmental innovation and labor productivity in SMEs since it is still a debatable issue. In the case of South Korea, SME manufacturers are likely to improve their environmental performance through support such as the environmental policies like the Framework Act on Sustainable Development (FASD) and the Framework Act on Low-Carbon and Green Growth (FALCGG) [33].

2.2. Business-Group Affiliation and Labor Productivity

Most of the business literature shows that the institutional framework and the organizational structure influence the competitive advantage and the corporate performance [41,42,43,44]. We specifically investigate the relationship between the business-group affiliation and the corporate performance because independent firms have a different organizational structure from affiliated ones [45]. The results of the relationships still remain inconclusive and tend to depend on the measurement and interpretation of the variables. For example, Gunduz and Tatoglu [46] find that in Turkey, affiliated firms are not significantly different from unaffiliated ones in terms of their economic performance. The market in Turkey is still too small and inefficient to reflect the benefits from business-group affiliations. However, Chang and Choi [24] and Khanna and Palepu [23] find that affiliated firms can increase their rate of return in emerging markets because of the low transition-cost and risk-sharing from an additional affiliation. Affiliated firms within a business group then are able to increase their market-oriented performance by overcoming market inefficiency and reducing their transaction-costs. Even though the literature supports the positive relationship between a business-group affiliation and corporate performance, there is little empirical evidence from directly examining SMEs. If a SME is a member of a business group, then the benefits of the affiliation, such as resource sharing, could be critical in increasing corporate performance which supports the result of previous literature.

3. Moderating Effects on Environmental Performance

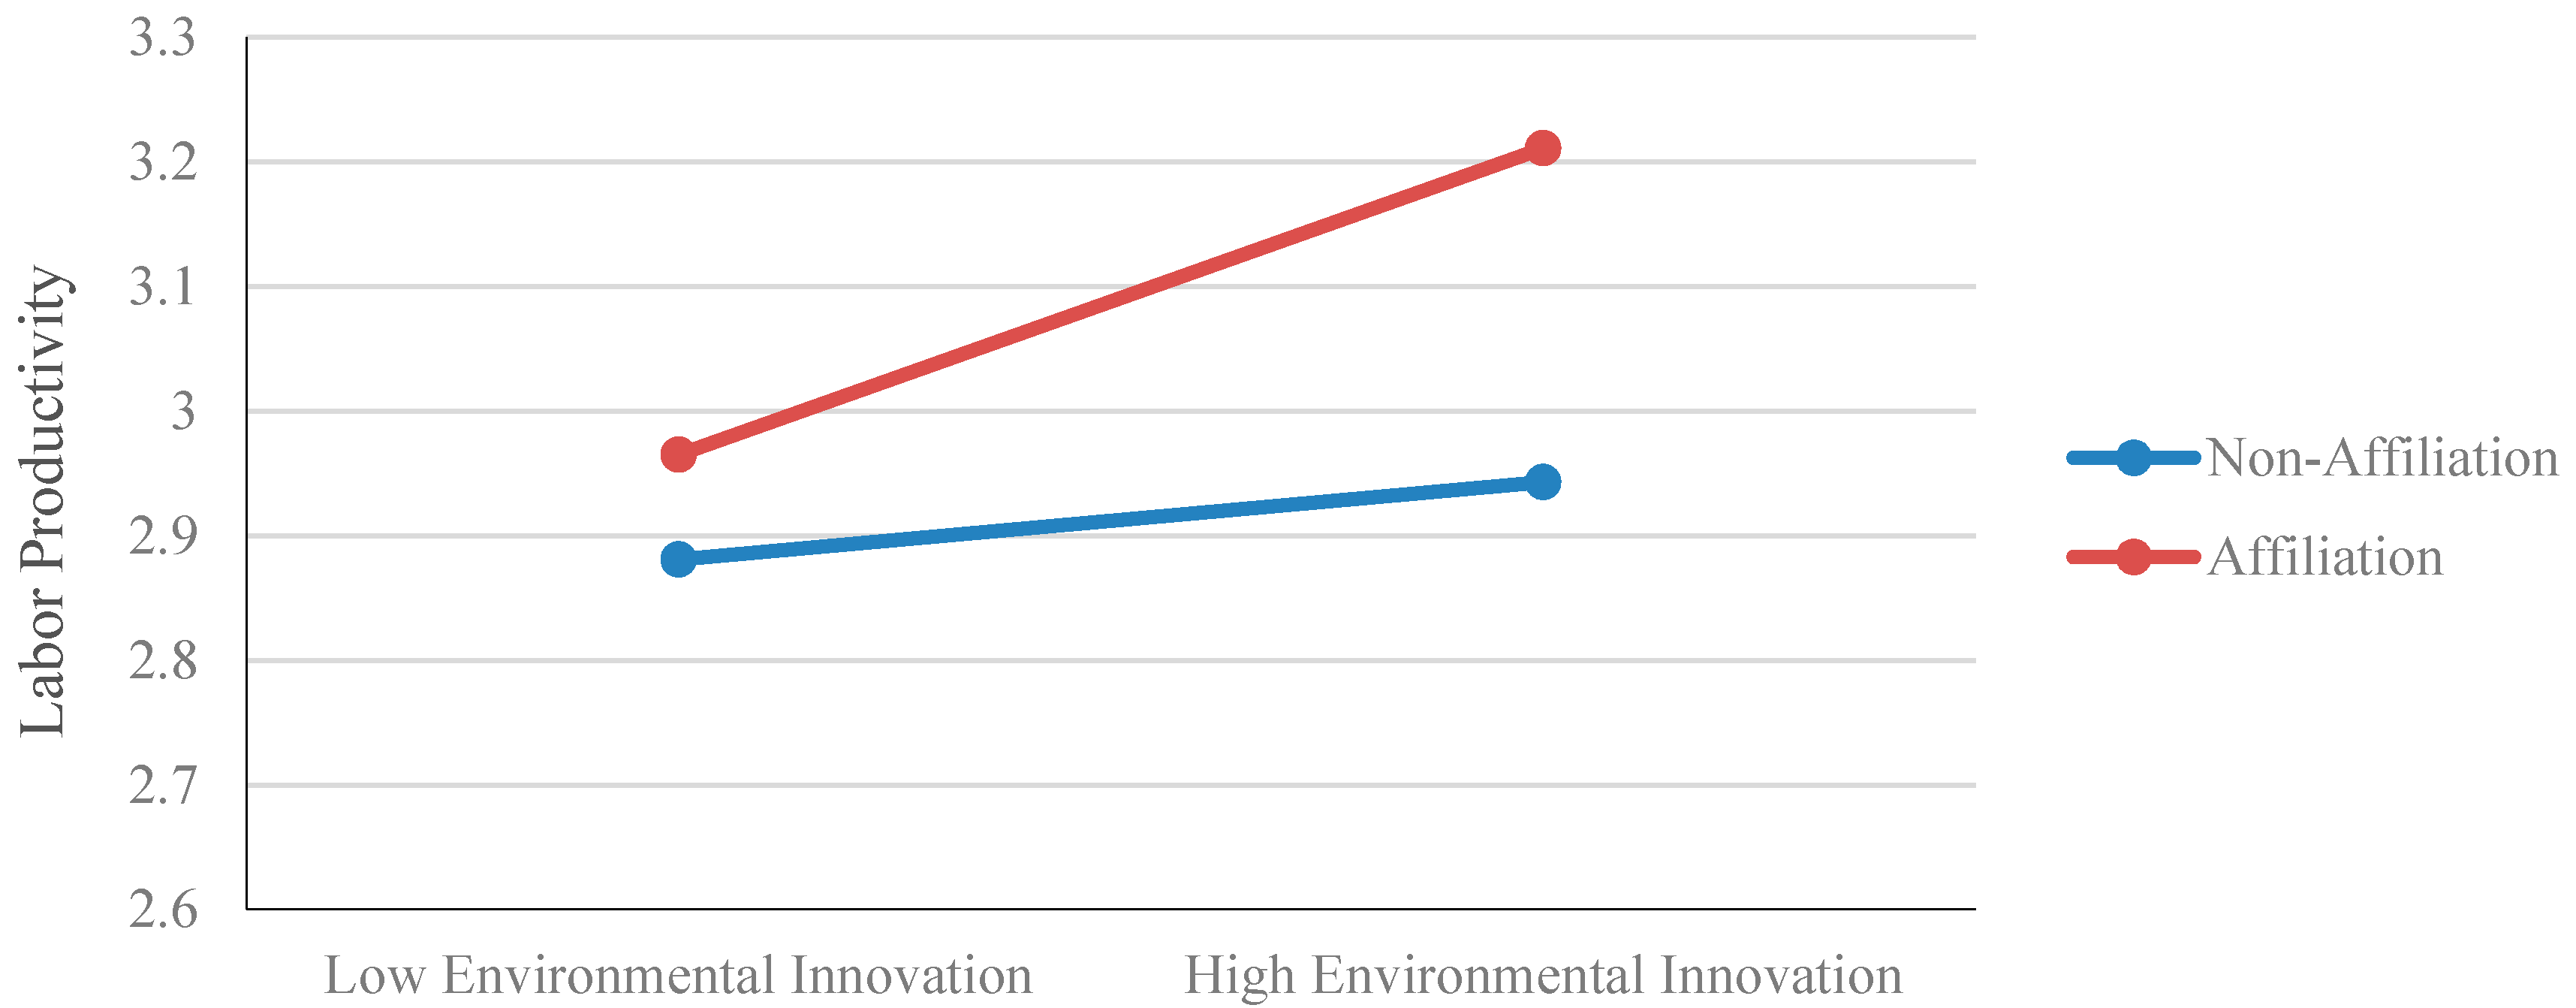
3.1. Business-Group Affiliation

The business-group affiliation influences the firms’ innovation performance as well as their economic performance [47,48,49,50,51,52]. Generally, firms require capital and labor resources as critical factors in the innovation process. These requirements can be met by other affiliates supporting the capital resources that are needed to implement the innovation. The managers of the affiliated firms are able to allocate labor resources to a suitable position in the business group to increase the labor efficiency of that group [53]. In addition, Hsieh, Yeh and Chen [48] show that the business-group affiliation supplies an internal learning network to exchange innovative ideas, experiences, and technologies among the firms.
Beyond the benefits of internal cooperation, affiliated firms also take advantage of the external opportunities from the business-group affiliation to increase their innovation performance. In emerging markets, firms restrict the exposure of their innovative ideas to market investors because of the information asymmetry and the lack of explicit corporate control [54]. When SMEs are affiliated with a business group, they are likely to receive a good reputation from the customers because of the promotion effect of the business group and the additional investment from the external investors [55]. RBV also supports that internal and external resources from affiliation improve both innovative capabilities and performance [32]. Because sharing intangible assets such as knowledge and know-how between affiliated firms are rare and tacit.
In a similar vein, the advantages of a business-group affiliation help firms improve their performance in environmental innovation [13]. Some studies find that environmental innovation requires considerable capital and labor resources because of the complexity of environmental technology and the difficulty of its application in existing practice [56]. Sharing resources among affiliates in the business group could especially be important to SMEs because of their shortage of resources in implementing environmental innovation [20,57]. Firms also require intangible resource sharing for environmental innovation. For example, knowledge sharing assists firms to achieve an improvement in the performance of green product and process innovations [25]. As external benefits of the business-group affiliation, firms providing green products and services are likely to share the brand power of the business group because the firms cannot easily promote their environmental activities to customers and investors [11,37,58]. Hence, the following hypothesis empirically tests this argument:
Hypothesis 1: Business-group affiliation positively moderates the relationship between environmental innovation and labor productivity. 
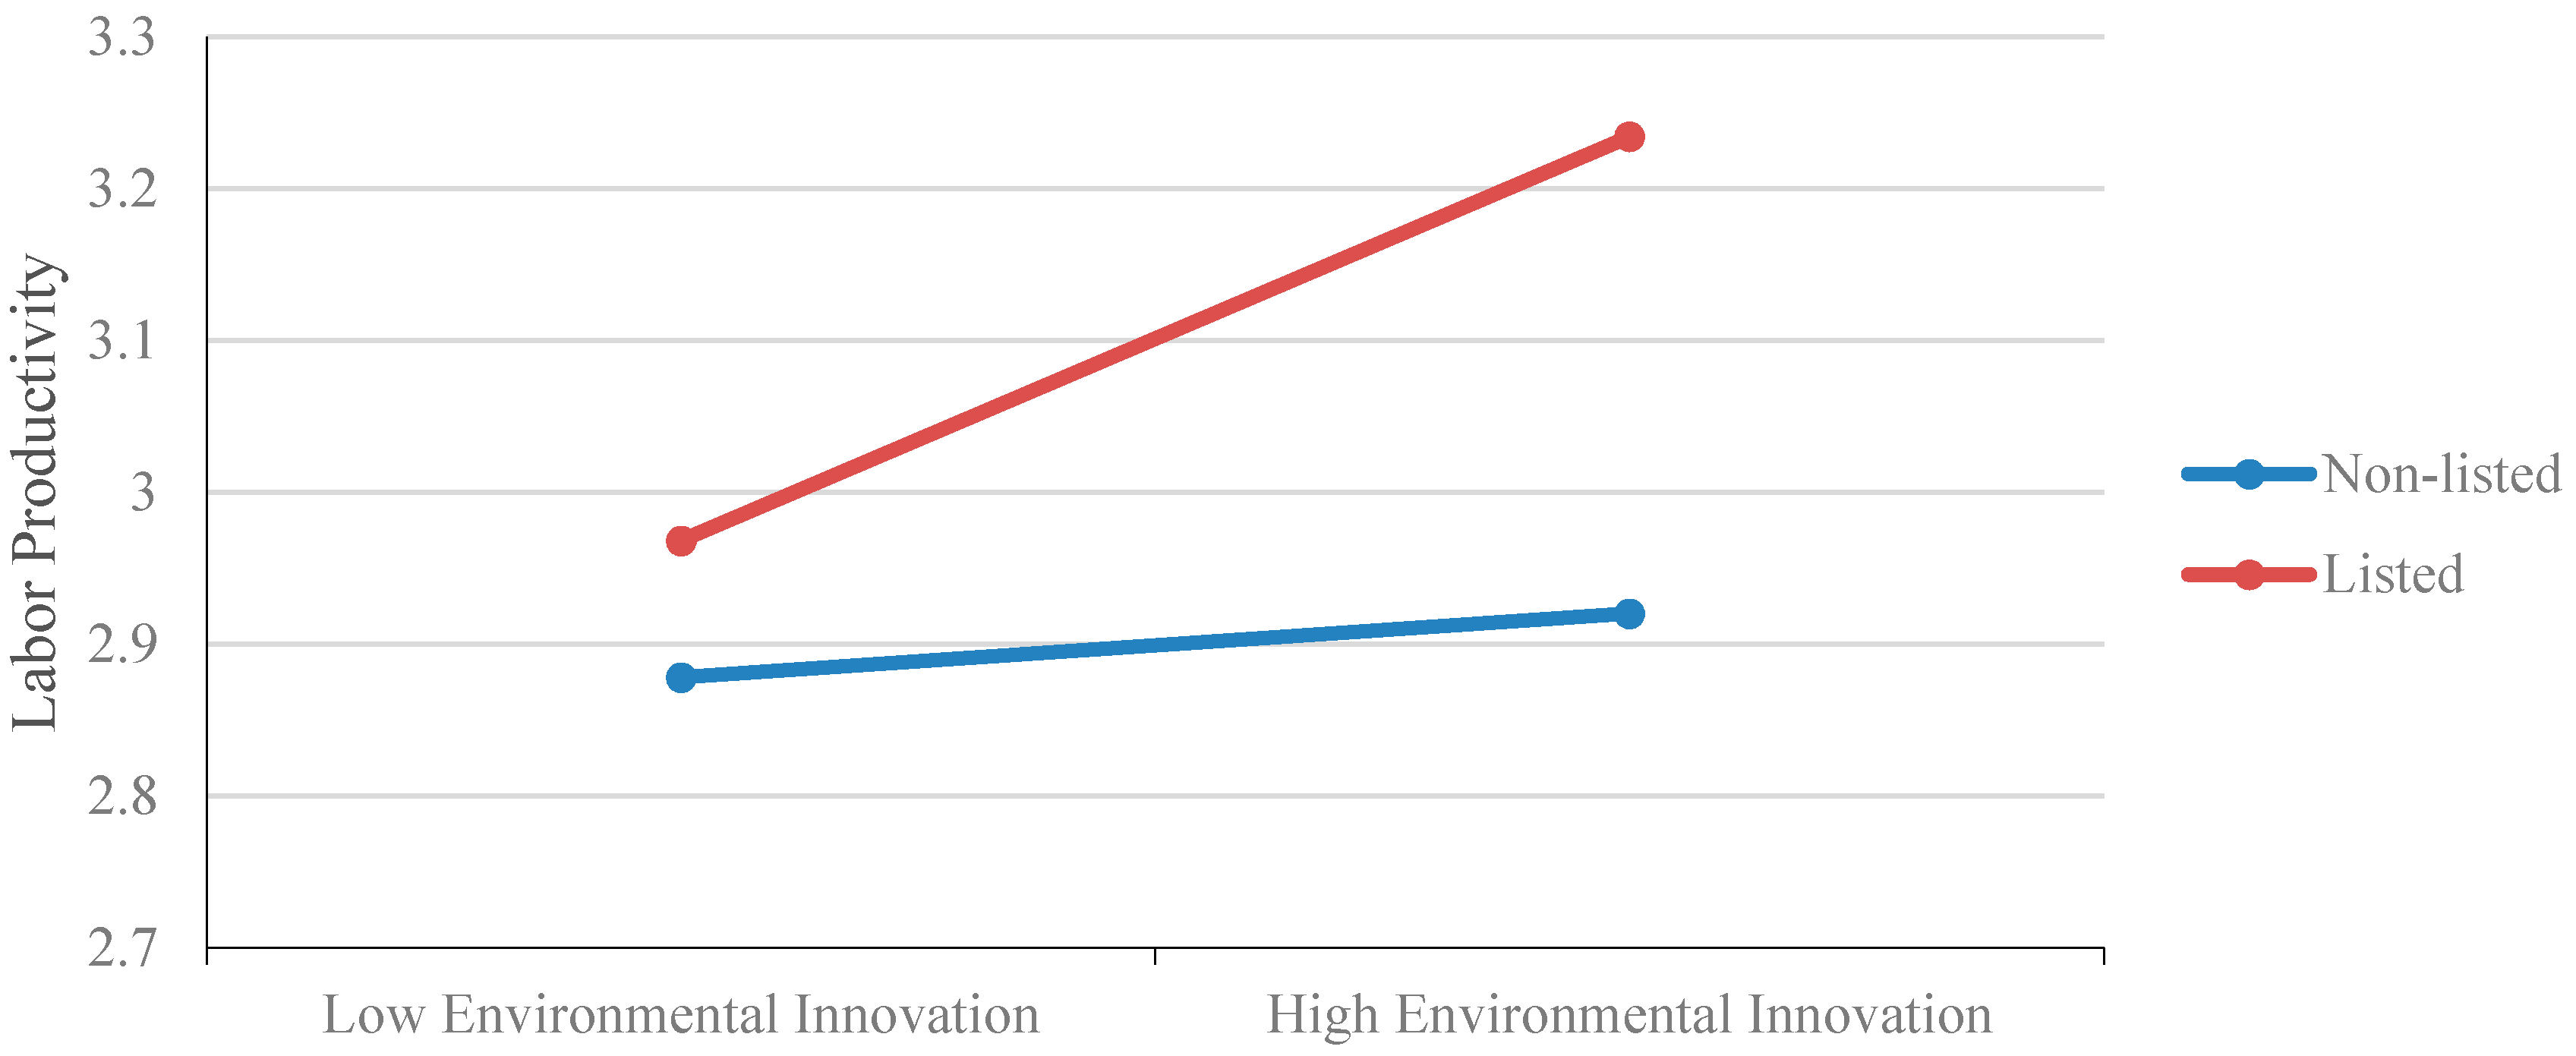
3.2. Listing Status

Several studies show that the behavior of environmental innovation is different depending on the firm’s listing status [26,59,60,61,62,63]. Non-listed firms are usually controlled by a blockholder or a single owner. A blockholder does not tend to show strong interest in environmental innovation but focuses on the short-term benefits for day-to-day survival [64,65,66]. In addition, proactive owners, who are willing to implement environmental practices, also restrict the application of environmental practices into business strategies to their personal preferences [67,68]. Therefore, non-listed firms have difficulty increasing their corporate performance by implementing environmental innovation.
On the other hand, listed firms implement a higher level of CSR than the non-listed firms because of their dispersed ownership that includes investors that prefer environmental disclosure [27]. This argument is also supported the stakeholder theory, which states that the listed firms should consider environmental activities as one of CSR because of increasing importance of sustainable issues in recent years [69]. Their objective is to balance the conflicting demands of various stakeholders including but not limited to stockholders, creditors, employees, customers, suppliers, and government. For example, listed firms should satisfy not only the financial needs of shareholders but also their environmental requirements, such as the reduction of pollution and the disclosure of environmental accounting [9]. In addition, Ullmann [63] provides a three-dimensional model to explain correlation among environmental disclosure, social and financial performance with the conceptual view. Investors and customers cannot easily access the information on the firms’ environmental performance because of the invisibility of environmental practices, whereby the stakeholders prefer openness in environmental activities [13,32]. Listed firms then disclose a high-quality financial report that includes environmental disclosure [26,59,70]. Firms that disclose their environmental practices to the market increase the outcomes of their environmental innovation through the external stakeholders’ awareness of these practices. For SMEs, this disclosure is also important to inform the external stakeholders in order to increase their corporate performance [28]. In accordance with these arguments, we put forward the following hypothesis:
Hypothesis 2: A market listing positively moderates the relationship between environmental innovation and labor productivity. 

4. Methodology

4.1. Sample and Data Collection

The research on environmental innovation is not mature yet for South Korean SMEs, and it is difficult to obtain environmental survey data for SMEs. The Science and Technology Policy Institute (STEPI), a governmental research organization, conducted the 2010 Korea Innovation Survey (KIS) to investigate the innovative capability of manufacturing firms in the period of 2007 to 2009. The 2010 KIS is a valuable data set because it provides official performance measures for the environmental innovation of Korean SMEs for the first time. The questions in the 2010 KIS are based on the 2008 Community Innovation Survey (CIS) that provides the innovation statuses of European countries every four years. The 2010 KIS is suitable for this research because it provides not only various firm characteristics, but also surveys the data on environmental innovation and financial performances. The population of the 2010 KIS is 41,485 firms established before 2007 with at least 10 employees in the manufacturing industry. This industry is categorized by the Korean Standard Industry Code (KSIC) (10–33). Korean manufacturing SME defines as a firm that should be under 300 employees, smaller than 70 billion Korean won of fixed assets of the business and 8 billion won of annual sales in accordance with the Small Business Fundamental Act in Korea. Our sample has 3497 SMEs collected by random sampling of the population in the 2010 KIS. Among the samples, there are 1587 missing cases in internal and external expenditures and 32 cases are missed from sales data. 222 cases are excluded due to variables of business affiliation and listing status. Finally, this study uses 1656 SMEs to examine the moderating effect of the environmental innovation on labor productivity by excluding missing values.

4.2. Measurements

4.2.1. Labor Productivity

The dependent variable in this research is labor productivity measured by total sales in 2009 divided by the number of employees in that year. Several studies use labor productivity to examine the impact of environmental innovation [71,72]. In addition, Cainelli [34] mentions that labor productivity is one of the dependent variables to measure for the impact of innovation performance in terms of the increase in sales and the reduction of labor. First, when firms meet their customer’s environmental needs by providing environmental products or services, then the image or reputation of the firms improves and then revenues increase. The environmental efforts of firms can achieve a higher market share and new market opportunities. Second, Rennings, Ziegler and Zwick [71] mention that environmental innovation reduces the demand for material, energy, and labor in the manufacturing industry. Therefore, environmental innovation has a positive association with labor productivity.

4.2.2. Environmental Innovation

Several environmental studies have measured environmental innovation as the number of successful environmental patents [33,73]. However, Brunnermeier and Cohen [33] mention that using environmental patents as a measure of environmental innovation has limitations because the value of the number of environmental patents can be different depending on the industry. Further, the impact of environmental patents is unclear because of the difficulty in determining whether firms are able to benefit from the patents or not. In the 2010 KIS, we are able to clearly identify the environmental benefits from the environmental innovation. The questionnaire for environmental innovation asks whether firms implement an environmental innovation as a new or significantly improved product (good or service), process, organizational method, or marketing method to create environmental benefits. The environmental benefits consist of six answers: (1) reduced material per unit of output; (2) energy use per unit of output; (3) reduced total emission; (4) replaced materials with less polluting or hazardous substitutes; (5) reduced soil, water, noise, or air pollution; and (6) recycled waste, water, or materials. The environmental innovation as the independent variable is a dummy that equals to one if a firm implements environmental innovation for any of these benefits, or zero otherwise.

4.2.3. Control Variables

Several studies argue that age and firm size influence the market-based performance. Sørensen and Stuart [74] argue that the results of organizational learning improve corporate performance along with aging. The age of the firms is measured by the number of years since inception. Firm size is determined by the natural logarithm of the number of employees in 2009, which is consistent with the business literature [34,75]. The other control variables of interest are the industry and the R&D expenditure. The 2010 KIS contains various industries. This study’s industry has 23 sectors based on Version Nine of KSIC. We rearrange the industry based on four technology classifications defined by the OECD: low, low-medium, high-medium, and high [76]. With respect to the R&D expenditure, the R&D intensity is measured by the natural logarithm of the average R&D expenditure divided by the average number of employees in the period from 2007 to 2009.

4.2.4. Interaction Terms

We use two moderating variables: business-group affiliation and listing status. Business-group affiliation refers to a group of legally independent firms that has formal ties, such as the relationship between parent and subsidiary firms. We measure business-group affiliation as a dummy variable that equals one if a firm is one of the members in a business-group affiliation and zero otherwise. There are two stock exchanges in South Korea, the Korea Stock Exchange (KSE) and the Korea Securities Dealers Automated Quotation (KOSDAQ) exchange, which is the South Korean version of the NASDAQ. We define listing status as listing on KOSDAQ for SMEs and exclude the SMEs listed on KSE because the characteristics of each market are different. In addition, the number of listed firms on the KSE is less than ten because the SMEs have difficulty listing their stocks because of the strict listing criteria [77].

5. Empirical Results

Table 1 shows the descriptive statistics and correlation coefficients of variables in this study. Standard deviation of Labor productivity, SIZE, and AGE are lower than mean, indicating the difference of estimation of these variables are relative low.
Based on the Pearson correlation coefficients, the environmental innovation (r = 0.151, p < 0.01), business-group affiliation (r = 0.094, p < 0.01), and the listing status (r = 0.157, p < 0.01) are positively and significantly associated with labor productivity. We find that environmental innovation as the independent variable has the strongest correlation with labor productivity as the dependent variable in our models. The correlation coefficient between the environmental innovation and business-group affiliation (r = 0.06, p < 0.01) is significant, and the environmental innovation is also significantly correlated with listing status (r = 0.09, p < 0.01). This correlation indicates that business-group affiliation and listing status play a complementary role in environmental innovation.
Table 1. Descriptive statistics and correlation coefficients.
TitleMeanS.DEIAGERDINSIZEAFFILLISTLPROD
EI0.3600.47910.087 **0.051 *0.176 **0.060 **0.090 **0.151 **
AGE14.3309.827 1−0.068 **0.308 **0.0000.155 **0.181 **
RDIN0.5681.539 1−0.092 **−0.067 **0.123 **0.077 **
SIZE3.6631.031 10.215 **0.323 **0.138 **
AFFIL0.0400.187 10.037 *0.094 **
LIST0.0500.209 10.157 **
LPROD5.2150.871 1
Note: EI = environmental innovation, RDIN = R&D intensity, AFFIL = business-group affiliation, LIST = listing status, LPROD = labor productivity, S.D = Standard deviation; * p < 0.05, ** = p < 0.01.
We conduct three multivariate regression analyses in Table 2. In Model 1 of Table 2, we include independent variables (Environmental Innovation) and control variables (Age, R&D intensity, and Size). We add business-group affiliation and listing status to compare with Model 3 in the examination of the effect of the interaction terms on the dependent variable in Model 2 of Table 2. We choose a multivariate ordinary least squares analysis to examine the relationship between environmental innovation and labor productivity in SMEs. In addition, to test Hypotheses 1 and 2, we add moderating variables to our regression: business-group affiliation and listing status. Multicollinearity can be a problem when using interaction terms in a multivariate regression analysis because of the standard errors that lead to misinterpretations of the estimated coefficients [78]. We use mean centering, a method to minimize the multicollinearity issues. This method deducts the means of each of the independent variables [79]. We then add the interaction terms to Model 3 in Table 2. When we check the multicollinearity among the variables by evaluating their variance inflation factor (VIF), the values of the VIFs range from 1.216 to 1.905 in all of the regressed models. Because the VIFs are less than 10, we do not need to consider the muliticollinearity issues in our empirical analysis [80]. In order to compute Model 3, the interaction terms are added. The following is Model 3 with all of the variables:
LPROD = β0 + B1EI + β2AGE + β3RDIN + β4SIZE + β5AFFIL + β6LIST + β7EI*AFFIL + β8EI*LIST + β9Industry + ε
where LPROD is labor productivity measured by sales divided by the number of employees in 2009, and EI is the environmental innovation as a dummy variable related to the environmental benefits for the firms. The AGE is the number of years from the inception year to 2009. The RDIN is the R&D intensity determined by the average R&D expenditure divided by the average number of employees in the period of 2007 to 2009. SIZE is the total number of employees in 2009. The AFFIL and LIST are dummy variables standing for business-group affiliation (affiliated firm or independent firm) and listing status (listed firm on KOSDAQ or non-listing firm). We consider time lag issues between the R&D inputs and outputs. The length of the time lag is still not fixed but flexible [81,82]. We use a two-year time lag in our models following the period of the 2010 KIS.
We assume that SME manufacturers are able to increase labor productivity by implementing environmental innovation. Model 1 of Table 2 (F = 34.84, p < 0.01) shows that environmental innovation is positively and significantly associated with labor productivity (b = 0.119, p < 0.01). In addition, the variables in Model 1 explain 13.5% of the variance in labor productivity to calculate the main effect. The results show that SMEs are likely to obtain labor productivity by achieving environmental innovation. After adding the complementary assets (AFFIL and LIST) of environmental innovation, Model 2 of Table 2 (F = 34.67, p < 0.01) explains 15.5% of the variance in the dependent variable. The added variables are meaningful because the explanation for Model 2 (15.5%) is higher than the one for Model 1 (13.5 %). According to the results in Model 2 of Table 2, we find that the benefits of sharing knowledge and values within a business group have a significant and positive influence on labor productivity (b = 0.329, p < 0.01). In addition, the listing on KOSDAQ positively and significantly influences labor productivity (b = 0.291, p < 0.01). For an improvement in labor productivity, the SMEs should affiliate with a business group and list on the market as a business strategy.
Table 2. Multivariate analysis of the impact of environmental innovation on labor productivity.
Dependent Variable = Ln (sales/employees)Model 1Model 2Model 3
Independent variableCoefficienttCoefficienttCoefficientt
Constant4.85273.8345.01071.8535.01071.986
EI0.119 ***3.7730.117 ***3.7590.105 ***3.340
AGE0.007 ***4.4580.008 ***4.7240.008 ***4.744
RDIN0.062 ***5.8180.058 ***5.4460.058 ***5.387
SIZE0.143 ***8.7240.100 ***5.7040.099 ***5.678
AFFIL 0.329 ***4.5100.276 ***3.428
LIST 0.291 ***4.7360.248 ***3.815
EI * AFFIL 0.264 *1.836
EI * LIST 0.258 **2.303
HT−0.377 ***−8.587−0.401 ***−9.171−0.395 ***−9.044
MHT−0.187 ***−3.907−0.187 ***−3.939−0.184 ***−3.883
LT−0.204 ***−4.893−0.203 ***−4.938−0.204 ***−4.969
N 1656 16561656
R squared0.1380.1590.164
Adjusted R squared0.1350.1550.158
Note: EI = environmental innovation, RDIN = R&D intensity, AFFIL = business-group affiliation, LIST = listing status, HT = high technology industry, MHT = medium-high technology industry, LT = low technology industry, N = number of cases. * = p < 0.1, ** = p < 0.05, and *** = p < 0.01.
According to Hypothesis 1, affiliated SMEs in a business group achieve higher labor productivity than independent firms by implementing environmental innovation. If the coefficients of the interaction terms are significant and the explanation of the variance in the dependent variable increases, the results support Hypothesis 1. The results for Model 3 (F = 29.31, p < 0.01) show a positive and slightly significant beta coefficient for the interaction effect between the environmental innovation and business-group affiliation (b = 0.264, p < 0.1). This coefficient indicates that the business-group affiliation as a complementary factor helps the SMEs increase labor productivity through environmental innovation. Model 3 of Table 2 also shows that listing status (b = 0.258, p < 0.01) positively and significantly moderates the relationship between environmental innovation and labor productivity. The SMEs are able to conceive that listing on the market is an environmental strategy for sustainable development. The significance of the interaction terms is further explained by an increase in the unadjusted coefficient of determination (R squared) from 0.159 in Model 2 to 0.164 in Model 3 (p < 0.01). Model 3 explains 15.8% of the overall variance in the labor productivity. Therefore, Model 3 is the best fitting model among the three models, and the results support Hypotheses 1 and 2.
Figure 1 and Figure 2 visualize the impact of complementary assets on the relationship between environmental innovation and labor productivity by using a simple slope analysis. The graphs of these figures clearly show the result of model 3 in Table 2. The moderating impact of listing is slightly higher than the impact of business affiliation.
Figure 1. The moderating effect of business affiliation on the environmental performance.
Sustainability 06 07412 g001
Figure 2. The moderating effect of listing status on the environmental performance.
Sustainability 06 07412 g002
This paper implements additional multivariate regressions to compare the impact of environmental innovation on labor productivity in different groups. First, Table 3 shows the result of multiple regressions, which examine the relationship between environmental innovation and labor productivity in affiliated and non-affiliated firms. To test for the significance of slope difference between two groups, analysis of simple slope difference is used in this model. The t-value of the analysis is the following [83]:
Sustainability 06 07412 i001
where b is coefficients of independent variable, n is the number of cases in each group, and SE is standard deviation of independent variable.
Table 3. Comparison of multivariate analysis between affiliated and non-affiliated firms.
Dependent Variable = Ln (sales/employees)Affiliated FirmsNon-Affiliated Firms
Independent variableCoefficienttCoefficientt
Constant5.36112.5084.62071.309
EI0.305 *1.9580.104 **3.244
AGE0.0030.3210.008 ***5.088
RDIN0.0551.2520.065 ***5.934
SIZE0.0700.7220.130 ***7.651
HT−0.696 ***−3.280−0.143 ***−3.183
MHT−0.194−0.8920.0280.580
MLT0.2931.4400.205 ***4.860
N811575
R squared0.2700.133
Adjusted R squared0.2010.129
Note: EI = environmental innovation, RDIN = R&D intensity, HT = high technology industry, MHT = medium-high technology industry, MLT = medium-low technology industry; * = p < 0.1, ** = p < 0.05, and *** = p < 0.01.
The t-value for the difference of the simple slopes in two groups is 4.33, indicating affiliated SMEs more increase their labor productivity with environmental innovation than non-affiliated ones. In Table 4, listed SMEs achieve higher environmental performance with green innovation than non-listed firms (t-value = 7.37). The results obtained from Table 3 and Table 4 confirm the impact of environmental innovation on labor productivity with complementary assets.
Table 4. Comparison of multivariate analysis between listed and non-listed firms.
Dependent Variable = Ln (sales/employees)Listed GroupNon-Listed Group
Independent variableCoefficienttCoefficientt
Constant6.39614.7414.66968.714
EI0.383 ***3.8840.097 ***2.944
AGE−0.002−0.4730.007 ***4.254
RDIN−0.004−0.1220.060 ***5.329
SIZE−0.102−1.2750.125 ***7.030
HT−0.351 *−1.825−0.200 ***−4.328
MHT−0.272−1.2790.0310.623
MLT0.0540.2700.201 ***4.720
N1351521
R squared0.2170.123
Adjusted R squared0.1740.119
Note: EI = environmental innovation, RDIN = R&D intensity, HT = high technology industry, MHT = medium-high technology industry, MLT = medium-low technology industry* = p < 0.1, ** = p < 0.05, and *** = p < 0.01.

6. Discussion

6.1. Research Implication

We examine the relationship between environmental innovation and labor productivity within SME manufacturers. We also introduce the impact of the business-group affiliation and the listing status on the labor productivity as an independent variable and a moderator. For SMEs, the literature has not examined this relationship and its complementary assets as interaction terms. The multivariate regression analysis shows that SME manufacturers are able to increase their labor productivity by implementing environmental innovation in Model 1 of Table 2. Previously, the literature focused on the relationship between the environmental innovation and the corporate performance in large firms because there were few data sets to examine the environmental innovation performance of SMEs, and the SMEs were restricted from implementing successful environmental innovation because of their lack of financial and educational resources. In spite of these limitations, this study on environmental innovation in SMEs is necessary because SMEs have generated a large amount of industrial waste and have been responsible for significant and negative environmental impacts [1,7]. In addition, SMEs have overcome these limitations to implement environmental innovation by networking with internal and external partners [84]. Our results confirm the research and contribute to the literature that environmental innovation can be an important business strategy to achieve higher labor productivity in SMEs.
In Model 2 of Table 2, the business-group affiliation plays a significant role for SME manufacturers to increase labor productivity. The business-group affiliation has two perspectives: costs and benefits. With respect to costs, the business groups have the possibility to inefficiently transfer resources from the highly performing firms to the poorly performing affiliates. This transfer means that profitable firms have to abandon their investment opportunities for other affiliates [85]. Furthermore, the exploitation of minority shareholders, such as the tunneling of resources, also occurs among business groups [86]. However, affiliates in a business group can minimize the transaction costs in an inefficient market if they have efficient economic organizations [24]. South Korean affiliated firms share resources, such as technology skills and advertising, and have an interactive transaction with complex structures of cross-subsidization and vertical integration [87]. Our results are consistent with the benefit side of the business-group affiliation and suggest that SMEs should affiliate with business groups.
Regarding Hypothesis 1, the results of this study show that the affiliation with a business group significantly and positively moderates the relationship between environmental innovation and labor productivity. In other words, the affiliated SMEs increase the outcomes of the environmental innovation. Therefore, the affiliation can be an efficient environmental strategy to increase the corporate performance of SMEs. To be specific, the affiliated SMEs take advantage of the business groups such as sharing resources and external investments to develop their environmental innovation. With respect to Hypothesis 2, the impact of environmental innovation on labor productivity is significantly changed by the firm’s listing status. This impact indicates that the listing status is a critical moderator between environmental innovation and labor productivity. Our results show that listed SMEs on KOSDAQ achieve higher performance from their environmental innovation. In order to gain more investment from external stakeholders, SMEs should advertise their environmental efforts to customers who are interested in green products and service because of their difficulty in informing customers of the necessity for environmental practices [58]. Therefore, the findings of our study empirically support the previous research by using a multivariate regression with interaction terms.
This paper contributes to environmental research because a large amount of studies have mainly focused on the efficiency of the environmental regulation and the environmental management for large firms, even though the impact of SMEs on the environment has increased [17,88,89]. Our results show that SMEs are able to increase labor productivity by implementing environmental practices in spite of various obstacles such as the burden of additional cost and the shortage of capabilities for environmental innovation. For SMEs, this study of the moderating effect of the business-group affiliation and the listing status is the first empirical study in regard to the relationship between environmental innovation and labor productivity in the business research. This is then unlike the studies that mostly analyze the determinants and actors for SMEs to adopt environmental management or technology [7]. In terms of the theoretical contribution, we support the NRBV to find the significant impact of environmental innovation on labor productivity. Therefore, our study is an extension of Maas, et al. [90] who applied the theory to a specific industry: German third-party logistics providers. In other words, SMEs should apply their environmental activities to the business strategy of sustainability and competitive advantage. In addition, the results contribute to the organization research that examines the impact of Korean business groups on labor productivity. In Korean business groups, affiliations have a unique relational structure, which includes both perspectives of vertical integration and conglomerates typified through the system of chaebols that has a considerable impact on economic performance [24].

6.2. Managerial Implications

Besides these contributions, we provide some implications for SMEs managers. As we mentioned in the literature review, there is still discussion on whether environmental innovation leads to corporate performance. Reinhardt [58] mentions that the answer cannot generally be found because the question relates to the benefits of environmental activities. However, our results support the positive perspective of environmental innovation and suggest that managers of SMEs consider environmental innovation as a business strategy to meet the requirements of shareholders through higher labor productivity and environmental regulations. Managers of independent firms among the emerging SMEs, which have a competitive advantage with fast growth in domestic and international markets, should consider affiliations with business groups for advantages such as the sharing of resources and risks or for sustainable development by using several methods such as M&A and corporate divestiture [87,91]. In addition, managers could benefit from disclosing their environmental efforts after listing on the market because more external investors are likely to evaluate their environmental performance and a good image or reputation of implementing environmental innovation can improve performance.
Our results also find implications for policy makers. Policy makers effectively should support SMEs in increasing their environmental performance because the existing regulations might be a burden [7]. They should then establish appropriate regulation in which not only SMEs but also supply chain members can fulfill the requirements of the regulation without any financial burdens in order to create environmental value from the environmental innovation. For balanced development between large companies and SMEs, policy makers need to assist SMEs with various methods because most SMEs still lack resources, the capability to adopt a new technology, and the ability to establish new networks to implement environmental activities. In addition, the government needs to provide sustainable support for independent SMEs until they can survive without the resource sharing from business-group affiliations and Initial public offerings (IPOs). Listed SMEs as well as non-listed SMEs selectively disclose their environmental performances and have different accounting measurements of their environmental performance [92]. Therefore, policy makers need to establish environmental disclosure standards to help customers and stakeholders compare firms’ environmental performance and increase the transparency of the environmental disclosure.

6.3. Limitations

Our models in this study have several limitations. Even though our results show the impact of environmental innovation on labor productivity in SMEs and the interaction effects from the business-group affiliation and the listing status, it is necessary to examine the green supply chain to better understand the environmental practices and suggest efficient environmental regulations. In addition, the outcomes of the environmental performance might be different depending on different countries. Future study should compare the environmental performance and the green supply chain at national levels. We are limited to the financial data in the KIS 2010. Future study could use short- and long-term performance variables as dependent variables by using the Korean Investor Service Value that is a reliable data set mainly used in financial research. Even though there is no unexpected fluctuation in the labor productivity caused by the financial crisis in the period of 2007 to 2009, future study can control the impact of the crisis in order to examine more precisely the empirical research with panel data sets.

7. Conclusions

This study shows the relationship among environmental innovation, labor productivity, and complementary assets in Korean SMEs. One of the conclusions from the results is that Korean SMEs implement environmental innovation to increase labor productivity. This outcome is supported by NRBV that environmental activities of firms become the center of their competitiveness for sustainable development. Second, SMEs can take an advantage of business-group affiliation for increasing environmental performance. Based on RBV, SMEs are able to obtain valuable tangible and intangible asset from their affiliation for environmental activities more than independent firms and increase their performance. The last major conclusion is that listing status significantly and positively influences environmental innovation-labor productivity relationship. According to stakeholder theory, firms should meet needs of their stakeholders including environmental activities as CSR. Listed firms make an effort to implement environmental innovation more than non-listed ones because they should disclose their financial and social activities. They satisfy stakeholders who prefer to implement environmental activities and receive investment and high reputation related to green growth. These conclusions confirm the positive relationship between environmental innovation and performance in Korean SMEs and suggest that the environmental strategy is needed to achieve a success of environmental innovation with complementary assets.

Acknowledgments

With sincere thanks, the authors acknowledge Seunghun Han and Joosung Lee of Department of Business and Technology Management, KAIST for their meaning support in retrieving data to carry out investigations for the research. Their comments were great value to this paper.

Author Contributions

Chungwon Woo mainly contributed to the research design, data collecting and writing in this paper. Yanhon Chung suggested research framework and provided significant revision of this work. Dongphil Chun participated in the methodology development and revision process. Hangyeol Seo supported processing data analysis and writing the paper. All authors read and approved the manuscript.

Conflicts of Interest

The authors declare no conflict of interest.

References

  1. Wilson, C.D.H.; Williams, I.D.; Kemp, S. An evaluation of the impact and effectiveness of environmental legislation in small and medium-sized enterprises: Experiences from the UK. Bus. Strategy Environ. 2012, 21, 141–156. [Google Scholar]
  2. González-Benito, J.; González-Benito, Ó. A study of determinant factors of stakeholder environmental pressure perceived by industrial companies. Bus. Strategy Environ. 2008, 19, 164–181. [Google Scholar]
  3. Zhu, Q.; Cordeiro, J.; Sarkis, J. Institutional pressures, dynamic capabilities and environmental management systems: Investigating the ISO 9000—Environmental management system implementation linkage. J. Environ. Manag. 2013, 114, 232–242. [Google Scholar]
  4. Feng, W.; Reisner, A. Factors influencing private and public environmental protection behaviors: Results from a survey of residents in Shaanxi, China. J. Environ. Manag. 2011, 92, 429–436. [Google Scholar]
  5. O’Rourke, D.; Lee, E. Mandatory planning for environmental innovation: Evaluating regulatory mechanisms for toxics use reduction. J. Environ. Plan. Manag. 2004, 47, 181–200. [Google Scholar]
  6. Valentine, S.V. Policies for enhancing corporate environmental management: A framework and an applied example. Bus. Strategy Environ. 2012, 21, 338–350. [Google Scholar]
  7. Hansen, O.E.; Søndergard, B.; Meredith, S. Environmental innovations in small and medium sized enterprises. Technol. Anal. Strateg. Manag. 2002, 14, 37–56. [Google Scholar]
  8. Delmas, M.A.; Toffel, M.W. Organizational responses to environmental demands: Opening the black box. Strateg. Manag. J. 2008, 29, 1027–1055. [Google Scholar]
  9. Jonker, J.; Foster, D. Stakeholder excellence? Framing the evolution and complexity of a stakeholder perspective of the firm. Corp. Soc. Responsib. Environ. Manag. 2002, 9, 187–195. [Google Scholar]
  10. Peters, M.; Turner, R.K. SME environmental attitudes and participation in locals-cale voluntary initiatives: Some practical applications. J. Environ. Plan. Manag. 2004, 47, 449–473. [Google Scholar]
  11. Porter, M.E.; van der Linde, C. Green and competitive: Ending the stalemate. Harv. Bus. Rev. 1995, 73, 120–134. [Google Scholar]
  12. Teece, D.J. Profiting from technological innovation: Implications for integration, collaboration, licensing and public policy. Res. Policy 1986, 15, 285–305. [Google Scholar]
  13. Christmann, P. Effects of “best practices” of environmental management on cost advantage: The role of complementary assets. Acad. Manag. J. 2000, 43, 663–680. [Google Scholar]
  14. Granovetter, M. Coase revisited: Business groups in the modern economy. Ind. Corp. Chang. 1995, 4, 93–130. [Google Scholar]
  15. Chang, S.-J.; Chung, C.-N.; Mahmood, I.P. When and how does business group affiliation promote firm innovation? A tale of two emerging economies. Organ. Sci. 2006, 17, 637–656. [Google Scholar]
  16. Brammer, S.; Hoejmose, S.; Marchant, K. Environmental management in SMEs in the UK: Practices, pressures and perceived benefits. Bus. Strateg. Environ. 2012, 21, 423–434. [Google Scholar]
  17. Brammer, S.; Pavelin, S. Voluntary environmental disclosures by large UK companies. J. Bus. Financ. Account. 2006, 33, 1168–1188. [Google Scholar]
  18. Lee, S.Y. Drivers for the participation of small and medium-sized suppliers in green supply chain initiatives. Supply Chain Manag. 2008, 13, 185–198. [Google Scholar]
  19. Moore, S.B.; Manring, S.L. Strategy development in small and medium sized enterprises for sustainability and increased value creation. J. Clean. Prod. 2009, 17, 276–282. [Google Scholar]
  20. Bos-Brouwers, H.E.J. Corporate sustainability and innovation in SMEs: Evidence of themes and activities in practice. Bus. Strategy Environ. 2010, 19, 417–435. [Google Scholar]
  21. Khanna, T.; Rivkin, J.W. Estimating the performance effects of business groups in emerging markets. Strateg. Manag. J. 2001, 22, 45–74. [Google Scholar]
  22. Hart, S.L.; Dowell, G. Invited editorial: A natural-resource-based view of the firm fifteen years after. J. Manag. 2011, 37, 1464–1479. [Google Scholar]
  23. Khanna, T.; Palepu, K. Is group affiliation profitable in emerging markets? An analysis of diversified Indian business groups. J. Financ. 2000, 55, 867–891. [Google Scholar]
  24. Chang, S.J.; Choi, U. Strategy, structure and performance of Korean business groups: A transactions cost approach. J. Ind. Econ. 1988, 37, 141–158. [Google Scholar]
  25. Wong, S.K.S. Environmental requirements, knowledge sharing and green innovation: Empirical evidence from the electronics industry in China. Bus. Strategy Environ. 2012, 22, 321–338. [Google Scholar]
  26. Kim, J.B.; Yi, C.H. Ownership structure, business group affiliation, listing status, and earnings management: Evidence from Korea. Contemp. Account. Res. 2006, 23, 427–464. [Google Scholar]
  27. Keim, G.D. Managerial behavior and the social responsibility debate: Goals versus constraints. Acad. Manag. J. 1978, 21, 57–68. [Google Scholar]
  28. Caccavaio, M.; Carmassi, J.; di Giorgio, G.; Spallone, M. SMEs and the challenge to go public. Available online: http://rivistabancaria.it/Articoli/smes-and-challenge-go-public (accessed on 30 September 2014).
  29. Jun, S.-P.; Seo, J.H.; Son, J.-K. A study of the SME technology roadmapping program to strengthen the R&D planning capability of Korean SMEs. Technol. Forecast. Soc. Chang. 2012, 80, 1002–1014. [Google Scholar]
  30. Nugent, J.B.; Yhee, S.-J. Small and medium enterprises in Korea: Achievements, constraints and policy issues. Small Bus. Econ. 2002, 18, 85–119. [Google Scholar]
  31. Wernerfelt, B. A resource-based view of the firm. Strateg. Manag. J. 1984, 5, 171–180. [Google Scholar]
  32. Hart, S.L. A natural-resource-based view of the firm. Acad. Manag. Rev. 1995, 20, 986–1014. [Google Scholar]
  33. Brunnermeier, S.B.; Cohen, M.A. Determinants of environmental innovation in us manufacturing industries. J. Environ. Econ. Manag. 2003, 45, 278–293. [Google Scholar]
  34. Cainelli, G. Innovation and economic performance in services: A firm-level analysis. Camb. J. Econ. 2005, 30, 435–458. [Google Scholar]
  35. Woo, C.; Chung, Y.; Chun, D.; Han, S.; Lee, D. Impact of green innovation on labor productivity and its determinants: An analysis of the Korean manufacturing industry. Bus. Strategy Environ. 2013. [Google Scholar] [CrossRef]
  36. Al-Tuwaijri, S.A.; Christensen, T.E.; Hughes, K.E. The relations among environmental disclosure, environmental performance, and economic performance: A simultaneous equations approach. Account. Organ. Soc. 2004, 29, 447–471. [Google Scholar]
  37. Chen, Y.S.; Lai, S.B.; Wen, C.T. The influence of green innovation performance on corporate advantage in Taiwan. J. Bus. Ethics 2006, 67, 331–339. [Google Scholar]
  38. Chiou, T.-Y.; Chan, H.K.; Lettice, F.; Chung, S.H. The influence of greening the suppliers and green innovation on environmental performance and competitive advantage in Taiwan. Transp. Res. Part E 2011, 47, 822–836. [Google Scholar]
  39. Lin, R.-J.; Tan, K.-H.; Geng, Y. Market demand, green product innovation, and firm performance: Evidence from Vietnam motorcycle industry. J. Clean. Prod. 2013, 40, 101–107. [Google Scholar]
  40. López-Gamero, M.D.; Molina-Azorín, J.F.; Claver-Cortés, E. The whole relationship between environmental variables and firm performance: Competitive advantage and firm resources as mediator variables. J. Environ. Manag. 2009, 90, 3110–3121. [Google Scholar]
  41. Alpkan, L.; Bulut, C.; Gunday, G.; Ulusoy, G.; Kilic, K. Organizational support for intrapreneurship and its interaction with human capital to enhance innovative performance. Manag. Decis. 2010, 48, 732–755. [Google Scholar] [Green Version]
  42. Armour, H.O.; Teece, D.J. Organizational structure and economic performance: A test of the multidivisional hypothesis. Bell J. Econ. 1978, 9, 106–122. [Google Scholar]
  43. Csaszar, F.A. Organizational structure as a determinant of performance: Evidence from mutual funds. Strateg. Manag. J. 2012, 33, 611–632. [Google Scholar]
  44. Jones, M.T. The institutional determinants of social responsibility. J. Bus. Ethics 1999, 20, 163–179. [Google Scholar]
  45. Kim, W.S.; Lyn, E.; Park, T.J.; Zychowicz, E. The wealth effects of capital investment decisions: An empirical comparison of Korean chaebol and non-chaebol firms. J. Bus. Financ. Account. 2005, 32, 945–971. [Google Scholar]
  46. Gunduz, L.; Tatoglu, E. A comparison of the financial characteristics of group affiliated and independent firms in turkey. Eur. Bus. Rev. 2003, 15, 48–54. [Google Scholar]
  47. Aragón-Correa, J.A.; García-Morales, V.J.; Cordón-Pozo, E. Leadership and organizational learning’s role on innovation and performance: Lessons from Spain. Ind. Mark. Manag. 2007, 36, 349–359. [Google Scholar]
  48. Hsieh, T.-J.; Yeh, R.-S.; Chen, Y.-J. Business group characteristics and affiliated firm innovation: The case of Taiwan. Ind. Mark. Manag. 2010, 39, 560–570. [Google Scholar]
  49. Mahmood, I.P.; Mitchell, W. Two faces: Effects of business groups on innovation in emerging economies. Manag. Sci. 2004, 50, 1348–1365. [Google Scholar]
  50. Reagans, R.; McEvily, B. Network structure and knowledge transfer: The effects of cohesion and range. Adm. Sci. Q. 2003, 48, 240–267. [Google Scholar]
  51. Reddy, N.M.; Zhao, L. International technology transfer: A review. Res. Policy 1990, 19, 285–307. [Google Scholar]
  52. Stuart, T.E. Interorganizational alliances and the performance of firms: A study of growth and innovation rates in a high-technology industry. Strateg. Manag. J. 2000, 21, 791–811. [Google Scholar]
  53. Khanna, T.; Palepu, K. Why focused strategies may be wrong for emerging markets. Harv. Bus. Rev. 1997, 75, 41–48. [Google Scholar]
  54. Durnev, A.; Li, K.; Mørck, R.; Yeung, B. Capital markets and capital allocation: Implications for economies in transition. Econ. Trans. 2004, 12, 593–634. [Google Scholar]
  55. Teece, D.J. Competition, cooperation, and innovation: Organizational arrangements for regimes of rapid technological progress. J. Econ. Behav. Organ. 1992, 18, 1–25. [Google Scholar]
  56. Baylis, R.; Connell, L.; Flynn, A. Company size, environmental regulation and ecological modernization: Further analysis at the level of the firm. Bus. Strategy Environ. 1998, 7, 285–296. [Google Scholar]
  57. Freel, M.S. Patterns of innovation and skills in small firms. Technovation 2005, 25, 123–134. [Google Scholar]
  58. Reinhardt, F. Environmental product differentiation: Implications for corporate strategy. Calif. Manag. Rev. 1998, 40, 43–73. [Google Scholar]
  59. Botosan, C.A. Disclosure level and the cost of equity capital. Account. Rev. 1997, 72, 323–349. [Google Scholar]
  60. Johnson, R.A.; Greening, D.W. The effects of corporate governance and institutional ownership types of corporate social performance. Acad. Manag. J. 1999, 42, 564–576. [Google Scholar]
  61. Li, W.; Zhang, R. Corporate social responsibility, ownership structure, and political interference: Evidence from China. J. Bus. Ethics 2010, 96, 631–645. [Google Scholar]
  62. Sengupta, P. Corporate disclosure quality and the cost of debt. Account. Rev. 1998, 73, 459–474. [Google Scholar]
  63. Ullmann, A.A. Data in search of a theory: A critical examination of the relationships among social performance, social disclosure, and economic performance of us firms. Acad. Manag. Rev. 1985, 10, 540–557. [Google Scholar]
  64. Claessens, S.; Tzioumis, K. Ownership and financing structures of listed and large non-listed corporations. Corp. Gov. 2006, 14, 266–276. [Google Scholar]
  65. Nejati, M.; Amran, A. Does ownership type cause any difference in the perception of Malaysian SME owners/managers towards corporate social responsibility? Int. J. Bus. Gov. Ethics 2012, 7, 63–81. [Google Scholar]
  66. Thompson, J.K.; Smith, H.L. Social responsibility and small business: Suggestions for research. J. Small Bus. Manag. 1991, 29, 30–44. [Google Scholar]
  67. Spence, L.J.; Rutherfoord, R. Small business and empirical perspectives in business ethics: Editorial. J. Bus. Ethics 2003, 47, 1–5. [Google Scholar]
  68. Williams, S.; Schaefer, A. Small and medium-sized enterprises and sustainability: Managers’ values and engagement with environmental and climate change issues. Bus. Strategy Environ. 2013, 22, 173–186. [Google Scholar]
  69. Roberts, R.W. Determinants of corporate social responsibility disclosure: An application of stakeholder theory. Account. Organ. Soc. 1992, 17, 595–612. [Google Scholar]
  70. Bhattacharya, U.; Daouk, H.; Welker, M. The world price of earnings opacity. Account. Rev. 2003, 78, 641–678. [Google Scholar]
  71. Rennings, K.; Ziegler, A.; Zwick, T. The effect of environmental innovations on employment changes: An econometric analysis. Bus. Strategy Environ. 2004, 13, 374–387. [Google Scholar]
  72. Wagner, M. Innovation and competitive advantages from the integration of strategic aspects with social and environmental management in European firms. Bus. Strategy Environ. 2009, 18, 291–306. [Google Scholar]
  73. Horbach, J. Determinants of environmental innovation—New evidence from German panel data sources. Res. Policy 2008, 37, 163–173. [Google Scholar]
  74. Sørensen, J.B.; Stuart, T.E. Aging, obsolescence, and organizational innovation. Adm. Sci. Q. 2000, 45, 81–112. [Google Scholar]
  75. Diaz, M.A.; Sanchez, R. Firm size and productivity in Spain: A stochastic frontier analysis. Small Bus. Econ. 2008, 30, 315–323. [Google Scholar]
  76. Czarnitzki, D.; Thorwarth, S. Productivity effects of basic research in low-tech and high-tech industries. Res. Policy 2012, 41, 1555–1564. [Google Scholar]
  77. Yoon, S.S. A comparison of earnings management between KSE firms and KOSDAQ firms. J. Bus. Financ. Account. 2005, 32, 1347–1372. [Google Scholar]
  78. Jaccard, J.; Wan, C.K.; Turrisi, R. The detection and interpretation of interaction effects between continuous variables in multiple regression. Multivar. Behav. Res. 1990, 25, 467–478. [Google Scholar]
  79. Aiken, L.S.; West, S.G. Multiple Regression: Testing and Interpreting Interactions; Sage Publications: Thousand Oaks, CA, USA, 1991. [Google Scholar]
  80. Marquardt, D.W. You should standardize the predictor variables in your regression models. J. Am. Stat. Assoc. 1980, 75, 87–91. [Google Scholar]
  81. Goto, A.; Suzuki, K. R&D capital, rate of return on R&D investment and spillover of R&D in Japanese manufacturing industries. Rev. Econ. Stat. 1989, 71, 555–564. [Google Scholar]
  82. Wang, E.C.; Huang, W. Relative efficiency of R&D activities: A cross-country study accounting for environmental factors in the DEA approach. Res. Policy 2007, 36, 260–273. [Google Scholar]
  83. Robinson, C.D.; Schumacker, S.T.R.E. Tests of moderation effects: Difference in simple slopes versus the interaction term. Mult. Linear Regres. Viewp. 2013, 39, 16–24. [Google Scholar]
  84. Halila, F. Networks as a means of supporting the adoption of organizational innovations in SMEs: The case of environmental management systems (EMSS) based on ISO 14001. Corp. Soc. Responsib. Environ. Manag. 2007, 14, 167–181. [Google Scholar]
  85. Shin, H.-H.; Park, Y.S. Financing constraints and internal capital markets: Evidence from Koreanchaebols’. J. Corp. Financ. 1999, 5, 169–191. [Google Scholar]
  86. Douma, S.; George, R.; Kabir, R. Foreign and domestic ownership, business groups, and firm performance: Evidence from a large emerging market. Strateg. Manag. J. 2006, 27, 637–657. [Google Scholar]
  87. Chang, S.J.; Hong, J. Economic performance of group-affiliated companies in Korea: Intragroup resource sharing and internal business transactions. Acad. Manag. J. 2000, 43, 429–448. [Google Scholar]
  88. Hazilla, M.; Kopp, R.J. Social cost of environmental quality regulations: A general equilibrium analysis. J. Political Econ. 1990, 98, 853–873. [Google Scholar]
  89. Jang, M.; Kim, J.-A.; Sun, S.-T. Development and evaluation of laws and regulation for the low-carbon and green growth in Korea. Int. J. Urban Sci. 2010, 14, 191–206. [Google Scholar]
  90. Maas, S.; Schuster, T.; Hartmann, E. Pollution prevention and service stewardship strategies in the third-party logistics industry: Effects on firm differentiation and the moderating role of environmental communication. Bus. Strategy Environ. 2012, 23, 38–55. [Google Scholar]
  91. Qian, G. Multinationality, product diversification, and profitability of emerging us small- and medium-sized enterprises. J. Bus. Ventur. 2002, 17, 611–633. [Google Scholar]
  92. Stanny, E. Voluntary disclosures of emissions by us firms. Bus. Strategy Environ. 2012, 22, 145–158. [Google Scholar]

