3.1. Physical-Chemical Analyses
The results of physical-chemical analysis (mean ± standard deviation, minimum, median, maximum values) are indicated in
Table 3,
Table 4. The value of these statistical parameters is first presented considering all the sampling points and then stratifying the data by the source categories. The number of samples analysed (N), the applicable WHO GVs [
8] for drinking water and the percentage of samples with concentrations not within the GVs are also indicated. Chloride, sulphate, copper, cadmium and chromium (VI) are not included in the Tables since their concentrations were always below the detection limit of the analytical instruments (and also of WHO GVs).
Table 3.
Distribution of the main physical-chemical parameters in the samples.
Table 3.
Distribution of the main physical-chemical parameters in the samples.
| Parameter | Source category | N | Mean±St.Dev | Min | Median | Max | WHO GV | % not within GV |
|---|
| pH | All | 38 | 6.7 ± 0.5 | 5.9 | 6.7 | 7.9 | 6.5–8.5 | 26 |
| 1 | 3 | 7.1 ± 0.2 | 6.8 | 7.1 | 7.4 | 6.5–8.5 | 0 |
| 2 | 9 | 6.6 ± 0.2 | 6.4 | 6.6 | 7.0 | 22 |
| 3 | 10 | 6.6 ± 0.3 | 6.1 | 6.6 | 7.0 | 30 |
| 4 | 7 | 6.4 ± 0.4 | 5.9 | 6.5 | 7.1 | 71 |
| 5 | 9 | 7.3 ± 0.4 | 6.6 | 7.3 | 7.9 | 0 |
| Conductivity (μS/cm) | All | 38 | 243 ± 195 | 30 | 220 | 1,128 | - | - |
| 1 | 3 | 198 ± 73 | 95 | 249 | 250 | - | - |
| 2 | 9 | 250 ± 88 | 54 | 300 | 350 | - |
| 3 | 10 | 370 ± 266 | 159 | 294 | 1,128 | - |
| 4 | 7 | 239 ± 209 | 30 | 186 | 687 | - |
| 5 | 9 | 111 ± 52 | 56 | 85 | 218 | - |
| Temperature (°C) | All | 38 | 29.0 ± 2.3 | 24.2 | 29.8 | 33.7 | - | - |
| 1 | 3 | 32.6 ± 0.8 | 32.0 | 32.2 | 33.7 | - | - |
| 2 | 9 | 29.7 ± 1.3 | 27.5 | 30.3 | 31.0 | - |
| 3 | 10 | 29.7 ± 1.8 | 26.7 | 30.3 | 31.9 | - |
| 4 | 7 | 27.5 ± 2.1 | 24.2 | 27.1 | 30.1 | - |
| 5 | 9 | 27.3 ± 2.2 | 24.3 | 27.3 | 30.4 | - |
| Turbidity (NTU) | All | 38 | 62.7 ± 119.9 | 0.2 | 14.2 | 544.0 | 5.0 | 66 |
| 1 | 3 | 81.8 ± 111.9 | 0.5 | 4.7 | 240.0 | 5.0 | 33 |
| 2 | 9 | 2.6 ± 2.8 | 0.2 | 1.5 | 9.5 | 22 |
| 3 | 10 | 15.0 ± 15.8 | 1.7 | 6.8 | 53.3 | 60 |
| 4 | 7 | 123.4 ± 148.5 | 14.3 | 46.9 | 395.0 | 100 |
| 5 | 9 | 122.2 ± 162.6 | 13.4 | 46.3 | 544.0 | 100 |
| Hardness(°f) | All | 18 | 7.6 ± 8.4 | 0.3 | 5.5 | 39.8 | - | - |
| 1 | 2 | 4.75 ± 1.0 | 3.8 | 4.8 | 5.8 | - | - |
| 2 | 6 | 7.25 ± 3.2 | 3.5 | 6.3 | 13.3 | - |
| 3 | 5 | 13.6 ± 13.2 | 4.0 | 9.0 | 39.8 | - |
| 4 | 2 | 2.5 ± 1.8 | 0.8 | 2.5 | 4.3 | - |
| 5 | 3 | 3.6 ± 3.7 | 0.3 | 1.8 | 8.8 | - |
The majority of the sources had a pH lower than the neutrality. Low pH values were typical of boreholes and open dug wells, while piped and surface waters were near to neutrality. There is no health based guideline for pH, although a range of 6.5–8.5 is suggested by WHO. Of the samples 26% fell outside the recommended pH range, being acidic in nature. Literature data [
20,
21,
22,
23] demonstrated that, at low pH, water can be corrosive and cause damage to equipment, since it can increase metal leaching from pipes and fixtures, such as copper and lead. As a consequence, low pH values indirectly affect human health, since heavy metals released into the water from pipes can have adverse consequences on people. Damaged metal pipes due to acidic pH values can also lead to aesthetic problems, causing water to have a metallic or sour taste. The minimum and maximum pH values (5.9 and 7.9) were observed respectively in the simple open dug wells of Domo Kori (Chad) and in the surface water (Logone River) sampled near Bongor city (Chad).
Table 4.
Distribution of other chemical parameters in the samples.
Table 4.
Distribution of other chemical parameters in the samples.
| Parameter | Source category | N | Mean ± St.Dev | Min | Median | Max | WHO GV | % not within GV |
|---|
| Fluoride (mg/L) | All | 38 | 0.17 ± 0.22 | 0.05 | 0.10 | 1.10 | 1.50 | 0 |
| 1 | 3 | 0.2 ± 0.12 | 0.11 | 0.21 | 0.40 | 1.50 | 0 |
| 2 | 9 | 0.16 ± 0.12 | 0.07 | 0.10 | 0.41 | 0 |
| 3 | 10 | 0.15 ± 0.09 | 0.05 | 0.11 | 0.36 | 0 |
| 4 | 7 | 0.21 ± 0.36 | 0.05 | 0.06 | 1.10 | 0 |
| 5 | 9 | 0.22 ± 0.27 | 0.09 | 0.13 | 0.97 | 0 |
| Nitrate(mg/L NO3−N) | All | 36 | 1.5 ± 4.7 | 0.0 | 0.3 | 27.6 | 50.0 | 0 |
| 1 | 3 | 0.7 ± 0.6 | 0.2 | 0.4 | 1.5 | 50.0 | 0 |
| 2 | 7 | 0.3 ± 0.4 | 0.0 | 0.1 | 1.2 | 0 |
| 3 | 10 | 3.4 ± 8.1 | 0.0 | 0.4 | 27.6 | 0 |
| 4 | 7 | 2.0 ± 2.8 | 0.2 | 1.3 | 8.8 | 0 |
| 5 | 9 | 0.4 ± 0.5 | 0.0 | 0.2 | 1.8 | 0 |
| Phosphate(mg/L PO4−P) | All | 36 | 0.37 ± 0.38 | 0.00 | 0.25 | 1.86 | - | - |
| 1 | 3 | 0.66 ± 0.33 | 0.30 | 0.58 | 1.10 | - | - |
| 2 | 7 | 0.41 ± 0.32 | 0.04 | 0.29 | 1.06 | - |
| 3 | 10 | 0.38 ± 0.24 | 0.09 | 0.30 | 0.77 | - |
| 4 | 7 | 0.47 ± 0.60 | 0.01 | 0.25 | 1.86 | - |
| 5 | 9 | 0.14 ± 0.14 | 0.00 | 0.07 | 0.48 | - |
| Iron(mg/L) | All | 38 | 3.71 ± 6.93 | 0.00 | 0.39 | 25.20 | 0.30 | 55 |
| 1 | 3 | 6.54 ± 9.24 | 0.00 | 0.01 | 19.60 | 0.30 | 33 |
| 2 | 9 | 6.54 ± 9.96 | 0.00 | 0.94 | 25.20 | 67 |
| 3 | 10 | 1.97 ± 4.40 | 0.05 | 0.26 | 15.00 | 40 |
| 4 | 7 | 4.35 ± 6.25 | 0.04 | 0.26 | 16.30 | 43 |
| 5 | 9 | 1.37 ± 1.79 | 0.20 | 0.70 | 6.20 | 78 |
| Manganese(mg/L) | All | 38 | 0.27 ± 0.42 | 0.00 | 0.00 | 1.50 | 0.40 | 24 |
| 1 | 3 | 0.3 ± 0.42 | 0.00 | 0.00 | 0.90 | 0.40 | 33 |
| 2 | 9 | 0.36 ± 0.52 | 0.00 | 0.00 | 1.50 | 33 |
| 3 | 10 | 0.24 ± 0.39 | 0.00 | 0.00 | 1.10 | 20 |
| 4 | 7 | 0.37 ± 0.41 | 0.00 | 0.20 | 1.10 | 29 |
| 5 | 9 | 0.12 ± 0.28 | 0.00 | 0.00 | 0.90 | 11 |
| Zinc(mg/L) | All | 20 | 0.14 ± 0.14 | 0.02 | 0.07 | 0.56 | 3.00 | 0 |
| 1 | 3 | 0.23 ± 0.07 | 0.17 | 0.18 | 0.32 | 3.00 | 0 |
| 2 | 5 | 0.23 ± 0.20 | 0.03 | 0.15 | 0.56 | 0 |
| 3 | 4 | 0.08 ± 0.05 | 0.04 | 0.07 | 0.16 | 0 |
| 4 | 3 | 0.13 ± 0.08 | 0.04 | 0.13 | 0.22 | 0 |
| 5 | 5 | 0.03 ± 0.01 | 0.02 | 0.03 | 0.04 | 0 |
| Lead(mg/L) | All | 37 | 0.29 ± 0.39 | 0.01 | 0.12 | 1.52 | 0.01 | 95 |
| 1 | 3 | 0.15 ± 0.15 | 0.02 | 0.07 | 0.36 | 0.01 | 100 |
| 2 | 9 | 0.52 ± 0.56 | 0.02 | 0.21 | 1.52 | 100 |
| 3 | 10 | 0.32 ± 0.36 | 0.02 | 0.14 | 1.13 | 100 |
| 4 | 7 | 0.23 ± 0.19 | 0.02 | 0.18 | 0.63 | 100 |
| 5 | 8 | 0.06 ± 0.05 | 0.01 | 0.03 | 0.14 | 75 |
Turbidity should ideally be below 5 NTU, since the appearance of water with a turbidity of less than this value is usually acceptable to consumers [
8]. It does not have a health based guideline; nevertheless, microorganisms (bacteria, viruses and protozoa) are typically attached to particulates [
8]. As a consequence, turbid waters can be microbiologically contaminated and indirectly constitute a health issue. Furthermore, high levels of turbidity can protect microorganisms from the effects of disinfection, giving rise to a significant chlorine demand and reducing the performance of some disinfection treatments, like SODIS [
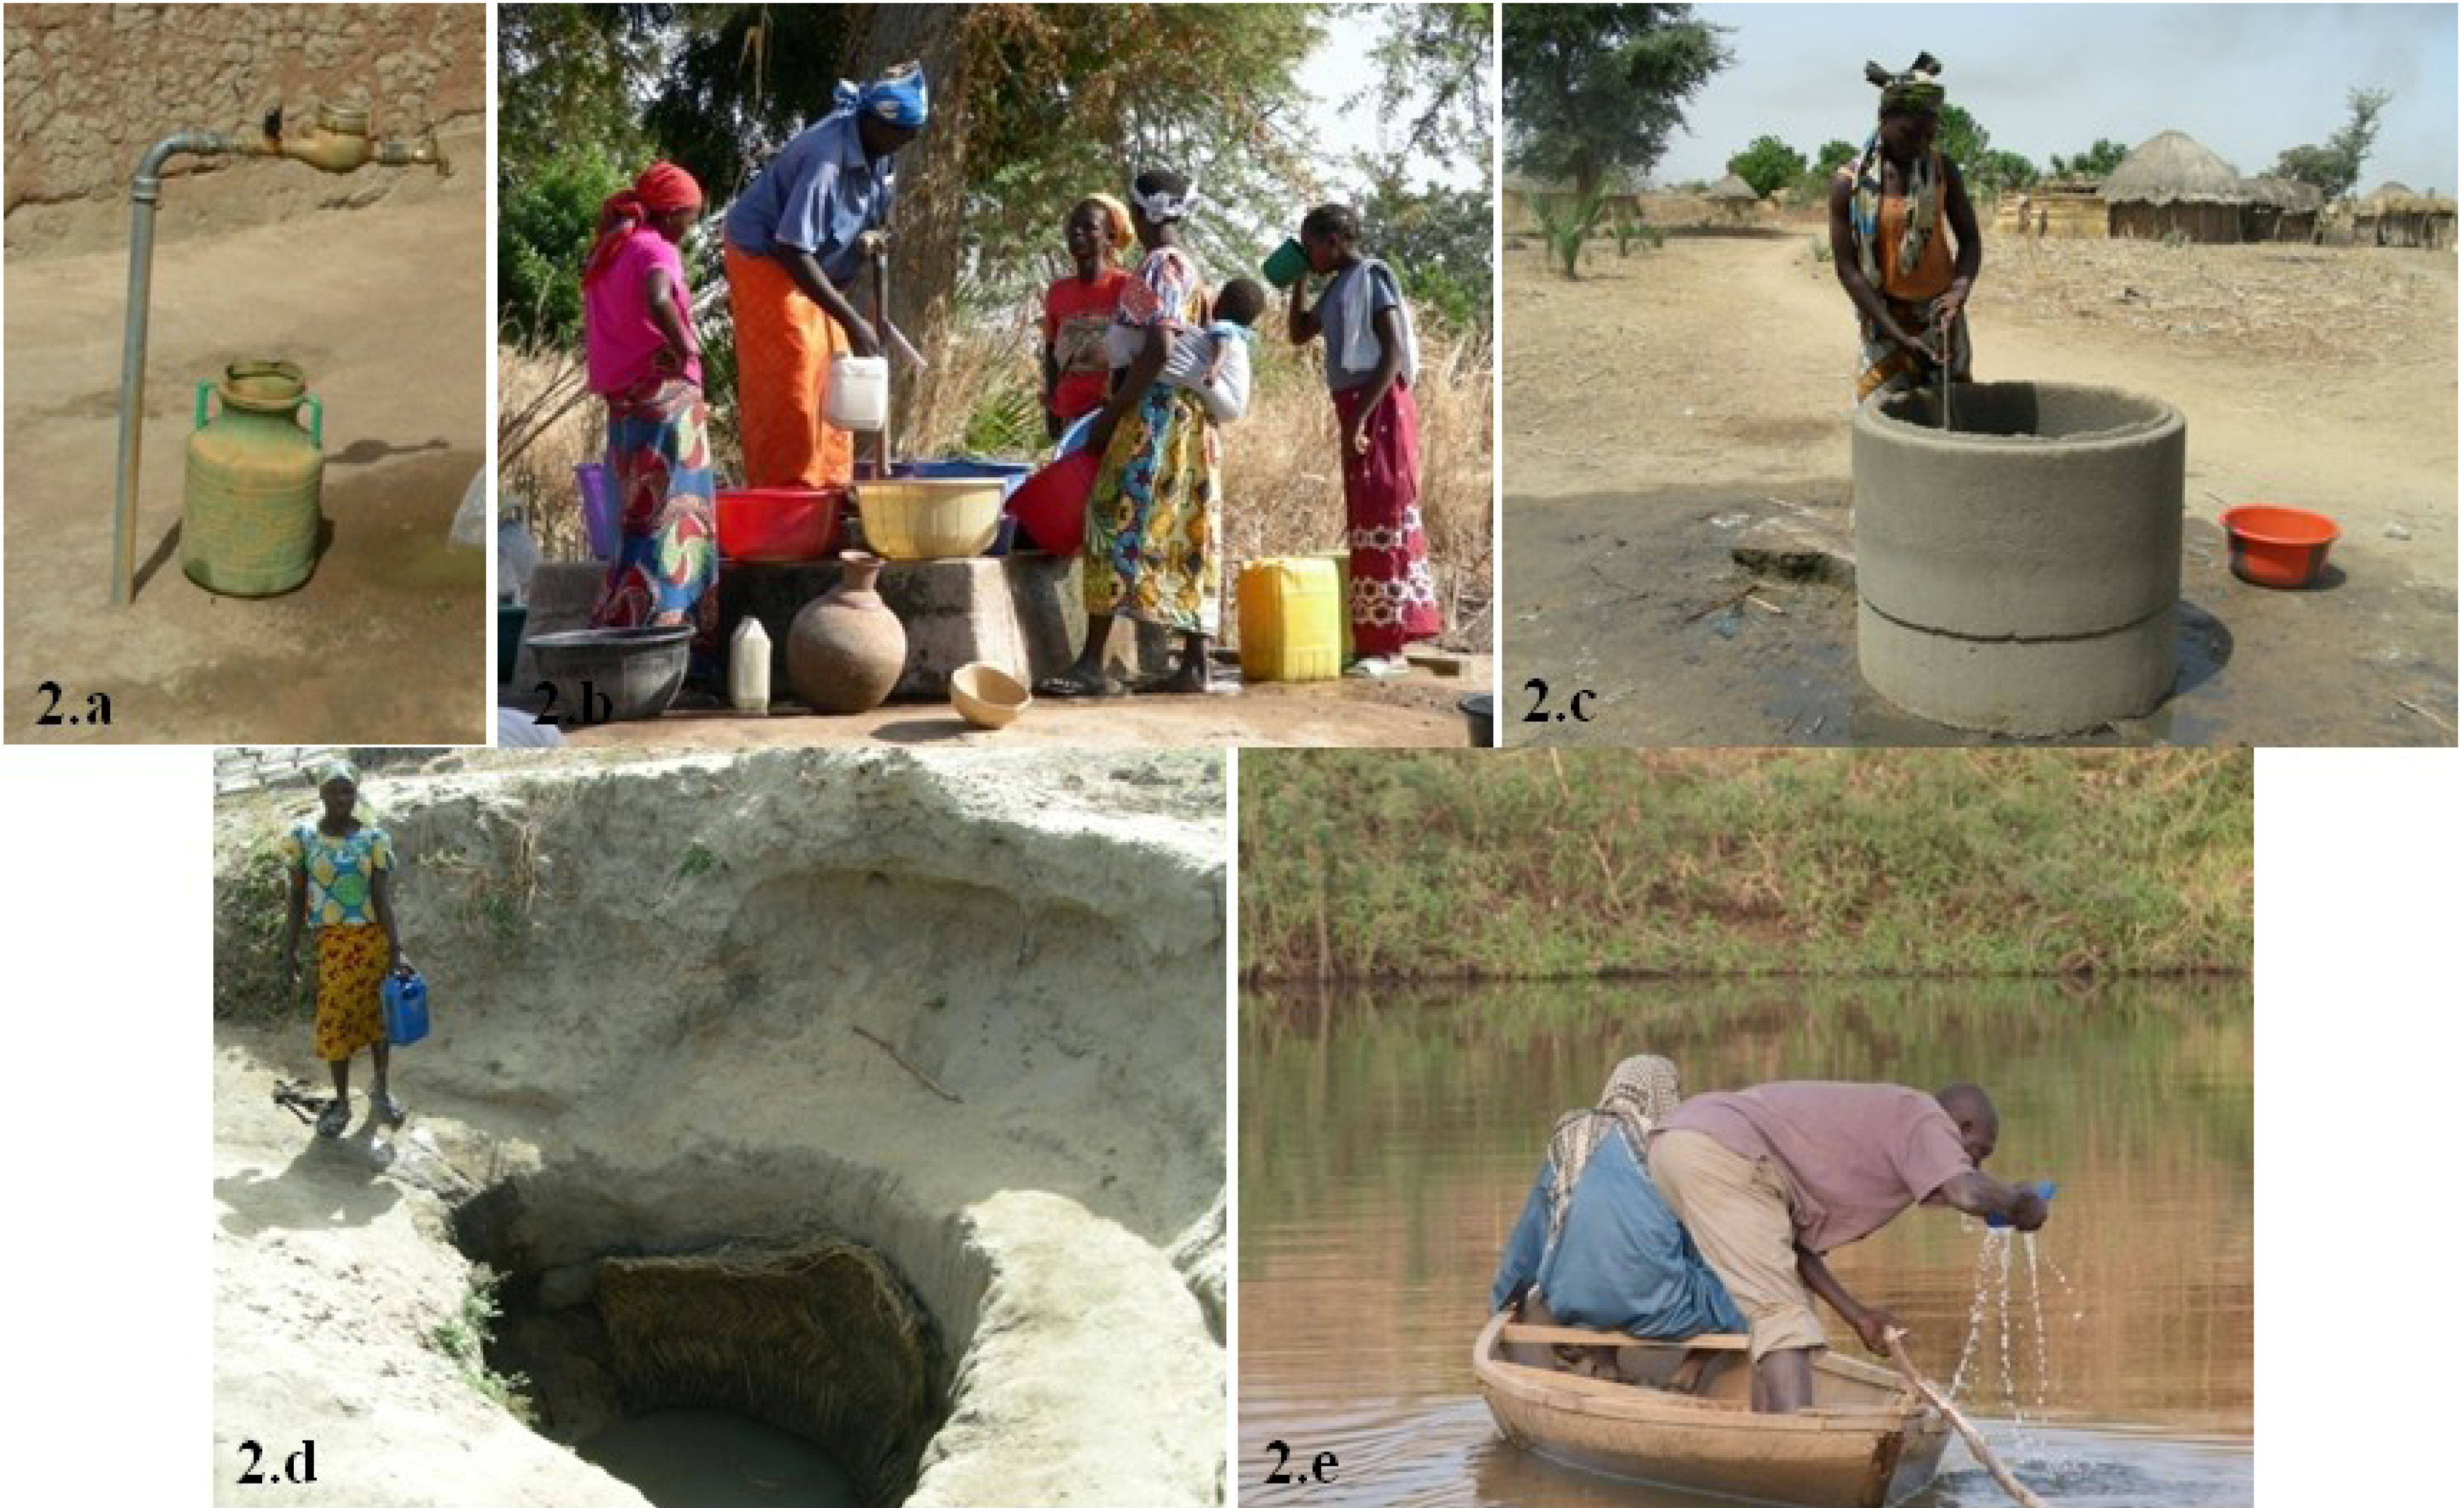
8]. Thus, turbidity could represent a key issue regarding the microbiological quality and disinfection of water. Of the samples in the Logone valley 66% were above this guideline and the turbidity was generally a problem in the simple open dug wells and in surface waters. The highest values were observed in the simple open dug wells of Kamargui-Borgoye (315 NTU) and Madalam (395 NTU) in Cameroon, with a peak (544 NTU) measured in the surface water (lake) sampled in Fianga city (Chad). High values were also found in the piped water of Fianga (244 NTU) and in the open dug well with concrete walls of Djougoumta (53 NTU). The minimum turbidity (0.2 NTU) was measured in the borehole of Guizede Marba (Chad).
The waters of the Logone valley are also rich in iron, especially in the villages of Djougoumta, Mouka, Djetel, Kamargui-Bosgoye (Cameroon) and Fianga (Chad). The highest values were measured in the borehole (25.2 mg/L) and in the open dug well with concrete walls (15.0 mg/L) in Djougoumta and in the piped water in Fianga (19.6 mg/L). No health-based guideline value is proposed for iron, although taste (organoleptic problem) is affected above 300 μg/L [
8]. Of the samples in the Logone valley 55% were above this value. This percentage and the high concentrations measured in some sources attest that the taste of water (and also the colour) is a concern in this area. In fact, results from the initial survey (questionnaires) showed that surface waters with lower concentrations were preferred for drinking use and washing clothes, rather than highly iron-concentrated sources.
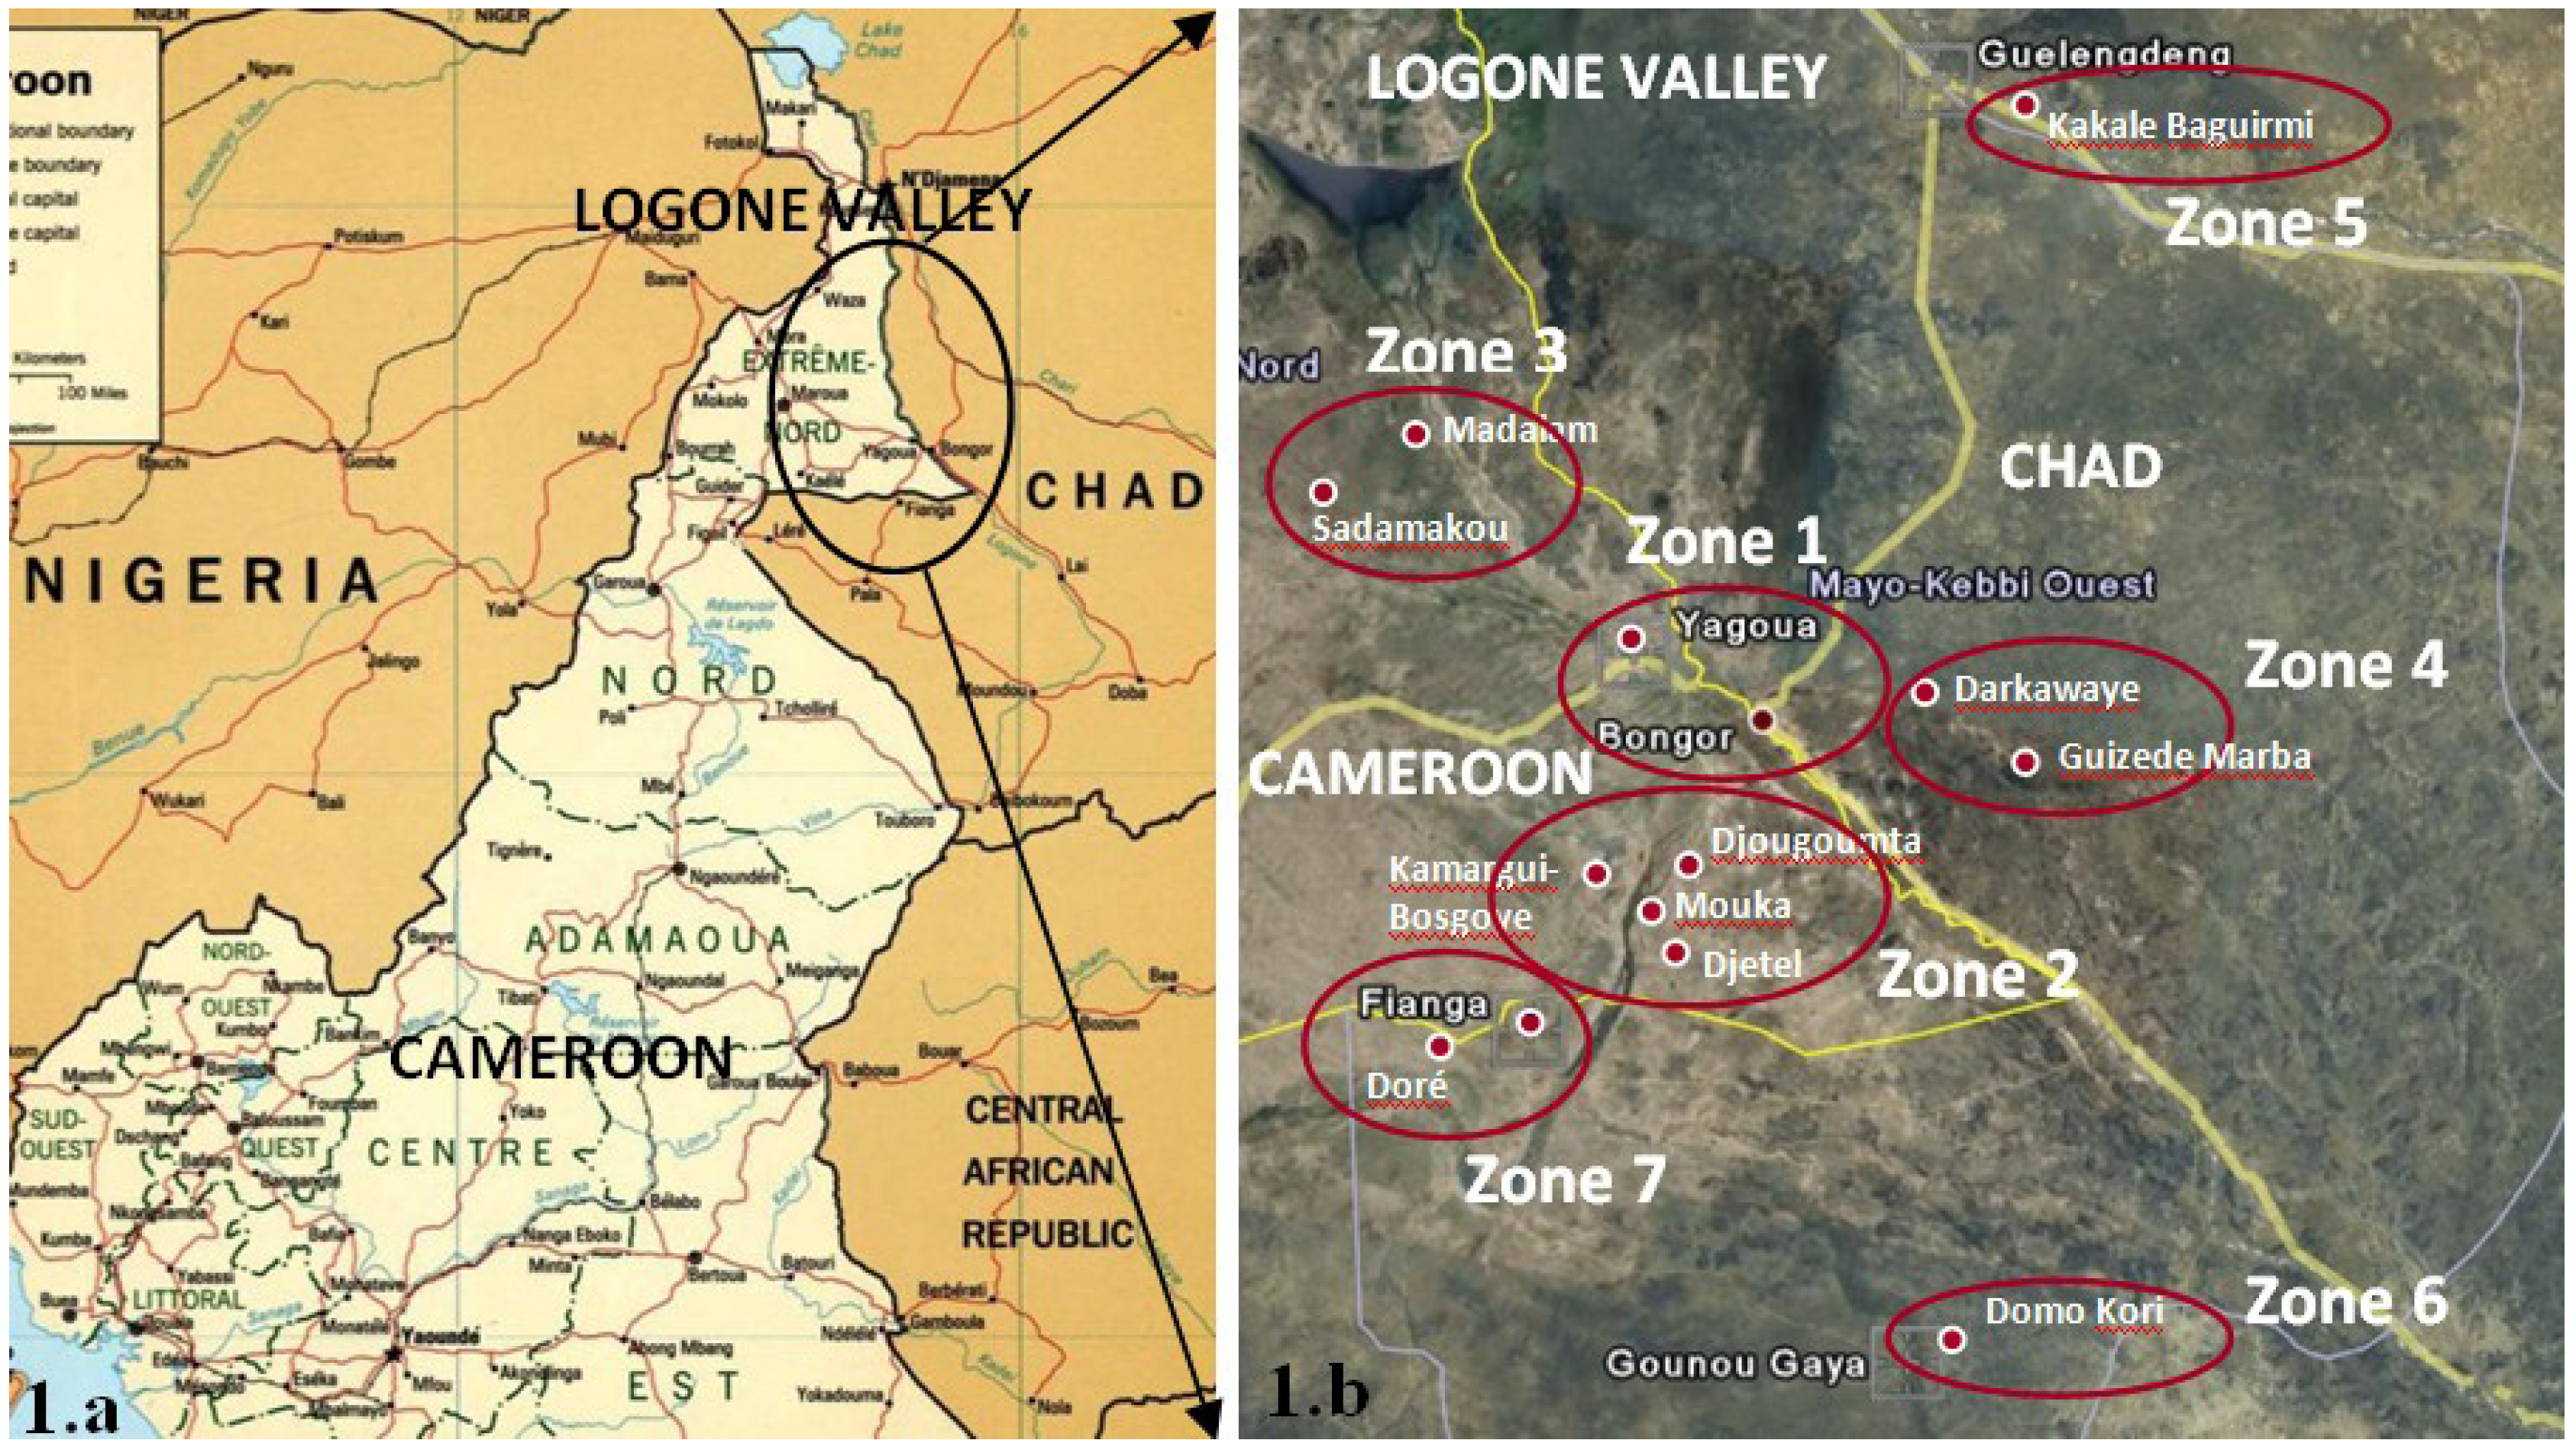
The presence of iron in the waters of the Logone valley is first of all associated with the territory. In fact the villages affected by this problem belong to the same area (Zone 2 in Cameroon and Zone 7 in Chad), that overlooks lake Guere. On the contrary, sources in the other villages did not show problems of iron and a total absence was observed in the piped water of Yagoua (Cameroon) and in the borehole of Doré (Chad). Secondly, iron concentration depends on the sampled water table. In fact, considering boreholes and shallow open wells, it was observed that Fe concentrations increased with the depth of the water. As an example, in Fianga, piped water that showed problems of iron comes from a 30 m deep water table, while other source categories that catch the superficial water table (<10 m deep) had iron concentrations not exceeding the WHO organoleptic standard (0.3 mg/L). Surface waters were also found to be contaminated by iron, since 78% of the samples did not comply with the WHO GV, even though their concentrations were lower than concentrations found in other source categories.
Therefore, the immediate environment of these sources was reducing in nature since the chemistry of naturally occurring Fe is controlled by the redox conditions of the water and Fe is mobilised under reducing conditions [
5]. The input of iron in superficial waters is due to the phenomenon of soil leaching and the input in underground waters is the result of the water-rock interaction.
Concerning manganese, 24% of the sampled sources had concentrations exceeding the WHO GV of 0.4 mg/L. The maximum value (1.5 mg/L) was observed in the borehole of Kamargui-Bosgoye (Cameroon). Furthermore, Fe and Mn showed a similar behaviour. In fact, high concentrations of Mn were found in the same sources where Fe was high. Secondly, Mn concentrations increased with water depth, as observed for iron. Manganese is an essential human micronutrient and most human intake occurs through consumption of various types of food. Inhalation studies linked chronic manganese intake with neurological disorders; however, data on the human health effects of long-term exposure to elevated manganese levels through oral intake (food and water) are still limited [
8,
24]. The first epidemiological studies associated adverse neurological effects with long-term exposure to manganese from drinking water [
25,
26,
27]. However, in a recently published study [
28], a child exposed to increased manganese in drinking water and affected by increased manganese levels in his hair and blood did not exhibit any evident clinical effects of manganese over-exposure, except for difficulties in both visual and verbal memory. No studies are available on the potential carcinogenicity of exposure to high levels of manganese in humans [
24]. Due to a lack of qualitative and quantitative details of the exposure scenario, these and other similar studies cannot be used for quantitative assessment [
29] and manganese is primarily referred to in regulations [
8,
30] as a parameter regarding public acceptance of drinking water rather than human health.
WHO [
8] sets a health based guideline of 0.01 mg/L for lead concentration in drinking water, as it is a general toxicant that accumulates in the skeleton and that causes adverse neurological effects after long-term exposure. During the monitoring in the Logone valley, lead concentration did not comply with the WHO GV (0.01 mg/L) in 95% of the sources. In particular, it exceeded this standard in 100% of the piped waters, boreholes and open dug wells, while 25% of the sampled superficial waters had a lead concentration below 0.01 mg/L. A maximum value of 1.5 mg/L was measured in the borehole of Kamargui-Bosgoye, while a minimum value of 0.01 mg/L was measured in the Logone river near Yagoua. In the same way as for Fe and Mn, high concentrations of Pb were also found mostly in boreholes rather than in shallow open wells and in surface waters, so that a correlation with the depth of the water could be possible. Furthermore, high concentrations were measured mainly inzones 2 and 7, as observed for iron and manganese.
Most lead in drinking-water arises from plumbing. So, it is possible that boreholes and open dug wells with concrete walls were constructed with materials containing this metal. Nevertheless, lead was found also in superficial waters and in simple open dug wells with ground walls; as a consequence its presence in these source typologies has a different origin. The Logone valley is a rural area with no industrial activities or uncontrolled dumping and therefore such high concentrations of lead could not be possible from such sources. As a consequence, lead in such waters could originate from sources other than human pollution and it could be due to the geology of the subsoil [
16,
17].
Regarding the chemical parameters of main concern (turbidity, iron, manganese and lead),
Table 5 reports the villages at higher risk, specifying the level of contamination of the water sources.
Furthermore,
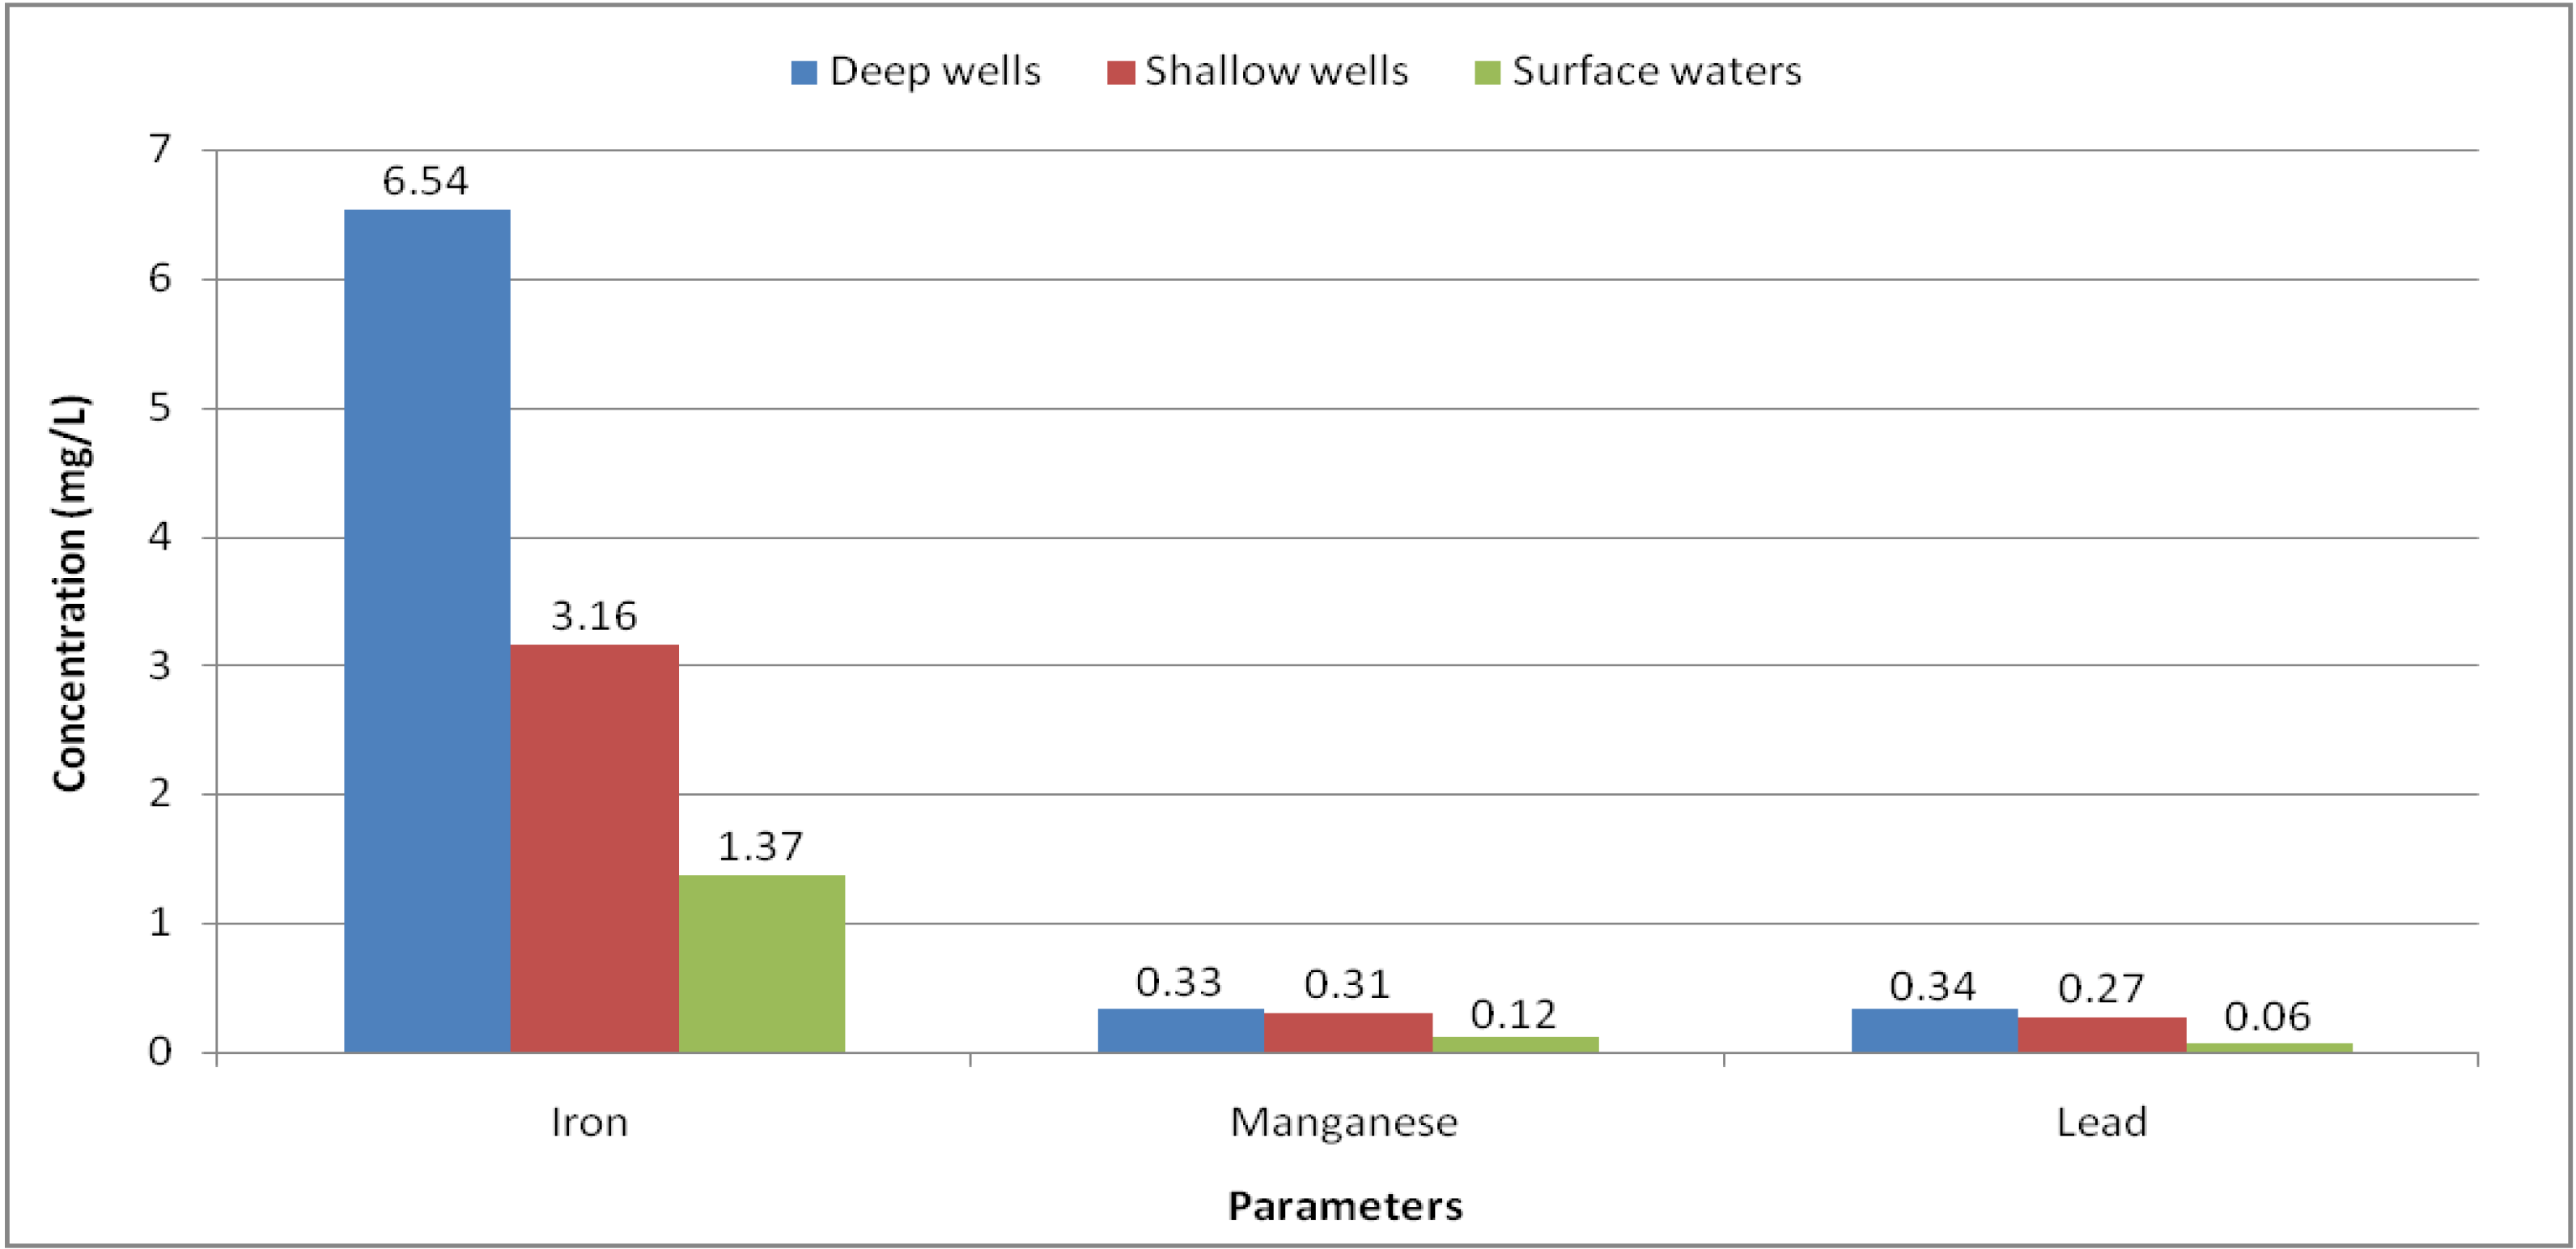
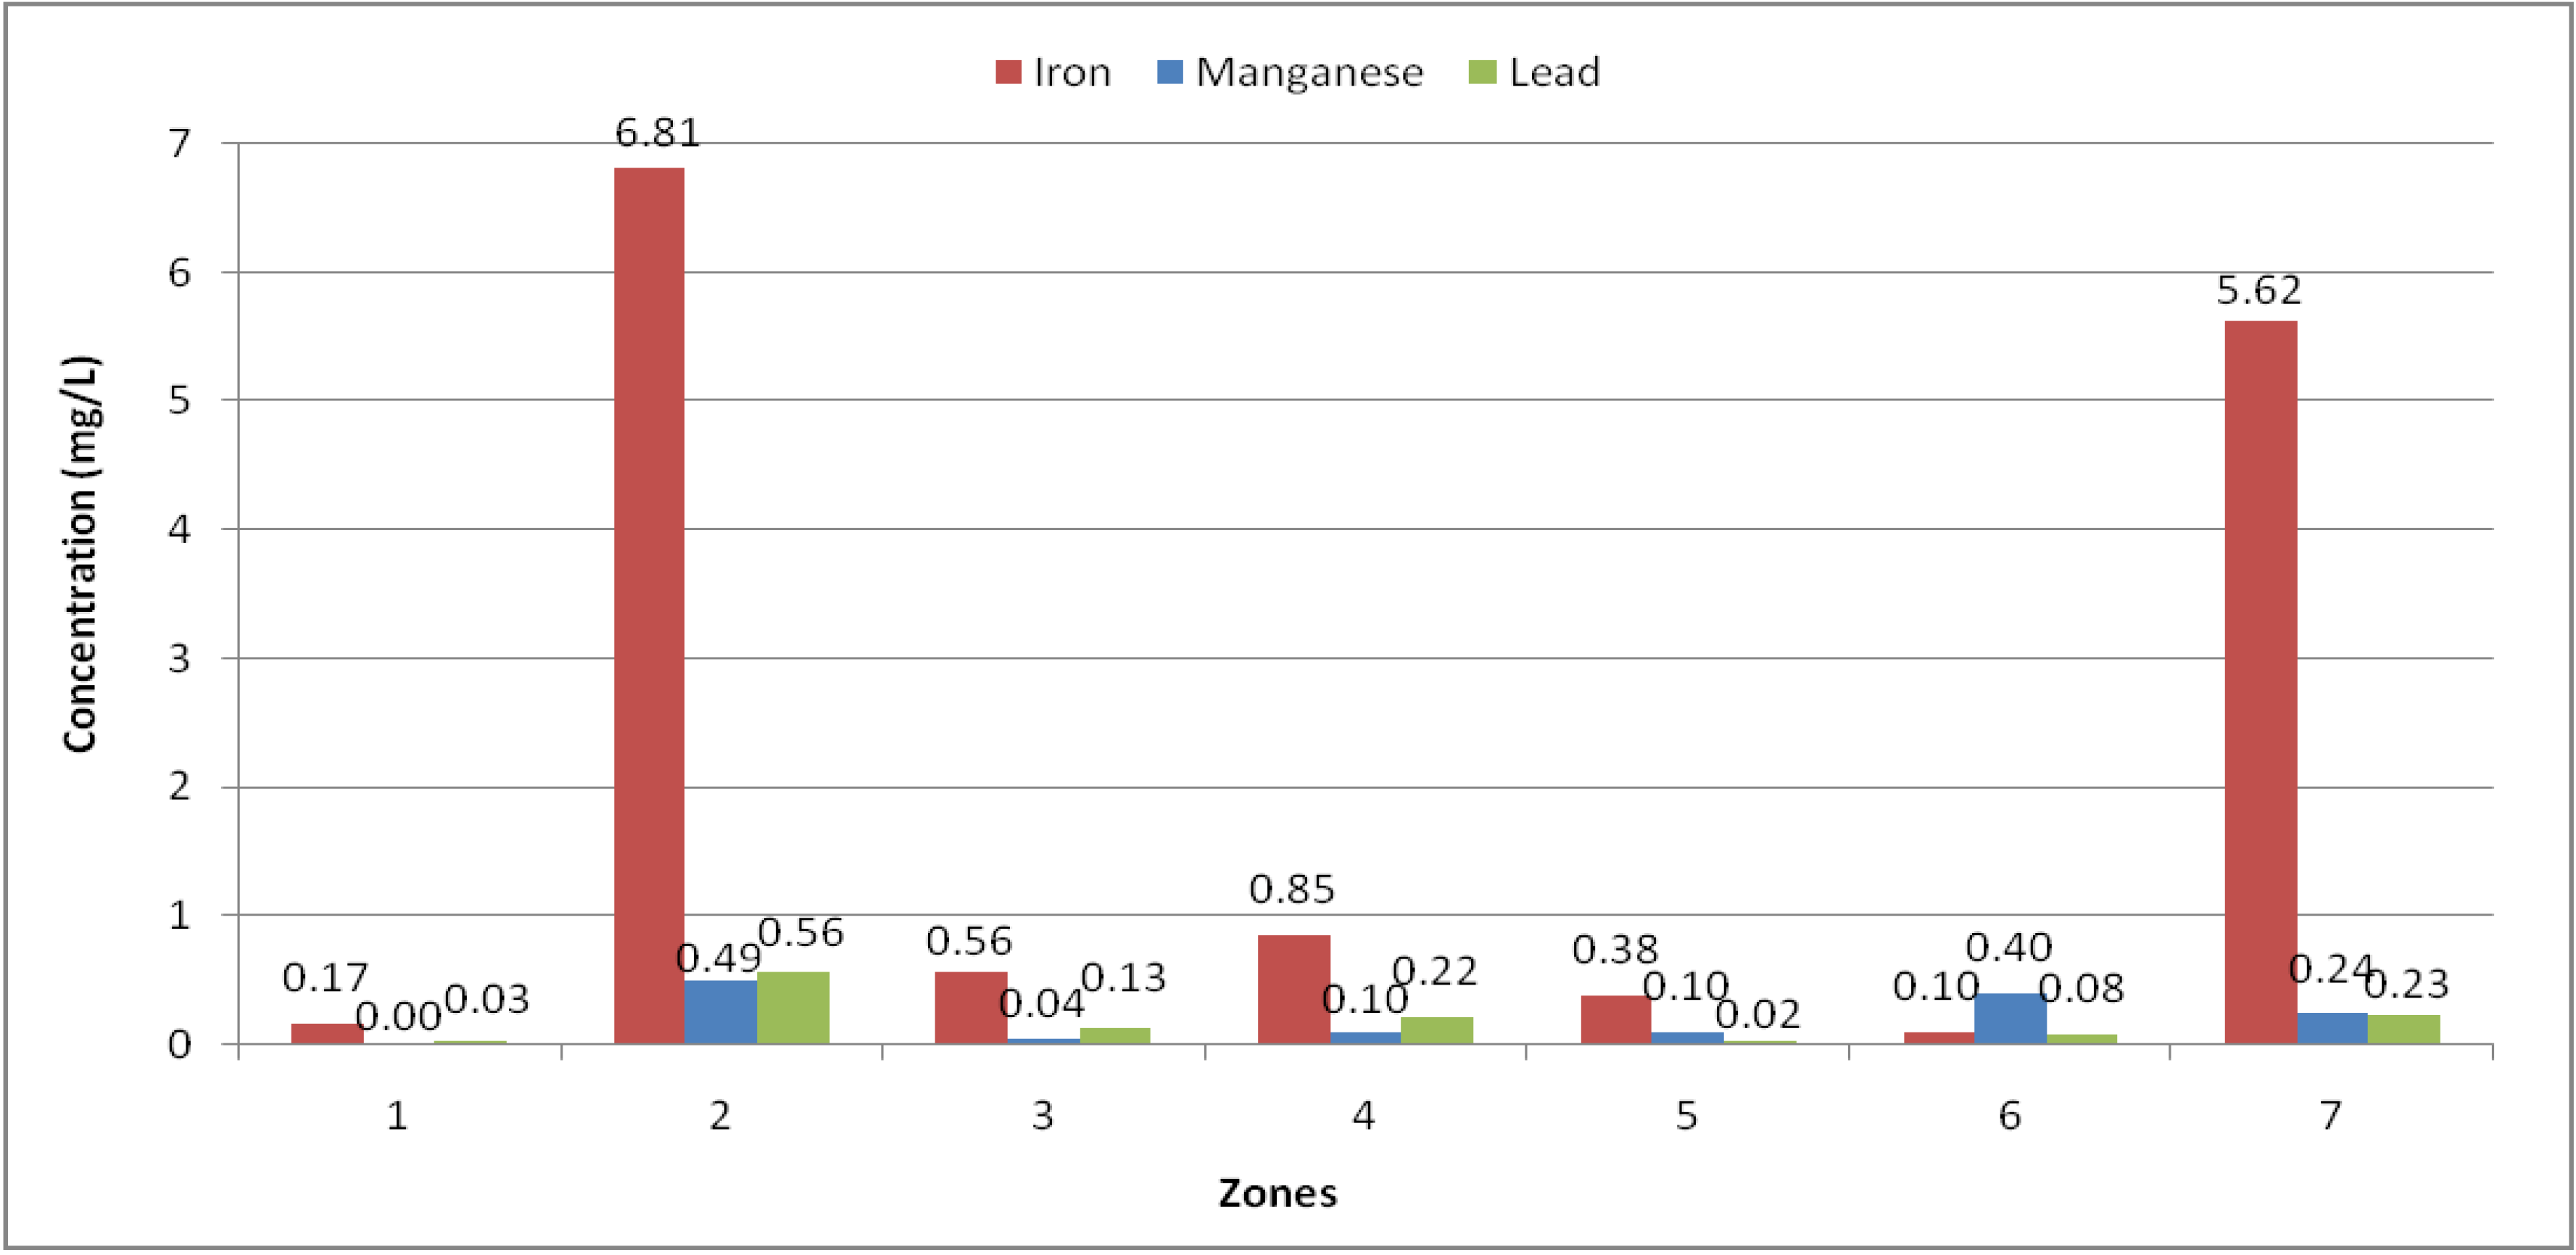
Figure 3 shows that the water sources in zones 2 (Cameroon) and 7 (Chad) are the most contaminated. In addition, in
Figure 4 it is possible to observe that the deep waters (tap waters and boreholes with a hand pump) have the highest concentrations, followed by waters from shallow wells (open wells with concrete walls and simple open wells) and by surface waters.
Table 5.
Villages with the highest concentrations of turbidity, iron, manganese and lead.
Table 5.
Villages with the highest concentrations of turbidity, iron, manganese and lead.
| Village | Source category | Turbidity (NTU) | Fe (mg/L) | Mn (mg/L) | Pb (mg/L) |
|---|
| Kamargui-Bosgoye | 2 | 9.5 | 5.7 | 1.5 | 1.5 |
| 4 | 315.0 | 11.7 | 0.9 | 0.6 |
| Djougoumta | 2 | 2.9 | 25.2 | 0.7 | 1.3 |
| 3 | 53.3 | 15.0 | 1.1 | 1.1 |
| Djetel | 3 | 29.3 | 2.5 | 0.9 | 0.8 |
| Mouka | 4 | 23.0 | 16.3 | 0.3 | 0.3 |
| Fianga | 1 | 240.0 | 19.6 | 0.9 | 0.4 |
| 2 | 5.1 | 24.6 | 0.9 | 1.0 |
| 5 | 544.0 | 0.2 | 0.1 | 0.1 |
| Madalam | 4 | 395.0 | 0.3 | 0.2 | 0.3 |
Figure 3.
Iron, manganese and lead mean concentrations stratified by the territorial zones in the Logone valley.
Figure 3.
Iron, manganese and lead mean concentrations stratified by the territorial zones in the Logone valley.
Zone 1: Number of samples N = 4; Zone 2: N = 13; Zone 3: N = 5; Zone 4: N = 4; Zone 5: N = 1; Zone 6: N = 3; Zone 7: N = 8.
Figure 4.
Iron, manganese and lead mean concentrations stratified by the depth of water sources.
Figure 4.
Iron, manganese and lead mean concentrations stratified by the depth of water sources.
Deep wells: Number of samples N = 12; Shallow wells: N = 17; Surface waters: N = 9.
3.2. PCA Profiles of Correlation between Different Parameters
The correlation between parameters was profiled using Principal Component Analysis (PCA).
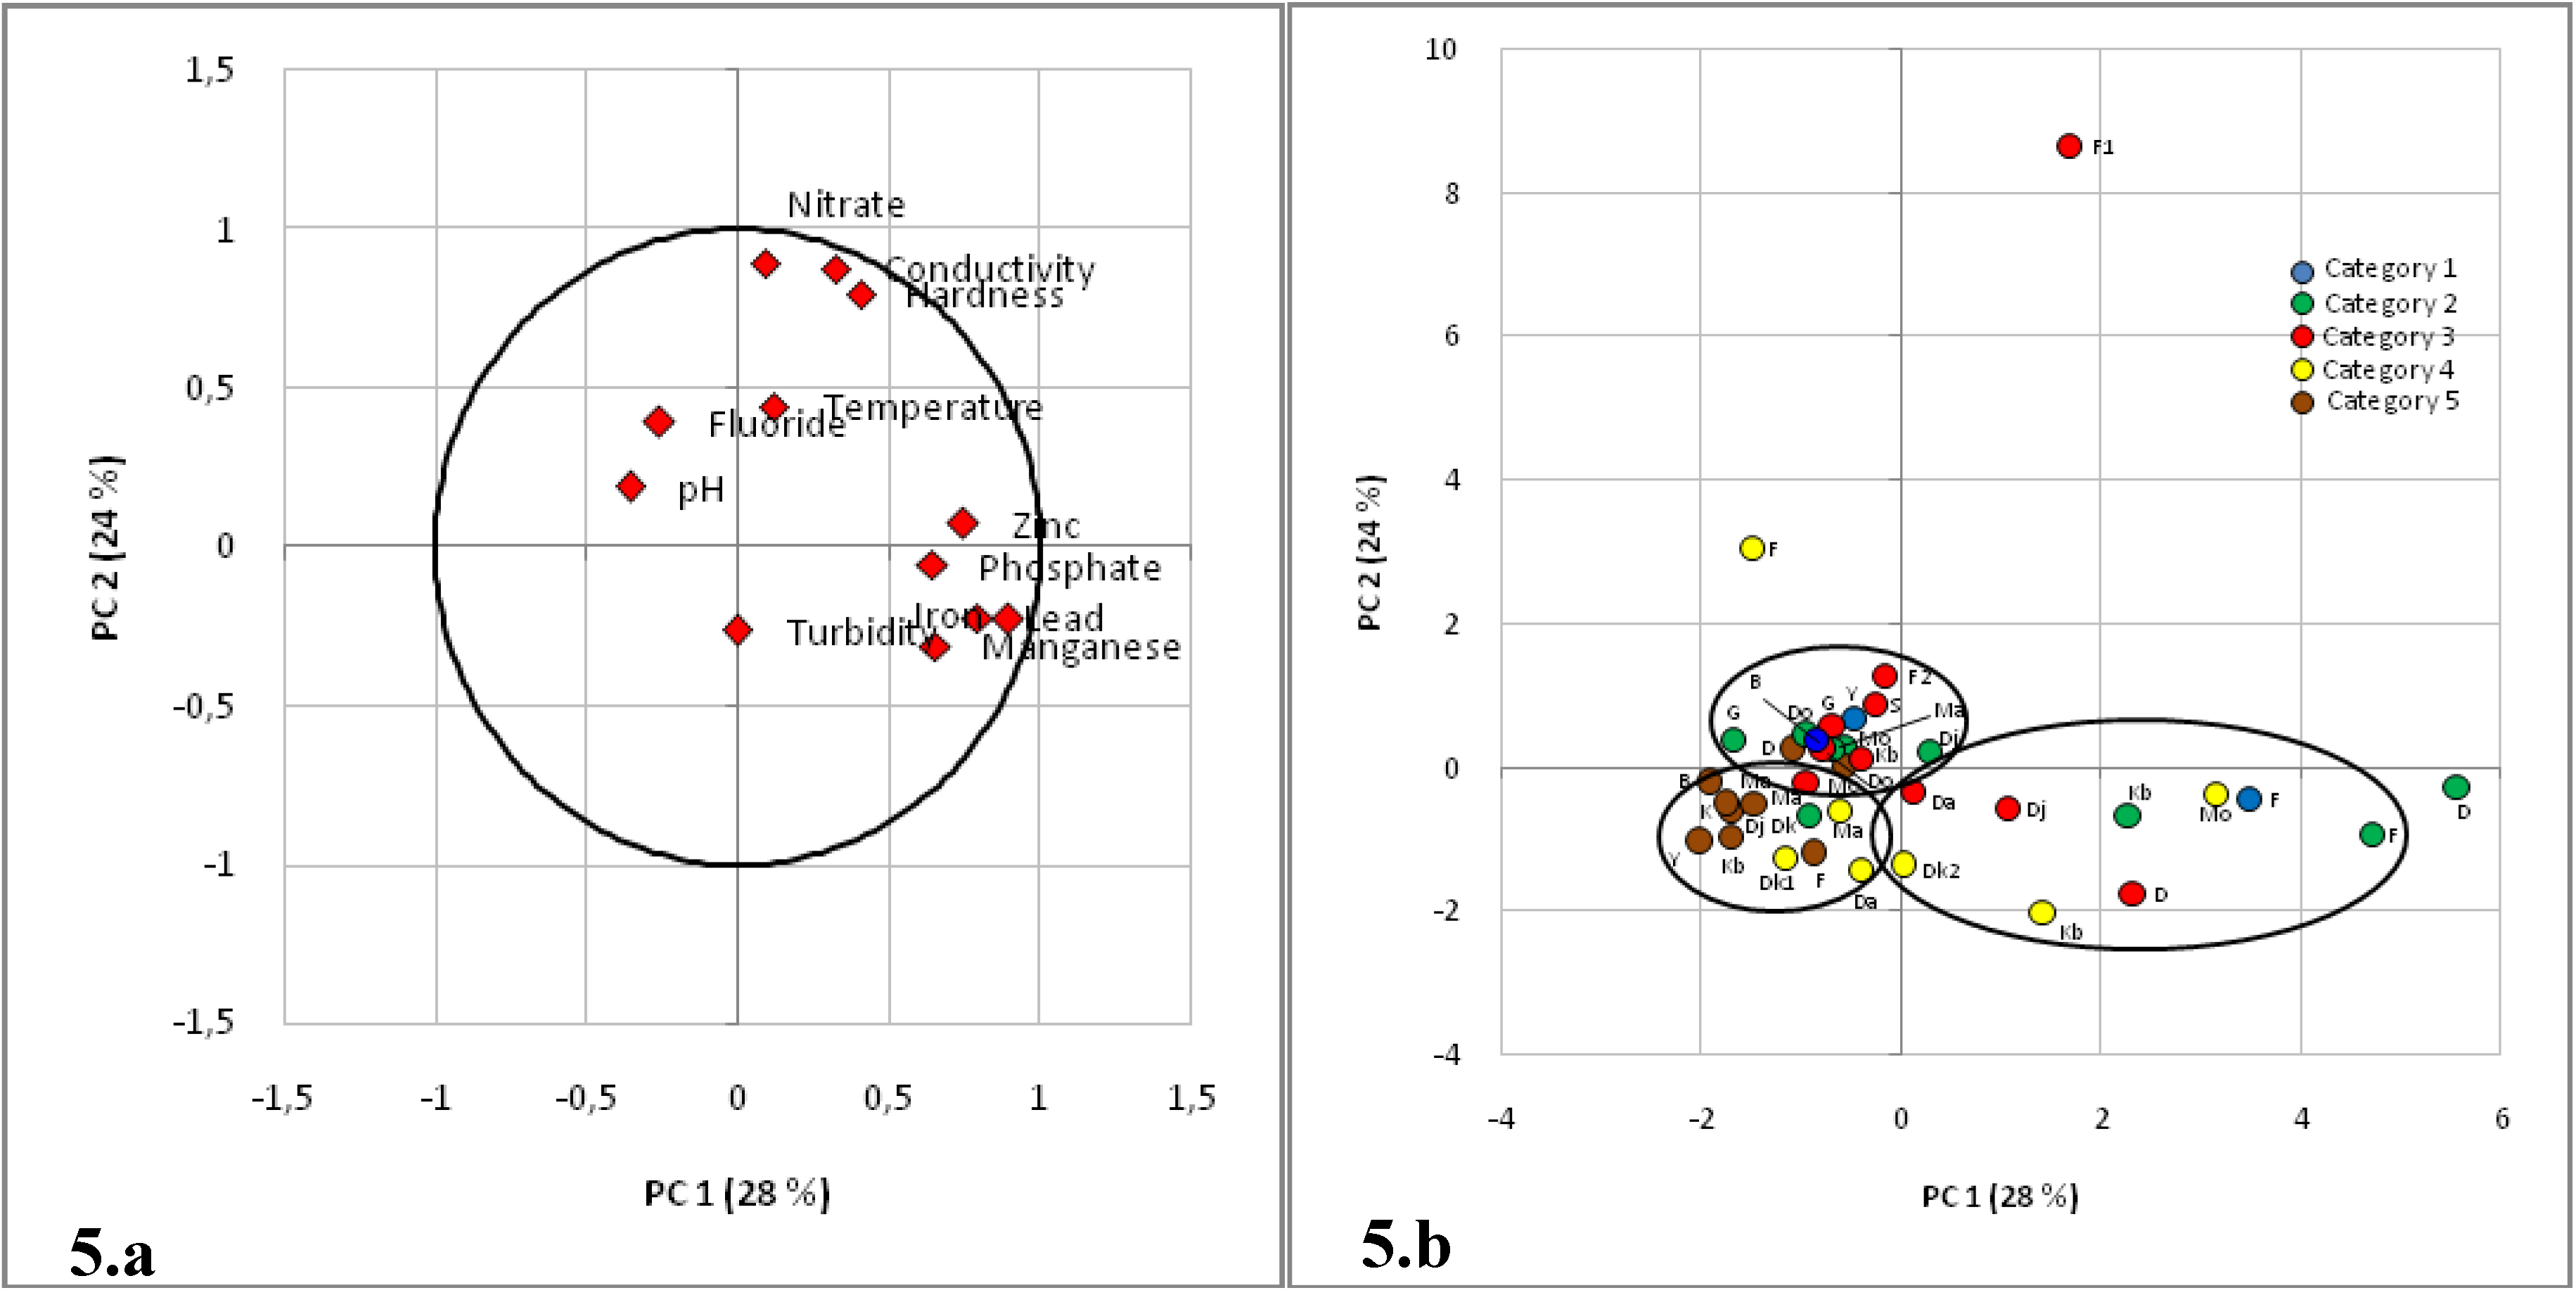
Figure 5a shows the correlation circle where all water quality parameters are represented.
Figure 5b represents the results of the PCA performed on the different categories of water samples (individuals) from Cameroon and Chad, with respect to the first (PC1) and the second (PC2) principal components (axes). The first and the second principal components respectively explained 28% and 24% of the total inertia, corresponding to a total of 52%.
Table 6 shows the value of the correlation between variables and axes as shown by PCA.
Based on the PCA analysis, variables like turbidity, temperature, fluoride and pH were not significant and had less influence on the statistical analysis. In decreasing order, Fe, Pb, Zn and Mn were highly and positively correlated to PC1 whereas pH and fluoride were negatively correlated. Compared with axis PC2, in decreasing order, nitrate, conductivity, hardness, temperature and fluoride were positively correlated whereas phosphate, lead, iron, turbidity and manganese were negatively correlated. The Pearson analysis at the probability of 0.05 showed that conductivity and nitrate, conductivity and hardness, temperature and conductivity, hardness and nitrate, phosphate and iron, phosphate and zinc, iron and manganese, iron and zinc, iron and lead, zinc and lead were significantly correlated. Based on the PCA analysis, three profiles could be identified: profile 1 consisted in variables (conductivity, temperature, hardness, nitrate and zinc) positively correlated to axis PC1 and PC2, profile 2 consisted in variables (turbidity, phosphate, iron, manganese and lead) positively correlated to axis PC1 and negatively correlated to axis PC2, profile 3 consisted in variables (pH, fluoride) negatively correlated to axis PC1 and positively correlated to axis PC2. The analysis showed that that the mineral composition of the water sample does not depend on the country, since the samples in Cameroon and Chad had the same composition.
Figure 5.
Distribution of the physical-chemical parameters with respect to the first and the second principal components in the sampled boreholes with a hand pump, open dug wells with concrete walls, simple open dug wells and surface waters. (a) Correlation circle; (b) Results of the principal component analysis.
Category 1: piped water; Category 2: boreholes with a hand pump; Category 3: open dug wells with concrete walls; Category 4: simple open dug wells; Category 5: surface waters; D: Djougoumta; Dj: Djetel; Mo: Mouka; Kb: Kamargui-Bosgoye; Ma: Madalam; S: Sadamakou; Y: Yagoua; G: Guizede Marba; Da: Darkawaye; Dk: Domo Kory; K: Kakale Baguirmi; F: Fianga; Do: Doré; B: Bongor.
Table 6.
Correlation between variables and axes as shown by Principal Component Analysis (PCA).
Table 6.
Correlation between variables and axes as shown by Principal Component Analysis (PCA).
| | PC 1 | PC 2 |
|---|
| pH | −0.36 | 0.19 |
| Conductivity | 0.32 | 0.88 |
| Temperature | 0.12 | 0.44 |
| Turbidity | 0.00 | −0.26 |
| Hardness | 0.40 | 0.80 |
| Fluoride | −0.26 | 0.39 |
| Nitrate | 0.09 | 0.89 |
| Phosphate | 0.64 | −0.06 |
| Iron | 0.89 | −0.23 |
| Manganese | 0.65 | −0.31 |
| Zinc | 0.75 | 0.07 |
| Lead | 0.79 | −0.22 |


