Indoor Thermal Comfort: The Behavioral Component

Climate Change Research Network, Vanderbilt Institute for Energy & Environment, Vanderbilt University, PMB 407702, 2301 Vanderbilt Place, Nashville, TN 37240, USA
Sustainability 2013, 5(4), 1680-1699; https://doi.org/10.3390/su5041680
Submission received: 25 February 2013
/
Revised: 2 April 2013
/
Accepted: 3 April 2013
/
Published: 22 April 2013
Abstract
:This is a study of how indoor temperature settings have changed over time in the United States based on data from the Energy Information Administration’s, Residential Energy Consumption Survey (RECS). It is shown that Americans have moderately raised indoor temperature settings during the heating season over the past thirty years. It is also shown that most Americans keep their homes relatively cool in the summertime and are generally averse to implementing temperature setbacks. It is revealed that occupants in lower-income homes tend to set their thermostats higher in winter than other income groups, but that the most intense cooling tends to take place in both low-income and high-income homes. As expected, renters tend to heat and cool more intensively than homeowners. Getting Americans to change their temperature settings in order to save energy is not easy even though it comes with the promise of financial savings. The use of programmable thermostats thus far has proved unsuccessful. Greater utilization of social marketing to achieve energy savings is suggested, as well as a renewed effort on the part of electricity suppliers to work more closely with homeowners as part of the rollout of the “smart grid”.
1. Introduction
Despite an enormous amount of literature and analysis on household energy use, we still know relatively little about the dynamics of household energy decision making [1]. The behavioral component of household energy use is critical to understanding energy use, but it usually takes a back seat to engineering /technical studies of housing structure, technologies, and home weather-proofing. This article, in contrast, will explicitly address a household energy topic—indoor thermal comfort—from a behavioral perspective. Specifically, it will examine household temperature settings, in both a current and historical perspective, using publically available information provided by the Energy Information Administration (EIA) through its multi-year Residential Energy Consumption Survey (RECS).
2. Results
Using both current and historical data from RECS, it will be shown that Americans have moderately raised indoor temperature settings during the heating season over the past thirty years, and that using the most recent data on indoor temperatures during the summertime, reveals a rather striking example of prolific energy use. Barriers to getting Americans to change temperature settings, while not reducing occupant comfort will be highlighted, and possible strategies for overcoming these barriers will be suggested.
2.1. Household Energy Use
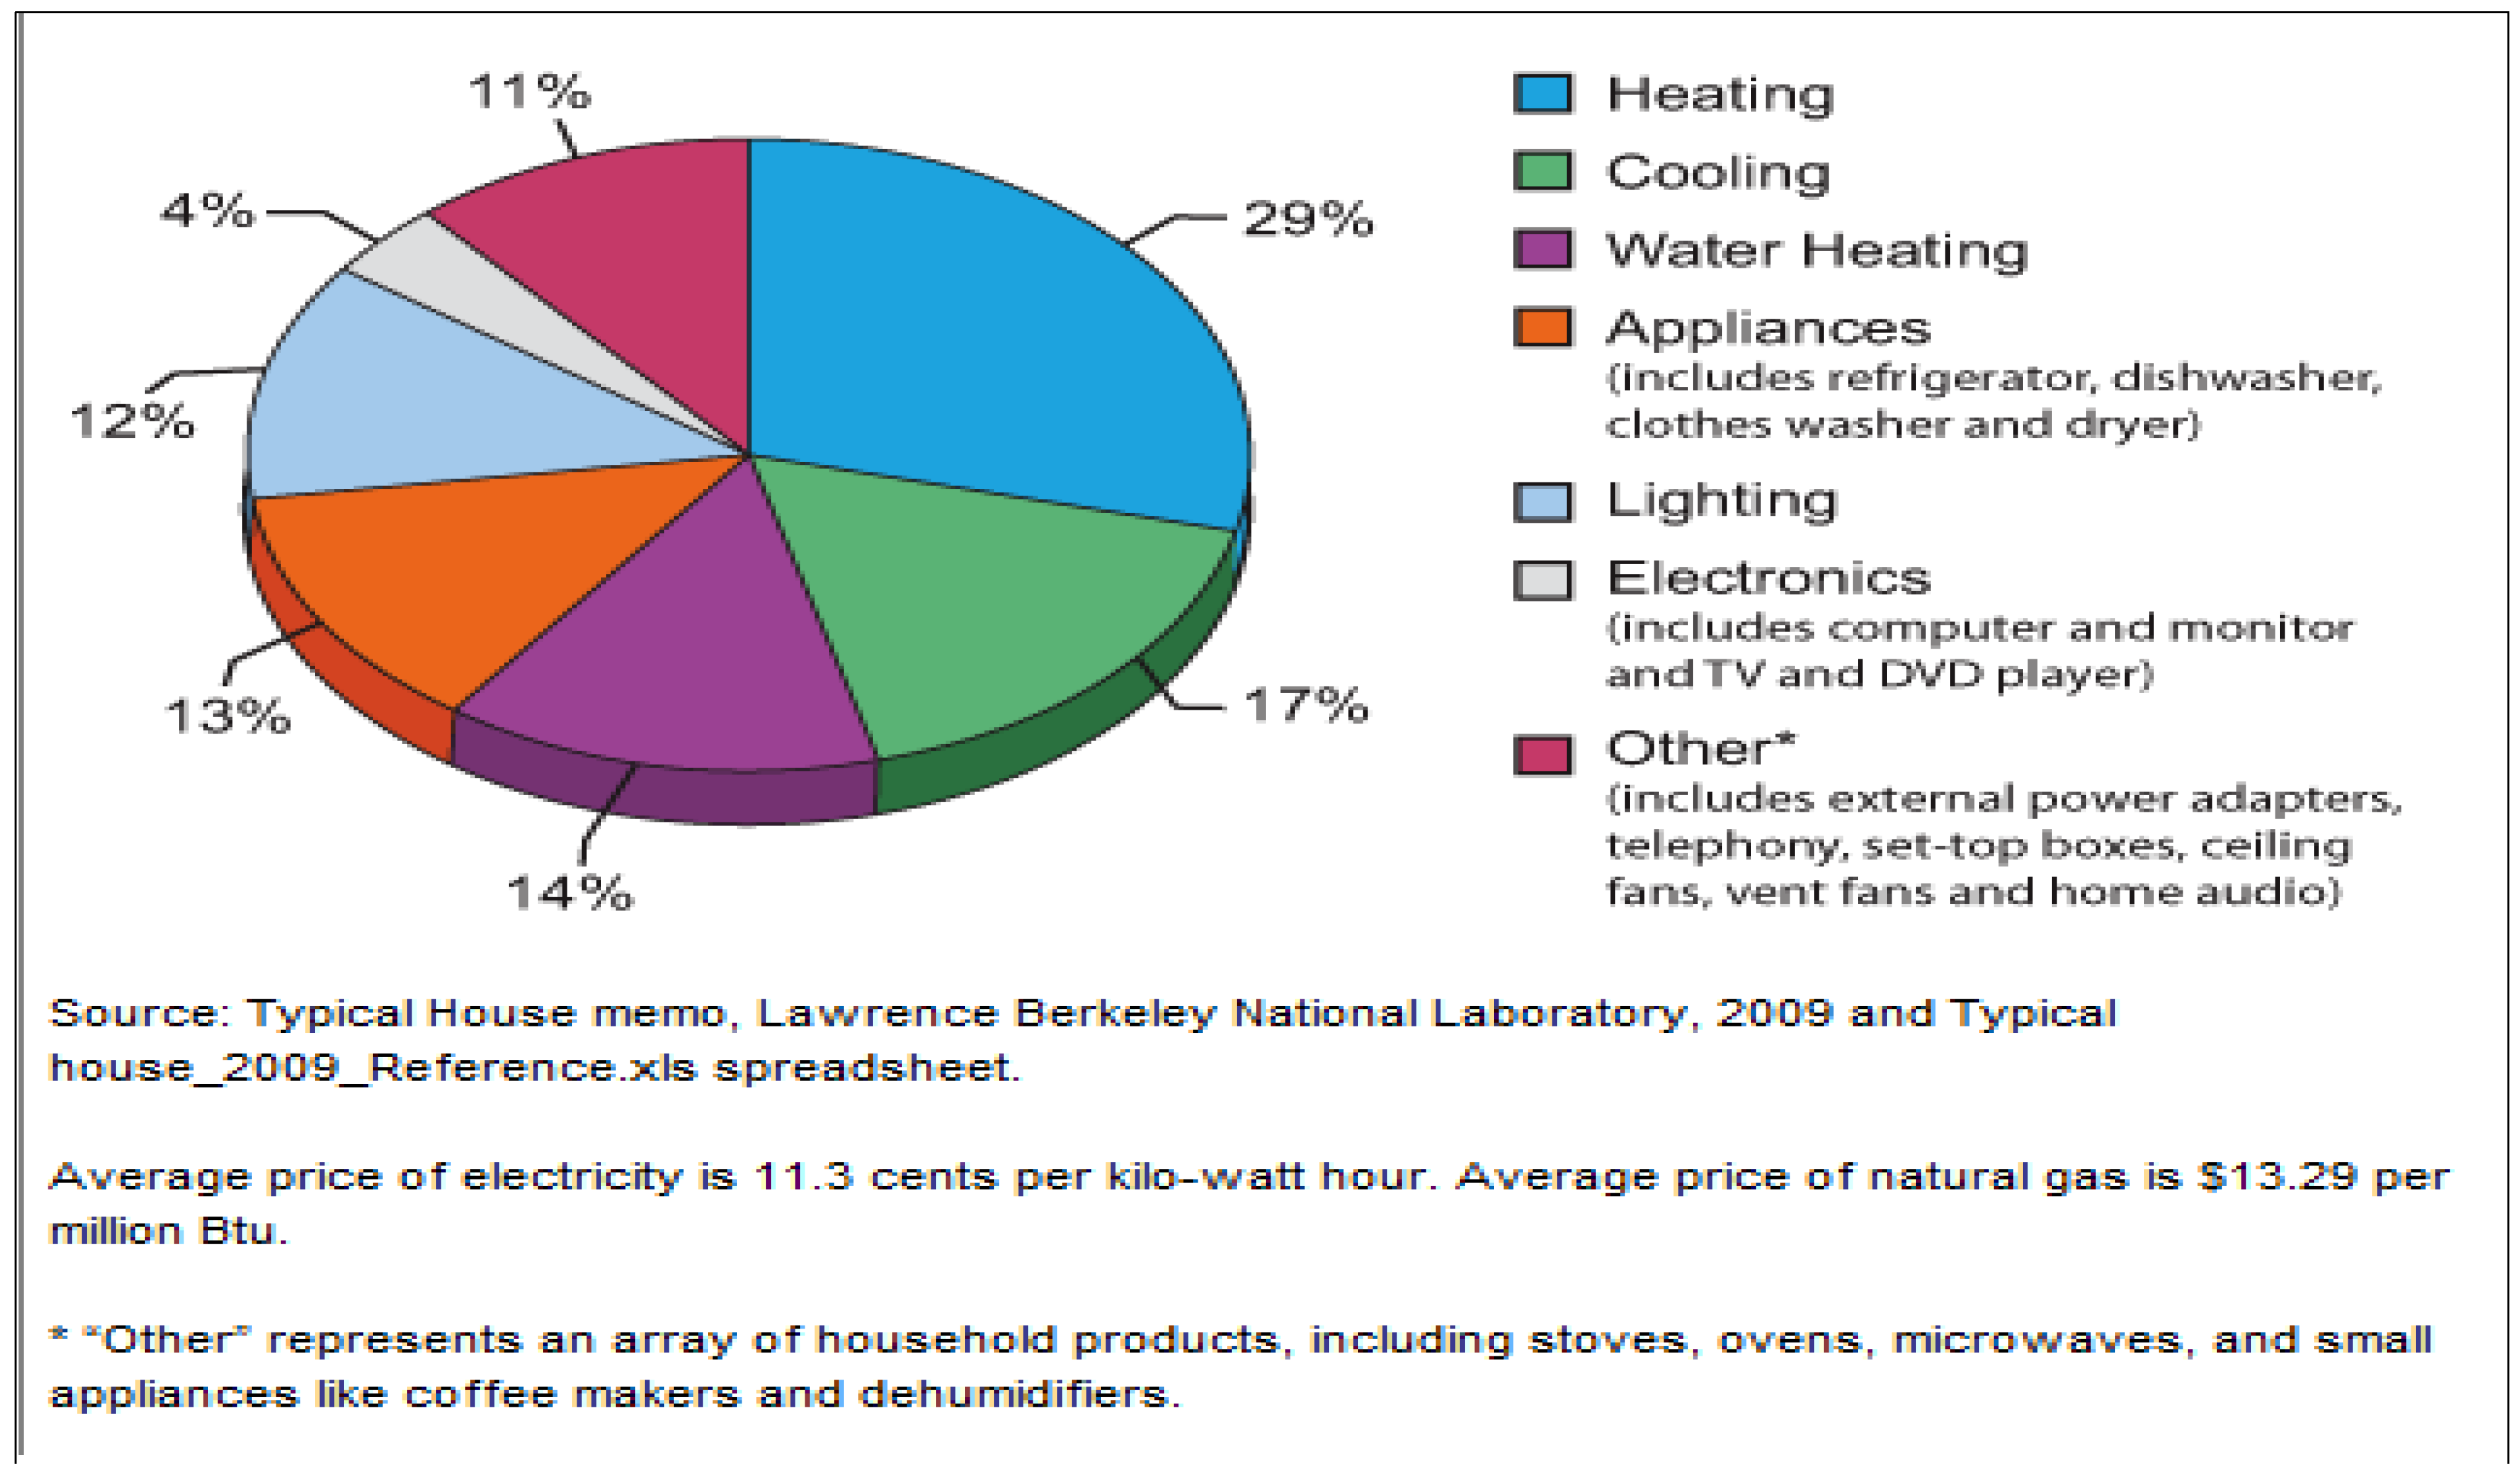
Figure 1 shows that space conditioning (heating primarily in winter and air conditioning primarily in summer) accounts for nearly half of the amount ($2,200) the average American family spends on household energy use every year. With it being such a large component of overall energy use, space conditioning deserves considerable attention from both monetary and energy/environmental perspectives.
Figure 1.
“Where Does My Money Go?” Annual Energy Bill for a typical Family Home is approximately USD 2,200.
Figure 1.
“Where Does My Money Go?” Annual Energy Bill for a typical Family Home is approximately USD 2,200.
If we place household energy use in a longer, historical perspective (Figure 2), we see that space conditioning roughly 30 years ago constituted an even larger component of energy use in the home, with space heating alone accounting for two thirds of overall energy use.
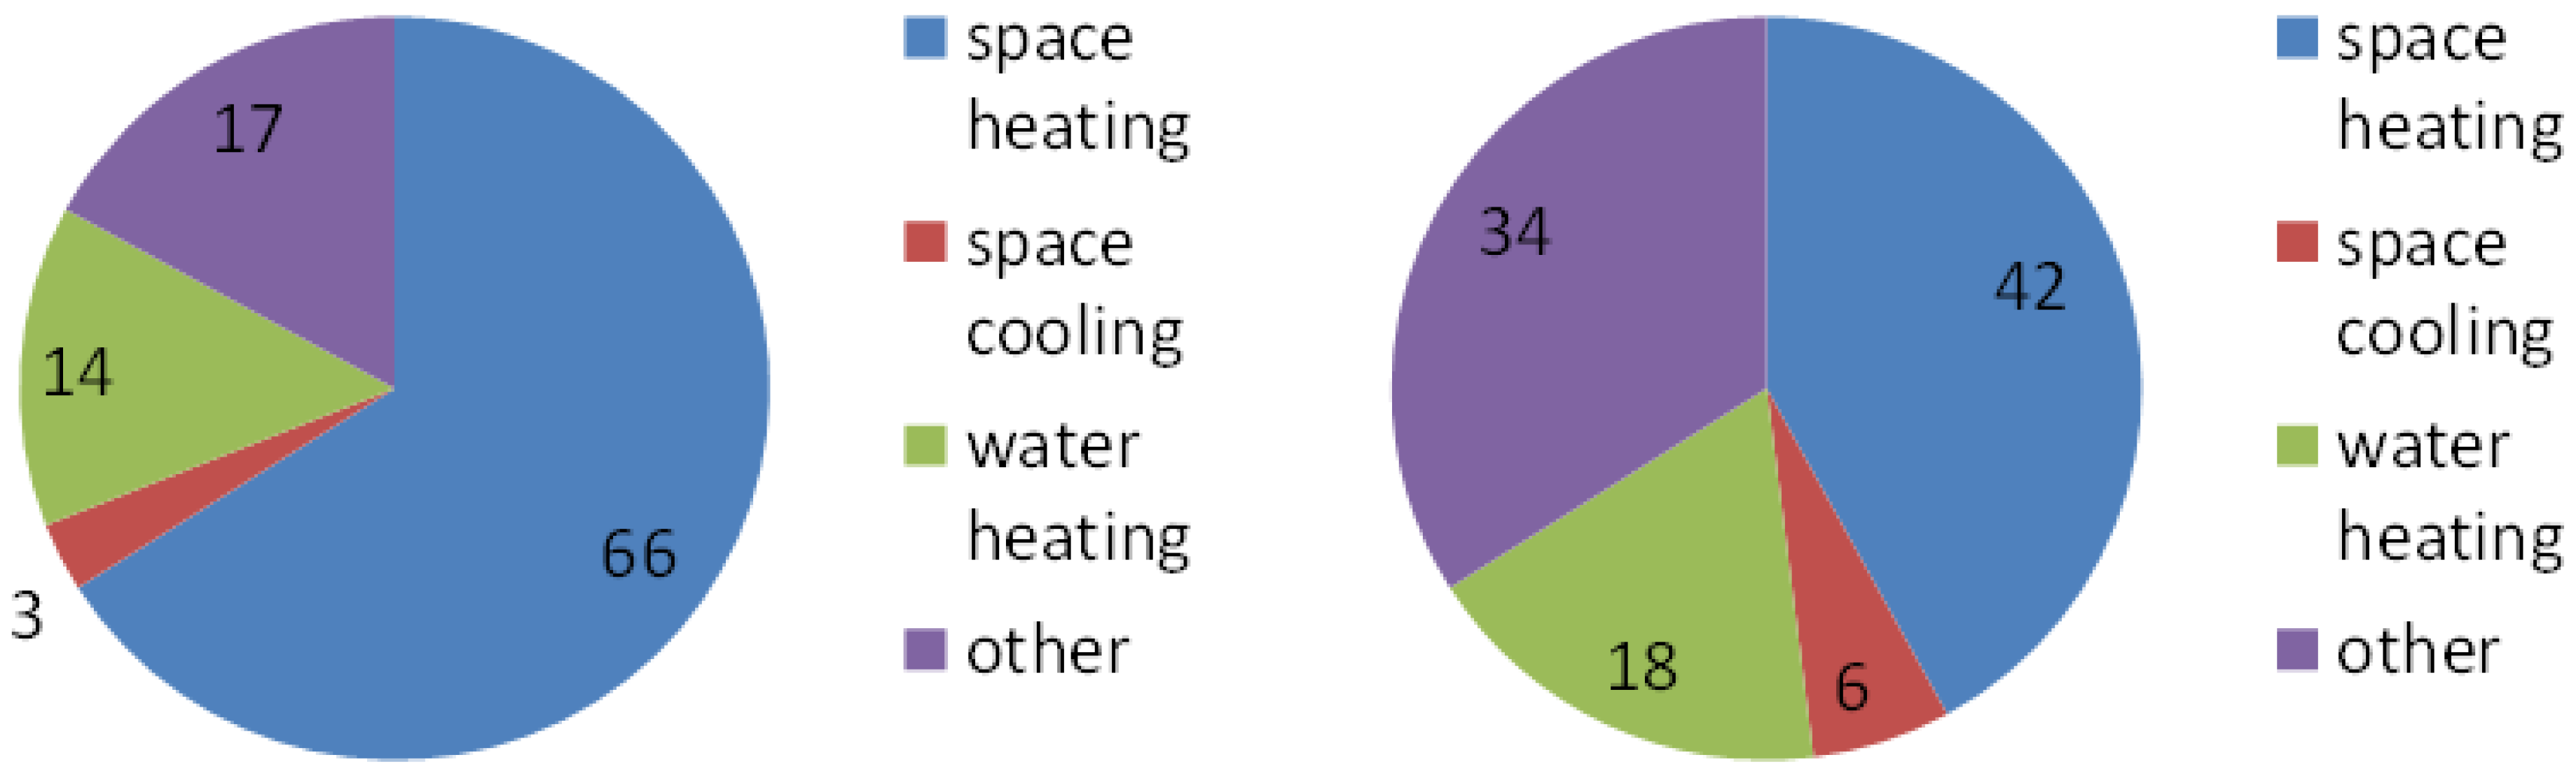
That percentage has diminished significantly for many reasons, not least being the growth of appliances and electronics in our homes, and the growth of air-conditioning. Space heating, however, still constitutes the dominant energy-producing activity in our homes, and when combined with space cooling or air-conditioning, means that nearly half of our household energy use is controlled by individuals through their thermostats.
What is noteworthy in Figure 2 is not simply how the composition of energy use has changed but the fact that the size of the energy “pie” has remained remarkably similar over this time period (from 10.58 Quads of BTUs in 1978 to 10.18 Quads in 2009) [4]. Several factors would lead one to expect the pie to have grown. First, as the U.S. population has grown, so has the number of housing units built to accommodate this growth. We had about a 40 percent increase in housing units from 1978 (79.1 million) to 2009 (113.6 million). Furthermore, the size of the new units being built were significantly larger than those existing in the 1970s—described as “modest dwellings” by Newman and Day [5]. The average new home being built in the 1970s had around 1,600 sq. feet of space, and by 2009 the average home was built to 2,400 sq. feet. Larger homes, naturally, require more space conditioning [6].
Moreover, relatively few of our homes in 1978 had air conditioning. One energy study in the 1970s [7] said that “air conditioning is a minor energy user in our homes.” The same cannot be said for 2009 when nearly 100 million housing units contained some form of air-conditioning, with the majority possessing central or whole-house air conditioning [8].
Larger homes also present the condition necessary for making our homes a major repository for electronics and appliances (many of which did not exist in 1975). Appliances such as clothes washers, dishwashers, and refrigerators have proliferated in our homes. Personal computers, dvd players, and cell phones that didn’t exist in 1978 have become commonplace. And while most households had one television in 1978, the number of mostly large-screen televisions in 2009 homes totaled more than two—2.5 when averaged across all households [9].
Despite all of these changes leading to higher energy growth, total household energy use, as we have seen, has remained roughly the same over the past 30 years. Many of the reasons for this are well-known and understood. Prior to the late 1980s there were no energy codes for home building setting forth energy efficiency criteria for the construction of new homes. With the passage of the 1992 Energy Policy Act, however, states and localities were mandated to review and consider the adoption of energy standards, and now a large majority of states have adopted some form of code, covering the building “envelope,” heating, ventilation and cooling equipment, lighting systems, and water heating—all intended to provide homeowners with assurance of adequate energy efficiencies in their residences. While compliance with such codes is not universal [10], builders generally follow codes that are updated every three years, and now a larger percentage of homes are even being built “beyond code” since it has been shown that buyers will pay a premium for new homes certified as being “green” or especially energy efficient [11]. Many of the existing older homes have been upgraded as well, availing themselves of home retrofits that typically include adding insulation, sealing air ducts, and constructing barriers to outdoor air infiltration. The federal home weatherization assistance program has saved energy and dollars for over 7 million low-income homeowners since its inception in 1976 [12].
Modern furnaces, heat pumps, and air conditioners all provide heating and cooling more efficiently now than they did 30 years ago. Whereas the common efficiency marker in air conditioning—the seasonal energy efficiency ratio (SEER)—was typically a 6 in the 1970s, by 2006 new air conditioners had to have a SEER of 13 [13]. Similarly, the marker for home heating efficiency in furnaces—the annual fuel utilization efficiency (AFUE)—now is in the 80 to 90 range, whereas 30 years ago it was typically in the high 60s [14]. Consequently, all heating, ventilation, and air conditioning equipment today can provide home comfort with a much smaller energy footprint.
It also needs to be noted that while there has been a proliferation of household appliances and electronics in our homes, most of these technologies have demonstrated increasing efficiency over time. The poster child for appliance efficiency is the refrigerator which uses only approximately 25 per cent of the energy it did 30 years ago. The widespread adoption of minimum appliance energy standards and the advent of the Energy Star program have contributed substantially to reducing household energy requirements [15].
Not all the factors leading to decreasing energy intensity are directly the result of technology, however. Winters have been becoming warmer across the United States [16]. Moreover, the share of the population residing in cooler states has also been declining steadily from a high in 1960 of nearly 60% of the population to 48.3% in 2010 [17]. Warmer winter and summer temperatures, and the movement of the population to warmer climates have implications for energy use, resulting in fewer energy requirements in winter and more cooling requirements in summer. Since space heating accounts for more direct energy consumption than space cooling, however, the net effect of these climatic and demographic shifts results in less energy use.
2.2. Impact of Behavioral Change
The factors cited above are generally well-known and clear-cut. What is seldom raised in the discussion, however, is the behavioral component; i.e., the extent to which homeowner action has either contributed to the growth of household energy use over time or offset it. Have there been, for example, any changes in homeowner behavior over time (aside from the purchase of technologies), that would lead to more or less energy use?
We know that homeowner behavior can have a significant impact on energy use [1]. And we also know that this behavior is variable across the population. It is widely reported that homes in similar climates and having similar technical characteristics can have energy use levels varying by a factor of 3 or 4 [18,19,20]. Many practices contribute to this variation (e.g., showering frequency, lighting habits, etc.) but space conditioning variation is probably the main contributor. Some utilities claim that a one degree shift in the thermostat setting will result in a 2–5 degree F change in space conditioning energy requirements, though the actual change will vary considerably depending on specific climate zone locations). Since, as we will see, there is a fairly large difference in thermostat settings within homes across the country, it stands to reason that these differences account for a large part of the variation. Given that considerable attention in the energy community has been devoted to energy use trends, it is somewhat puzzling, therefore, to understand why more attention has not been shown to how the practice of indoor thermal comfort has evolved over time in the United States. British social scientist Elizabeth Shove [21] claims that winter temperatures in British homes have risen steadily over the past 30 years from 17 °C (63 °F) to 21°C (70 °F), and that increasingly the British spend their days in an environment that varies little from 22 °C. Can we make similar pronouncements about indoor temperatures in the United States?
In fact, we have the data on which to make such comparisons, thanks to the Residential Energy Consumption Survey (RECS) that has been carried out since 1978 by the Energy Information Administration (EIA) within the U.S. Department of Energy. A nationwide representative sample of households has been conducted thirteen times since 1978 under RECS auspices, the latest in 2010 that gathered 2009 data. RECS is a two phase survey, first relying on advance letters to a representative sample of households and then following up with an in-home interview. In 2010, 12,083 households were visited by RECS interviewers and responses recorded. The survey asks questions on household characteristics and energy uses within these houses. Also collected are demographic and income-related data. While national representation is assured, the survey also covers major geographic and climatic regions.
RECS first began asking questions about household temperature settings in 1981. Hence we have response data going back nearly thirty years. Housing occupants have been asked their winter (heating) temperature settings for when the housing unit is occupied during the day, unoccupied during the day, and during the nighttime. Similar questions covering temperature settings during the cooling season only began with the 2005 RECS survey. Strictly speaking, therefore, we do not have data on actual temperature settings, but rather just the responses of homeowners to the RECS questions. Studies in the past have shown that self-reported temperature settings and observed temperature settings do differ slightly [22]; but, as one study claimed, “several studies have documented that self-reported thermostat-setting behavior can be a reasonably good proxy for actual thermostat use.” [23].
2.3. Heating Season Responses
Though RECS respondents have been queried about their winter-time temperature settings since 1981, RECS has altered the response categories slightly over time. In 1981, there was a single category for responses of settings over 70 degrees—namely, “71 or more degrees.” By 2009, we had two categories for responses over 70 degrees, namely “71 to 73” and “74 degrees or more.” For compatibility and simplification purposes, we have chosen to display the results below in just three categories: (1) temperatures below 70; (2) 70 degrees; (3) temperatures above 70. RECS surveys can be consulted for those seeking more disaggregated results.
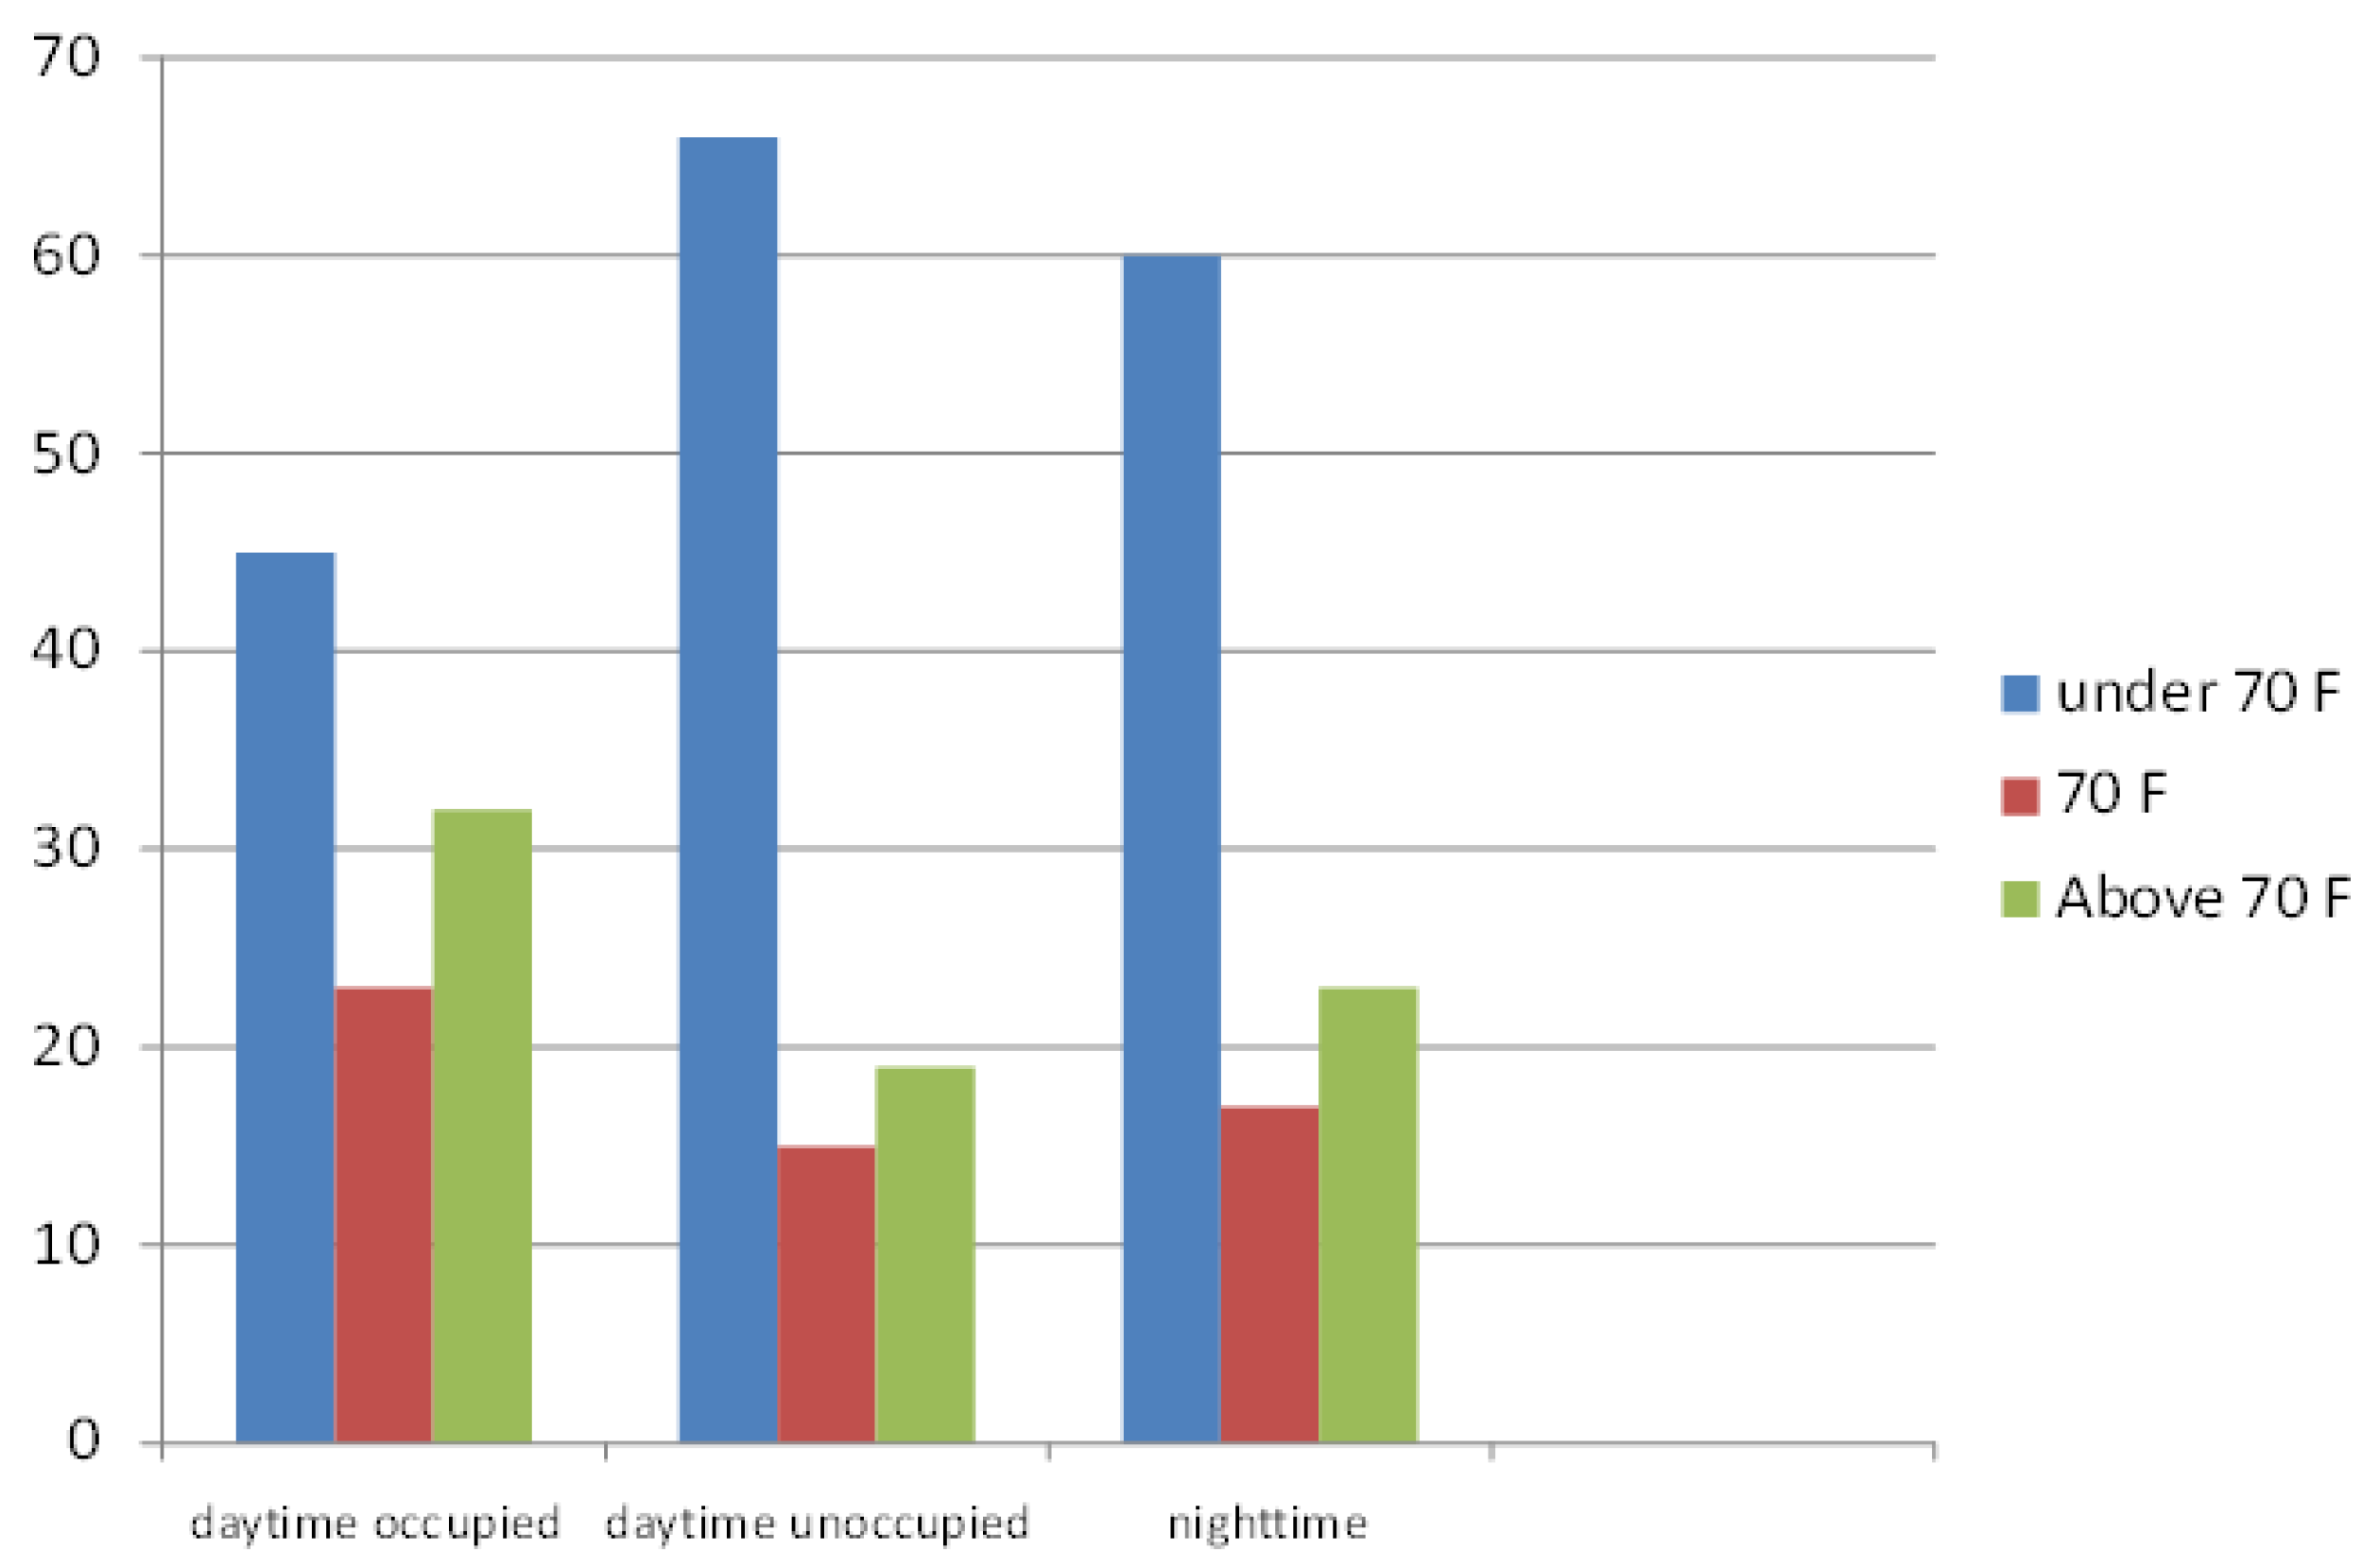
Though we are primarily interested in temperature settings over time, perhaps it is first useful to highlight the latest survey results covering 2009 data. In Figure 3 we note the settings for the three cases previously mentioned: daytime temperatures when occupied; daytime temperatures when unoccupied, and; nighttime temperatures.
Figure 3.
Home Heating, 2009 (Percentage of Households).

What we see is that a large number of Americans report maintaining temperature settings at below 70 degrees. And, as one would expect, a larger proportion do so at nighttime and during the day when the home is unoccupied. Still a fairly large percentage of the population does not practice temperature setback, with nearly a quarter of the population maintaining temperatures above 70 degrees during the nighttime.
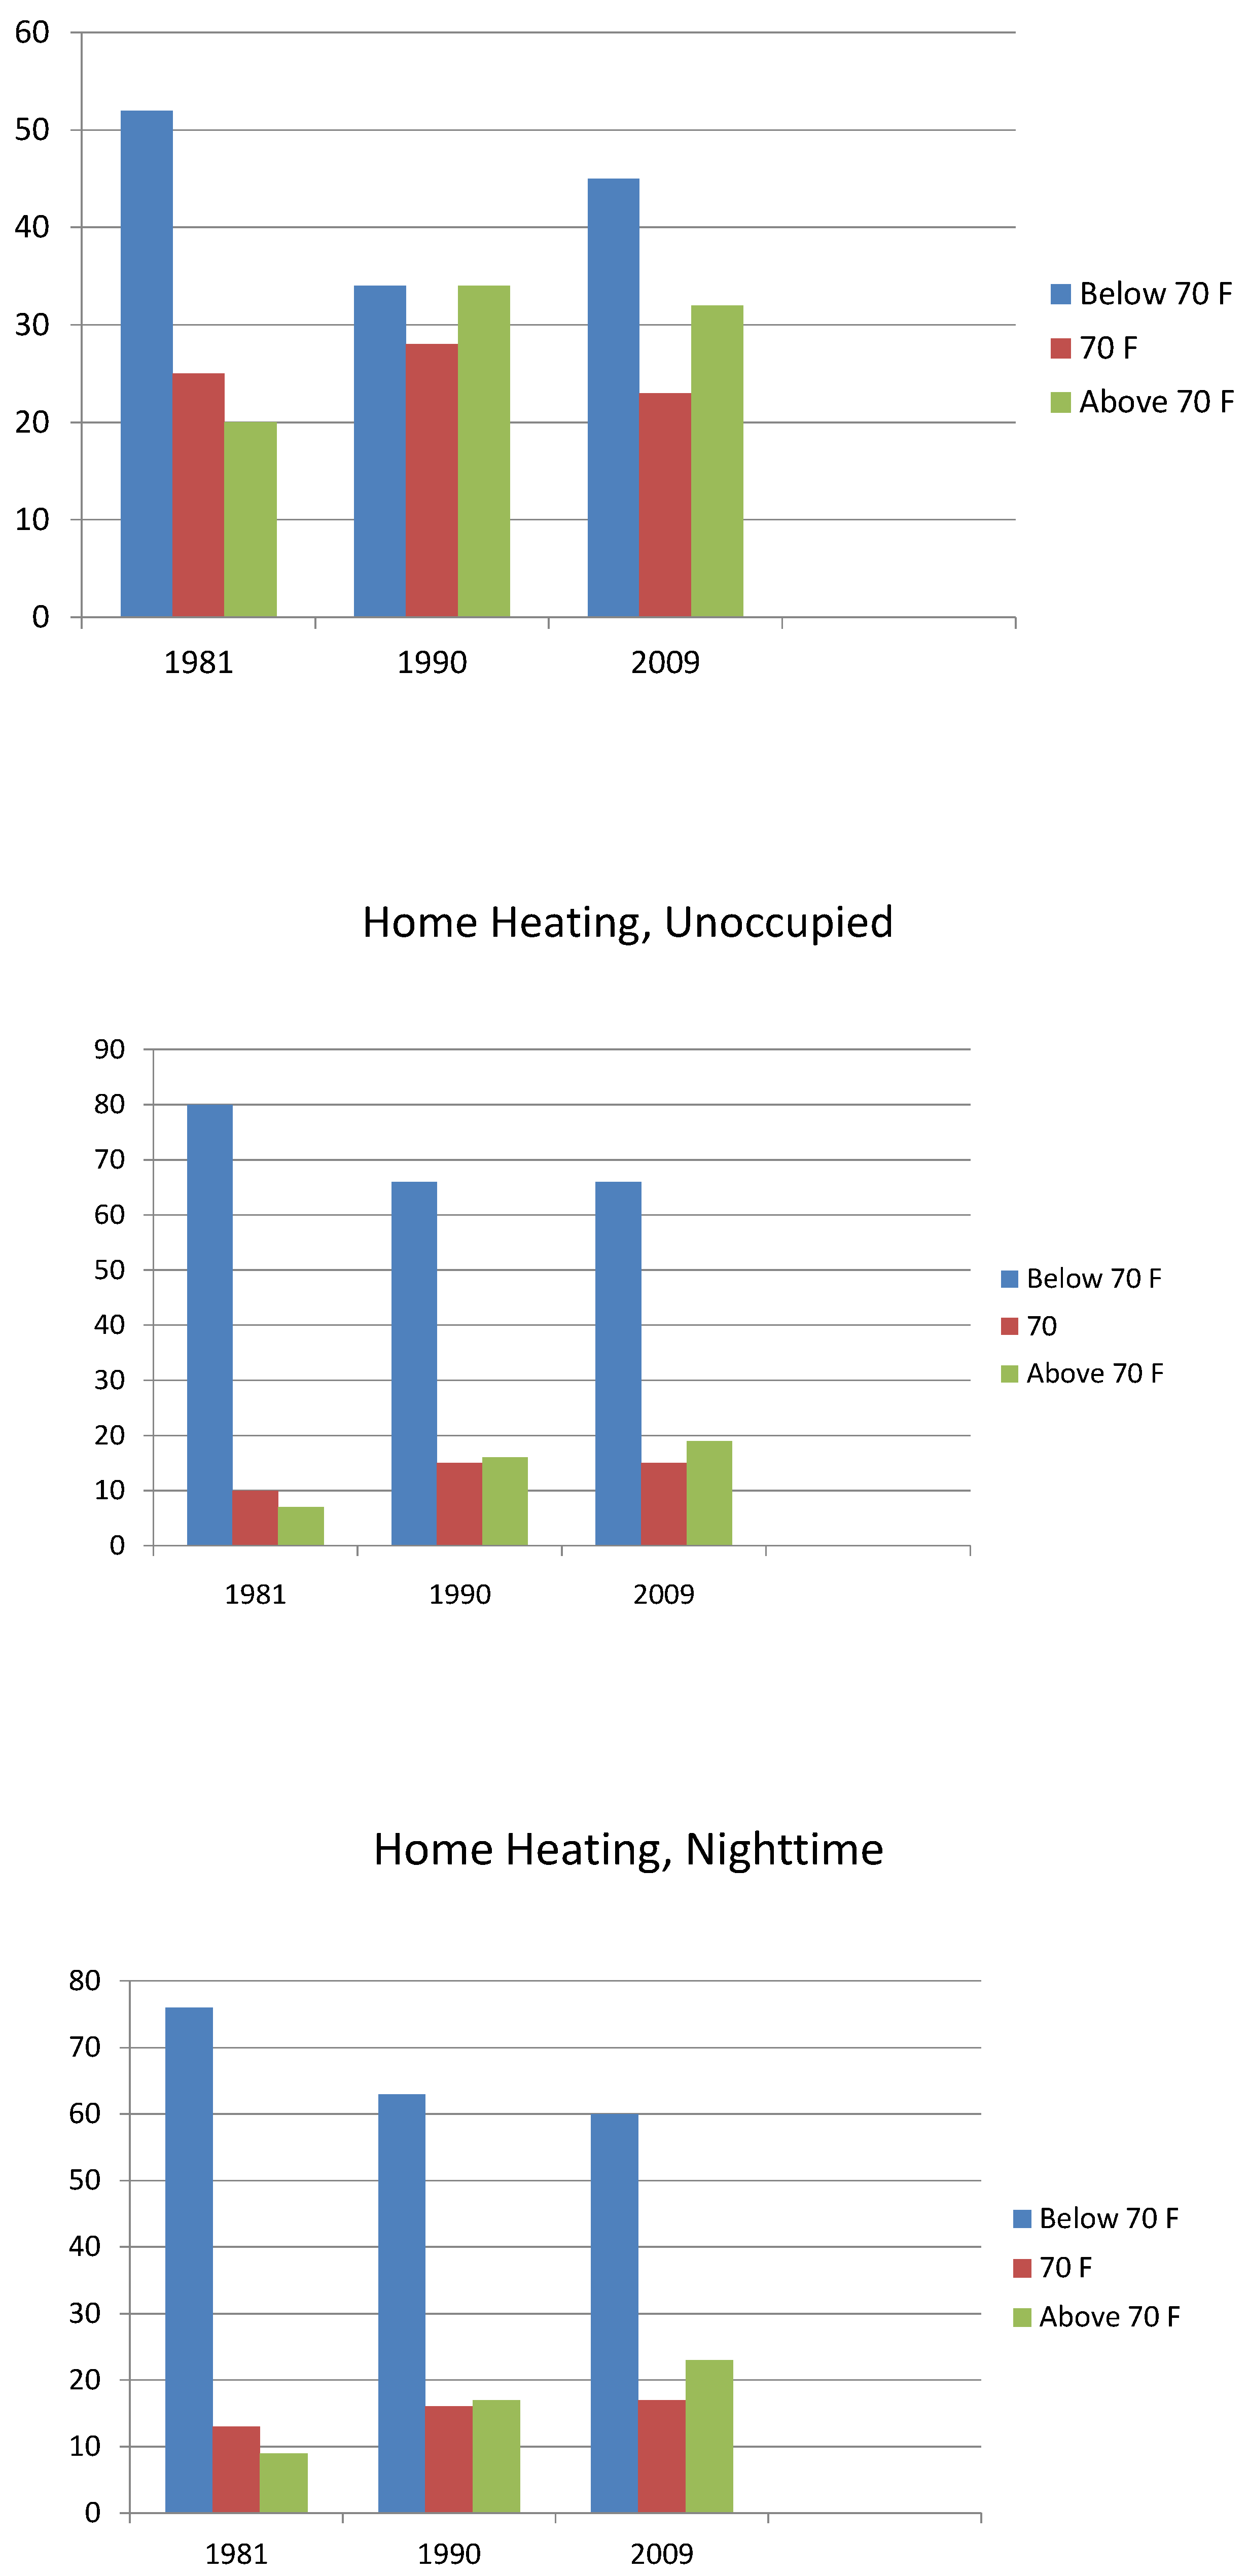
So, how do the numbers seen in Figure 3 compare with earlier numbers? To make these comparisons we chose three points in time: the earliest (1981), an intermediate (1990), and the current (2009). We will examine this time frame for each of the three surveyed conditions—occupied, unoccupied, and nighttime.
Probably what stands out in Figure 4 is the finding that in 1981 only 20 percent of those surveyed households kept their homes heated, when occupied, over 70 degrees. By 2009, that number had increased to 32 percent. Consequently, we have seen a gradual increase in household temperatures during the day when occupied. This same trend is found when we examine the other cases (daytime unoccupied and nighttime). As such, it can be said that Americans have been increasing indoor temperatures at all times of the day and night in order to achieve greater thermal comfort. The increases have been consistent but not huge. Nevertheless, it can be said with respect to home heating that behavioral changes impacting indoor temperature have contributed to greater energy use in the residential sector.
Figure 4.
Home Heating Temperatures, Occupied, Unoccupied, and Nighttime.
2.4. Cooling Season Responses
Unfortunately, we cannot provide the same historical review for cooling, because the RECS data on temperature setting in the cooling season only goes back to 2005. Certainly the growth of air conditioning in homes over the nearly 30 year time period of this study has been the more consequential aspect of cooling than temperature settings. Indeed, just 22 percent of households used any kind of air conditioners in 1981 [24]. By 2009, nearly 100 million homes—83 percent of all occupied homes—had some form of air conditioning installed, the large majority (nearly 70 percent) having central air conditioning. The predilection for centralized air conditioners that cool the entire home stands in contrast to the more prevalent room or window air conditioners existing in the homes of other countries [25]. Over 90 percent of the homes built since 2009 have come with central air conditioning [8].
The existence of central air conditioners does not necessarily translate into regular use during the summer months—11.5 million homes have this feature but do not turn it on consistently. The temperature settings provided by RECS, therefore, are for those 50.1 million households that have central air conditioning and use it on a regular basis. Figure 5 provides a breakout of the temperature settings as reported for 2009.
Figure 5.
2009 Temperature Settings, Cooling Season (Percentage of Households that have and use regularly).
Figure 5.
2009 Temperature Settings, Cooling Season (Percentage of Households that have and use regularly).
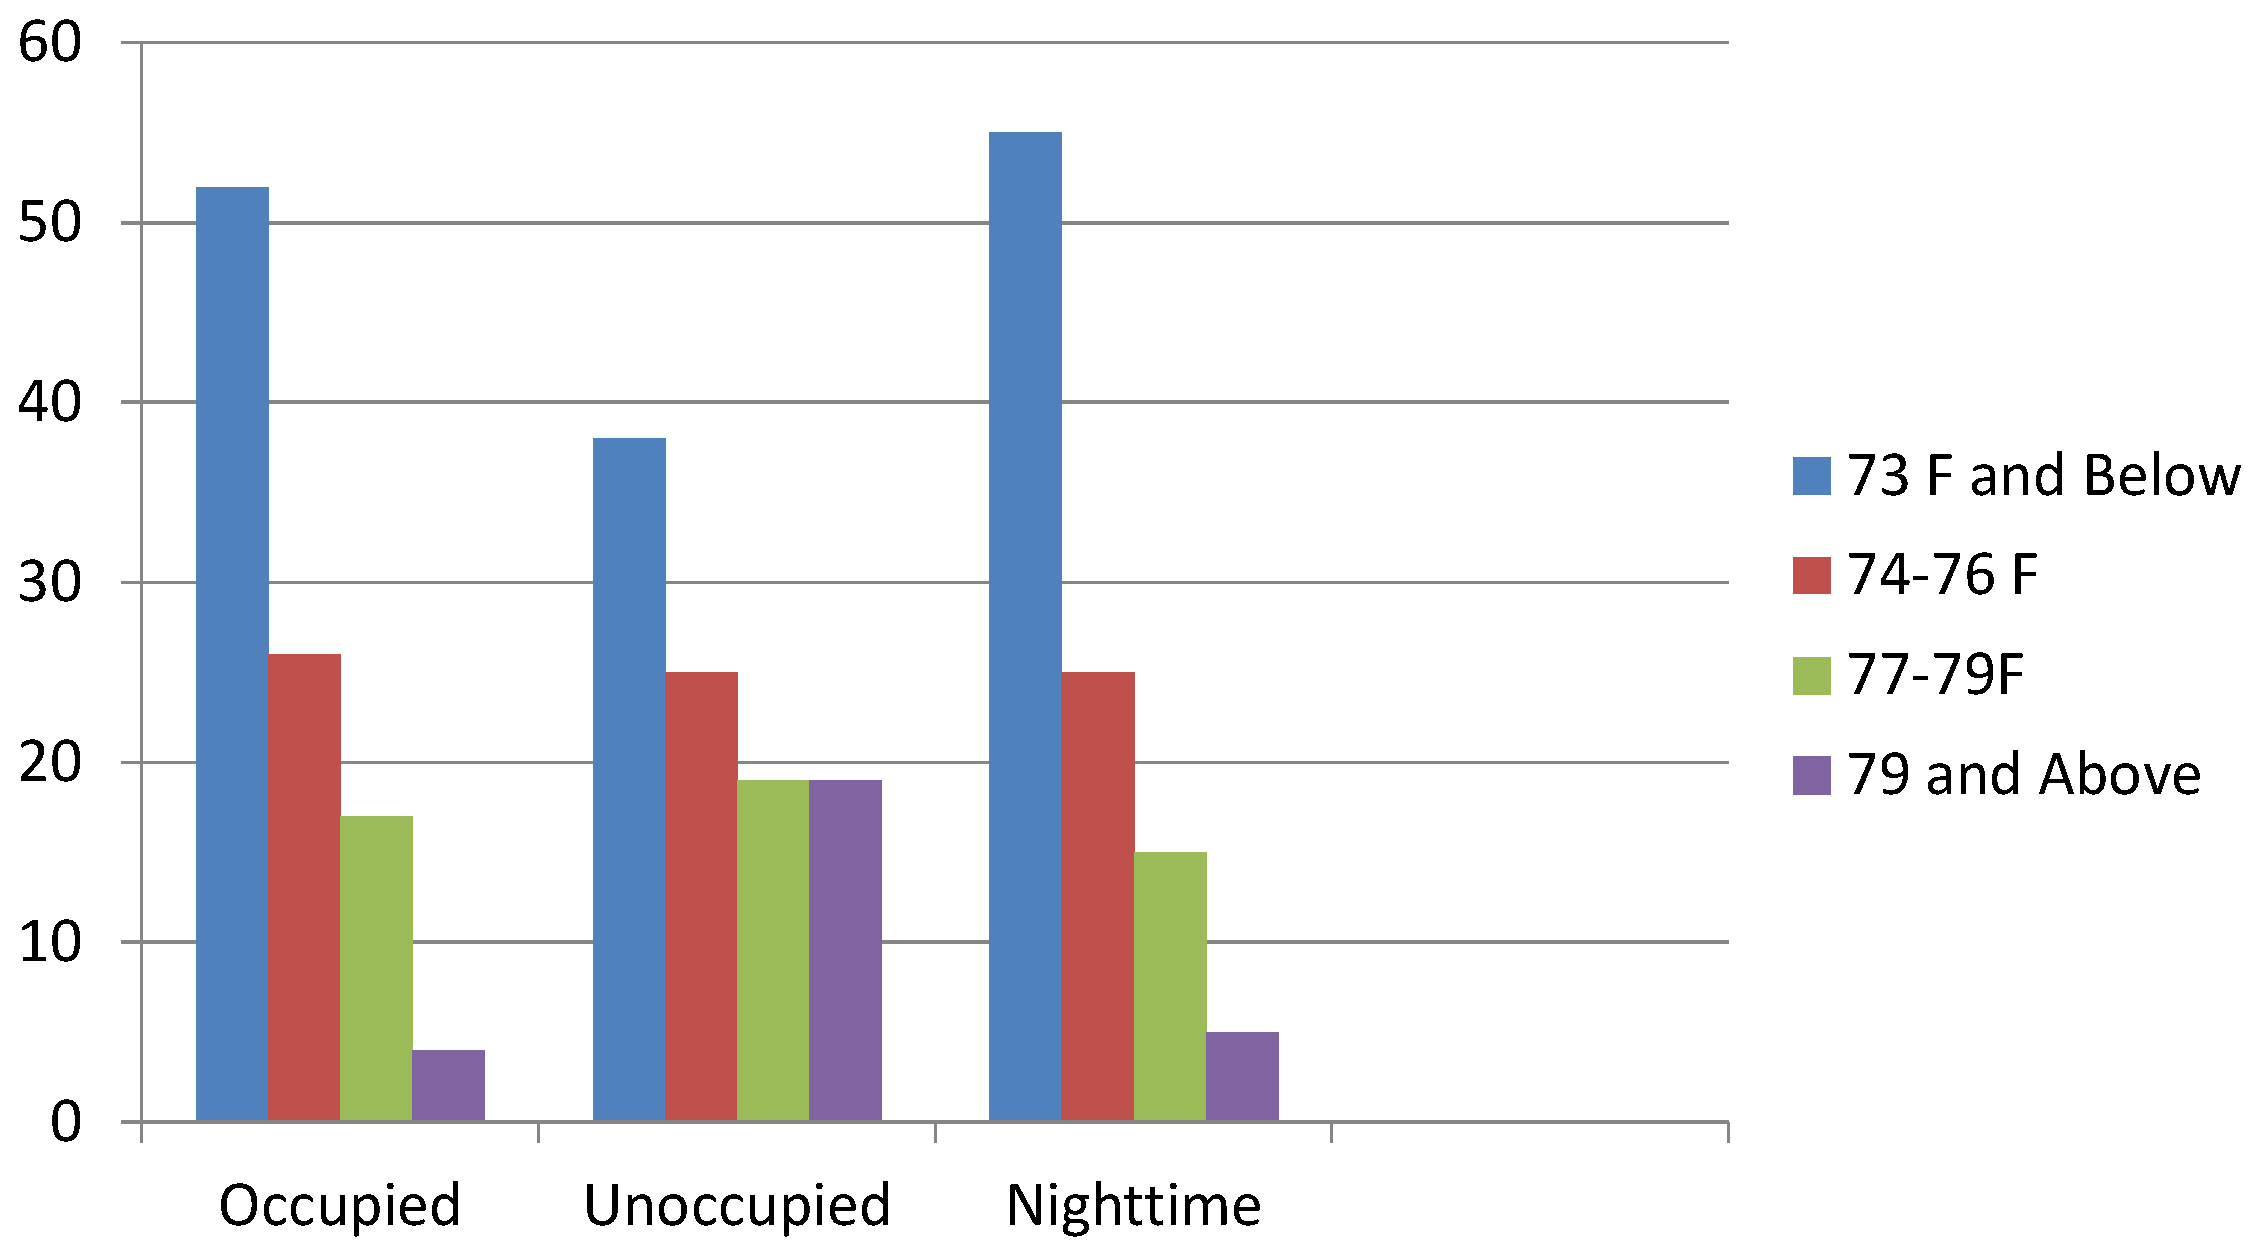
Two features from Figure 5 are particularly noteworthy. First, the fact that homeowners keep their homes at relatively cool temperatures. As can be seen, the largest segment of the population maintains temperatures at 73 degrees or cooler in the summertime. In fact, when we add the second largest segment (at the 74°–76° ranges), we can see a large plurality of households keep their homes at 76 degrees or cooler. Second, it is remarkable that these findings hold across all three time/occupation segments. It looks like very little setback is occurring when the household is unoccupied and at nighttime when most people are sleeping. Temperatures are maintained even cooler at nighttime than during the day.
Why Americans prefer such cool temperatures is a bit puzzling. Though there is no such thing as a universal ideal temperature, laboratory experiments point to a preference for 78 degrees all other things being equal [26]. The American attraction to air conditioning, both at work and at home, of course, has been noted by many, and seems to be confirmed by the data. Explanations for this range all over the map, including cultural, structural, political, and sociological reasons [27].
2.5. Looking Further at Disaggregated Data
We have seen that Americans have been marginally increasing their indoor winter temperatures over time and that air conditioning has become nearly universal in homes and is being used rather intensively. RECS data allow us to investigate further and understand who the most intensive users of space conditioning are, in terms of geographical regions, home ownership and income levels.
The 2009 RECS data show that 16.3 percent of the housing units are maintained at indoor winter temperatures of 74° or warmer, during daytime hours when occupied. Table 1 illustrates the percentage of homes maintaining these temperatures broken out by income levels.

| Income Levels | Percentage of Homes at 74° or More |
|---|---|
| Less than $20,000 | 21.9 |
| $20,000–39,999 | 20 |
| $40,000–59,999 | 15.9 |
| $60,000–79,999 | 14.1 |
| $80,000–99,999 | 10.7 |
| $100,000–119,999 | 8.8 |
| $120,000 and above | 7.5 |
Table 1 shows a clear relationship between income and heating levels: namely, lower income homes are associated with higher indoor winter temperature settings. This association holds across the other two categories of interest, unoccupied daytime temperatures and nighttime temperatures. Why this is the case is not entirely clear. We know that the wealthy have more discretionary income to spend on energy and (according to RECS data) that household energy expenditures only constitute, on average, 4 percent of the their overall expenditures . In contrast, household energy expenditures for the poor average around 19 percent of their total expenditures. All things being equal, therefore, simple economics would lead one to expect the opposite association of our findings. Perhaps the explanation resides in the fact that the houses of the poor are, on average, more poorly weatherized than those of the rich [28]. Higher temperature settings, therefore, may be needed to maintain a comfortable indoor temperature in a “leaky” home.
Another interesting dimension is the owner-renter dichotomy. Roughly two-thirds of the 113.6 million housing units are owner-occupied, and the other third are rented. The data show that 13.7 percent of the owner-occupied homes have their winter indoor temperature settings (when occupied) at 74° or more. On the other hand, 21.6 of the renters maintain this higher setting. This relationship holds when viewing data for daytime, unoccupied times and night times. Here the relationship is as expected as renters frequently pay a fixed amount of rent regardless of the energy consumed. There is no immediate economic disincentive, therefore, to keeping the thermostat set high in the winter.
Next we turn to the four census regions covered by RECS, the Northeast, the Midwest, the South, and the West. Table 2 presents the percentage of households in each region that maintain 74° or above settings during winter days when the unit is occupied.
| Census Region | Percentage of Homes at 74° or More |
|---|---|
| Northeast | 8.2 |
| Midwest | 12.7 |
| South | 24.5 |
| West | 12.9 |
Clearly, one region—the South—stands out from all the others with respect to higher temperatures, with nearly double the percentage of homes having higher temperature settings than the next closest region (the relationship is maintained over nighttime and daytime, unoccupied, periods). Perhaps the South is distinctive because the total costs for home heating are less in this warmer part of the country than in the others.
When we turn to space cooling, relationships become a bit more complicated. Recall that 52.5 percent of homes with operating, central air conditioners keep their thermostat at 73° or below during the summer when the home is occupied. When we introduce income levels (as seen in Table 3) the differences are not large, but they are discernible.
| Income Level | Percentage of Homes at 73° or Below |
|---|---|
| Less than $20,000 | 55.5 |
| $20,000–39,999 | 52.9 |
| $40,000–59,999 | 51.4 |
| $60,000–79,999 | 51.5 |
| $80,000–99,999 | 50.9 |
| $100,000–119,999 | 50.0 |
| $120,000 and above | 54.2 |
It is households at both the low and high end income levels that are more likely to maintain low temperature settings. Middle income levels are slightly less likely to do so. Temperature settings when homes are unoccupied or at nighttime show the same pattern: i.e., most intensive use at both the low and high end income levels. Unlike the results from heating season data, therefore, it appears that high income households are willing to spend the money necessary to maintain relatively cool temperatures in the summertime.
Moving on to the owner-renter dichotomy, we find the same relationship with cooling that we did with heating; namely, renters are more likely to set their thermostats at the extreme than are occupant-owners. Slightly less than 60 percent of rented households are maintaining summertime temperatures at 73° or below (when occupied), while slightly more than 50 percent of owner-occupied homes are maintaining such temperatures.
Census region comparisons for cooling show different patterns from warming, as seen in Table 4.
| Census Region | Percentage of Homes at 73° or Below |
|---|---|
| Northeast | 67.4 |
| Midwest | 62.9 |
| South | 49 |
| West | 42.2 |
Recall, it was the South that demonstrated the most extreme temperature settings in the wintertime. In summer, however, it is the Northeast and the Midwest homes that are maintained at the most extreme settings. Economics again may have something to do with this as the cooling season in the South is certainly longer than it is in the Northeast or Midwest.
In summary, we find residents in low-income housing units disproportionately set their thermostats at temperature extremes in both the summer and winter, while high-income residents only do so in the summer. Renters are, not surprisingly, setting their thermostats at more extreme temperatures than homeowners in both winter and summer. And, finally, houses in the South are maintained at warmer temperatures in the winter while the Northeast and the Midwest maintain the coolest homes in the summer.
We next turn to policy options based upon our findings thus far. Clearly, there are significant energy savings to be had in moderating the temperatures at which residents set their thermostats, particularly related to cooling. What policies might be effective for convincing the majority of home occupants who keep thermostats at 73° or below in the summer that such temperatures are not necessary to maintain indoor comfort? And, how can we engage a larger percentage of the population in making thermostat setbacks at nighttime and when there is no one in the home?
2.6. The Behavioral Response
Through the analysis of RECS data over time we have identified two distinct and separate issues relating to thermostat settings. First, many American homes maintain what appears to be exceedingly cool indoor temperatures, particularly during the summer. Second, many households maintain these temperatures at night or when no one is at home (in other words, thermostat setbacks are not being employed on a consistent basis). This is, in part, a cognition problem. Many individuals are not aware that the use of setbacks will save them energy and money, even though this message has been widely disseminated by utilities, environmental groups, and others. Some individuals are aware of these savings, but will make the conscious decision not to be bothered with having to devote attention to the matter. In other words, it becomes a lifestyle choice not to spend limited psychic resources on home energy management. We know that individual comfort levels can vary substantially amongst household occupants [29], and the decision to maintain a consistent temperature at all times may be a workable compromise to dealing with potential in-home conflict over indoor temperatures. For these reasons a major educational campaign to address these issues may be laudatory but, by itself, is unlikely to be sufficient to alter thermostat setting practices in a major way.
More optimistically, it has been shown that humans can find comfort within a range of temperatures and that our current practices are a socio-cultural construct [29,30], and not some immutable state of nature. This implies that alternative constructs are possible if we find the right formula and mechanisms for convincing the American public. A considerable number of studies have suggested temperature setbacks as part of a suite of plausible behavioral responses to combating climate change [31,32,33,34]. In order to provide further insight into the behavioral options necessary to reduce carbon dioxide (CO2) levels, analysts have found categories in which to place these options. For example, Ehrhardt-Martinez divides the options into 3 categories: Those that are (1) low cost and require infrequent attention; (2) low cost but need repeating frequently, and (3) infrequent, high-cost purchases.
Thermostat setting constitutes somewhat of a conundrum within these categorizations. For most people, altering their thermostats over the course of a day requires frequent, repeated, action (category #2, above). In other words, it must become an engrained habit. It is, of course, not difficult to change the setting on a household, manual, thermostat, but it does require a mindfulness that many do not wish to summon. On the other hand, the habit is not just low-cost, but actually saves the homeowner money without an initial outlay of funds. For those willing to bring mindfulness to the practice of thermostat setting, it is one of the easiest and most significant behavioral responses to climate change amongst all the household options.
Recognizing the significant barrier that a lack of mindfulness presents, entrepreneurs have sought to highlight the benefits of programmable, as opposed to manual, thermostats. A programmable thermostat is one where the householder can pre-set daily preferences on the device and thereafter have it alter room temperatures automatically. Homeowners can override these settings should they wish to do so, but otherwise temperature changes occur automatically without further intervention. As such temperature setting moves, in theory, from the behavioral category of low-cost, repeated frequently to one of low-cost, repeated infrequently—a category likely to find more favor with the public. The operational challenges associated with this transition, however, are considerable and will be discussed in more detail shortly. Moreover, the increasing costs of programmable thermostats threaten to bump this option into the category of high-cost, repeated infrequently. Though payback to the owner from such an investment may result over a relatively short period, high, front-end costs tend to discourage large-scale adaptation.
Temperature setting, consequently, demonstrates a fluidity that makes characterization within typical behavioral categories a problem to assign. It is very difficult, therefore, to say anything definitively about the public’s willingness to reduce temperature extremes, or to make a habit of practicing thermostat setbacks. We know that in perceived energy or electricity emergencies that the public is willing to dial back on normal household comfort levels [35,36]. We do not know, however, how to produce this behavior change over time when the emergency has passed.
Various attempts to estimate the willingness of Americans to make such changes have been made. Attari et.al [37] conducted a national survey to assess public perceptions on ease of implementation for 15 behavioral options—one of which was turning down the thermostat from 72° to 68° during the night; and another was turning up the air conditioning thermostat from 73° to 78° in the summer. Respondents were asked to assign a number to each of the 15 options on a scale from 1 (“extremely easy”) to 7 (“extremely hard”). The results showed that altering temperature settings were perceived as neither the easiest nor the hardest of changes to make, but fell right in the middle (with mean difficulty ratings of 2.63 and 2.71 respectively). Another study [38] estimated the “plasticity” (i.e., the proportion of current nonadopters that could be induced to take action) of 17 distinct household actions that collectively could constitute a “behavioral wedge.” “Thermostat setbacks” were one of the 17 actions evaluated. Plasticity estimates for all options were based on a review of household adoption levels in response to previous programmatic intervention efforts. Plasticity estimates for the options ranged from 15 to 90 percent, with thermostat setbacks assigned a rating of 35 percent. As such, it constituted one of the more difficult of the 17 options to implement.
In short, while it may be possible to convince a majority of Americans to make changes in indoor comfort levels and practice, it will not be achieved without considerable thought and effort. We turn next to some of the policies and practices that may be necessary to achieve the desired goal.
2.6.1. Moderate Temperature Settings
The results from RECS have shown that a significant percentage of households maintain rather cool indoor temperatures, particularly in the summer. The issue then is how to get these households to moderate their temperature settings, thereby tapping into the considerable energy savings and CO2 reductions from doing so.
As noted previously, education efforts—thus far carried out primarily by electric and gas utilities—can be part of the answer, but not the entire answer. Emphasizing cost savings to the household from temperature setbacks is important, but plays a limited motivational role in producing follow-up.
Testimonials by well-known individuals can also assist, but they too are limited, and can even backfire. The most famous example is President Jimmy Carter’s fireside address to the nation on 2 February 1977, when he implored the American public to set back their thermostats and don a sweater for the purpose of energy conservation in responding to the perceived energy crisis. Whether Carter’s call for energy conservation produced a backlash or simply fell on deaf ears is debatable, but common wisdom has it that a wide-scale pushback resulted. Unless there is an immediate and tangible crisis at hand, calls for sacrifice through conservation to serve the “public good” are likely to be resisted. Clearly indoor temperature setting is an issue where homeowner “sovereignty” or autonomy is well-established. No country today dictates an indoor air temperature to its citizens, even those run by the most authoritarian of rulers [39].
If, as it appears, moral and educational appeals have limited sway in changing behavior [40], what can we expect? Perhaps the answer resides in a more sophisticated approach to altering household behavior, one in which the homeowner “buys into” the change because of subtle social pressure and greater perceived self-welfare. Americans thus far have made limited use of social marketing techniques whereby social norms, not exhortations to individuals, are used to persuade energy users to pursue energy conservation. Based on behavioral principles espoused by prominent social scientists Cialdini, [41] and McKenzie-Mohr, [42] social marketers advocate working on a neighborhood or community level to publicize the laudatory behavior of some and tout it as the new norm. Each individual or household in the community, therefore, is sent notice of how his/her behavior measures up to this norm with the expectation being that individuals will seek to conform to the norm. The most successful embodiment of the social marketing approach to energy conservation to date is the commercial firm Opower that has contractual relations with numerous energy service providers across the United States. Opower’s approach has produced validated reductions in energy use [43,44].
A possible approach to changing thermostat setting norms would be through first changing norms in the commercial sector. We know that commercial establishments tend to maintain very cool summer temperatures which have negative impacts on workers [45], and it is likely that individuals entering this environment, for only short periods, mimic these conditions when they return home; believing that this is the established norm for temperature setting. Altering the norm in the commercial sector, therefore, could usher in similar norms in the residential sector.
The Japanese have been at the forefront of efforts to change norms in the commercial sector since 2005 with the “Cool Biz” initiative [46]. In order to address climate change concerns and possible electricity shortfalls, the government has sought to create a norm around maintaining indoor summer temperature settings in buildings at 82°F. To promote acceptability, the government has promoted a new (and presumably “cool”) office dress code, more appropriate to maintaining comfort in higher temperatures than the traditional dress code (involving jackets and ties). While a careful, quantitative, evaluation of the program’s success (or lack thereof) has not been conducted, one recent assessment [47] has said it has been “spectacularly effective,” with similar programs being tried out all across Asia [48,39]. While establishing a norm of 82° in American commercial establishments is currently beyond the pall, a number closer to 78° or 79° is not, particularly when combined with the widespread use of mechanical fans. But, again, the approach should not be based on calling for sacrifice in pursuit of the common good but rather on the benefits of using energy smarter and enhancing self-image by conforming to the new norm.
2.6.2. Implementing Temperature Setbacks
Perhaps more surprising than the temperature at which Americans set their thermostats is the fact that only a relatively small percentage adjust the thermostat setting at night and during the day when no one is at home. As such, a lot of energy appears to be simply wasted. As noted previously, a combination of mindlessness and cognitive misunderstanding appears to account for this waste. Education and admonitions are useful but don’t appear to be able to eliminate the symptoms.
Programmable thermostats address these concerns as, in theory, they eliminate the need for frequent homeowner attention once the device is programmed. RECS data show a gradual penetration of programmable thermostats into American households. In 2001 RECS reported that 25 percent of American households had at least one programmable thermostat. By 2009 the number had increased to 37 percent. A more recent study puts the number currently at 41 percent [49]. Caution should be used in citing the data, however, as it has been shown that many individuals are unable to distinguish between programmable and manual thermostats [50].
If programmable thermostats are becoming increasingly common in homes, then, the question is why is the American public still so resistant to setbacks? The answer appears to be because the programmable thermostats are not being used, or if used, are not being used fully or properly. A general number cited is that fully 90 percent of all installed programmable thermostats are not being used as envisioned by energy experts [51,52].
A significant part of the problem is that programmable thermostats have become more sophisticated over time, but this has come with greater complexity, making the device less and not more user-friendly. Meier [51] provides a litany of problems with the user interface including small buttons and confusing fonts, hard to understand symbols and abbreviations, complicated interfaces amongst the features, illogical layout, and confusing terminology. Many homeowners are presented with a device, therefore, that they are simply ill-prepared to operate as intended. This leads some to shun the device all together, fearing that tinkering with it might actually produce serious unintended consequences [23]. The lack of general usability was a major reason why the Energy Star program, operated by the Environmental Protection Agency and the Department of Energy, stopped certifying programmable thermostats in 2009: they simply could not confirm the projected energy savings promoted by thermostat makers.
But there is a more fundamental concern with programmable thermostats even if improvements in usability are forthcoming. Namely, it is worth considering whether a thermostat that is correctly programmed to alter temperatures on a consistent and stable basis, is appropriate for the rich variety of situations and circumstances governing individual preferences in creating indoor thermal comfort. Usability of the thermostat, therefore, must be evaluated in the behavioral context of its use.
A programmable thermostat makes the assumption that human behavior in households is predictable and stable. Unfortunately, this generally does not appear to be the case. While some householders are away from their homes during the day on a regular basis, many others are not. In other words, residents leave their homes on a sporadic and unpredictable basis, essentially negating the benefit of prior programming. There is an “override” feature on programmable thermostats, of course, but that again triggers the mindfulness issue associated with manual thermostats. To avoid these problems, a large percentage of the population simply places the device on “hold” and sets a uniform temperature for all times of the day [51].
Moreover, we have the problem alluded to earlier with differences in individual perceptions of appropriate indoor temperatures. We know there are gender differences as a rule [53], and there can be differences in the willingness of family members to use clothing as a means of finding indoor comfort. Family disputes over temperature settings, therefore, are common, leading to incessant tinkering with the thermostat, and described by one observer as “thermostat wars” [50].
In summary, proper utilization of programmable thermostats is hindered by the complexity of the devices, limited cognitive understanding by the public on how thermostats are designed to work [54], and a human environment of unpredictable schedules and varying individual comfort levels. Given these features, it is not surprising that energy saving through programmable thermostats has not been a prominent result to date.
2.6.3. Possible Steps Forward
A new generation of programmable residential thermostats appears to be evolving, including, among others, NEST, Honeywell Prestige, and Ecobee. All of these thermostats might be termed “smart” devices as they are more intuitive and user-friendly than previous models. The NEST even provides a nice aesthetic touch [55]. Still, given the huge gap in public knowledge about how thermostats operate, and in understanding how to install and use these devices, a certain amount of “hand-holding” will be required to produce desired energy savings. Moreover, this new generation of thermostats brings with them a new concern, namely high capital costs. The three thermostats just cited range in price from $250–$300, whereas simple manual thermostats typically cost in the low tens of dollars. Whatever acceptability gains in the usability of thermostats, therefore, could be offset by losses from relatively high costs. The major question, therefore, becomes who can provide the hand-holding and cost offsets to mainstream the new generation of thermostats?
One entity that could be called on to provide these services could be your electricity supplier. The initial template for user-supplier interaction might be similar to the program established by FirstEnergy Corp. in Ohio [56]. FirstEnergy provides free programmatic thermostats to a select number of customers if they agree to allow the company to cycle the home air conditioner compressor for 15-minute intervals on summer days when electricity demand is high. Such a capability helps meet the suppliers “peak electricity” problem and complies with Ohio-mandated energy efficiency standards. The good news is that curtailments of such short duration tend not to be noticed by homeowners. The bad news is that FirstEnergy’s motive is not to create a smarter energy user but to gain access to the householder’s air conditioner. What the homeowner does with the free thermostat, other than during the control period, is of little concern to the supplier.
The creation of the “smart grid,” however, which is now underway [57], may present opportunities to rethink the supplier-customer relationship in fundamental ways that can account for more homeowner education. Currently, the smart grid is largely perceived as a better communication tool between homeowner and supplier, but it can be much more than that. As this relationship develops, better utilization of the thermostat may become a win-win for all concerned.
3. Conclusions
It has been shown, using historical data compiled by the Energy Information Administration, that Americans have been marginally increasing temperatures in their homes during the heating season over the past 30 years. More striking is the growth in air conditioning for homes over this same period and the temperatures at which homes are maintained in the summer, regardless of whether it is nighttime or whether the home is occupied. As such, change in desired indoor comfort levels has been a force for increasing energy use in the home over time.
It was also shown that occupants in lower-income homes tend to set their thermostats higher in winter than other income groups, but that the most intense cooling tends to take place in both low-income and high-income homes. As expected, renters tend to heat and cool more intensively than homeowners. And in terms of regional differences, homes in the South are maintained at higher winter temperatures than in other regions, but homes in the Northeast and Midwest are cooled more intensively.
It was hypothesized that part of the reason why temperatures are set so low in summer may result from emulation of commercial sector practices designed to provide a welcome cool haven for short-term shoppers or to create a more productive workplace for employees. Consequently, the way to get Americans acclimated to a warmer home temperature in summer, thereby saving energy and reducing carbon emissions, may be to first change practices in the commercial sector. Japan’s experience with its “Cool Biz” program, therefore, deserves careful study.
The roll out of the “smart grid” across America presents the opportunity for a new and closer supplier-customer relationship [58], one that includes education, advice, and incentives for the better use of thermostats. This opportunity should not be wasted.
Conflict of Interest
The author declares no conflict of interest.
References
- Lutzenhiser, L.; Hus, H.; Moezzi, M; Levenda, A.; Woods, A. Lifestyles, Buildings and Technologies: What Matters Most? In Proceedings of the 2012 ACEEE Summer Study on Energy Efficiency in Buildings, Pacific Grove, CA, USA, 12–17 August 2012; ACEEE: Washington, DC, USA, 2012. [Google Scholar]
- McNary, B.; Berry, C. How Americans are Using Energy in Homes Today. In Proceedings of the 2012 ACEEE Summer Study on Energy Efficiency in Buildings, Pacific Grove, CA, USA, 12–17 August, 2012; ACEEE: Washington, DC, USA, 2012. [Google Scholar]
- Energy Information Administration, 2009 RECS Survey Data; U.S. Government, Washington, DC, USA, 2013. Available online: http://www.eia.gov/consumption/residential/data/2009/ (accessed on 28 March 2013).
- This is, of course, delivered energy to the home, not total primary energy consumed. Because of the significant generation and distribution losses involved in the electricity process, total primary energy expended in the residential sector was roughly 22 Quads in 2010 and 16 Quads in 1978.
- Newman, D.; Day, D. The American Energy Consumer; Ballinger: Cambridge, MA, USA, 1975. [Google Scholar]
- Wilson, A.; Boehland, J. Small is beautiful: U.S. home size, resource use, and the environment. J. Industr. Ecol. 2005, 9, 277–287. [Google Scholar]
- Landsberg, H.; Schanz, J.; Schurr, S.; Thompson, G. Energy and the Social Sciences: An Examination of Research Needs; Resources for the Future: Washington, DC, USA, 1974. [Google Scholar]
- Energy Information Administration, Did You Know That Air Conditioning is in Nearly 100 million U.S. Homes; U.S. Government: Washington, DC, USA, 2011.
- Energy Information Administration, Share of Energy Used by Appliances and Consumer Electronics Increases in Homes; U.S. Government: Washington, DC, USA, 2011.
- Harris, J.; Ungar, L.; Fay, B.; Khan, A.; Sachs, H.; Stone, G. Re-Inventing Building Energy Codes as Technology and Market Drivers. In Proceedings of the 2010 ACEEE Summer Study on Energy Efficiency in Buildings, Pacific Grove, CA, USA, 15–20 August 2010; ACEEE: Washington, DC, USA, 2010. [Google Scholar]
- Harney, K. Energy-efficient homes seem to sell faster, fetch higher prices. Los Angeles Times. 2011, A-25. [Google Scholar]
- Adams, R. Weatherization Assistance Program. In Proceedings of the 2012 National Energy and Utility Affordability Conference, New Orleans, LA, USA, 11–13 June 2012; National Low-Income Energy Consortium: Alexandria, VA, USA, 2012. [Google Scholar]
- Department of Energy, Central Air Conditioning; Department of Energy: Washington, DC, USA, 2012. Available online: http://energy.gov/energysaver/articles/central-air-conditioning/ (accessed on 24 January 2013).
- Department of Energy, Furnaces and Boilers; Department of Energy: Washington, DC, USA, 2012. Available online: http://energy.gov/energysaver/articles/furnaces-and-boilers/ (accessed on 24 January 2013).
- Lowenberger, A.; Mauer, J.; deLaski, A.; DiMascio, M.; Amann, J.; Nadel, S. The Efficiency Boom: Cashing in on the Savings from Appliance Standards; ACEEE: Washington, DC, USA, 2012. [Google Scholar]
- Environmental Protection Agency, Climate change indicators in the United States; U.S. Government Printing Office: Washington, DC, USA, 2012. Available online: http://www.epa.gov/climatechange/science/indicators/ (accessed 24 January 2013).
- Energy Information Administration, Population shifts across U.S. regions affect overall heating and cooling needs. Today in Energy; U.S.; Government: Washington, DC, USA, 2012.
- Lutzenhiser, L.; Bender, S. The “Average American” Unmasked: Social Structure and Differences in Household Energy Use and Carbon Emissions. In Proceedings of the 2008 ACEEE Summer Study on Energy Efficiency in Buildings, Pacific Grove, USA, CA, 17–22 August 2008; ACEEE: Washington, DC, USA, 2008. [Google Scholar]
- Sanquist, T.; Orr, H.; Shui, B.; Bittner, A. Lifestyle factors in U.S. residential electricity consumption. Energ. Policy 2012, 42, 354–364. [Google Scholar] [CrossRef]
- Gram-Hanssen, K. Households’ Energy Use—Which is the More Important: Efficient Technologies or User Practices. In Presentation at the World Renewable Energy Conference, Linkoeping, Sweden, 8–13 May 2011.
- Shove, E. Changing Human Behaviour and Lifestyle: A Challenge for Sustainable Consumption? In Consumption Perspectives from Ecological Economics, Proceedings of International Society for Ecological Economics; Ropke, F., Reisch, L., Eds.; Elgar: Cheltenham, UK, 2005; pp. 111–131. [Google Scholar]
- Walker, I.; Meier, A. Residential Thermostats: Comfort Controls in California Homes; Lawrence Berkeley National Laboratory: Berkeley, CA, USA, 2008. [Google Scholar]
- Nevius, M.; Pigg, S. Programmable Thermostats that go Beserk? Taking a Social Perspective on Space Heating in Wisconsin. In Proceedings of the 2000 ACEEE Summer Study on Energy Efficiency in Buildings, Pacific Grove, CA, USA, 12–17 August 2000; ACEEE: Washington, DC, USA, 2000. [Google Scholar]
- Energy Information Administration, Housing Characteristics 1990; U.S. Government: Washington, DC, USA, 1992.
- Fujii, H.; Lutzenhiser, L. Japanese residential air-conditioning: Natural cooling and intelligent systems. Energ. Buildings 1992, 18, 221–233. [Google Scholar] [CrossRef]
- De Dear, R. In defence of space cooling and the science of thermal comfort. Energ. Buildings 1992, 18, 260–261. [Google Scholar] [CrossRef]
- Prins, G. On condis and coolth. Energ. Buildings 1992, 18, 251–258. [Google Scholar]
- National Residential Energy Efficiency Program, Bringing Residential Energy Efficiency to Scale; Report for the National Association of State Energy Officials; Energy Programs Consortium: Washington, DC, USA, 2009.
- Darby, S.; White, R. Thermal Comfort. Background Document C for the 40% Household Report; Comfort and Temperature Workshop: Oxford, UK, 2005. [Google Scholar]
- Chappells, H.; Shove, E. Debating the future of comfort: environmental sustainability, energy consumption, and indoor environment. Build. Res. Inf. 2005, 33, 32–40. [Google Scholar] [CrossRef]
- Gardner, G.; Stern, P. The short list: the most effective actions U.S. households can take to curb climate change. Environment 2008, 50, 14–24. [Google Scholar]
- Vandenbergh, M.; Barkenbus, J.; Gilligan, J. Individual carbon emissions: The low-hanging fruit. UCLA Law Rev. 2008, 55, 1701–1758. [Google Scholar]
- Attari, S.; DeKay, M.; Davidson, C.; de Bruin, W. Public perceptions of energy consumption and savings. Proc. Natl. Acad. Sci. USA 2010, 107, 16054–16059. [Google Scholar] [CrossRef]
- Ehrhardt-Martinez, K. Changing Habits, Lifestyles, and Choices: The Behaviours That Drive Feedback-Induced Energy Savings. In Proceedings of the 2011 ECEEE Summer Study on Energy Efficiency in Buildings, Toulon, France, 6–11 June 2011; ECEEE: Stockholm, Sweden, 2011. [Google Scholar]
- Leighty, W.; Meier, A. Accelerated Electricity Conservation in Juneau, Alaska: A study of household activities that reduced demand 25%. Energ. Policy 2011, 39, 2299–2309. [Google Scholar] [CrossRef]
- Lutzenhiser, L. California Energy Crisis Conservation Response Study: Final Summary Report; California Energy Commission: Sacromento, CA, USA, 2004. [Google Scholar]
- Attari, S.; Dekay, M.; Davidson, C.; de Bruin, W. Changing household behaviours to curb climate change: How hard can it be? Sustainability: Journal Record 2011, 4, 9–11. [Google Scholar]
- Dietz, T.; Gardner, G.; Gilligan, J.; Stern, P.; Vandenbergh, M. Household actions can provide a behavioural wedge to rapidly reduce U.S. carbon emissions. Proc. Natl. Acad. Sci. USA 2009, 106, 18452–18456. [Google Scholar]
- Nicol, F.; Humphreys, M.; Roaf, S. Adaptive Thermal Comfort: Principles and Practices; Routledge: London, UK, 2012. [Google Scholar]
- Stern, P. Toward a coherent theory of environmentally significant behavior. J. Soc. Issues. 2000, 56, 407–424. [Google Scholar]
- Cialdini, R. Influence: The Psychology of Persuasion; Collins Business Essentials: New York, NY, USA, 2007. [Google Scholar]
- McKenzie-Mohr, D.; Lee, N.; Schultz, W.; Kotler, P. Social Marketing to Protect the Environment: What Works; Sage Publishing: Los Angeles, CA, USA, 2012. [Google Scholar]
- Allcott, H. Social Norms and Energy Conservation; MIT: Cambridge, MA, USA, 2009. [Google Scholar]
- Davis, M. Behaviour and Energy Savings: Evidence from a Series of Experimental Interventions; Environmental Defense Fund: Washington, DC, USA, 2011. [Google Scholar]
- Mendell, M. Indoor Thermal Factors and Symptoms in Office Workers: Finding from the U.S. EPA BASE Study; Lawrence Berkeley National Laboratory: Berkeley, CA, USA, 2009. [Google Scholar]
- Hosaka, T. Japan “Super Cool Biz” campaign urges businessmen to shed suits, save energy. Associated Press 2011. [Google Scholar]
- Shove, E.; Pantzar, M.; Watson, M. The Dynamics of Social Practice: Everyday Life and How it Changes; Sage Publications: Los Angeles, CA, USA, 2012. [Google Scholar]
- Lakeridou, M.; Ucci, M.; Marmot, A.; Ridley, I. The potential of increasing cooling set-points in air conditioned offices in the UK. Appl. Energ. 2012, 94, 338–348. [Google Scholar] [CrossRef]
- LeBlanc, B.; Cooper, R.; Reeves, A. Who Wants Efficiency. In Proceedings of the 2012 ACEEE Summer Study on Energy Efficiency in Buildings, Pacific Grove, CA, USA, 12–17 August 2012; ACEEE: Washington, DC, USA, 2012. [Google Scholar]
- Peffer, T. Thermostat Wars and Other Tales from the Field. In Presented at the Behaviour, Energy, and Climate Change Conference, Sacramento, CA, USA, November 2012.
- Meier, A.; Aragon, C.; Hurwitz, B.; Mujumdar, D.; Peffer, T.; Perry, D.; Pritoni, M. How People Actually use Thermostats. In Proceedings of the 2010 ACEEE Summer Study on Energy Efficiency in Buildings, Pacific Grove, CA, USA, 15–20 August 2010; ACEEE: Pacific Grove, CA, USA, 2010. [Google Scholar]
- Frader-Thompson, S. Energy Management Designed with Consumers in Mind. In Presented at the Behaviour, Energy, and Climate Change Conference, Washington, DC, USA, 30 November–3 December 2011.
- Karjalainen, S. Gender differences in thermal comfort and use of thermostats in everyday thermal environments. Build. Environ. 2007, 42, 1594–1603. [Google Scholar] [CrossRef]
- Urban, B.; Elliott, D.; Sachs, O. Towards Better Modeling of Residential Thermostats. In Presented at SimBuild2012, Madison, WI, USA, April 2012.
- Quain, J. Creator of the IPod: Saving energy is sexy. Available online: http://www.foxnews.com/scitech/2011/10/25 (accessed on 25 October, 2011).
- Lin-Fisher, B. FirstEnergy offers free programmable thermostats for enrollees in special program. Beacon Journal 2012. [Google Scholar]
- Honebein, P.; Cammarano, R.; Boice, C. Building a social roadmap for the smart grid. Electricity Journal 2011, 24, 78–84. [Google Scholar] [CrossRef]
- Honebein, P.; Cammarano, R.; Boice, C. From authority to trusted advisor: The utility’s changing role. Electricity Journal 2012, 25, 49–58. [Google Scholar] [CrossRef]
© 2013 by the authors; licensee MDPI, Basel, Switzerland. This article is an open access article distributed under the terms and conditions of the Creative Commons Attribution license (http://creativecommons.org/licenses/by/3.0/).
Share and Cite
MDPI and ACS Style
Barkenbus, J. Indoor Thermal Comfort: The Behavioral Component. Sustainability 2013, 5, 1680-1699. https://doi.org/10.3390/su5041680
AMA Style
Barkenbus J. Indoor Thermal Comfort: The Behavioral Component. Sustainability. 2013; 5(4):1680-1699. https://doi.org/10.3390/su5041680
Chicago/Turabian StyleBarkenbus, Jack. 2013. "Indoor Thermal Comfort: The Behavioral Component" Sustainability 5, no. 4: 1680-1699. https://doi.org/10.3390/su5041680