Article

Mapping the Relationship of Inter-Village Variation in Agroforestry Tree Survival with Social and Ecological Characteristics: The Case of the Vi Agroforestry Project, Mara Region, Tanzania

1
Forest-Landscape-Society research group, School for Forest Management, Faculty of Forest Science, Swedish University of Agricultural Sciences, SE-73921 Skinnskatteberg, Sweden
2
Social Capital Innovations International, Box 569, SE-10110 Stockholm, Sweden
*
Author to whom correspondence should be addressed.
Sustainability 2013, 5(12), 5171-5194; https://doi.org/10.3390/su5125171
Submission received: 16 July 2013 / Revised: 23 October 2013 / Accepted: 25 November 2013 / Published: 4 December 2013
(This article belongs to the Special Issue Sustainable Agroforestry)

Abstract

:
Agroforestry practices can improve the adaptive capacity and resilience of local farming and subsistence systems while providing livelihood benefits to households. However, scaling up of agroforestry technology has often proved difficult. Many studies have been carried out to explain the lack of tangible impact, based mainly on formal household/farm surveys comparing characteristics of non-adopters with that of adopters. In this study, we mapped the relationship between agroforestry tree survival in villages that were a part of the Vi Agroforestry project in the Mara region, Tanzania with key social-ecological variables. A random sample of 21 households from each of 89 investigated project villages was used. The proportion of households with surviving agroforestry trees, varied from 10%–90% among villages. Social and ecological differences between villages were important explanations to this variation. Variables related to the project and its operations explained most of the inter-village variation in households with few surviving trees. To encourage the majority of village households to practice agroforestry their perceptions of tree ownership and the benefit of agroforestry were additional key factors to the project showing the importance of socio-cultural issues to the households’ decisions to continue beyond the initial tree planting and testing phase.

1. Introduction

Scaling up the establishment of trees on degraded land, forest and arable land has received renewed attention with the increasing concern for climate change [1,2,3]. Agroforestry is increasingly being identified as one viable option to increased carbon sequestration and production of bio-energy that also contributes to local livelihoods, improved food security and agro-ecological resilience [4,5,6,7,8,9,10,11]. Nair et al. [4] argues that trading of sequestered carbon is an additional opportunity for economic income that can benefit resource poor small scale farmers in developing countries. Considerable research and development efforts in the past have encouraged agroforestry practices and have demonstrated the relationship between agroforestry and improved livelihood of small scale farmers [12,13,14,15,16]. However, to scale up agroforestry has often proved difficult and thus the benefits have not yet been fully realised.
The Vi Agroforestry (Vi-AF) has worked with agroforestry development among resource poor farmers since the mid 1980s [17,18,19]. One of its projects, the Vi Agroforestry Project located in the Mara region (Vi-AFP), Tanzania was the subject of this study. The project started in 1995 with the mission to disseminate agroforestry practices for improved livelihoods among small scale farmers around Lake Victoria. During 1996 and 1997, the project expanded to the three rural districts in the Mara region bordering the lake. As the project progressed, it became obvious that project success was not only determined by the duration and number of project activities in a specific village. This study originated from this growing awareness. The initial aim of the research was to improve the effectiveness of the project operations. Recent contributions in the field of interactive research including learning through continuous evaluations to steer projects towards agreed goals and for successful interventions have added to the insights from this study [20,21].
The majority of agroforestry-adoption studies have been based on formal household/farm surveys and comparisons of the characteristics of non-adopters with those of adopters [22,23,24,25]. Mercer [24] identified village-level and spatial analysis of agroforestry adoption as an important area for future research. Mainly based on adoption studies of improved tree fallow, Kiptot et al. [22] argued for the need to consider households within different stages of adoption, e.g., testers/experimenters, re-adopters, pseudo-adopters and adopters. An important reason behind this argument is that the motives to continue with agroforestry differ among farmers depending on the stage he or she is in [22,26]. A recent study by Behre [27] highlighted the mismatch between objective and subjective quality of life conditions as important factors for adoption. In addition, the importance of the traditional village system [28,29,30] and differences in social capital [31,32] are important factors to consider and learn more about for interventions to be successful.
In this study, the perspective has been elevated from the household and farm-level to the village level. The aim was to map and illustrate the pattern of inter-village variation in agroforestry tree survival with key differences in social and ecological characteristics among project villages. Our working hypothesis was that village-level differences are important explanations to the rate of agroforestry adoption.

2. Methods

2.1. The Vi Agroforestry Program

The Vi-AF is a Swedish Non-Governmental Organisation (NGO) based in Stockholm, Sweden. Today, the Vi-AF program reaches over one million people with training and advice administered through seven projects in the Lake Victoria basin. The activities of the program are financed via fundraising from the public and grants from the Swedish International Development Cooperation Agency (Sida) [19]. Vi-AF started in 1983 as a tree planting project in Kenya [33] that was followed by projects in Uganda (1992), Tanzania (1995 and 1999) and Rwanda (2004).
In 2001, the Vi-AF had established monitoring units in each project with the main aim to carry out periodic monitoring and evaluations. This study was conducted in the anticipation of a planned project evaluation that has not yet been carried out.

2.2. Mara Region

The part of the Lake Victoria basin in Tanzania covers an area of 84,920 km2, which equals 46% of the total lake catchment area, and includes the Mwanza, Mara, Kagera and Shinyanga regions. The Mara Region is situated along the east side of Lake Victoria. At the time of the field work of this study, the Mara region had five districts: Tarime, Bunda, Musoma Rural, Musoma Urban and Serengeti. On average, 667 people used one km2 of cultivated land for their livelihood (estimate for year 2000; data for this study was collected in 2001).
The lake zone is a strip of land about 10–15 km wide along the lake including parts of Tarime, Bunda, Musoma Rural and Urban Districts at 1100–1200 m.a.s.l. Most of the lake zone inhabitants are subsistence farmers, cultivating crops, keeping livestock, and/or fishing. Land pressure and deforestation are increasing rapidly. Agricultural production in the lake zone is low and unpredictable due to erratic rainfall, inherently poor soils and soil erosion. People are also faced with increasing poverty coupled with malnutrition and high incidences of disease. The annual precipitation is normally less than 900 mm divided in two main seasons, about mid-September to early December and March to June. The onset and duration of the rainy season is highly variable causing difficulties in predicting the timing of farm operations. This situation for agricultural practices is further aggravated by a commonly occurring mid-season (early December to March) dry spell. Soils in the lake zone are mainly sandy, easily exhausted and susceptible to erosion. There are also some areas with heavy clay soils that become seasonally waterlogged. Eleven ethnic groups are represented in the lake zone with the Jita, Luo and Kuria being the largest. Jita and Luo are semi-agropastoralist and Kuria are agro-pastoralists [34,35,36].

2.3. The Vi Agroforestry Project in Mara Region

The Vi Agroforestry project in Mara region, Tanzania (Vi-AFP) is organized as a local NGO registered with the Ministry of Home Affairs in Tanzania. The project appraisal was carried out early in 1994. Field activities were initiated with the employment of the first project extension agents (PEA) in the beginning of 1995. The target group of the Vi-AFP was the subsistence oriented farmers with unsecure food supply, estimated to be 80% of the total population in the lake zone. The development objective was to make a substantial contribution towards an improved livelihood situation for this group, including increased food and nutritional security, fuel wood availability, and improved sources of income. The implementation approach used by the project was labelled as; age and gender sensitive participatory agroforestry extension. The number of PEAs increased from 16 in 1995 to 113 in 2000. At the end of 2000, the project had 155 permanent employees.
Each PEA was responsible for a village or part of a village as their specific area of concentration (AoC). In the project area there were 104 villages, with about 34,500 households, divided into seven subprojects (Zones) with about 15–16 AoC/PEAs in each. Each zone was led by a zonal manager responsible for general operations. All in all, the project introduced 54 agroforestry tree species, including long-term trees, soil-improvers and fruit trees with multiple benefits to the households and the environment in the lake zone. Soil improvement measures including planting of dense hedge rows in the crop fields, or short-duration improved fallow were used. To increase harvests and sustainability, the project combined agroforestry with soil and water conservation. In collaboration with the government agricultural extension service, improved crop varieties were gradually also integrated with agroforestry and soil conservation [19,33,37,38].

2.4. Study Design and Variables

In this study, a natural experiment design was employed [39]. Natural experiments differ from field experiments and laboratory experiments in that the experimenter does not establish the perturbation but instead selects cases where the perturbation is already running or has run.
Kiptot et al. [22] and Ajayi et al. [26] argue that adoption studies ought to be based on multiple field surveys over a period long enough for farmers to actually adopt a technology. The empirical data used in this study consists of (1) historical project documentation such as internal assessments, documented in reports and internal project documents (for more details see Johansson and Nylund [17], Johansson et al. [18] and [37]); and (2) a specific assessment in which data was collected in May 2001. The dependent variables were selected to represent different levels of surviving agroforestry trees on individual landholdings. Only surviving trees of species promoted by the project, i.e., agroforestry species were used to assess the variation among villages in project outcome, i.e., the dependent variables (Table 1). These variables were based on random samples of 21 households in each village.
Variation among villages in the proportion of households with one to 30 trees (Sr1-30) was used to capture households that had started to plant and use agroforestry trees from one to two seasons (Table 1). Variation in the proportion of households with 40 trees or more (Sr ≥ 40) and that with five or more agroforestry species (Sp ≥ 5) were used to capture households that had been committed to agroforestry on a more long-term and regular basis. Average number of trees per household in the villages (SrX) and the accumulated total number of seasons from which the sample households in a village had surviving trees (SrS) were used to capture the progression from the testing phase to a more long-term and recurring commitment to agroforestry.
Table 1. Dependent variables used in the study.
AbbreviationDescription of variableVariable characteristics
type interval
Sr1-30No of sample households with 1–30 agroforestry trees/soil-improvers (3 m soil-improvement hedge = 1 tree) surviving on their farm discrete/interval0–21
Sr ≥ 40No of sample households with 40 or more agroforestry trees/soil-improvers (3 m soil-improvement hedge = 1 tree) surviving on their farmdiscrete/interval0–21
Sp ≥ 5No of households with 5 or more surviving agroforestry-tree species of the species promoted by the projectdiscrete/interval0–21
SrXAverage number of agroforestry-trees/soil-improvers surviving per sample household in a village, i.e., the total number of surviving trees (3 meters of soil improvement hedges = 1 tree) divided by all 21 sample household continuous/interval2.9–140.4
SrSThe accumulated total number of seasons from which the 21 sample household was found to have surviving agroforestry treescontinuous/interval3–41
Project staff in cooperation with district agricultural staff (government employees) selected independent variables deemed potentially able to affect the dependent variables and to vary from one village to another. The final selection of variables was also influenced by the results from a literature review of similar studies.
In a meta-analysis that investigated on-farm trees and hedgerows, [25] variables related to ‘uncertainty and risk’ had the highest average significant influence on adoption across the 23 included studies. Local governance in the project area, where its beneficiaries live and act, influence their judgement on long term investments like tree planting, soil conservation and agroforestry. As collaboration was considered an important part of the local governance influencing project result in the villages five variables were included describing the local collaboration between PEA and households (VEHh), PEA and village leaders (VEVL, Cle), and between village leaders and households (VLHh, Clh) (Table 2).
Furthermore, four key variables were included directly related to households’ perception of risk, beliefs of project beneficiaries (Local beliefs, Table 2) critical to agroforestry adoption; their perception of tree-ownership (Bh), the benefits of trees to soil and crop production (Be3), labour requirement to plant (Ps) or direct sow (Ss) a tree seedling/seed.
Three variables related to the physical environment (Table 2) considered to be important to agroforestry adoption were part of the independent variables. Distance to the lake (LAK) and main domestic water source (MDW) were included as a permanent water source is important for watering of seedlings, particularly in areas with erratic rainfall, like the Mara Region. The main soil type (MS) was included as soil fertility is an important parameter when growing trees [40].
Table 2. Independent variables and factors affecting agroforestry adoption differentiated into five social and ecological subsystems of the local landscape (for a more comprehensive description of variables, see Appendix I).
Subsystems of adoptionFactorVariables
iLocal governance local governance critical to agroforestry developmentlocal collaboration (VEHh, VEVL, VLHh, Cle, Clh,)
iiLocal belief perceptions related to trees and agroforestry perceived labour requirement of tree establishment, perception of tree ownership and the benefits of agroforestry trees (Bh, Be3 Ps, Ss)
iiiPhysical environmentcharacteristics of soil and watermain soil type, water source and distance to the lake (MS, MDW, LAK)
ivSubsistence systemsubsistence activities and practices affecting agroforestry establishmentmain economic activity, tilling method and main crop (MEA, MC, MTM)
vProjectproject interventionslevel, duration and type of project activities and characteristics of the project extension agent (VIM, Tws, Ttu, SEX, VEHL, VELE, VEDE, VEM, VEIS, Kef, Def)
Three variables were used to represent key attributes of the local subsistence/farming system that could potentially influence the integration of trees and soil improvement hedges in crop fields; the main economic activity MEA, main tilling method (MTM) and main crop (MC) used in the studied villages (Table 2).
Sanginga et al. [41], Sood and Mitchell [40], and Ajayi et al. [26] highlight the importance of the extension approach and organisation. The amount and duration of project interventions and the capacity and characteristics of the project extension agent varied among villages. Three independent variables describe the project activities were included; duration of project activities (VIM), number of field workshops (Tws) and farmer to farmer torus (Ttu) conducted in the village. Seven variables were used to characterise the PEA, such as education (VELE, VEDE), in-service training (VEIS), gender (SEX), duration of project employment (VEM) and the beneficiaries perception of her/his capacity (Kef) and devotion (Def) in/to agroforestry.
In total, 26 independent variables were included in the analyses (for a comprehensive description, see Appendix I). These variables represent social and ecological subsystems of the landscape related to agroforestry adoption (Table 2).

2.5. Data Collection

Data was collected during a field survey in May 2001. The field survey was designed to measure the project outcome in each of 89 PEA areas of concentration (AoC), i.e., a village or in some cases parts of larger villages, with an average of 305 households. This was done using a random sample of 21 households from each AoC with a total sample size of 1869 households. One member of the selected household was interviewed. The first preference was to interview the head of the household. If this was not possible the second choice was to interview the spouse and thirdly the oldest adult member of the household. Ranking exercises was carried out using cards with symbols known by the farmers to represent the objects to be ranked. The interviewee was asked to place the cards in order of importance. Scoring exercises were done using equally sized boxes drawn on a big chart, each box with a symbol representing the objects to be scored, large tree seeds were then used for scoring, e.g., 3 seeds to represent good, 2 seeds to represent normal/neutral/moderate and 1 seed to represent poor [42]. Project staff counted the number of project related seedlings and species in the nursery as well as those planted and surviving trees/seedlings and species on the farm. The number of seasons from which the household had surviving agroforestry trees was also established through interview and observation. This specific project assessment was done by 31 persons during 13 days making a total of 403 person days.

2.6. Data Analyses

To ensure that the proportion between households with a positive response to project interventions were separated from the proportion of the households with no response a χ2-test [43] was employed, testing the hypothesis of equal proportions in the 89 villages for all the four dependent variables based on village proportions, i.e., Sr1-30, Sr ≥ 40 and Sp ≥ 5. Furthermore, the residuals were studied for bias and normal distribution.
A correlation analysis [43] was first made to map the relationship among the variables included in the study using Pearson’s correlation criteria. As adoption is a dynamic process, several factors presumed to be independent are likely to influence one another. Therefore, these variables should not be treated in isolation, ignoring their mutual interdependencies [26]. Gujarati [44] argues that a multiple regression model including correlated predictors can give valid results in terms of how well the entire set of independent variables, the model as a whole, predicts the outcome variable, i.e., the response. Also, information may be lost because relevant variables may be omitted that may in turn result in biased coefficient estimates of the predictors remaining in the model [44]. Therefore, instead of excluding correlated independent variables the interdependence has been part of the analysis and its interpretation. Furthermore, Ajayi et al. [26] argues that, if individual characteristics are pulled out, it may turn out that a specific characteristic viewed as having a positive influence on adoption in one study may turn out to have a negative influence in another. However, keeping all variables in the stepwise regression analysis would mean that it may not give valid results about any individual predictor per se, or about which predictors are redundant with respect to others.
The influence of the 26 independent variables on adoption were analysed using stepwise multiple linear regression. The main reason to use multiple regression analysis is to learn more about the relationship between several independent variables to a response variable (dependent variable) [45,46]. All 26 independent variables (x1–x26) were hypothesized to influence the dependent variables (Table 1), consisting of five different numerical measurement on ratio scale. From the models produced by the stepwise procedure the model with the largest number of variables and the highest R2 was selected for each response based on the general model: Y = β0 + β1x1 + β2x2 + …βnxn + en where, Y is the dependent variable, β0 the intercept, β1, β2,..., βn are the coefficient of the explanatory variables x1, x2,..., xn and en the error term of the nth observation.
The regression models were constructed using Minitab™ with the default stepwise probability criteria of F to enter 0.150 and probability of F to remove 0.150. We followed recommendations to use a P-level between 0.10–0.20 in a model building as the aim was to search for possible explanatory predictors [43,47,48,49]. The stepwise selection of models has been criticised, particularly due to the occurrence of type 1 errors, i.e., inclusion of variables that has no or limited effect [50]. The strategy used to tackle this problem was to complement the multiple regression analyses with a correlation analysis including both dependent and independent variables [26,43]. Furthermore, the independent variables included in each model were analysed individually against the response using simple multiple regression for continuous variables and single anova for discrete variables. Another possible solution to tackle the type 1 error would be to lower the level of significance of the probability criteria used in the stepwise procedure [50]. However, our choice was to keep the default level and complement with the correlation and individual analyses. Finally, we interpreted the models using the criteria provided from the stepwise analysis together with the result of the complementary analyses to draw conclusions about the influence of village differences on tree survival.

3. Results and Discussion

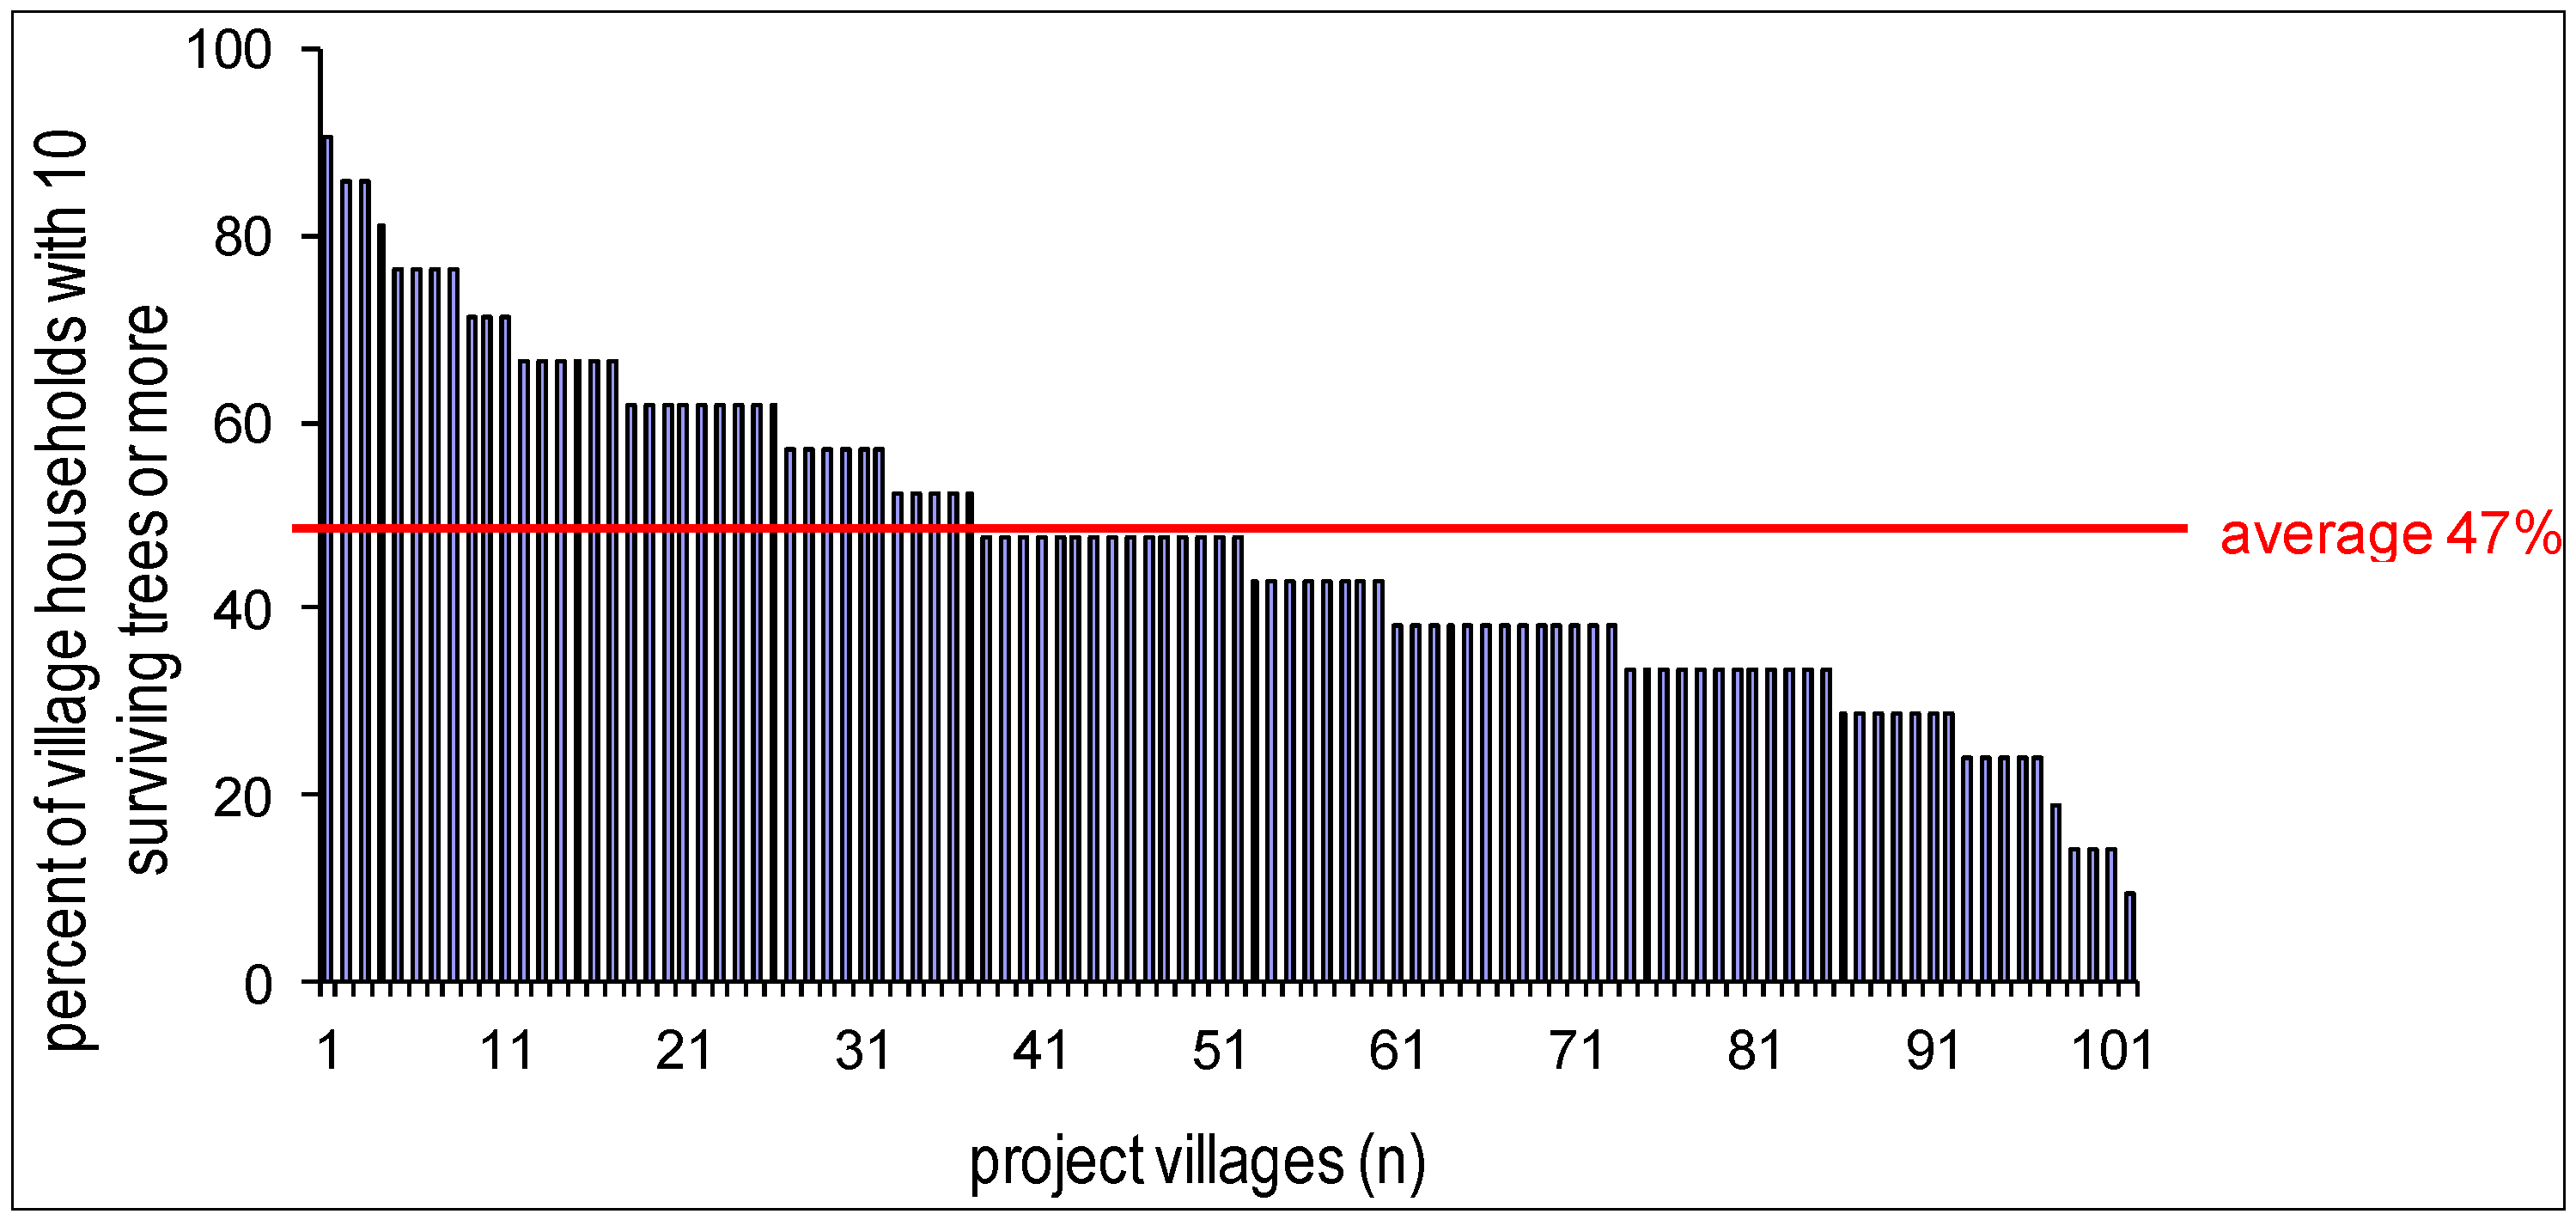
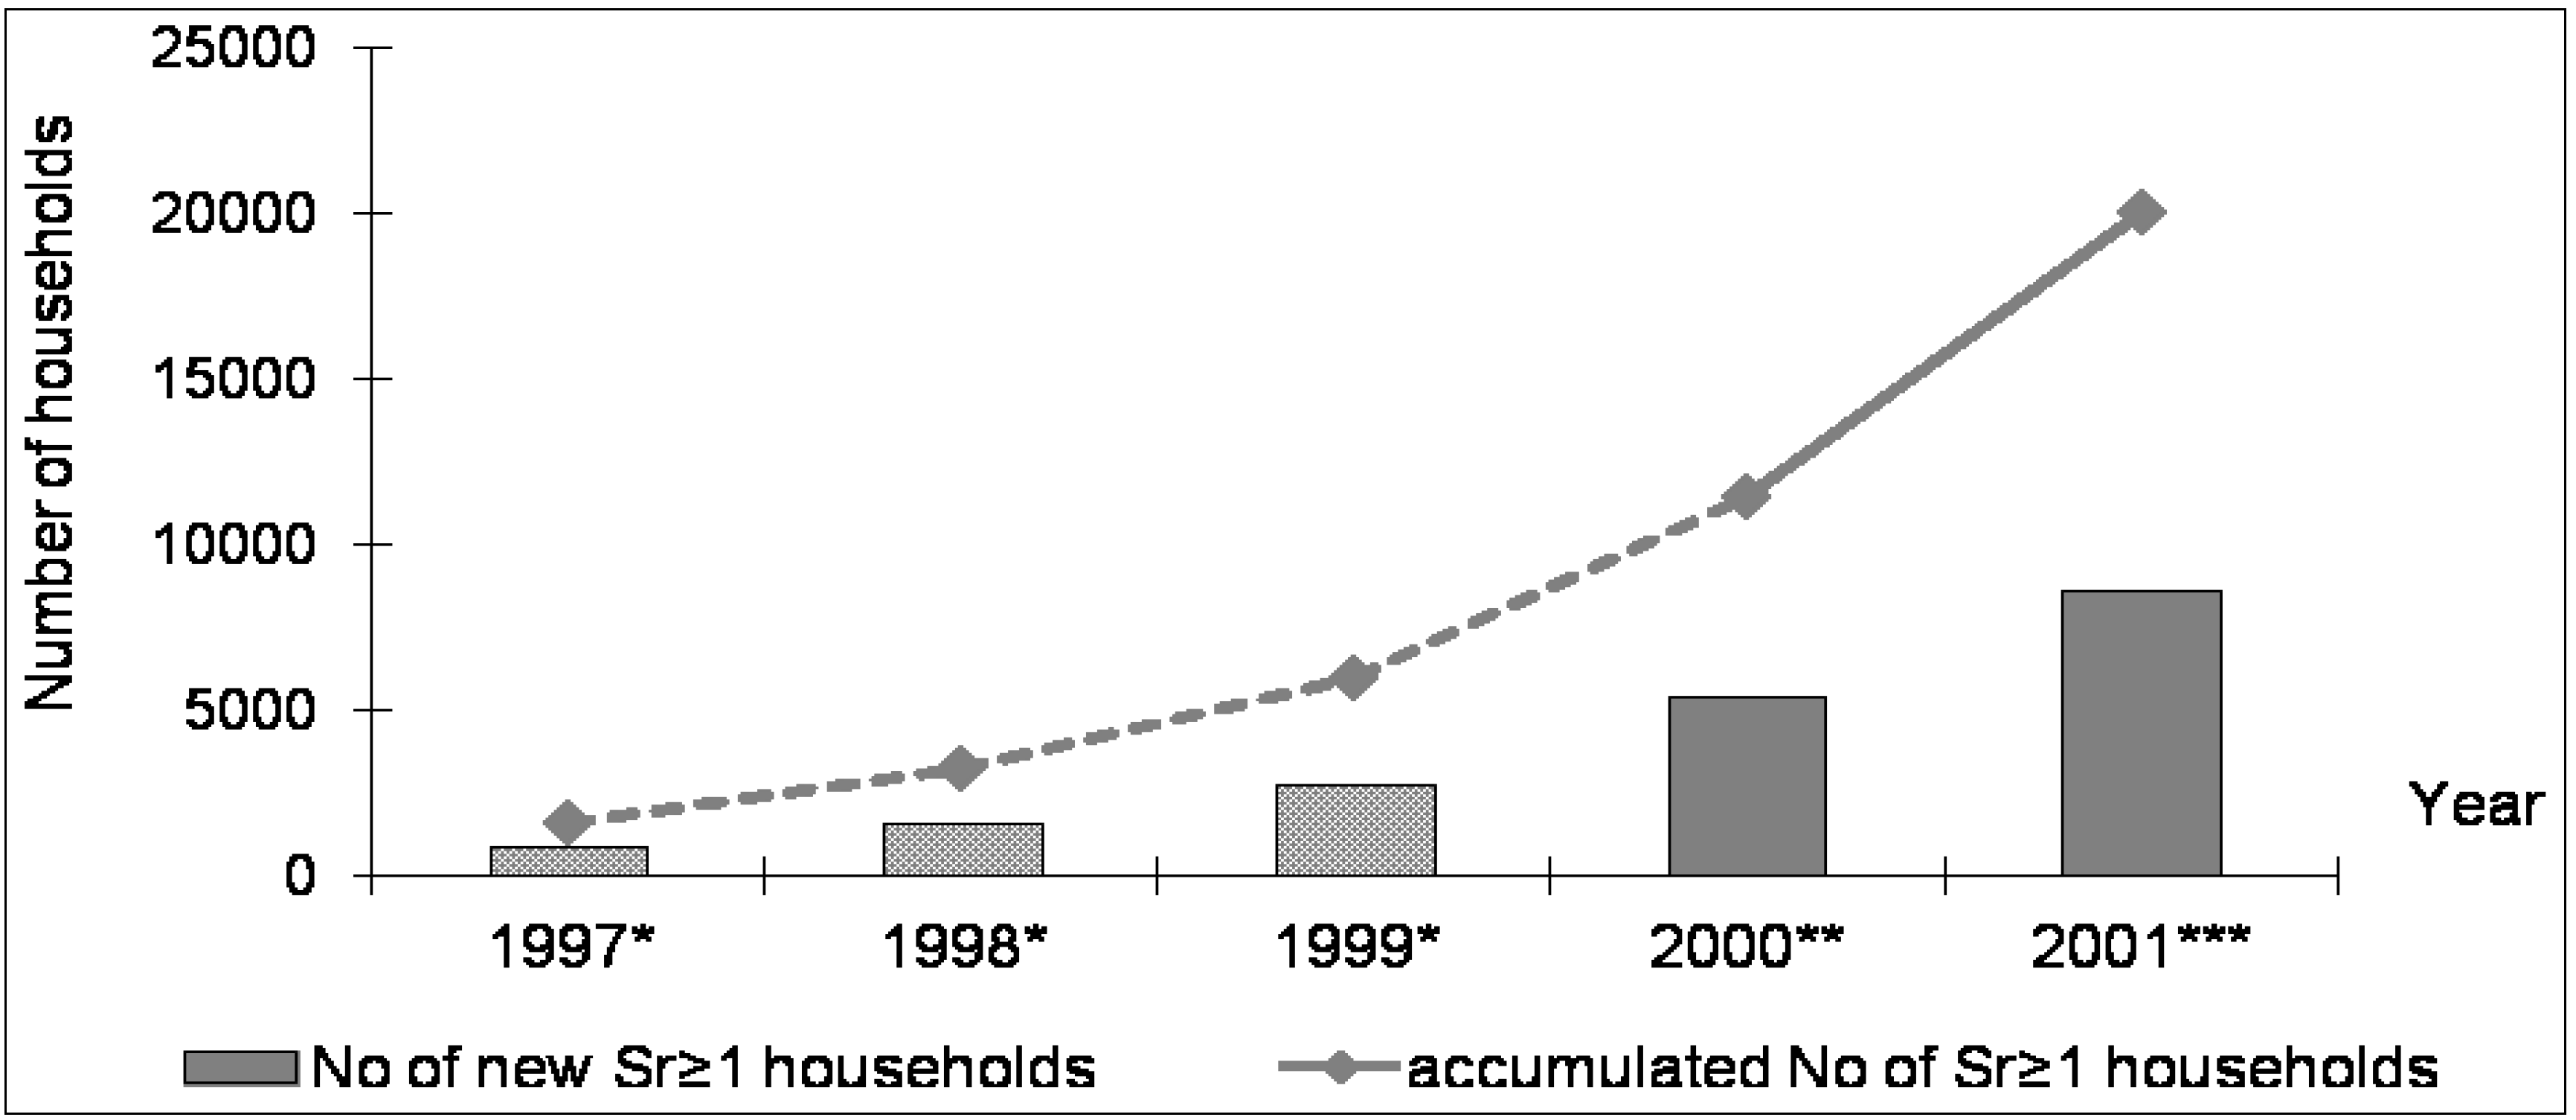
3.1. VI-Agroforestry Project Outcome

After a slow and struggling start in 1995, the scaling up process started to gain momentum in 1999, increasing from about 5000 households to a total of 20,000 households with surviving agroforestry trees (Sr ≥ 1) in 2001 (Figure 1).
Figure 1. Progress of scaling up in terms of total number of households in the project area with surviving trees out of an approximately total 34,500. Dotted lines and light grey columns are based on reports and internal project documents. The histogram indicates the additional number of households with surviving trees and/or soil improvers each year.
Sustainability 05 05171 g001
* data from the project extension agents’ reports; ** data from participatory performance assessment in Aug-Sept 2000; households with surviving trees/soil improvers planted during the short rains in the end of 1999/beginning of 2000 (275 mm rainfall) and the long rains lasting from March to end of April 2000, (340 mm rainfall); *** data collected for this study in May 2001.
The average number of agroforestry trees surviving on farms (Sr ≥ 1) was: 21.8 long-term trees, 5.3 fruit trees, 102 m of soil-improvement hedges including 7.6 agroforestry tree species per household on average. However, the variation from one village to another was considerable. In May 2001, the proportion of households with 10 or more surviving agroforestry-trees (Sr≥10) in the studied villages varied from 10%–90% (Figure 2).
Figure 2. Inter-village variation in proportion of households with 10 or more surviving agroforestry trees of species promoted by the project.
Sustainability 05 05171 g002

3.2. Correlation Analysis

The correlation analysis reveals relationship between dependent and independent variables as well as among independent variables (Table 3). The proportion of households with few surviving trees (Sr1-30) had only a strong relationship to the number of workshops conducted in a village (Tws) (see Table 3). A lower positive correlation (<0.05) was found between the Sr1-30, the main tilling system and the households’ perception of the PEA’s capacity in agroforestry (Kef) and their ownership of trees (Bh).
All of the other four responses describing a more tangible and long-term commitment to agroforestry (Sr ≥ 40, Sp ≥ 5, SrX, SrS) were strongly and positively correlated to at least three of the independent variables, i.e., the number of training workshops (Tws) and farmer to farmer (Ttu) that the households claim participation in and that of tree ownership. In addition the accumulated total number of seasons from which the 21 sample household was found to have surviving agroforestry trees (SrS) was strongly correlated to the number of weeks the PEA had participated in project in-service training (VEIS). In general, the responses describing a stronger commitment to agroforestry were found to be correlated to a larger variety of independent variables and with a higher significance level compared to the Sr1-30 response, e.g., variables related to the project (Tws, Ttu) local belief system (Bh, Be3), local governance system (VEHh,VEVL, Cle).
As shown in Table 3, the correlation analysis reveals a number of relationships between the independent variables used in this study contesting the multicolinearity among independent variables. Some of these correlations are obvious and logical, e.g., correlations between main soil type (MS), main tilling method (MTM) and main crop (MC). This was an expected relationship, as the soil type is one of the main factors determining the crop and the tilling method applied.
PEA’s type of formal education (VEDE) was related to the PEA’s gender. Agriculture, forestry or land-use educations were more common among male PEAs whereas teacher, community development and animal health were more common among female PEAs.
Table 3. Matrix showing the level of significance of positive and negative (−) correlation (Pearson) between independent variables presented in Appendix I. Complete columns and rows without any correlation have been deleted.
LAKMDWMSMCMTMVIMVEHhVEVLSEXVELEVEISVEMBe3BhPsSsKefCleClhTtuTws
Dependent variable
Sr1-30******
Sr ≥ 40************
Sp ≥ 5*************
SrX***************
SrS***************
Independent variables
MDW
MC ***
MTM *****
MEA* **** **
VEHh
VEVL
VLHh*
SEX *
VELE*
VEDE **
VEIS*
VEM****
Be3*
Bh*****
Ps * **
Ss*******
Kef*****
Def*****
Cle ******
Clh******
Ttu *****
Tws********************
* = <0.05 significance level; ** = <0.01 significance level; *** = <0.001 significance level.
Improved collaboration (VEHh, VEVL, Cle, Clh), improved capacity of the PEA (VEIS, VEM) and an increasing proportion of households believing that sowing of tree seed (Ss) is easy and that they own the trees they plant (Bh) were all related to an increasing number of training workshops conducted in a village.
An increasing proportion of households believing in the positive effect of agroforestry (Be3) was related to improved collaboration (Clh, VEHh, Cle, VEHh) and an increasing proportion of households believing that sowing of tree seed is easy (Ss), that they own the trees they plant, Bh) and in the PEA’s knowledge (Kef) and devotion (Def) to agroforestry. Kef was in turn also positively correlated to the households’ perception of local collaboration (Cle), tree ownership (Bh), PEA’s devotion to agroforestry (Def) and the number of training (Tws) and awareness events (Ttu) they had participated in. Furthermore, a positive interaction was also found between the proportion of households believing that they own the trees they plant (Bh) and local collaboration (VEVL). This multicolinearity proves that an interaction between different subsystems exists affecting agroforestry adoption (Table 2).

3.3. Multiple Regression and Individual Analyses

As has been explained above (Section 2.6), in spite of the multicolinearity found among independent variables it was decided to include all variables in the step-wise multiple regression analysis.
The hypothesis of equal proportion among the 89 villages was rejected (p-value < 0.001) for response variables Sr1-30, Sr ≥ 40 and Sp ≥ 5. The expected count exceeded 5 in both columns which is normally used as the lower limit in the χ2 test. In terms of these three dependent variables based on proportion, the differences between villages can thus be considered contested. The distribution of the residuals of the five dependent variables was studied and found to be acceptable in terms of normal distribution, homoscedasticity and a linear relationship.
Five models were generated, one for each of the responses presented in Table 1. For each model, all 26 variables listed in Appendix I were entered into the stepwise procedure. The increase in R2 was reasonable with the addition of each independent variable from X1 to Xi (see partial R2 in Table 4, Table 5, Table 6, Table 7 and Table 8). All variables left in the models were significant at a 0.150 level, and no other variable met the 0.1500 significant level for entry into the models. The F-ratio of explanatory variables in the five models described below are statistically significant at a confidence level lower than 0.001. Each independent variable included in the models has been tested against the response. The result of these tests are presented in the last column of Table 4, Table 5, Table 6, Table 7 and Table 8.
Table 4. Output of the analyses related to the response explaining the inter-village variation in the village proportion of households (Hh) with 1–30 surviving agroforestry trees (Sr 1-30), including eight independent variables (Tws = average number of field workshops per Hh, Ttu = average number of farmer-to-farmer tours per Hh, VIM = duration of project activities in the village, Kef = Hhs’ ranking of the project extension agent’s knowledge in agroforestry, VEDE = the main discipline of the PEA’s education, Be3 = Hhs’ perception of the effect of agroforestry on the soil/crop, VEM = Months of PEA’s project employment and VEIS = weeks of in-service training attended by the PEA). P-values of the individual test of the independent variable against the response is presented in the last column; ‘a’ indicates single anova and ‘r’ simple regression.
StepVariableParameter
Estimate
Standard ErrorPartial R2R2R2 adjMallows C-pt-valueP-valueIndividual test P-value
Intercept5.36
1Tws3.000.74812.7912.711.77.54.010.0000.001r
2Ttu−5.601.9036.0418.816.93.1−2.940.0040.984r
3VIM−0.060.0232.5121.318.52.4−2.620.0110.415a
4Kef2.801.7322.9624.320.71.31.600.1130.043r
5VEDE1.290.8461.9826.221.81.21.520.1320.132a
6Be3−2.001.3611.9328.222.91.1−1.450.1510.784r
7VEM0.070.0301.9530.124.11.02.270.0260.740a
8VEIS−0.500.2912.4732.625.80.4−1.710.0910.078a
Table 5. Output of the analyses related to the response explaining the inter-village variation in the village proportion of households (Hh) with 40 or more surviving agroforestry trees (Sr ≥ 40), including six independent variables (Ttu = average number of farmer-to-farmer tours per Hh, Bh = Hhs’ perception of tree ownership, MTM = main tilling method used in the village, Be3 = Hhs’ perception of the effect of agroforestry on the soil/crop, Kef = Hhs’ ranking of the project extension agent’s knowledge in agroforestry and MDW = main source of domestic water). For further explanation see Table 4.
StepVariableParameter
Estimate
Standard ErrorPartial R2R2R2 adjMallows
C-p
t-valueP-valueIndividual test
P-value
Intercept3.01
1Ttu7.301.66420.1220.119.216.24.410.0000.000r
2Bh6.601.61610.3330.428.85.14.070.0000.000r
3MTM−1.180.5983.1433.531.23.2−1.980.0510.396a
4Be33.101.3942.4936.033.02.02.210.0300.045r
5Kef−4.201.7643.3939.435.8−0.3−2.380.0200.799r
6MDW−0.970.5732.0441.537.2−0.9−1.690.0950.329a
Table 6. Output of the analyses related to the response explaining the inter-village variation in the village proportion of households (Hh) with five or more surviving agroforestry tree species (Sp ≥ 5), including eight independent variables (Bh = Hhs’ perception of tree ownership, Tws = average number of field workshops per Hh, MTM = main tilling method used in the village, MC = main crop cultivated in the village, Ttu = average number of farmer-to-farmer tours per Hh, VEVL = collaboration between project extension agent (PEA) and village leadership, Be3 = households’ perceptions of the effect of agroforestry on soil/crops, Kef = Hhs’ ranking of the PEA’s knowledge in agroforestry). For further explanations see Table 4.
StepVariableParameter
Estimate
Standard ErrorPartial R2R2R2 adjMallows C-pt-valueP-valueIndividual test
P-value
Intercept0.59
1Bh6.201.84621.5721.520.625.73.360.0010.000r
2Tws1.510.8556.2427.525.919.21.710.0800.000r
3MTM-1.690.6853.2530.828.316.6-2.470.0160.742a
4MC1.730.6414.2935.132.012.52.690.0090.550a
5Ttu4.702.0712.0837.233.411.62.270.0260.000r
6VEVL0.910.5162.1939.334.910.51.770.0800.016a
7Be33.201.4782.3941.736.79.22.140.0350.022r
8Kef-3.501.8542.4244.238.67.7-1.860.0660.599r
Table 7. Output of the analyses related to the response explaining the inter-village variation in the average number of surviving agroforestry trees per household (Hh) (SrX), including 11 independent variables (Ttu = average number of farmer to farmer tours per Hh, Bh = Hhs’ perception of tree ownership, Be3 = Hhs’ perception of the effect of agroforestry on the soil/crop, MTM = main tilling method used in the village, MC = main crop cultivated in the village, VEVL = collaboration between project extension agent (PEA) and village leadership, VIM = duration of project activities in the village, LAK = distance from village centre to the lake shore, VELE = PEA’s level of education, Kef = Hhs’ ranking of the PEA’s knowledge in agroforestry, Ps = Hhs’ ranking of the labour demand to plant a tree seedling). For further explanation see Table 4.
StepVariableParameter
Estimate
Standard ErrorPartial R2R2R2 adjMallows C-pt-valueP-valueIndividual test
P-value
Intercept−67.30
1Ttu85.0012.49027.9727.927.127.96.780.0000.000r
2Bh40.0012.2507.9635.934.417.43.260.0020.000r
3Be331.0010.2703.7539.637.513.53.050.0030.030r
4MTM−14.904.8203.1242.840.010.6-3.090.0030.347a
5MC14.204.5983.0145.842.57.93.090.0030.846a
6VEVL9.503.7541.9647.743.96.92.540.0130.063a
7VIM0.330.1531.9149.645.35.92.140.0350.055a
8LAK0.900.4501.7551.446.55.12.020.0470.346a
9VELE9.104.7072.0753.548.23.91.940.0560.373a
10Kef−30.0013.7501.7455.249.53.1−2.190.0310.261r
11Ps18.0011.4601.3856.650.43.01.560.1220.365r
Table 8. Output of the analyses related to the response explaining the inter-village variation in the accumulated total number of seasons from which households (Hh) had surviving agroforestry trees (SrS), including five independent variables (Tws = average number of field workshops per Hh, Bh = Hhs’ perception of tree ownership, SEX = gender of the project extension agent, Kef = Hhs’ ranking of the project extension agent’s (PEA) knowledge in agroforestry, VEIS = weeks of in-service training attended by the PEA). For further explanation see Table 4.
StepVariableParameter
Estimate
Standard ErrorPartial R2R2R2 adjMallows C-pt-valueP-valueIndividual test
P-value
Intercept9.94
1Tws5.901.34730.1430.129.31.14.390.0000.000r
2Bh7.703.1963.3133.431.9−1.02.410.0180.000r
3SEX−2.501.2242.9836.434.1−2.7−2.040.0440.425a
4Kef−6.903.2552.9539.336.5−4.3−2.110.0380.966r
5VEIS0.490.3051.8141.137.6−4.51.600.1140.008a

3.3.1. Village Proportion of Households with 1–30 Surviving Agroforestry Trees

Eight variables were included in the model explaining 32.6% of the variation from one village to another in the proportion of households with 1–30 surviving agroforestry trees (Sr1-30, Table 4).
According to the Mallows C-p value only two variables, farmer field workshops (Tws) and farmer to farmer tours (Ttu), proved important while in the individual tests Tws and the PEAs knowledge in agroforestry (Kef) were significantly related to the Sr1-30 proportion.
Variables related to project interventions (Tws, Ttu and VIM) were the most influential variables in the Sr1-30 model. Farmer to farmer tours (Ttu) had a strong negative influence in the model and no influence at all if analysed separately against the Sr1-30-response. Similarly, the duration of project activities in a village (VIM), a belief in the good effect of agroforestry (Be3), and the weeks of in-service training received by the PEA (VEIS) had a slight negative influence in the Sr1-30 model.

3.3.2. Village Proportion of Households with 40 or more Surviving Agroforestry Trees

The model explaining the variation in the village proportion of households with 40 or more surviving trees (Sr≥40) had six variables with an explanatory power (R2) of 41.5%. According to the Mallows C-p criterion, three variables prove important; farmer to farmer tours (Ttu) perception of tree ownership (Bh) and main tilling method (MTM), while in the individual analyses Ttu, Bh and the households’ perception of the effect of agroforestry trees (Be3) proved significantly related to the Sr ≥ 40 proportion.
Together, farmer to farmer tours (Ttu) and the households’ perception of tree ownership (Bh) represent over 70% of the explanatory power of the model (R2, Table 5). The strong influence of Ttu and Bh were also verified by the Mallows C-p and in the individual analysis. This is in clear contrast to the Sr1-30 model. The positive influence of the PEA knowledge in agroforestry (Kef) in the Sr1-30 model is here turned into a marginal negative influence. Another important difference between these two responses was the field workshops (Tws) that had the strongest influence in the Sr1-30 model but was not included in this model, indicating that Tws was not important for households’ decisions to continue beyond 40 trees. Similarly, the households’ perceptions of tree ownership had a strong influence in this model but were not included in the Sr1-30 model, indicating that tree ownership was not important to the households’ decisions to start planting trees but clearly for a more long-term commitment to agroforestry. The six variables included in the Sr ≥ 40 model represent four different subsystems of adoption; the project (Ttu and Kef), the local belief system (Bh and Be3), the subsistence system (MTM) and the physical environment (MDW).

3.3.3. Village Proportion of Households with Five or More Surviving Agroforestry Species

The model explaining the variation in the proportion of households with five or more surviving tree species (Sp ≥ 5) includes eight variables with an explanatory power of 44.2% (Table 6). The included variables represent four subsystems of adoption; the project (Tws, Ttu and Kef), local belief system (Bh and Be3), the subsistence system (MTM and MC) and local governance (VEVL). There was a good agreement between the stepwise selected model and the Mallows criterion (i.e., the last included variable is close to eight (C-p = 7.7).
Households’ perceptions of tree ownership (Bh) contributed with almost half of the explanatory power in the Sp ≥ 5 model such that the proportion of households with five or more species was clearly higher in villages where many people believe they own the trees they plant. The Sp ≥ 5 proportion also increased with increasing number of field workshops (Tws). An increasing proportion of households believing in the good effect of agroforestry on soil and/or crop contributed marginally to increase the Sp ≥ 5-proportion. According to the individual analyses, five independent variables (Bh, Tws Ttu, VEVL, Be3) were significantly related to the Sp ≥ 5 proportion (Table 6).

3.3.4. Average Number of Surviving Agroforestry Trees per Household

Eleven variables were included in the regression model (Table 7), explaining 56.6% of the inter-village variation in the average number of surviving agroforestry trees per household (SrX). All the five subsystems affecting adoption included in the study were represented in SrX model (Table 2). The influence of farmer to farmer tours (Ttu) had an overwhelming explanatory power. The perception of tree ownership (Bh) contributed more than twice as much to the explanatory power compared to any of the remaining variable. Judging from the Mallows criterion, the first six variables were important (Table 7). In the individual analysis only the first three variables (Ttu, Bh and Be3) proved significantly related to SrX.
The average number of trees per household (SrX) increased with the number of farmer to farmer tours conducted in a village (Ttu), the number of households believing they own the trees they plant (Bh) and in the good effect of agroforestry trees (Be3).

3.3.5. Number of Seasons from which the Households had Surviving Agroforestry Trees

The five variables included in the model explained 41.2% of the inter-village variation in the accumulated total number of seasons from which the 21 sample household was found to have surviving agroforestry trees (Table 8). In the individual analyses the number of field workshops (Tws), households’ perception of tree ownership (Bh) and in-service training of the PEA (VEIS) proved significantly related to the response. Tws was the only important variable as judged by the Mallows C-p value.
The number of farmers training workshops in a village had a strong positive effect on the SrS response. SrS also increased with an increasing proportion of households believing they own the trees they plant. Again, as in the Sr ≥ 40, Sp ≥ 5 and the SrX models, households’ belief in the PEA’s capacity in agroforestry (Kef) had a negative effect in the SrS model. Although, this effect was only marginal in terms of R2 the influence is consistent in all four models representing a long term and regular commitment to agroforestry.
The fact that the SrX and the SrS models are different indicating that what is important in order to increase the number of surviving trees in a village is different from bringing the households to continue planting trees season after season. The project and the households’ perceptions of tree ownership are important in both models. The farming system and local governance were part of the explanation to the variation in SrX but was not part of the Srs model. Another important difference was farmer to farmer tours that had the strongest explanatory power in the SrX model but was not included in the stepwise selected model of the SrS response. However, analysed separately, in a simple regression, farmer to farmer tours proved it is significantly (P-value < 0.0001) related to SrS.

3.4. Pattern of Relationships

The project field workshops, farmer-to-farmer tours and the households’ perceptions of tree ownership were the three most important variables for successful adoption of agroforestry. Variables related to the project and its operation, mainly the number of field workshops, explained the variation in the proportion of households with fewer than 30 surviving trees. This indicating in line with Ajayi et al. [26] that factors related to the availability of information and training play an important role in farmers’ decision to start with and/or test a technology. In comparison, a large variety of variables, such as farmer to farmer tours, households’ perceptions of tree ownership and the benefit of agroforestry, representing at least four of the studied subsystems in each model (Table 2), proved important for a more tangible and long-term commitment to agroforestry. Taken together this result imply, in line with earlier studies (notably [26,51,52,53,54]), that preconditions are more complex for households to proceed beyond the initial tree planting and testing stage with a more long term commitment to agroforestry. This difference was further emphasized by the fact that the farmer to farmer tours had a strong negative influence on the proportion of households with few surviving trees and a clear positive influence on a more tangible and long-term commitment to agroforestry. Although only with a marginal influence, the same pattern was true for the households’ perception of the effect of agroforestry trees. Also, with a marginal but consistent effect, a strong belief in the PEA’s agroforestry knowledge was important for household to start planting trees but not for them to continue with agroforestry. Ajayi et al.’s [26] argue that the explanation to this kind of contradictions can often be found in institutional and social contexts, and requires a deeper understanding of the dynamics of the adoption processes of the respective study areas. In addition to the influence of inter-village variations on agroforestry adoption there were also differences between, wards, divisions, project zones and administrative districts that may influence project outcomes. These contradictions together with the strong influence of households’ perceptions and the correlation between the independent variables found in this study show—in line with studies by Kiptot et al. [22], Pollini [55], Mercer and Miller [56], and Ajayi et al. [26]—the importance to consider a wider context, including socio-cultural dimensions and the learning processes involved in agroforestry adoption and scaling up.
For a more comprehensive understanding, it is thus necessary to complement this quantitative analysis with an analysis including qualitative data, considering and interpreting the relationships presented in this study in relation to a wider socio-cultural context, the scaling up process itself, differences in governance at multiple levels and interaction between the social and ecological subsystems [57,58].

3.5. An Increasing Proportion of Households with an Increasing Number of Surviving Seedlings

Considering that 80% of the households in the project area were food insecure according to official statistics [34], a participation level above 20% among households increased the involvement of people and households with the most urgent needs. In addition, the project targeted mainly food insecure households. To raise seedlings in a home nursery, plant them in the farm, protect them and care for them to survive in areas with erratic rainfall and poor soils require investments in time and efforts that compete with other livelihood related and often reactive activities. A small scale farmer normally managed to do this with a few trees and species based on the motivation and skills he/she acquired from the first project training workshops. In most cases, for small scale farmers, to reach beyond 40 surviving trees and more than five agroforestry species, required efforts over multiple seasons that in turn entails, a higher level of certainty about the ownership of trees and the experienced benefits of agroforestry. Also, more knowledge is needed to adopt agroforestry in addition to initial basic skills in tree planting. In addition, agroforestry is a long term activity that will require several years before the investments results in an improved livelihood situation. On individual farms, small scale farmers control at best some miscellaneous land (borders along roads and water bodies and the homestead) that can be used for tree planting apart from their arable land. Hence to move beyond 40 trees implied, for most households in the Mara lake zone, a move from tree planting to agroforestry, which require integration and management of trees with other farm practices and components of the farming system.
Agroforestry systems, using trees for soil improvement have the potential to increase food production considerably and thus consumption levels [6], which is critical for the large proportion of food insecure households in Mara region. With the capacity to raise and integrate an increasing number of agroforestry species, such as fast growing legumes and fruit trees, small scale farmers can also diversify the output of their subsistence system, including, nutrition type and leaves (for food and fodder), fruits and nuts, fuel wood and timber [7]. An added advantage of tree crops is that food and fodder mature and can be harvested at a time when the agricultural food crops are in shortage. These added advantages of trees and agroforestry increase the resilience of the subsistence system. Also, the ecosystem services provided through an increasing tree cover in the landscape such as improved erosion control, soil formation, water-holding capacity, increased carbon sequestration and supporting habitats for different species further contribute to the resilience of the Mara region. The carbon sequestered in agroforestry systems compared to normal agricultural systems carries a viable future opportunity through the growing potential for carbon trading [3,4].

4. Conclusions

Social and ecological differences between villages are important explanations to the variation in the rate of agroforestry adoption. Compared to the factors involved in households’ decisions to start with tree planting the preconditions to continue with agroforestry beyond the initial testing phase are more complex. Close to 60% of the households in the project villages (i.e., 20,000 out of 34,500) had surviving agroforestry trees, and, on average, 102 meter of soil improving hedges and 27 trees. This growing capacity in agroforestry among small scale farmers has improved the sustainability and resilience of both the social and the ecological system in the Mara region. The large proportion of households with a large number of surviving agroforestry trees and species established over an increasing number of seasons, imply that a considerable motivation for and capacity in agroforestry has been built among the food insecure small scale farmers.

Acknowledgments

The authors gratefully acknowledge the editors and two anonymous reviewers for their valuable and constructive comments and suggestions that considerably improved the article. We also extend appreciation and gratitude to all involved in the scaling up process in Mara and all those contributing to this study. Special thanks in this regard are sent to the former Regional Commissioner of Mara Nimrod Lugoe, Rose-Mary Mwlinga, Damian Silas, Celestine Mafuru, Phillipina Shayo, Neema Kitila, Maisha Mwaisengela, Xhanfon Bitala and the project extension agents. We also thank Vi Skogen and Tor Nyberg for the approval of the access to data from the Vi Agroforestry Project in Mara, and FORMAS for part of the funding.

Conflicts of Interest

The authors declare no conflict of interest related to this study.

References

  1. Baalman, P.; Schlamadinger, B. Scaling up AFOLU Mitigation Activities in Non-Annex I Countries; Working Paper of the Climate Strategy & GHG Services for the Eliasch Review; Climate Strategies: Cambridge, UK, 2008. [Google Scholar]
  2. Rights and Resources Initiative. Seeing People through the Trees: Scaling up Efforts to Advance Rights and Address Poverty, Conflict and Climate Change; RRI: Washington, DC, USA, 2008. [Google Scholar]
  3. Nair, P.K.R.; Kumar, B.M.; Nair, V.D. Agroforestry as a strategy for carbon sequestration. J. Plant Nutr. Soil Sci. 2009, 172, 10–23. [Google Scholar] [CrossRef]
  4. Nair, P.K.R.; Nair, V.D.; Kumar, B.M.; Showalter, J.M. Carbon sequestration in agroforestry systems. Adv. Agron. 2010, 108, 237–307. [Google Scholar]
  5. Rockström, J.; Kaumbutho, P.; Mwalley, J.; Nzabi, A.W.; Temesgen, M.; Mawenya, L.; Barron, J.; Mutua, J.; Damgaard-Larsen, S. Conservation farming strategies in East and Southern Africa: Yields and rain water productivity from on-farm action research. Soil Till. Res. 2009, 103, 23–32. [Google Scholar] [CrossRef]
  6. Akinnifesi, F.K.; Chirwa, P.W.; Ajayi, O.C.; Sileshi, G.; Matakala, P.; Kwesiga, F.R.; Harawa, R.; Makumba, W. Contribution of agroforestry research to livelihood of smallholder farmers in southern Africa: 1. Taking stock of the adaptation, adoption and impact of fertilizer tree options. Agric. J. 2008, 3, 58–75. [Google Scholar]
  7. Akinnifesi, F.K.; Sileshi, G.; Ajayi, O.C.; Chirwa, P.W.; Kwesiga, F.R.; Harawa, R. Contributions of agroforestry research and development to livelihood of smallholder farmers in southern Africa: 2. Fruit, medicine, fuelwood, and fodder tree systems. Agric. J. 2008, 3, 76–88. [Google Scholar]
  8. Jose, S. Agroforestry for ecosystem services and environmental benefits: An overview. Agrofor. Syst. 2009, 76, 1–10. [Google Scholar] [CrossRef]
  9. Oyebade, B.A.; Aiyeloja, A.A.; Ekeke, B.A. Sustainable agroforestry potentials and climate change mitigation. Adv. Environ. Biol. 2010, 4, 58–63. [Google Scholar]
  10. Schoeneberger, M.M. Agroforestry: Working trees for sequestering carbon on agricultural lands. Agrofor. Syst. 2009, 75, 27–37. [Google Scholar] [CrossRef]
  11. Kalaba, K.F.; Chirwa, P.; Syampungani, S.; Ajayi, O.C. Contribution of Agroforestry to Biodiversity and Livelihoods Improvement in Rural Communities of Southern African Regions. In Tropical Rainforests and Agroforestry under Global Change: Ecological and Socio-Economic Valuations; Tscharntke, T., Leuschner, C., Veldkamp, E., Faust, H., Guhardja, E., Bidin, A., Eds.; Springer: New York, NY, USA, 2010; pp. 461–476. [Google Scholar]
  12. Franzel, S.; Denning, G.L.; Lillesø, J.P.B.; Mercado, A.R., Jr. Scaling up the impact of agroforestry: Lessons from three sites in Africa and Asia. Agrofor. Syst. 2004, 61, 329–344. [Google Scholar]
  13. Cooper, P.J.; Leakey, R.R.B.; Rao, M.R.; Reynolds, L. Agroforestry and the mitigation of land degradation in the humid and sub-humid tropics of Africa. Exp. Agric. 1996, 32, 235–290. [Google Scholar] [CrossRef]
  14. Trees on the Farm: Assessing the Adoption Potential of Agroforestry Practices in Africa; Franzel, S.; Scherr, S.J. (Eds.) CABI: Wallingford, UK, 2002; p. 197.
  15. Place, F.; Franzel, S.; DeWolf, J.; Rommelse, R.; Kwesiga, F.; Niang, A.; Jama, B. Agroforestry for Soil Fertility Replenishment: Evidence on Adoption Processes in Kenya and Zambia. In Natural Resources Management in African Agriculture: Understanding and Improving Current Practices; Barrett, C.B., Place, F., Aboud, A.A., Eds.; CAB International: Wallingford, UK, 2002; pp. 155–168. [Google Scholar]
  16. Sanchez, P.A. Science in agroforestry. Agrofor. Syst. 1995, 9, 259–274. [Google Scholar]
  17. Johansson, K.-E.V.; Nylund, J.-E. NGO Policy Change in Relation to Donor Discourse. The Case of Vi Skogen; The Swedish University of Agricultural Sciences, Department of Forest Products: Uppsala, Sweden, 2008; Report No 8. [Google Scholar]
  18. Johansson, K.-E.V.; Elgström, O.; Kimanzu, N.; Nylund, J.-E.; Persson, R. Trends in development aid, negotiation process and NGO policy change. Voluntas 2010, 21, 371–392. [Google Scholar] [CrossRef]
  19. Vi Agroforestry. Annual Report; Larsson Offsettryck: Linköping, Sweden, 2012. [Google Scholar]
  20. Brulin, G.; Svensson, L. Managing Sustainable Development: A Learning Approach To Change; Gower Publishing Limited: Farnham, UK, 2012. [Google Scholar]
  21. Svensson, L.; Brulin, G.; Jansson, S.; Sjöberg, K. Capturing Effects of Projects and Programmes; Studentlitteratur: Lund, Sweden, 2013. [Google Scholar]
  22. Kiptot, E.P.; Hebinck, P.; Franzel, S.; Richards, P. Adopters, testers or pseudo-Adopters? Dynamics of the use of improved tree fallows by farmers in Western Kenya. Agric. Syst. 2007, 94, 509–519. [Google Scholar] [CrossRef]
  23. Montambault, J.R.; Alavalapati, J.R.R. Socioeconomic research in agroforestry: A decade in review. Agrofor. Syst. 2005, 65, 151–161. [Google Scholar] [CrossRef]
  24. Mercer, D.E. Adoption of agroforestry innovations in the tropics: A review. Agrofor. Syst. 2004, 63, 311–328. [Google Scholar] [CrossRef]
  25. Pattanayak, S.K.; Mercer, D.E.; Sills, E.; Yang, J.C. Taking stock of agroforestry adoption studies. Agrofor. Syst. 2003, 57, 173–186. [Google Scholar] [CrossRef]
  26. Ajayi, O.C.; Akinnifesi, F.K.; Seleshi, G.; Chakeredza, S. Adoption of renewable soil fertility replenishment technologies in the southern African region: Lessons learnt and the way forward. Nat. Resourc. For. 2007, 31, 306–317. [Google Scholar]
  27. Behre, R.T.; Martinez, J.; Verplanke, J. Adaptation and dissonance in quality of life: A case study in Mekelle, Ethiopia. Soc. Indic. Res. 2013. [Google Scholar] [CrossRef]
  28. Korten, D.C. Community organization and rural development: A learning process approach. Public Admin. Rev. 1980, 40, 480–511. [Google Scholar] [CrossRef]
  29. Kapfudzaruwa, F.; Sowman, M. Is there a role for traditional governance systems in South Africa’s new water management regime? Water SA 2009, 35, 683–692. [Google Scholar]
  30. Elbakidze, M.; Angelstam, P. Implementing sustainable forest management in Ukraine’s Carpathian Mountains: The role of traditional village systems. For. Ecol. Manag. 2007, 249, 28–38. [Google Scholar] [CrossRef]
  31. Woolcock, M.; Narayan, D. Social capital: Implications for development theory, research, and policy. W. Bank Res. Observ. 2000, 15, 225–249. [Google Scholar] [CrossRef]
  32. Axelsson, R.; Angelstam, P.; Degerman, E.; Teitelbaum, S.; Andersson, K.; Elbakidze, M.; Drotz, M.K. Social and cultural sustainability: Interpretation, indicators and variables for measurement and visualization to support planning. AMBIO 2013, XLII, 215–228. [Google Scholar]
  33. Viklund, K. ‘Vi-Skogen: Ett Grönt Biståndsprojekt’(The We Forest: A Green Aid Project). In Examensarbete vid Journalisthögskolan i Göteborg. Institutionen för Journalistik och Masskommunikation; (in Swedish). Göteborgs Universitet: Göteborg, Germany, 1992. [Google Scholar]
  34. The Planning Commission & Regional Commissioner’s Office. Mara Region Socioeconomic Profile; The United Nations Population Fund: Dar es Salaam, Tanzania, 1998. [Google Scholar]
  35. Swallow, B.M.; Sang, J.K.; Nyabenge, M.; Bundotich, D.K.; Anantha K. Duraiappah, A.K.; Yatich, T.B. Tradeoffs, synergies and traps among ecosystem services in the Lake Victoria basin of East Africa. Environ. Sci. Policy 2009, 12, 504–519. [Google Scholar] [CrossRef]
  36. Odada, E.O.; Olago, D.O.; Kulindwa, K.; Ntiba, M.; Wandiga, S. Mitigation of environmental problems in Lake Victoria, East Africa: Causal chain and policy options analyses. AMBIO 2004, 33, 13–23. [Google Scholar]
  37. Anon, Annual report for the FY 2000; Vi Agroforestry Project Mara, 2001.
  38. Törnqvist, A. Geografi, agroforestry och GIS i östra Afrika: Att analysera landskap med blivande geografilärare. Geografiska Notiser 2012, 70, 6–16. [Google Scholar]
  39. Diamond, J. Overview: Laboratory Experiments, Field Experiments, and Natural Experiments. In Community Ecology; Diamond, J.M., Case, T.J., Eds.; Harper & Row: New York, NY, USA, 1986; pp. 3–22. [Google Scholar]
  40. Sood, K.K.; Mitchell, P. Identifying important biophysical and social determinants of on-farm tree growing in subsistence-based traditional agroforestry systems. Agrofor. Syst. 2009, 75, 175–187. [Google Scholar] [CrossRef]
  41. Sanginga, P.C.; Chitsike, C.A.; Njuki, J.; Kaaria, S.; Kanzikwera, R. Enhanced learning from multi-stakeholder partnerships: Lessons from the enabling rural innovation in Africa programme. Nat. Resourc. For. 2007, 31, 273–285. [Google Scholar]
  42. Nemarundwe, N.; Richards, M. Participatory Methods for Exploring Livelihood Values Derived from Forests: Potential and Limitations. In Uncovering the Hidden Harvest: Valuation Methods for Woodland and Forest Resources; Campbell, B.M., Luckert, M.K., Eds.; Earthscan: London, UK, 2002; pp. 168–198. [Google Scholar]
  43. Shork, M.A.; Remington, R.R. Statistics with Applications to the Biological and Health Sciences; Prentice Hall Inc.: Englewood Cliffs, NJ, USA, 2000. [Google Scholar]
  44. Gujarati, D. Multicollinearity: What Happens if the Regressors are Correlated? In Basic Econometrics, 5th ed.; Gujarati, D.N., Porter, D.C., Eds.; McGraw Hill: Boston, MA, USA, 2009; pp. 363–363. [Google Scholar]
  45. Hair, J.F.; Anderson, R.E.; Tatham, R.L.; Black, W.C. Multivariate Data Analysis; Prentice Hall Inc.: Englewood Cliffs, NJ, USA, 1998. [Google Scholar]
  46. Mardia, K.V.; Kent, J.; Bibby, J.M. Multivariate Analysis; Academic Press: London, UK, 1982. [Google Scholar]
  47. Draper, N.R.; Smith, H. Applied Regression Analysis; Wiley: New York, NY, USA, 1966. [Google Scholar]
  48. Olsson, U. Statistics for Life Science 2; Studentlitteratur: Lund, Sweden, 2011. [Google Scholar]
  49. Akaike, H. An information criterion (AIC). Math. Sci. 1976, 14, 5–9. [Google Scholar]
  50. Roger, M.; Nunn, C. Stepwise model fitting and statistical inference: Turning noise into signal pollution. Am. Nat. 2009, 173, 119–123. [Google Scholar] [CrossRef]
  51. Ajayi, O.C.; Katanga, R. Improved fallows and local institutions. LEISA 2005, 21, 18–19. [Google Scholar]
  52. Ajayi, O.C.; Kwesiga, F. Implications of local policies and institutions on the adoption of improved fallows in eastern Zambia. Agrofor. Syst. 2003, 59, 327–336. [Google Scholar] [CrossRef]
  53. Place, F. The Role of Land and Tree Tenure on the Adoption of Agroforestry Technologies in Uganda, Burundi, Zambia, and Malawi: A Summary and Synthesis; Land Tenure Center, University of Wisconsin: Madison, WI, USA, 1995. [Google Scholar]
  54. Place, F.; Dewees, P. Policies and incentives for the adoption of improved fallow. Agrofor. Syst. 1999, 47, 323–343. [Google Scholar] [CrossRef]
  55. Pollini, J. Agroforestry and the search for alternatives to slash-and-burn cultivation: From technological optimism to a political economy of deforestation. Agric. Ecosyst. Environ. 2009, 133, 48–60. [Google Scholar] [CrossRef]
  56. Mercer, D.E.; Miller, R.P. Socioeconomic research in agroforestry: Progress, prospects, priorities. Agrofor. Syst. 1997, 38, 177–193. [Google Scholar] [CrossRef]
  57. Axelsson, R.; Angelstam, P.; Elbakidze, M.; Stryamets, N.; Johansson, K.-E. Sustainable development and sustainability: Landscape approach as a practical interpretation of principles and implementation concepts. J. Landsc. Ecol. 2011, 4, 5–30. [Google Scholar]
  58. Johansson, K.-E.; Axelsson, R.; Kimanzu, N.; Sassi, S.O.; Bwana, E.; Otsyina, R. The pattern and process of adoption and scaling up: Variation in project outcome reveals the importance of multilevel collaboration in agroforestry development. Sustainability 2013, 5, 5195–5224. [Google Scholar]

Appendix I. Description of independent variables.
Dimension/variableDescription of variableScaleType
i. Local governance
VEHhLevel of cooperation between VEA & households according to Project advisors & Zonal Managers; ordinal scalediscrete 1–5
1 = very poor,4 = good
2 = poor,5 = very good
3 = normal,
VEVLLevel of cooperation between VEA & village leadership to Project advisors & Zonal Managers; ordinal scalediscrete 1–5
1 = very poor,4 = good
2 = poor,5 = very good
3 = normal
VLHhLevel of cooperation between village leadership & households according to Project advisors & Zonal Managers; ordinal scalediscrete 1–5
1 = very Poor,4 = good
2 = poor,5 = very good
3 = normal,
CleThe village proportion of households’ scoring the cooperation between village leaders and project extension agent to be good out of three levels:
-
good
-
normal
-
poor
ratio scalecontinuous 0–1
ClhThe village proportion of households’ scoring the cooperation between village leaders and themselves to be good, out of three levels:
-
good
-
normal
-
poor
ratio scalecontinuous 0–1
ii. Local belief system
BhThe village proportion of households believing they own the trees they plant.ratio scalecontinuous 0–1
Be3The village proportion of households believing in the good effect of agroforestry ratio scalecontinuous 0–1
PsThe village proportion of households’ ranking of PLANTING SEEDLINGS according to instructions among the three least demanding tasks out of 6 normal agricultural/agroforestry-tasks
-
making crop ridges
-
making tied ridges
-
plant cassava
-
sow tree seed
-
sow maize
ratio scalecontinuous 0–1
SsThe village proportion of households’ ranking the task to SOW TREE SEED according to instructions among the three least demanding tasks out of 6 normal agricultural/AF-tasks:
-
making crop ridges
-
making tied ridges
-
plant cassava
-
planting tree seedling
-
sowing maize
ratio scalecontinuous 0–1
iii. Physical environment
LAKMean distance from village middle to the Lake shore in kmratiodiscrete 1–8
MDWMain source of domestic water:
  • 1 = Lake only
  • 0 = Other source
binarydiscrete 0 or 1
MSMain soil type of the village:
  • 1 = Mbuga (clay rich soil) only and/or some Luseni
  • 0 = Luseni (sandy soil) only and/or some Mbuga
binarydiscrete 0 or 1
iv. Subsistence system
MEAMain Economic activity of the village:
  • 1 = Agriculture only/agriculture mainly and some fishing
  • 0 = Fishing mainly and some agriculture or fishing only
binarydiscrete 0 or 1
MTMMain tilling method used in the village:
  • 1 = Ridging only or ridging mainly and some flat ox-ploughing
  • 0 = Flat ox-ploughing mainly and some ridging or flat ox-ploughing only
binarydiscrete 0 or 1
MCMain Crop type:
  • 1 = Cassava only
  • 0 = Cassava and some other crop, i.e., uCotton, Sorghum and/or Maize
binarydiscrete 0 or 1
v. Project
SEXGender of the project extension agent in the village:
  • 1 = female
  • 0 = male
binarydiscrete 0 or 1
VEISIn-service training; No of weeks of in-service training that the project extension agent has participated inratioscale discrete 3–8
VEMNo of months that the project extension agent has been employed by the projectratioscale approximatelycontinuous 3–75
VEHLLanguage of the project extension agent in relation to the main language in her/his village:
  • 1 = the same language
  • 0 = not the same language
binary discrete 1 or 0
VELEDuration/level of education of the project extension agent:
  • 1 = 3 yrs certificate, 2 years diploma or 3–4 yrs BSc
  • 0 = Work experience and no education or up to 2 yrs certificate education
binarydiscrete 0 or 1
VEDEEducation discipline of the project extension agent:
  • 1 = Education related to agriculture, livestock prod, forestry, and/or land-use
  • 0 = Community development, veterinary/animal health and/ or education/teacher
binarydiscrete 0 or 1
KefThe village proportion of households’ ranking the project extension agent as number one in agroforestry knowledge among seven other key actors in the village;
-
agricultural extension agent
-
village executive officer
-
village chairman
-
Hh interviewee (ideally household head)
-
wife or husband of interviewee/household head
-
son in the household
-
daughter in the household
ratio scaleContinuous 0–1
DefThe village proportion of households’ ranking the project extension agent as number one in devotion to agroforestry among five other key actors in the village;
-
agricultural extension agent
-
village executive officer
-
village chairman
-
sub-village leader
-
active agroforestry farmer
ratio scaleContinuous 0–1
TwsTotal number of field training workshops that the sample-households claim participation in divided by number of sample households (n = 21) ratio scaleContinuous 0–3
TtuTotal number of farmer to farmer tours that the sample-households claim participation in divided by the number of sample households (n = 21)ratio scaleContinuous 0–1
VIMNo of months that the project have been active in a villageRatio scaleapproximately
continues 1–65

