Article

Sticks and Stones: The Impact of the Definitions of Brownfield in Policies on Socio-Economic Sustainability

School of Geography, Sir Clive Granger Building, University of Nottingham, University Park, NG7 2RD, UK
*
Author to whom correspondence should be addressed.
Sustainability 2012, 4(5), 840-862; https://doi.org/10.3390/su4050840
Submission received: 15 February 2012 / Revised: 19 April 2012 / Accepted: 24 April 2012 / Published: 3 May 2012
(This article belongs to the Special Issue Urban Regeneration and Sustainability)

Abstract

:
Many countries encourage brownfield regeneration as a means of sustainable development but define “brownfield” differently. Specifically, the definitions of brownfield in the regeneration policies of countries with higher population densities usually promote recycling land that is previously developed, whether or not there is chemical contamination. Further, the de facto definition of brownfield used by the UK government focuses on previously developed land that is unused or underused. The ANOVA in this study revealed that local authorities in England (n = 296) with higher percentages of derelict and vacant land tended to be more deprived based on the English Indices of Multiple Deprivation, which evaluate deprivation from the aspects of income, employment, health, education, housing, crime, and living environment. However, the percentage of previously developed land in use but with further development potential had no significant effect on the deprivation conditions. The Blair-Brown Government (1997~2010) encouraged more than 60% of new dwellings to be established on the previously developed land in England. The analyses in this study showed that this target, combined with the definition of brownfield in the policy, may have facilitated higher densities of residential development on previously developed land but without addressing the deprivation problems. These observations indicate that a definition of brownfield in regeneration policies should focus on previously developed land that is now vacant or derelict if land recycling is to contribute to sustainable communities.

1. Introduction

“Sticks and stones may break my bones, but words will never hurt me.” This article, however, contradicts this rhyme by giving an example of the unintended consequence resulting from the definition of brownfield in the regeneration policy. Words can be as powerful as sticks and stones.
Brownfield land appears during the processes of deindustrialisation and suburbanisation. Regenerating brownfield is a recommended recipe to improve social, economic and environmental sustainability [1,2,3,4,5]. However, brownfield regeneration has been implemented based on regulations which define brownfield differently [3,7,8,9,10]. In particular, “brownfield” in UK regulations covers unused and underused land that is previously developed [3,7,10,11].
We are interested in the effects of different types of brownfield land on local socio-economic conditions and greenfield development in highly urbanised regions and countries such as England. This may have implication on the diverse definitions of brownfield in regeneration policies.
The paper begins with a review of the origin of brownfield land, the strategies to regenerate brownfield land, the effects of urbanisation and regional variations on brownfield land, and the controversies with brownfield redevelopment. The review is followed by the descriptions of the databases and statistical methods used in the study. Results and discussions are then presented in support of a recommended brownfield definition for countries and regions with high population densities.

1.1. The Origins of Brownfield Land

Derelict or contaminated land that appears during deindustrialisation and suburbanisation is commonly understood as brownfield land [7]. During deindustrialisation, the out-migration of industrial sectors leaves some potentially contaminated empty land to local communities. The service sectors that replace the industry usually require less land on which to operate. Thus, the transition generates derelict and potentially contaminated land. On the other hand, during the process of suburbanisation, affluent people move from city centres to the fringes of urban areas for a better quality of life [12,13]. As a result, many properties in city centres become depreciated and derelict.
The phenomena progress concurrently with many negative socio-economic effects on the neighbourhood areas. Besides the potential untreated contamination and unemployment resulting from the removal of an industry, the derelict properties attract crimes and become eye-souring spots [6,14,15,16,17,18,19]; these reduce the value of the properties in the area, and the incentive of investors to redevelop the area. Consequently, the deteriorated quality of life creates further out-migration and more dereliction. Furthermore, as growing populations agglomerate towards urban areas, the ineffective reuse of brownfield land implies unnecessary new developments are being established on greenfield land at urban fringes. Overall, the existence of brownfield worsens socio-economic deprivation as well as environmental degradations.
Countries experiencing deindustrialisation and suburbanisation have used legislation to encourage the reuse of brownfield land. By doing so, governments intended to facilitate brownfield recycling to restore the prosperity to communities, and to protect human and environmental health (for example, the statements by DETR [1], and the Small Business Liability Relief and Brownfields Revitalization Act implemented in the U.S. in 2001) [2].

1.2. Strategies Towards Brownfield Regeneration

Two types of strategies have been applied to encourage brownfield regeneration. One is to directly accelerate brownfield recycling. For example, in the UK, up until the coalition government came to power (2010–to the present), the housing policy was promoting more than 60% of new dwellings to be established on previously developed land (PDL, i.e., brownfield land as defined by the Department for Communities and Local Governments (CLG)) in England [1]. Another strategy is to facilitate cleaning up contamination on brownfield sites in the hope that after eliminating contamination, the properties will become attractive for redevelopment [20]. A representative example for this type of strategy is the Small Business Liability Relief and Brownfields Revitalization Act implemented in the U.S. in 2001 [2].
The definitions of brownfield in the legislation can reflect the approaches utilised by countries. European countries with higher population densities promote the efficiency of land recycling, while countries with lower population densities concentrate on clean-up [8]. Western European countries tend to consider brownfield land as previously developed but now derelict areas, but Scandinavia countries, North America countries and other countries with low population densities such as New Zealand consider brownfield land as contaminated land, particularly land affected by previous industrial activities [2,8,22,23]. For the latter countries, although socio-economic sustainability concerns the brownfield regeneration policymakers, the presence of contamination is the prerequisite of applying for the funding of brownfield regeneration.
Furthermore, among countries with high population densities, the definitions of brownfield cover different spectra of previously developed land [8]. Particularly, in legislation implemented in England, brownfield land initially only included previously developed but currently vacant land [10]; the brownfield in the legislation now also includes currently used land with further development potential [23]. The thought behind this change is to ease the shortage of affordable housing by building more residential units on a wider range of PDL under the “brownfield first” criterion [1,9]. This policy may have contributed to the increased density of development on PDL in England in recent years [24,25]. However, it is debatable whether greenfield development has been reduced [9]. The policy may also be responsible for increasing land prices in some of the most deprived areas of England [26]. It is disputable, however, whether the higher prices reflect an improved local economy [26], or a worsened situation of a lack of affordable housing [27].

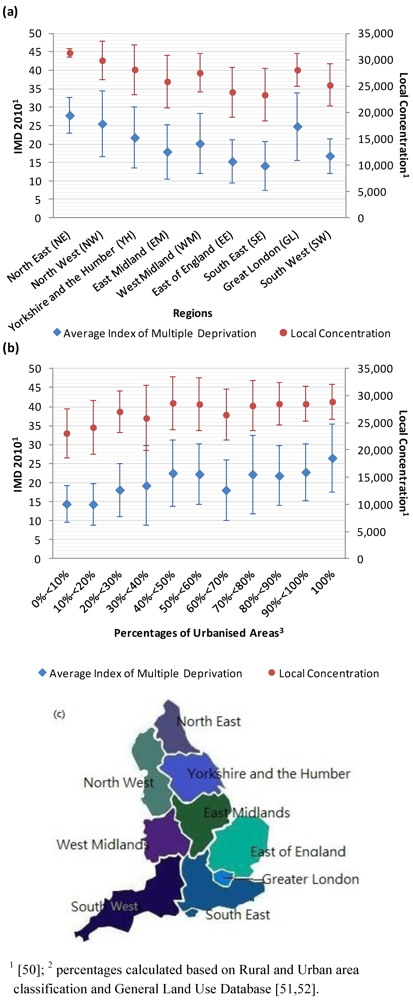
1.3. The Effects of Regional Differences and Urbanisation on Brownfield Land and Socio-Economic Conditions

Recently, many studies and policies have promoted the idea that brownfield land is an opportunity for urban renewal rather than a risk to communities [28,29,30,31,32]. The potential increase in economic return by redeveloping derelict or vacant properties provides substantial “opportunity pulls” for regeneration [30,33]. Within a fully developed urban system, an empty space can be a convenience for planners to update infrastructure without completely obstructing the functions of an urban system [29]. However, in less urbanised areas, this might not be relevant because greenfield development is likely to be cheaper and easier [34,35,36,37,38]. Therefore, the degree of urbanisation may affect the effectiveness of brownfield regeneration projects.
Urban living has advantages such as quick access to local facilities, convenient public transportation, better access to employment opportunities, and higher possibilities for social interactions [37]. A higher proportion of people living in urban areas could mean less greenfield development, more efficient delivery of energy and water, and more effective use of public facilities. These lead to greater public savings and a better chance to conserve nature, which can contribute to sustainable development. However, many affluent people prefer to live in rural areas for better air quality and access to green spaces [35,36,37,38]. Depending on the preferences for urban or country living, the degree of urbanisation could affect the potential and popularity of brownfield redevelopment.
Based on the profit return after redevelopment, the CABERNET A-B-C model considers three types of the brownfield land: A sites, the brownfields where redevelopment can be driven by free market mechanism; B sites, the marginal profitable brownfields requiring public and private input to facilitate regeneration; C sites, brownfield that is not profitable and required public fund for redevelopment [29]. Unused PDL, particularly land that has been derelict for a long time, is likely to be a B or C site.
In England, the northern regions have larger proportions of unused PDL, so the regions need more public supports to make regeneration happen. By contrast, business and financial sectors have been clustered in southern regions in recent years [39,40]; the land prices are higher in the south [41]. Therefore, PDL in the south is more likely to be underused than unused [42], to be A sites than B sites or C sites. The areas have higher chance to be redeveloped by private sectors. This demonstrates that differences in socio-economic characteristics and land resources also affect the brownfield recycling.
Further, the northern regions or the highly urbanised areas of England are more likely to have worse deprivation conditions [43]. These areas should be the focus of policy for regeneration given the objective of brownfield regeneration is to rebuild socio-economically sustainable communities.

1.4. The Controversy of Brownfield Redevelopment

Although the brownfield land coexists with unsustainable conditions such as higher unemployment, worsen living conditions and more criminal offences, it is arguable that a reduction in brownfield land will necessarily restore sustainable conditions [9,27]. For example, redevelopment in the form of gentrification makes physical improvement to a neighbourhood, but the replacement of deprived residents only moves socio-economic issues elsewhere without solving them [27,44]. A case study verified this by showing that the physical makeover of derelict properties removed criminal offence from the neighbourhoods. The overall criminal offence rate, however, remained the same at the local authority level [14]. On the other hand, there are also successful brownfield regeneration cases that revitalised deprived areas [32,45,46]. The mixed conclusion with brownfield redevelopment could result from the different types of brownfield redeveloped, the processes of redevelopment, and the perspectives of different stakeholders. This study focuses on the effects of the types of brownfield developed according to the definition in the policy. The results of the previous case studies cannot necessarily be extrapolated to regional or national scales, at which policy and legislations are made and implemented. Since this study is interested in the effect of regulatory policy at regional and national level, the analysis on the dataset at national level may be required.
The study took advantage of the accessibility of the land use data and indices of deprivation in England to analyse the questions of interest. This study statistically analysed land use data from local authorities in England to investigate which types of brownfield land are most relevant to socio-economic deprivation and greenfield protection. Deprivation is considered a signal of unsustainable socio-economic conditions, while greenfield preservation is considered to be an indicator of improving environmental sustainability. Based on the results derived from analyses of variance (ANOVA), t-test and the comparison of greenfield and brownfield development in England, the paper discusses the possible effects of the types of PDL on socio-economic deprivation and greenfield preservation. The paper concludes with the suggestion that for countries or regions with high population densities, to further encourage sustainable development, the definition of brownfield in the regeneration policies should exclude the underused land or land that is profitable for redevelopment without regulatory intervention (A site). Furthermore, the redevelopment targets should be allocated based on the concept of mixed use to accommodate the regional differences as well as the degrees of urbanisation.

2. Data and Statistical Analyses

2.1. National Land Use Database of Previously Developed Land (NLUD-PDL)

PDL data reported in 2004 at local authority level were obtained from the National Land Use Database of Previous Developed Land (NLUD-PDL) [47]. The data in 2004 are considered the earliest completed dataset of PDL; 354 of 355 the local authorities in England reported the situation of PDL at least once. The most updated Indices of Multiple Deprivation (IMD), the IMD 2010, was calculated based on data between 2006 and 2008 [48]. To examine the effect of the PDL on deprivation, the PDL records before 2006 are more suitable.
The NLUD-PDL classifies PDL into six types [47,49];
  • (A) Previously developed land which is now vacant;
  • (B) Vacant buildings;
  • (C) Derelict land and buildings;
  • (D) Land or buildings currently in use and allocated in the local plan and/or having planning permission;
  • (E) Land or buildings currently in use where it is known there is potential for redevelopment; and
  • (F) Previously developed land or buildings that have been developed or where construction has started.
This classification excludes the agriculture, forestry, mining, landfill, recreation grounds and the land that has “blended into the landscape” [49]. The presence of contamination is not a requirement to be considered as brownfield [49].
The five classes (Class A to Class E) of PDL were grouped into three types in this study depending on the level of abandonment (Table 1). Derelict PDL refers to Class C PDL in the NLUD-PDL. Vacant PDL includes Class A PDL and B PDL; they became vacant for less than one year. Derelict PDL and vacant PDL were both considered unused PDL. Underused PDL is the PDL that is currently in use but have not reached its optimised capacity (Class D and E). Total PDL encompasses all three types. Class F PDL was not included in the analysis since redevelopment has already commenced on the land, and the estimation of the areas has not been published.
Table 1. Grouping of the PDL in the NLUD-PDL in this study.
NLUD-PDL Category 1Previously Developed
Unused LandUnderused Land
Derelict 2 LandVacant 3 Land
A
B
C
D
E
1[47,49]; 2 Refers to the land that has not been used for more than a year; 3 Refers to the land and properties that have not been used for up to a year.
The areas of PDL were converted to the percentages of the administrative areas of local authorities, obtained from the 2005 General Land Use Database (GLUD) [50].

2.2. Indices of Multiple Deprivation (IMD) 2010

The IMD published by the CLG describes deprivation in England from the aspects of income, employment, health, education, housing, crime and living environment [43,49]. It represents a situation of “a lack of resources of all kinds, not just financial” [49, p.8]. The degree of deprivation is primarily estimated based on the percentages of the population exhibiting one or more deprivation characteristics in a local authority or at a lower tier of super output areas (LSOA) (Table 2), a geographic unit that encompass 1000 to 3000 people. Additional parameters in the indices describe the poor accessibility to infrastructure. These parameters cover major conditions that co-exist with brownfield sites. For example, unemployment, like brownfield land, could be an immediate result of deindustrialisation. Other conditions such as poor performance in education could be the long-term or indirect effects of a brownfield site.
Table 2. The Domains and Weights in the Indices of Multiple Deprivation 2010 1.
Deprivation DomainSub-domainsWeight in the IndicesComponents in the Domains
Income -22.50%Income Support Households, Job Seekers Allowance Households, Pension Credit (Guarantee) Households, Working Tax Credit Households, Child Tax Credit Households, National Asylum Support Service (NASS) Supported Asylum Seekers
Employment -22.50%Recipients of Jobseekers Allowance, Participants in the New Deal, Incapacity Benefit Recipients, Severe Disablement Allowance Recipients
Health and Disability -13.50%Years of Potential Life Lost, Comparative Illness and Disability Ratio, Measures of Acute Morbidity, The Proportion of Adults under 60 Suffering from Mood or Anxiety Disorders
Education, Skills and Training Children 6.75%Average Test Score of Pupils at Key Stage 2 and Stage 3, Best of 8 Average Capped Point Score at Key Stage 4, Proportion of Young People not Staying on in School or Non-Advanced Education, Secondary School Absence Rate, Proportion of those Aged under 21 Not Entering Higher Education
Skills 6.75%Proportion of Working Age Adults with No or Low Qualifications
Barriers to Housing and Services Wider barriers 4.65%Household Overcrowding, District Level Rate of Acceptances under the Homelessness Provisions, Difficulty of Access to Owner-Occupation
Geographical barriers 4.65%Road Distances to a GP Surgery, a General Store or Supermarket a Primary School a Post Office or Sub Post Office
Crime-9.30%Burglary, Theft, Criminal Damage, Violence
Living Environment “Indoors” living environment 6.20%Social and Private Housing in Poor Condition, Houses without Central Heating
“Outdoors” living environment 3.10%Air Quality, Road Traffic Accidents Involving Injury to Pedestrians and Cyclists
1[50].
Two variables, average IMD scores and local concentrations, in the IMD 2010 report were utilised in the analysis. Local concentration is the “population weighted average of the ranks of a district’s most deprived LSOAs that contain exactly 10% of the district’s population” [49, p.55]. The district here refers to the local authorities. This variable represents the degree of deprivation in the most deprived spots in a local authority. The average IMD scores reflect a general condition throughout a local authority. The effects (or the lack of effects) of brownfield land on these two variables can indicate whether the effects of brownfield land are restricted to its vicinity (presumable deprivation hot spots) or beyond.

2.3. The Estimation of Urbanisation

The degree of urbanisation is represented by the percentage of urban areas to the total administrative area of a local authority. The urban areas were estimated by the areas of LSOA designated in the Rural and Urban Area Classification as “urban” [51]. The GLUD records the area size of each LSOA in England [50]. Based on the percentages of urbanised areas, local authorities were sorted into 11 groups for further statistical analyses: 0%~<10%, 10%~<20%, 20%~<30%, 30%~<40%, 40%~<50%, 50%~<60%, 60%~<70%, 70%~<80%, 80%~<90%, 90%~<100%, and 100%.

2.4. The Determination of Regions

To investigate the influence of regional conditions on the relationship between IMD and PDL in the ANOVA, the authorities were coded based on the nine regions of England (the North West, the North East, the Yorkshire and the Humber, the West Midlands, the East Midlands, the South West, the Greater London, the East of England, and the South East).

2.5. The Development of PDL and Non-PDL

Additional statistics relevant to land use were obtained from Live Tables of Land Use Change Statistics published by the CLG published in July 2011 [25]. The tables describe areas being developed each year in England, the nature of the areas (non-PDL or PDL), the percentages of new dwellings established on the PDL during four periods: 1995~1998, 1999~2002, 2003~2006 and 2007~2010, and the nature of the PDL (vacant, derelict or in use).

2.6. ANOVA Analysis

To analyse the relationship between socio-economic deprivation and areas of brownfield land, the significance of statistical differences (p < 0.05) among groups was evaluated by a multivariate ANOVA followed by a lack-of-fit test. In the analysis, the log-transformed percentages of PDL in local authorities in 2004 were the independent variable and deprivation conditions reported in 2010 (average IMD scores or local concentrations) were the dependent variables. For each ANOVA, the influences of a specific type of PDL (Section 2.1), the degree of the urbanisation of local authorities (Section 2.3), and the regional identity of local authorities (Section 2.4) on one of the two deprivation variables (Section 2.2) were evaluated. The procedure was repeated to analyse the effects of different types of PDL on the two deprivation variables.
Due to changes in the boundaries of some local authorities, a number of local authorities were eliminated from the ANOVA because the areas where PDL data in 2004 and deprivation data in 2010 were obtained do not match.

2.7. Independent-Sample t-Tests

To evaluate the effects of dwelling densities on socio-economic deprivation, local authorities in England were sorted into two groups: one with less than 60% of residential dwellings established on PDL each year, and another with equal or more than 60% established on PDL each year. The average IMD 2010 scores and the local concentrations of the two groups were subjected to a 2-tailed independent-sample t-test at the significance level of 0.05, assuming unequal variance between the two groups.
The sorting of local authorities was based on records in Table P213 Land Use Change: Proportion of new dwellings on PDL, by local authority, 1995–1998 to 2007–2010 [25]. The table provides percentages of dwellings from four periods: 1995~1998, 1999~2002, 2003~2006, and 2007~2010 [25]. The t-test was repeated based on records in each of these four periods.

3. Results

3.1. The Effects of PDL on Socio-Economic Deprivation Scores

During the phase of data exploration, the scatter plots of the percentages of different types of PDL and IMD 2010 scores or local concentration scores revealed the patterns that higher percentages of PDL, vacant or derelict land in 2004 collocated with higher IMD 2010 scores and local concentration. However, some local authorities with lower percentages of PDL also had equally severe deprivation conditions. Since the relationships between different types of PDL and the deprivation scores are not linear, using linear regression technique as an analytical tool is not appropriate. ANOVA may be more suitable to examine the relationship.
On the other hand, the average IMD 2010 scores and local concentration scores of local authorities decreased from the north towards the south in England with the exception of the Greater London region (Figure 1a). The average deprivation scores and severity of deprivation hot spots seemed to increase in the local authorities with higher degree of urbanisation (Figure 1b). These verified that urbanisation and regional differences could affect the degree of deprivation. Therefore, the factors are included into the ANOVA.
The results of ANOVA showed that, after the potential effects of regions and urbanisation were accounted for, differences in the IMD 2010 scores (F(1,295) = 16.90, p < 0.001) or local concentration scores (F(1,295) = 22.32, p < 0.001) were significant among authorities with different percentages of total PDLs (Table 3). However, the percentages of underused land had no effect on the IMD 2010 scores (F(1,295) = 1.78, p = 0.183) and local concentration scores (F(1,295) = 2.208, p = 0.138). It is the percentage of unused land had significant effect on IMD 2010 (F(1,295) = 22.92, p < 0.001) and local concentration scores (F(1,295) = 22,37).
Figure 1. The descriptive statistics of average deprivation scores and severity of deprivation hot spots (local concentrations) in 2010 among the local authorities of England; error bars indicate the standard deviations of the distributions: (a) The summary of average deprivation scores and local concentration scores based on regions; (b) the summary of average deprivation scores and local concentration scores based on the degree of urbanisation; (c) the nine regions of England.
Sustainability 04 00840 g001
Furthermore, the percentages of the land vacant for less than one year (F(1,295) = 24.77, p < 0.001), and the land derelict for longer than one year (F(1,295) = 17.37, p < 0.001) in 2004 had significant effects on the IMD 2010 scores (Table 3). Likewise, both derelict land (F(1,295) = 19.34, p < 0.001) and vacant land (F(1,295) = 17.27, p < 0.001) have significant effects on the severity of deprivation hot spot. Additionally, the trends of deprivation conditions (both IMD scores and local concentrations) based on regional differences and degree of urbanisation observed in Figure 1 are statistically significant. The only exception is the effect of urbanisation is statistically insignificant on local concentration when the factors of regions and total PDL are considered. However, the conditions of deprivations are still significantly different if considering regions and unused PDL.
Table 3. Statistical Significance of the Effects of Previously Developed Land (PDL), Degree of Urbanisation and Regions on Deprivation.
Independent Variables and Co-variantsDependent Variables
IMD AverageLocal Concentration
RegionUrbanisationPDLRegionUrbanisationPDL
Effect of Independent Variables on Dependent VariablesTotal PDL++++ (F(8,295) = 12.47)++++ (F(10,295) = 4.04)++++ (F(1,295) = 16.90)++++ (F(8,295) = 10.74)-++++ (F(1,295) = 22.32)
Total PDLUnderused++++ (F(8,295) = 14.25)++++ (F(10,295) = 7.97)-++++ (F(8,295) = 12.58)++++ (F(10,295) = 6.16)-
Unused++++ (F(8,295) = 9.66)++++ (F(10,295) = 9.29)++++ (F(1,295) = 22.92)++++ (F(8,295) = 8.19)++++ (F(10,295) = 7.09)++++ (F(1,295) = 22.37)
Unused LandVacant (less than a year)++++ (F(8,295) = 10.20)++++ (F(10,295) = 9.24)++++ (F(1,295) = 24.77)++++ (F(8,295) = 9.05)++++ (F(10,295) = 7.24)++++ (F(1,295) = 19.34)
Derelict (more than a year)++++ (F(8,295) = 9.36)++++ (F(10,295) = 11.52)++++ (F(1,295) = 17.37)++++ (F(8,295) = 7.60)++++ (F(10,295) = 9.07)++++ (F(1,295) = 17.27)
++++: p < 0.001; +++: p < 0.005; ++: p < 0.01; +: p < 0.05; -: no statistical significance.

3.2. Amount of PDL and Land Needed for Redevelopment

Figure 2a compares the amounts of different types of PDL and the amount of land developed each year in England. Between 2001 and 2007, the amount of PDL in England exceeded several times the land developed annually (Figure 2b). The redeveloped PDL, however, only occupied about 60% of land developed (Figure 2b). Furthermore, the vacant land and derelict land by themselves are at least two times of land developed (Figure 2b). However, the vacant and derelict land developed each year only covered lower than 15% of the total land developed. The majority of the PDL redeveloped was underused land. Interestingly, although the amount of total PDL and derelict and vacant land decreased steadily, the underused land has been gradually increasing (Figure 2a). Moreover, ratios of all types of PDL to the land developed each year are increasing with some fluctuation (Figure 2b), due to the lower amount of land developed in the later years of millennium.
Figure 2. Comparisons of land developed annually and previously developed land (PDL) available for redevelopment [25] (a) in hectares; (b) in percentages of the developed land each year.
Sustainability 04 00840 g002
At the regional level, the patterns were similar to the chronological results for all of England (Figure 3): the amounts of total PDL in all regions exceeded several times the average amounts of land developed. No more than 70% of development took place on PDL except for the Greater London region (89%, represented by the purple bars in Figure 3b). Furthermore, in all regions except London (28%), only less than 18% of the land developed annually was derelict and vacant land (Figure 3b). The majority of redevelopment took place on underused land, increasing the development densities at those sites, while less attention was paid to redeveloping the vacant and derelict land.
Figure 3. Comparisons of land developed and previously developed land (PDL) available for redevelopment at the regional level between 2002 and 2005 [25].
Sustainability 04 00840 g003
The chronological trend of underused and unused land in Figure 2 was further analysed at the regional level. Between 2001 and 2007, in most regions, the derelict and vacant land decreased (Figure 4a). On the other hand, we saw a higher degree of increase of underused land in northern regions (North East, North West and Yorkshire and Humber); no clear trends were observed in the midlands and southern regions (Figure 4b).
Figure 4. Changes in Unused Previously Developed Land (PDL), Underused PDL and Total PDL at the Regional Level between 2001 and 2007. (a) Changes in Unused Land; (b) Changes in Underused Land.
Sustainability 04 00840 g004

3.3. The Effect of the Density of Residential Development on PDL on the Conditions of Deprivation

The Blair-Brown Government’s redevelopment target aimed for “60% of new housing in England on previously developed sites by 2008” [1, p.65] (hereafter referred as the 60% target). In practice, this means more than 60% of residential dwellings have to be built on PDL. By 2003, more than 60% of dwellings had been established in England annually (based on the Table P213 Land Use Change: Proportion of new dwellings on previously developed land, by local authority, 1995–1998 to 2007–2010 in Live Tables of Land Use Change Statistics) [25]. During this time, the numbers of local authorities achieving the 60% target consistently increased (Figure 5).
Figure 5. Comparisons of deprivation conditions based on the percentages of dwellings on previously developed land (PDL). Error bars indicate the standard errors of the means. (a) the comparisons of average IMD 2010 scores; (b) the comparisons of local concentration scores in 2010.
Sustainability 04 00840 g005
However, on average, local authorities in England which exceeded the 60% target during each of the four periods (1995~1998, 1999~2002, 2003~2006, and 2007~2010) had worse IMD scores in 2010. An independent-sample t-test showed that these local authorities had significantly higher average IMD 2010 scores (with respective means of 21.28, 20.54, 19.86, and 19.85 for the four periods) than the local authorities who did not achieve the target (with respective means of 17.67, 17.65, 17.42, 16.76 for the four periods) (Figure 5a). Similar results were obtained from the t-test of the severity of deprivation hot spots (local concentrations) except for the period of 2003–2006 (Figure 5b). The results showed that higher dwelling densities on PDL improved deprivation conditions in neither the long term nor the short term.

4. Discussions

This study showed that the percentages of unused land in local authorities positively correlated with the socio-economic deprivation conditions (Table 3), while the amount of underused land had no clear correlation with socio-economic deprivation. Although the significance of correlation does not necessarily indicate causation, the insignificant correlation made a strong argument that the amount of underused land does not cause deprivation. Therefore, the underused land should not be included in the definition of brownfield and the target of redevelopment.
Further, the study also demonstrated that the redevelopment was more than likely to take place on underused PDL in all regions of England, if not greenfield in terms of areas (Figure 2 and Figure 3). On the other hand, the increased density of residential dwellings on PDL 60% and beyond has not significantly reduced socio-economic deprivation at local authority level (Figure 5). These indicate the definition of brownfield in the policy should at least exclude the underused land if the target is to improve sustainability at local authority level. The 60% target set to improve sustainability in the policies of the Westminster government also warrants reconsideration. .

4.1. The Effects of Regions, Urbanisation and PDL on Socio-Economic Deprivation

The deprivation condition significantly worsened from the south towards the north in England with exception of the Greater London Region (Figure 1, and Table 3). Apart from the particular regional socio-economic and local political histories, regional differences in the attitudes of reusing PDL may also have played a part in affecting the deprivation conditions. Opportunities exist for integrating regional planning and brownfield regeneration to alleviate socio-economic deprivation and to create sustainable communities.
This study showed that unused land is more likely to associate with deprivation conditions at local authority level as well as LSOA level (Table 3). However, the definition of brownfield to date and the policy target set by the Blair-Brown Government did not differentiate underused and unused land. The policy made cities in England more compact without significantly improving deprivation conditions (Figure 5). This may be because proportionally more underused land is available in the south, while more vacant and derelict land is in the north [42]. The policy, as shown in this study, encouraged a higher density of dwelling to be established on underused land which did not help solve the problems of deprivation in the north.
Similarly, the definition might have made some LSOAs more compact and expensive. At the same time, it enhanced the deterioration of some once heavily industrialised areas. Therefore, the severity of deprivation hot spots remained high in the local authorities which have higher dwelling densities on PDL (Figure 5b).
Furthermore, since the local authorities in the Greater London region have mostly underused land while those in the northern regions at similar deprivation levels have mostly vacant and derelict land [42], the approach to regenerate Greater London region should be quite different from that in northern regions despite similar degrees of deprivation.
The Greater London region has attracted more population during deindustrialisation on the contrary to the metropolitans in the north. Under the pressure of growing population, the metropolitan area has unavoidably become more compact [24,52]. Because of this, renewing public infrastructure is equally important to providing housing. The target for housing on PDL was set to be 100% in the Greater London Region, much higher than the 60% target in England [8]. This might partially help to ease the housing demand but did not encourage updating public infrastructure.
On the other hand, the average dwelling densities have decreased in the north [24]. This may reflect in the increasing amount of underused land in the northern regions, while the amount of unused land fell (Figure 4a and 4b). This hypothesis requires further spatial analyses of the locations of the PDL to confirm. However, given the reduced dwelling densities, the pressure of population growth appears not to be the major issue of brownfield regeneration in the northern regions. Therefore, the way of regeneration does not necessarily involve more buildings for residential use. This renders the redevelopment target of dwellings on PDL less meaningful for the regeneration.
Under this circumstance, a more community-oriented approach can be taken specifically for the communities surrounding the vacant and derelict land. The soft-end use of derelict and vacant land may be a more suitable plan to improve quality of life for current residents as well as contribute to the improvement of the environmental qualities (such as air quality) benefiting wider areas. This type of regeneration project aiming for creating open space and green infrastructure has been promoted by the Land Trust (previously Land Restoration Trust) for years in England. However, such efforts are not covered in the 60% target.
The local authorities with higher degrees of urbanisation had significantly worse average IMD scores and the severity of deprivation hot spots (local concentrations) (Figure 1b). This partly explains the reason that the Greater London region was an exception to the regional trend of deprivation (Figure 1a). Most of the local authorities in the region are highly urbanised. The positive correlation between the degree of deprivation and urbanisation implies that the effort of brownfield regeneration, aiming to create socio-economically sustainable communities, should focus on the unused land in highly urbanised areas. This can be addressed by a definition of brownfield focusing on derelict and vacant land, and by customising the targets of recycling depending on the regions and the degree of urbanisation.

4.2. PDL Definition in the Policy Should Prevent Further Benefitting “Cherry Picking”

The results of this study showed that achieving the 60% target has not reverse the trend of socio-economic deprivation (Figure 5). Furthermore, despite more residential dwellings being established on PDL, greenfield development has not been prevented and a significant amount of PDL remains un-redeveloped (Figure 2). Therefore, the policy of the central government promoting brownfield regeneration by encouraging more dwellings being established on PDL, in combination with the definition of the brownfield land, neither solves the socio-economic unsustainable conditions nor prevents greenfield development, the ultimate objectives of the policy.
Wong and Schulze-Bäing indicated that brownfield land redeveloped for housing purposes increased most rapidly in the most deprived areas in England between 2001 and 2008 [26]. They noted that in these neighbourhoods, the developer “cherry-picked areas with stronger gentrification potential and the highest profit yield in the earlier period” [26, p.16]. Deprived neighbourhoods where incomers were from similar or much more deprived areas were overlooked. Brownfield redevelopment has caused gentrification without actually improving the overall socio-economic sustainability of a region [27].
The inclusion of the underused land in the target might be the result of government’s intentions to accelerate the building of new houses in these areas to ease the shortage of housing. Giving underused land a brownfield status would mean the redevelopment can pass the “brownfield first” test during the application of planning permission, reducing the controversy of infill development. However, as the developers tend to pick the areas with better short term profit return, the inclusion of underused land may provide justification to develop some relatively expensive areas without providing affordable houses to the general public.
Based on this observation, a more specific definition of brownfield in regeneration policy is needed to motivate the private sectors to venture into regenerating areas that may see lower financial returns. At a minimum, a definition covering specific types of land associated with socio-economic deprivation may reduce the chances that the private sectors take advantages of their development projects being prioritised without contributing to sustainability of the communities. Our study showed that the types of land are more likely to be derelict and vacant land, but not underused land. Besides, the land that has been derelict for years is more likely to be a B site or a C site in the CABERNET model introduced earlier. These are the sites that cannot be recycled through free market dynamics and should be addressed by policy instruments [29].
Furthermore, since developers are easily attracted to the opportunities of redeveloping A sites, and redeveloping C sites may be far from cost-effective, it may be mutually beneficial for the stakeholders (public or private) to focus on regenerating B sites. This position has been endorsed by the World Bank and Joint European Support for Sustainable Investment in City Areas (JESSICA) [38,53], the two institutes aiming to invest in sustainable development.
The World Bank is interested in B-sites sites for “other advantages that could justify incentives to attract private investment” [38, p.3]. For JESSICA, the marginal profit generated from redeveloping a B site may be just enough to attract private investment without enabling “returns above a fair market rate to be earned because of EU regulations on State aid” [54, p.22]. This can be considered one example of using regulatory power to encourage redevelopment of vacant or derelict land that is borderline profitable. The definition of brownfield in the regeneration policy purposely targeting B sites can channel resources in more cost-effective directions towards sustainable development, and prevent further decline of the neighbourhoods. The brownfield definition in the policy further includes the C sites can encourage revitalising the already deprived communities. However, this also means higher public expenditure on redevelopment.

4.3. The Regeneration Policy Should Target the Issues Relevant to Deprivation.

Wong and Schulze-Bäing showed that residential brownfield reuse improved the income and employment conditions in the most deprived neighbourhoods in England [26]. However, it is not clear whether this reflects the results of the replacement or the improved socio-economic conditions of original residences. Besides, using the economic deprivation indices only measuring income and employment overlooks other social domains that contribute to deprivation [43,51]. They also argued that the higher than average increase in house prices in those areas was a positive effect of brownfield regeneration [26]. Unfortunately, the highest increase in house prices was observed in the areas where incomers had moved from much more deprived areas [26]. This could exacerbate the issue of affordability for deprived households. Therefore, whether the increasing dwelling densities on PDL improve the sustainability of deprived communities is inconclusive. This study showed that increasing dwelling densities alone is not sufficient in alleviating deprivation (Figure 5). However, relationships between deprivation domains and brownfield remain to be explored to refine the design of policies as well as regeneration projects.

4.4. The Regeneration Policy Should Reduce Further Greenfield Development

Setting target on dwelling units but not areas of land may encourage high-density residential development in small brownfield areas to achieve the target [55]. At the same time, a single dwelling on a large greenfield plot could still be allowed. It is reported that “two-fifths of all land in residential use lies in rural contexts but only 24.55% of dwellings [24, p.S5]”. This implies the space occupied by a new dwelling in rural areas may be almost twice as big as a new dwelling in the urban areas. Although the lower development density may mean less impact on greenfield sites, the alteration of vegetation, and the fragmentation of habitats or migration corridors are hard to avoid and sometimes irreversible. In this case, the greenfield or green spaces might not have been preserved by the target as intended.
Furthermore, the target only considering residential land use may push more residential developments establishing on PDL, while allowing the development of greenfield sites for industrial or commercial purposes [8,55]. This phenomenon was prevalent in peri-urban areas in England between 2000 and 2006 [24, p.S9]. Therefore, the means of making urban settlement more compact such as converting houses with gardens in inner cities into flats to fulfill the 60% target may not necessarily help preserving greenfield sites. As shown in this study, still more than 40% of areas developed annually were on greenfield sites while much greater previously developed area remained un-redeveloped (Figure 2). A more effective approach to preserve greenfield may be setting target on the amount of PDL area to be reused, or directly restricting the amount of greenfield to be developed.

4.5. A More Specific Definition and Mixed-Use Development Target

The complex factors influencing the results of brownfield redevelopment can be addressed by including mixed land use concepts into the PDL recycling target. In fact, both pervious and current Planning and Policy Statements by the CLG have declared government’s intention to encourage mixed use of land [10,23]. Mixed-use development encourages energy conservation, reduces the expense of commuting, and enhances the livability of the city. It may motivate citizens to move to urban areas and therefore, unnecessary greenfield development can be avoided.
Some of the local authorities in England, assisted by the Home and Community Agency, have initiated their own local brownfield strategies [5]. This demonstrates the need of a specified plan for different types of communities. Customised allocation of redevelopment quotas based on different land uses may reflect various combinations of PDL and land use demands in local authorities and optimise the results of the redevelopment.
The current coalition government in the UK scrapped the residential housing target in 2011 without setting a new target. It maintains the definition of brownfield as PDL with a few modifications such as excluding house gardens from PDL. Moreover, in the proposed National Planning Policy Framework, the “brownfield first” criterion was eliminated. There are concerns that this overly simplified framework may result in a longer appeal process and more greenfield development [56,57]. We argue that the brownfield first criterion is necessary for sustainable development. However, the definition of brownfield in the national policy should exclude those areas that are financially profitable through redevelopment and irrelevant to socio-economic sustainability, namely underused land. Flexible mixed-use targets can be provided to communities to better facilitate sustainable brownfield regeneration.

5. Conclusions

This study argued that the definition of brownfield in England in conjunction with the 60% target has not effectively solved socio-economic sustainability. This is because the definition of brownfield in the policy has allowed cherry picking of the most profitable underused PDL for redevelopment. The target set for the percentages on dwellings is not helpful to preserve greenfield.
The study, therefore, suggests that for England, definition of brownfield should include only derelict and vacant previously developed land in the policy since the underused land is irrelevant to the socio-economic deprivation. This way, the policy instrument may effectively channel public and private resources into the redevelopment of B sites and C sites, the areas where market failure needs to be addressed.
Furthermore, the target set for the percentages of dwellings, but not the areas of PDL to be redeveloped or the areas of greenfield which can be developed, is not helpful to preserve greenfield. Customised and mixed used targets including planning for public facilities and the soft-end use should be considered depending on the demography and urbanisation.
As England is one of the countries with the highest population densities in the world, these results may have implications for countries or regions with high population densities facing the issues of brownfield regeneration for building socio-economically sustainable communities.

Acknowledgments

The paper is part of the Ph.D thesis [58] of the corresponding author with revisions and updated based on the comments of the examiners, Richard Boyle and Shaun French.

Conflict of Interest

The authors declare that they have no conflict of interest.

References

  1. DETR, A Better Quality of Life; DETR: London, UK, 1999.
  2. Small Business Liability Relief and Brownfields Revitalization Act, USA, 2001; (section 211(a)(39)(A)).
  3. Grimski, D.; Ferber, U. Urban Brownfield in Europe. Land Contam. Reclam. 2001, 9, 143–148. [Google Scholar]
  4. Syms, P. Releasing Brownfields; Joesph Rowntree Foundation: York, UK, 2001. [Google Scholar]
  5. Klapperich, H. Interdisciplinary Approach for Brownfields. In Brownfield Sites: Assessment, Rehabilitation and Development; Brebbia, C.A., Almorza, D., Klapperich, H., Eds.; WIT Press: Southampton, UK, 2002; pp. 1–13. [Google Scholar]
  6. Syms, P. Involving communities in the effective and efficient reuse of contaminated and derelict land in England. J. Urban Regen. Renew. 2010, 3, 301–314. [Google Scholar]
  7. Alker, S.; Joy, V.; Roberts, P.; Smith, N. The definition of Brownfield. J. Environ. Plan. Manag. 2000, 1, 49–69. [Google Scholar]
  8. Oliver, L.; Ferber, U.; Grimski, D.; Millar, K.; Nathanail, C.P. The Scale and Nature of European Brownfields. In Proceedings of the CABERNET 2005: The International Conference on Management Urban Land, Belfast, UK, 13–15 April 2005; Oliver, L., Millar, K., Grimski, D., Ferber, U., Nathanail, C.P., Eds.; Land Quality Press: Nottingham, UK, 2005; pp. 238–244. [Google Scholar]
  9. Ganser, R.; Williams, K. Brownfield development: Are we using the right targets? Evidence from England and Germany. Eur. Plan. Stud. 2007, 15, 603–622. [Google Scholar]
  10. Adams, D.; de Sousa, C.; Tiesdell, S. Brownfield development: A comparison of North American and British approaches. Urban Stud. 2010, 47, 75–104. [Google Scholar]
  11. CLG, Planning Policy and Statement 3 (PPS3) Housing; Department for Communities and Local Government: London, UK, 2006.
  12. Mieszkowski, P.; Mills, E.S. The causes of metropolitan suburbanization. J. Econ. Perspect. 1993, 7, 135–147. [Google Scholar]
  13. Accordino, J.; Johnson, G.T. Addressing the vacant and abandoned property problem. J. Urban Aff. 2000, 22, 301–315. [Google Scholar]
  14. Spelman, W. Abandoned buildings: Magnets for crime? J. Crim. Justice 1993, 21, 481–495. [Google Scholar] [CrossRef]
  15. Walkowiak, E.; Frazier, D. Brownfield Redevelopment as a Catalyst for Creating Sustainable Cities. In Sustainable City: Urban Regeneration and Sustainability; Brebbia, C.A., Ferrante, A., Rodriguez, M., Terra, B., Eds.; WIT Press: Rio Janeiro, Brazil, 2000; Volume 9, pp. 113–122. [Google Scholar]
  16. Webster, D. The geographical concentration of labour-market disadvantage. Oxford Rev. Econ. Pol. 2000, 16, 114–128. [Google Scholar]
  17. Brown, B.B.; Perkins, D.D.; Brown, G. Crime, new housing, and housing incivilities in a first-ring suburb: Multilevel relationships across time. Hous. Policy Debate 2004, 15, 301–345. [Google Scholar] [CrossRef]
  18. Stewart, D. “Smart Development” for Brownfields: A Futures Approach Using the Prospective through Scenario Planning Method. In Brownfield Sites II: Assessment, Rehabilitation and Development; Donati, A., Rossi, C., Brebbia, C.A., Eds.; WIT Press: Southampton, UK, 2004; pp. 233–241. [Google Scholar]
  19. Gibson, K.J. Bleeding albina: A History of community disinvestment 1940–2000. Transform. Anthropol. 2007, 15, 3–25. [Google Scholar]
  20. Lange, D.; McNeil, S. Clean it and they will come? Defining successful Brownfield development. J. Urban Plan. D-ASCE 2004, 130, 101–108. [Google Scholar] [CrossRef]
  21. NRTEE, Cleaning up the Past, Building the Future: A National Brownfield Redevelopment Strategy for Canada; National Round Table on the Environment and the Economy: Ottawa, ON, Canada, 2003.
  22. Auckland City Council, Submission on the Proposed National Environmental Standard for Assessing and Managing Contaminants in Soil; Auckland City Council: Auckland City, New Zealand, 2010.
  23. CLG, Planning Policy Statement 3 (PPS3) Housing; Department for Communities and Local Government, London, UK, 2010.
  24. Bibby, P. Land use change in Britain. Land Use Policy 2009, 26, S2–S13. [Google Scholar]
  25. CLG. Live Tables of Land Use Change Statistics. 29 July 2011. Available online: http://www.communities.gov.uk/planningandbuilding/planningbuilding/planningstatistics/livetables/landusechange/ (accessed 10 January 2012).
  26. Wong, C.; Schulze-Baing, A. Brownfield Residential Redevelopment in England: What Happens to the Most Deprived Neighbourhoods? The Joseph Rowntree Foundation: York, UK, 2010. [Google Scholar]
  27. Lees, L.; Slater, T.; Wyly, E. Gentrification: Positive or Negative? In Gentrification; Lees, L., Slater, T., Wyly, E., Eds.; Routledge: New York, NY, USA, 2008; pp. 195–236. [Google Scholar]
  28. Apostolidis, N.; Hutton, N. Integrated water management in Brownfield sites—More opportunities than you think. Integr. Concepts Water Recycl. 2006, 188, 167–175. [Google Scholar]
  29. CABERNET, Sustainable Brownfield Regeneration: CABERNET Network Report; University of Nottingham: Nottingham, UK, 2006.
  30. Dixon, T. The property development industry and sustainable urban brownfield regeneration in England: An analysis of case studies in Thames Gateway and Greater Manchester. Urban Stud. 2007, 44, 2379–2400. [Google Scholar]
  31. Elliott, J.R.; Frickel, S. Environmental dimensions of urban change: uncovering relict industrial waste sites and subsequent land use conversions in Portland and New Orleans. J. Urban Aff. 2011, 33, 61–82. [Google Scholar]
  32. Rall, E.L.; Haase, D. Creative intervention in a dynamic city: A sustainability assessment of an interim use strategy for Brownfield in Leipzig, Germany. Landsc. Urban Plan. 2011, 100, 189–201. [Google Scholar]
  33. Smith, N. Toward a theory of gentrification a back to the city movement by capital, not people. J. Am. Plan. Assoc. 1979, 45, 538–548. [Google Scholar]
  34. de Sousa, C. Brownfield redevelopment versus greenfield development: a private sector perspective on the costs and risks associated with brownfield redevelopment in the Greater Toronto Area. J. Environ. Plan. Manag. 2000, 43, 831–853. [Google Scholar]
  35. McCarthy, L. The Brownfield dual land-use policy challenge: Reducing barriers to private redevelopment while connecting reuse to broader community goals. Land Use Policy 2002, 19, 287–296. [Google Scholar]
  36. Nijkamp, P.; Rodenburg, C.A.; Wagtendonk, A.J. Success factor for sustainable urban Brownfield development: A comparative case study approach to polluted sites. Ecol. Econ. 2002, 40, 235–252. [Google Scholar]
  37. Stead, D.; Hoppenbrouwer, E. Promoting an urban renaissance in England and Netherlands. Cities 2004, 21, 119–136. [Google Scholar]
  38. The World Bank, The Management of Brownfields Redevelopment: A Guidance Note; The World Bank: Washington, DC, USA, 2010.
  39. Martin, R. The political economy of Britain’s North-South Divide. Trans. Inst. Br. Geogr. New Ser. 1988, 13, 389–418. [Google Scholar]
  40. Keeble, D.; Bryson, J. Small-firm creation and growth, regional development and the North-South Divide in Britain. Environ. Plan. A. 1996, 28, 909–934. [Google Scholar]
  41. Green, A.E. The North-South Divide in Great Britain: An examination of the evidence. Trans. Inst. Br. Geogr. New Ser. 1988, 13, 179–198. [Google Scholar]
  42. Longo, A.; Campbell, D. What are the Determinants of Brownfields Regeneration? An Analysis of Brownfields in England. In Proceedings of the Conference on the Science and Education of Land Use: A Transatlantic, Multidisciplinary and Comparative Approach, Washington, DC, USA, 24–26 September 2007.
  43. CLG, The English Indices of Deprivation 2007; Department for Communities and Local Government: London, UK, 2008.
  44. Smith, N. New globalism, new urbanism: Gentrification as global urban strategy. Antipode 2002, 34, 427–450. [Google Scholar]
  45. de Sousa, C.A. Brownfield redevelopment in Toronto: An examination of past trends and future prospects. Land Use Policy 2002, 19, 297–309. [Google Scholar]
  46. de Sousa, C.A. The greening of Brownfields in American cities. J. Environ. Plan. Manag. 2004, 47, 579–600. [Google Scholar]
  47. ODPM, Previously-Developed Land that May be Available for Development: England 2004; Office of the Deputy Prime Minister: London, UK, 2005.
  48. CLG, The English Indices of Deprivation 2010; Department for Communities and Local Government: London, UK, 2011.
  49. CLG, Previously-Developed Land that May be Available for Development: England 2006; Department for Communities and Local Government: London, UK, 2007.
  50. ONS. Generalised Land Use Database, 2005. Available online: http://www.neighbourhood.statistics.gov.uk/dissemination/Download1.do (accessed 23 May 2011).
  51. ONS. Rural/Urban Definition (England and Wales). Available online: http://www.ons.gov.uk/about-statistics/geography/products/area-classifications/rural-urban-definition-and-la-classification/rural-urban-definition/index.html (accessed 23 May 2011).
  52. Keenan, P.; Lowe, S.; Spencer, S. Housing abandonment in inner cities—The politics of low demand for housing. Hous. Stud. 1999, 14, 703–716. [Google Scholar]
  53. Kolivas, G. JESSICA: Developing new european instruments for sustainable urban development. Inf. Raumentwicklung 2007, 9, 563–571. [Google Scholar]
  54. Kreuz, C.; Nadler, M. JESSICA-UDF Typologies and Governance Structures in the Context of Jessica Implementation; European Investment Bank: Luxembourg, 2010. [Google Scholar]
  55. Ganser, R. Assessing Sustainability in Urban Planning: The Potential and Limitations of Indicators as a Means to Measure and Monitor Outcomes of Policy Implementation. In Local Sustainable Urban Development in a Globalized World; Heberle, L.C., Opp, S.M., Eds.; Ashgate Publishing Limited: Hampshire, UK, 2008; pp. 111–130. [Google Scholar]
  56. Mallett, H. The National Planning Policy Framework (NPPF)—What Role for Technical Guidance? In Oral presentation in the seminar “Where Now for Land Regeneration?— Implications of the Proposed Changes in Planning Policy and Effective Regulation of Land Contamination”, Nottingham, UK, 10 November 2011.
  57. Kells, G. The Essential Role of Brownfield Regeneration. In Proceedings of the Conference “Lessons in Land Regeneration”, Keyworth, UK, 29 November 2011.
  58. Tang, Y.T. Investigating Sustainable Land Use: Possible Implications for Brownfield Regeneration Policy. Ph.D Thesis, The University of Nottingham, Nottingham, UK, 2011. [Google Scholar]

