

Evaluation of China’s Marine Aquaculture Sector’s Green Development Level Using the Super-Efficiency Slacks-Based Measure and Global Malmquist–Luenberger Index Models
Abstract
:1. Introduction
2. Research Methods and Index Selection
2.1. Research Methods
2.1.1. Superefficient SBM Model with Undesired Outputs
2.1.2. Global Malmquist–Luenberger
2.2. Index Selection
2.3. Data Source
3. Empirical Analysis
3.1. Static Efficiency Analysis of Green Production in the Chinese Mariculture Industry
3.2. Dynamic Efficiency Analysis of Green Production in the Chinese Mariculture Industry
4. Conclusions and Suggestions
4.1. Conclusions
4.2. Suggestions
Author Contributions
Funding
Institutional Review Board Statement
Informed Consent Statement
Data Availability Statement
Conflicts of Interest
References
- Yang, Z.Y. On the Non point Source Nature of Endogenous Pollution in Fisheries and the Environmental and Economic Policies for Its Control. Product. Res. 2004, 28–30. [Google Scholar] [CrossRef]
- Yu, L.; Jiang, Q.J. The impact of heterogeneous environmental regulation on the green development of fishery in China. Sci. Geogr. Sin. 2024, 44, 319–328. [Google Scholar]
- Chen, Q. Green and healthy aquaculture actions: Selection preferences and sources of heterogeneity of farmers: An analysis based on optimal and worst selection experiment. J. Agrotech. Econ. 2023, 64–79. [Google Scholar] [CrossRef]
- Lu, C.C. Thinking on promoting the new pattern of green development of aquaculture in China. China Fish. 2018, 510, 28–31. [Google Scholar]
- Cao, J.H.; Sang, F.E. Thinking on the theory, model and evaluation method of green development of aquaculture industry. Ecol. Econ. 2020, 36, 101–106+153. [Google Scholar]
- Yue, D.D.; Wang, L.M. Study on green development strategy of aquaculture in China. China Fish. 2018, 512, 34–37. [Google Scholar]
- Ying, X.; Ying, P. Analysis of Green Development of Aquaculture in China Based on Entropy Method. Sustainability 2023, 15, 5585. [Google Scholar] [CrossRef]
- Yue, D.D.; Wu, F.X.; Fang, H.; Ruan, W.; Ji, W.W. Evaluation of green development of mariculture in China. J. Agric. Sci. Technol. 2021, 23, 1–12. [Google Scholar]
- Zhu, A.F.; Ping, Y. Spatiotemporal differentiation of green production efficiency of Marine fisheries in China based on SFA model. Ocean Dev. Manag. 2023, 40, 133–143. [Google Scholar]
- Yu, L.; Jiang, Q.J. Research on Total factor productivity of new agricultural management agents in aquaculture industry: Based on micro-agent panel data and SFA method. Chin. J. Agric. Resour. Reg. Plan. 2023, 1–13. [Google Scholar]
- Ji, J.Y.; Zeng, Q. Spatiotemporal evolution of green technology efficiency in China’s mariculture industry based on global DEA. Chin. J. Manag. Sci. 2016, 24, 774–778. [Google Scholar]
- Yang, Z.Y.; Liu, D.; Peng, L.W. Green development of mariculture in China: Level measurement, regional comparison and development countermeasures. Ecol. Econ. 2021, 37, 128–135. [Google Scholar]
- Qin, H.; Zhang, Y.; Lu, Y.Y. Measurement of eco-economic efficiency of mariculture in China based on SBM model. J. Agrotech. Econ. 2018, 281, 67–79. [Google Scholar]
- Xu, Y.; Ji, J.Y.; Zhou, J.L. Study on the influence of beach culture on the growth of green total factor productivity of mariculture. Sci. Technol. Manag. Res. 2022, 42, 193–198. [Google Scholar]
- Zhang, Y.; Ji, J.Y. Decomposition and influencing factors of green total factor productivity in China’s mariculture industry. Sci. Technol. Manag. Res. 2022, 42, 206–213. [Google Scholar]
- Jiang, Q.J.; Li, X.F. Analysis of influencing factors of green development of aquaculture industry based on AHP. Mar. Econ. 2021, 11, 15–22. [Google Scholar]
- Kaoru, T. A slacks-based measure of efficiency in data envelopment analysis. Eur. J. Oper. Res. 2001, 130, 498–509. [Google Scholar]
- Cheng, G. Data Envelopment Analysis Method and MaxDEA Software; Intellectual Property Publishing House: Beijing, China, 2014; p. 226. [Google Scholar]
- Chung, Y.H.; Färe, R.; Grosskopf, S. Productivity and Undesirable Outputs: A Directional Distance Function Approach. J. Environ. Manag. 1997, 51, 229–240. [Google Scholar] [CrossRef]
- Oh, D.-h. A global Malmquist-Luenberger productivity index. J. Product. Anal. 2010, 34, 183–197. [Google Scholar] [CrossRef]
- Li, X.; Liu, Z.F.; Zhao, M.J.; Xu, L.J.; Sun, H.W. The “double carbon” goal and the realization path of aquaculture and fishing industry in China. J. Agric. Sci. Technol. 2022, 24, 13–26. [Google Scholar]
- He, J.B.; Sun, J.R.; Zhao, Q.; Yang, G.H.; Ke, K.; Liu, P.; Wang, H.; Zhang, Y.H.; Liu, Y.S. Carbon sink contribution and capacity evaluation of shellfish culture in Yantai City. Trans. Oceanol. Limnol. 2022, 44, 117–122. [Google Scholar]
- Shao, G.L.; Kong, H.Z.; Li, C. Net carbon sequestration and its coupling with economy in mariculture in China. Resour. Sci. 2019, 41, 277–288. [Google Scholar]
- Xu, H.; Zhang, Z.L.; Zhang, J.H.; Liu, H.; Zhao, P.; Shi, R.; Wang, J.; He, Y.P. Research and development suggestions on energy conservation and emission reduction of fishery in China. J. Fish. China 2011, 35, 472–480. [Google Scholar]
- Yang, Z.Y.; Peng, L.W.; Yan, Z.F. Dynamic evolution and convergence analysis of green development level of freshwater aquaculture in China: Based on the perspective of green total factor productivity. J. Agrotech. Econ. 2022, 1–21. [Google Scholar] [CrossRef]
- Xu, H.; Liu, H.; Zhang, J.H.; Ni, Q.; Shen, J.; Jiang, L. Chinese fishery energy consumption measurement. China Fish. 2007, 384, 74–76+78. [Google Scholar]
- Xu, D.L.; Wang, Y.J. Regional differences and influencing factors of carbon productivity in coastal fisheries in China. J. China Agric. Univ. 2015, 20, 284–290. [Google Scholar]
- Yue, D.D.; Wang, L.M.; Geng, R.; Wang, X.; Dai, Y.Y. Preliminary study on ecological value assessment of algae cultivation in offshore China. J. Agric. Sci. Technol. 2014, 16, 126–133. [Google Scholar]


| Index | Index Class | Variable | Unit |
|---|---|---|---|
| Input | Resource input | Breeding area | Hectare |
| Labor force | Population | ||
| Intermediate consumption | CNY Ten thousand | ||
| Training intensity | Population | ||
| Aquaculture fishing vessel | Kilowatt | ||
| Output | Expected output | Economic value of mariculture | CNY Ten thousand |
| Carbon sink of mariculture | Ton | ||
| Undesirable output | N, P, and COD emissions from mariculture | Ton | |
| Carbon emissions from mariculture | Ton |
| Indicators | Min | Max | Avg | Sd |
|---|---|---|---|---|
| Breeding area | 15,845 | 942,050 | 237,788 | 247,029 |
| Labor force | 23,037 | 226,137 | 100,159 | 63,997 |
| Intermediate consumption | 115,658 | 1,519,737 | 594,078 | 374,997 |
| Training intensity | 1108 | 108,321 | 18,420 | 17,646 |
| Aquaculture fishing vessel | 700 | 323,379 | 115,544 | 94,430 |
| Economic value of mariculture | 662,215 | 10,728,457 | 3,587,035 | 2,720,635 |
| Carbon sink of mariculture | 1807 | 688,737 | 201,638 | 198,289 |
| N, P, and COD emissions from mariculture | 6207 | 155,247 | 62,163 | 45,874 |
| Carbon emissions from mariculture | 9402 | 252,097 | 69,058 | 57,748 |
| Province | 2012 | 2013 | 2014 | 2015 | 2016 | 2017 | 2018 | 2019 | 2020 | 2021 | Mean |
|---|---|---|---|---|---|---|---|---|---|---|---|
| Hebei | 0.203 | 0.227 | 0.242 | 0.248 | 0.271 | 0.277 | 0.303 | 0.321 | 0.383 | 0.631 | 0.294 |
| Liaoning | 0.476 | 0.578 | 0.580 | 0.570 | 0.705 | 1.151 | 0.719 | 1.147 | 1.159 | 1.353 | 0.791 |
| Jiangsu | 0.244 | 0.419 | 0.428 | 0.384 | 0.506 | 0.567 | 0.767 | 0.407 | 1.131 | 1.124 | 0.535 |
| Zhejiang | 0.379 | 0.392 | 0.419 | 0.453 | 0.420 | 0.554 | 0.560 | 0.604 | 0.783 | 1.025 | 0.531 |
| Fujian | 0.875 | 1.265 | 1.270 | 0.966 | 1.120 | 1.127 | 1.491 | 1.517 | 1.533 | 1.657 | 1.257 |
| Shandong | 0.476 | 0.505 | 0.954 | 0.797 | 1.143 | 1.091 | 1.043 | 1.049 | 1.036 | 1.099 | 0.882 |
| Guangdong | 0.575 | 0.597 | 0.583 | 0.613 | 0.662 | 0.904 | 1.061 | 1.114 | 1.076 | 1.254 | 0.807 |
| Guangxi | 0.542 | 0.528 | 0.694 | 0.680 | 1.060 | 0.867 | 1.152 | 1.131 | 1.052 | 1.049 | 0.842 |
| Hainan | 0.495 | 0.587 | 0.839 | 1.012 | 1.024 | 1.015 | 1.062 | 1.056 | 0.682 | 1.180 | 0.864 |
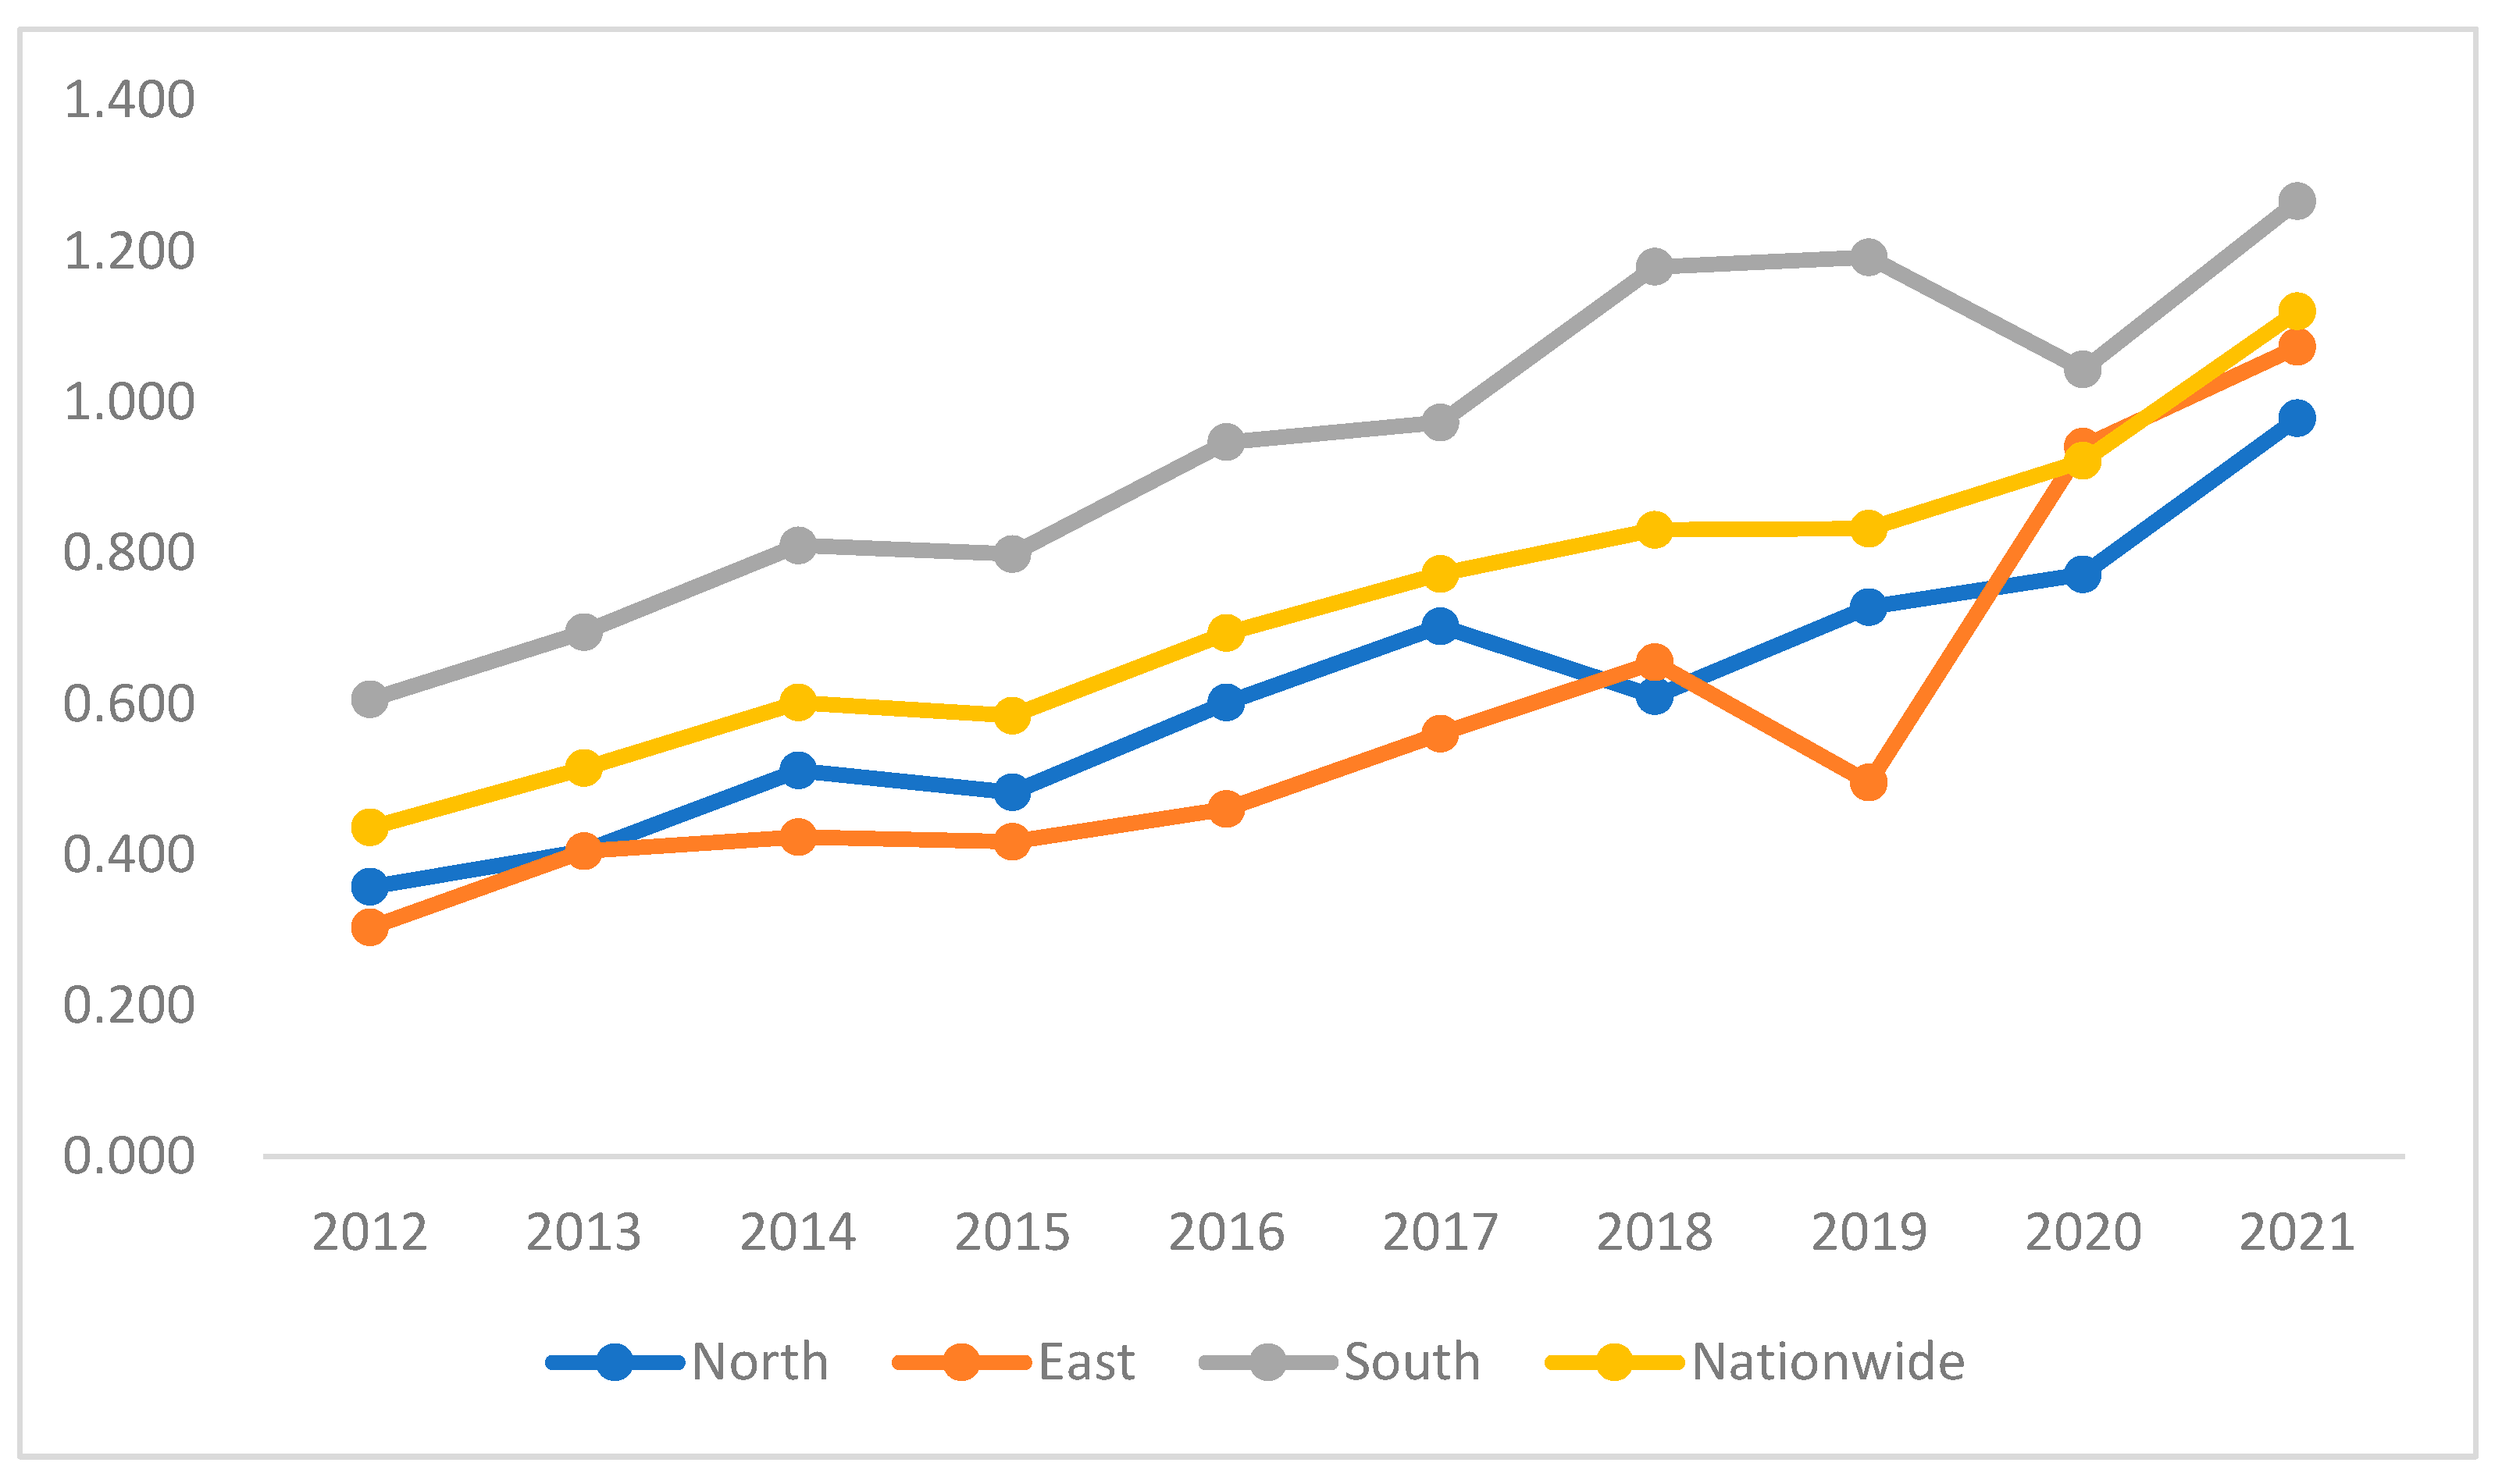
| Northern mean | 0.358 | 0.405 | 0.512 | 0.483 | 0.602 | 0.703 | 0.610 | 0.728 | 0.772 | 0.979 | 0.590 |
| Eastern mean | 0.304 | 0.405 | 0.423 | 0.417 | 0.461 | 0.561 | 0.655 | 0.496 | 0.941 | 1.074 | 0.533 |
| Southern mean | 0.606 | 0.695 | 0.810 | 0.799 | 0.947 | 0.973 | 1.180 | 1.192 | 1.043 | 1.267 | 0.927 |
| National mean | 0.436 | 0.515 | 0.602 | 0.585 | 0.694 | 0.772 | 0.831 | 0.832 | 0.922 | 1.120 | 0.705 |
| Index | Input Redundancy Rate | Redundancy Rate of Undesirable Output | |||||
|---|---|---|---|---|---|---|---|
| Labor Force | Aquaculture Fishing Vessel | Breeding Area | Training Intensity | Intermediate Consumption | Carbon Emissions | Pollutant Discharge | |
| 2012 | 0.383 | 0.493 | 0.612 | 0.779 | 0.196 | 0.296 | 0.206 |
| 2013 | 0.281 | 0.422 | 0.537 | 0.662 | 0.155 | 0.279 | 0.208 |
| 2014 | 0.220 | 0.365 | 0.448 | 0.565 | 0.144 | 0.252 | 0.133 |
| 2015 | 0.184 | 0.372 | 0.488 | 0.593 | 0.158 | 0.213 | 0.155 |
| 2016 | 0.126 | 0.256 | 0.404 | 0.386 | 0.141 | 0.175 | 0.129 |
| 2017 | 0.081 | 0.277 | 0.231 | 0.329 | 0.116 | 0.165 | 0.068 |
| 2018 | 0.119 | 0.165 | 0.198 | 0.265 | 0.102 | 0.146 | 0.054 |
| 2019 | 0.015 | 0.195 | 0.223 | 0.253 | 0.115 | 0.155 | 0.017 |
| 2020 | 0.018 | 0.108 | 0.092 | 0.171 | 0.070 | 0.080 | 0.015 |
| 2021 | 0.000 | 0.085 | 0.041 | 0.000 | 0.025 | 0.070 | 0.000 |
| Mean | 0.143 | 0.274 | 0.327 | 0.400 | 0.122 | 0.183 | 0.098 |
| Index | Input Redundancy Rate | Redundancy Rate of Undesirable Output | |||||
|---|---|---|---|---|---|---|---|
| Labor Force | Aquaculture Fishing Vessel | Breeding Area | Training Intensity | Intermediate Consumption | Carbon Emissions | Pollutant Discharge | |
| Hebei | 0.225 | 0.817 | 0.795 | 0.743 | 0.473 | 0.724 | 0.198 |
| Liaoning | 0.143 | 0.231 | 0.468 | 0.212 | 0.009 | 0.162 | 0.138 |
| Jiangsu | 0.086 | 0.550 | 0.502 | 0.561 | 0.284 | 0.356 | 0.031 |
| Zhejiang | 0.308 | 0.291 | 0.485 | 0.722 | 0.141 | 0.250 | 0.223 |
| Fujian | 0.078 | 0.071 | 0.059 | 0.171 | 0.018 | 0.013 | 0.006 |
| Shandong | 0.012 | 0.119 | 0.193 | 0.335 | 0.014 | 0.113 | 0.051 |
| Guangdong | 0.181 | 0.077 | 0.302 | 0.349 | 0.099 | 0.029 | 0.186 |
| Guangxi | 0.107 | 0.256 | 0.092 | 0.256 | 0.032 | 0.000 | 0.053 |
| Hainan | 0.144 | 0.053 | 0.049 | 0.254 | 0.030 | 0.000 | 0.000 |
| Mean | 0.143 | 0.274 | 0.327 | 0.400 | 0.122 | 0.183 | 0.098 |
| Year/Factor Breakdown | GML | EC | BPC |
|---|---|---|---|
| 2012–2013 | 1.181 | 1.051 | 1.123 |
| 2013–2014 | 1.169 | 0.986 | 1.185 |
| 2014–2015 | 0.971 | 0.997 | 0.975 |
| 2015–2016 | 1.187 | 0.960 | 1.236 |
| 2016–2017 | 1.113 | 1.003 | 1.110 |
| 2017–2018 | 1.076 | 1.003 | 1.072 |
| 2018–2019 | 1.002 | 1.035 | 0.968 |
| 2019–2020 | 1.108 | 1.097 | 1.010 |
| 2020–2021 | 1.215 | 1.032 | 1.178 |
| Mean | 1.111 | 1.018 | 1.091 |
Disclaimer/Publisher’s Note: The statements, opinions and data contained in all publications are solely those of the individual author(s) and contributor(s) and not of MDPI and/or the editor(s). MDPI and/or the editor(s) disclaim responsibility for any injury to people or property resulting from any ideas, methods, instructions or products referred to in the content. |
© 2024 by the authors. Licensee MDPI, Basel, Switzerland. This article is an open access article distributed under the terms and conditions of the Creative Commons Attribution (CC BY) license (https://creativecommons.org/licenses/by/4.0/).
Share and Cite
Yang, D.; Wang, Q. Evaluation of China’s Marine Aquaculture Sector’s Green Development Level Using the Super-Efficiency Slacks-Based Measure and Global Malmquist–Luenberger Index Models. Sustainability 2024, 16, 3441. https://doi.org/10.3390/su16083441
Yang D, Wang Q. Evaluation of China’s Marine Aquaculture Sector’s Green Development Level Using the Super-Efficiency Slacks-Based Measure and Global Malmquist–Luenberger Index Models. Sustainability. 2024; 16(8):3441. https://doi.org/10.3390/su16083441
Chicago/Turabian StyleYang, Deli, and Qionglei Wang. 2024. "Evaluation of China’s Marine Aquaculture Sector’s Green Development Level Using the Super-Efficiency Slacks-Based Measure and Global Malmquist–Luenberger Index Models" Sustainability 16, no. 8: 3441. https://doi.org/10.3390/su16083441