Article

Matchmaking in Off-Grid Energy System Planning: A Novel Approach for Integrating Residential Electricity Demands and Productive Use of Electricity

1
Department of Community Energy and Adaptation to Climate Change, Technische Universität Berlin, Ackerstr. 76, 13355 Berlin, Germany
2
Hudara gGmbH, Rollbergstr. 26, 12053 Berlin, Germany
3
Nanoé, 10 rue Littré, 75006 Paris, France
*
Author to whom correspondence should be addressed.
Sustainability 2024, 16(8), 3442; https://doi.org/10.3390/su16083442
Submission received: 15 March 2024 / Revised: 8 April 2024 / Accepted: 18 April 2024 / Published: 19 April 2024
(This article belongs to the Special Issue Energy Poverty, Inequality and Sustainable Development)

Abstract

:
Off-grid electrification planning increasingly recognizes the importance of productive use of electricity (PUE) to promote community value creation and (financial) project sustainability. To ensure a sustainable and efficient integration in the community and energy system, PUE assets must be carefully evaluated to match both the community needs and the residential electricity demand patterns. We propose a novel methodology interlinking qualitative interviews, statistical analysis and energy system modeling to optimize decision making for PUE integration in off-grid energy systems in rural Madagascar by aligning relevant PUE effectively with anticipated residential electricity demand patterns based on socio-economic determinants of the community. We find that a possible contribution of the PUE to reducing the electricity costs depends significantly on three factors: (1) The residential electricity consumption patterns, which are influenced by the socio-economic composition of the community; (2) The degree of flexibility of (i) PUE assets and (ii) operational preferences of the PUE user; and (3) The capacity of community members to finance and operate PUE assets. Our study demonstrates that significant cost reductions for PUE-integrated off-grid energy systems can be achieved by applying our proposed methodology. When matching PUE and residential consumption patterns, the integration of PUE assets in residential community energy systems can reduce the financial risk for operators, provided the PUE enterprise operates reliably and sustainably. We highlight that the consideration of local value chains and co-creation approaches are essential to ensure the energy system is addressing the community’s needs, creates value for the community, enhances the project’s financial sustainability and is achieving the overall objectives of decentralized energy system planning.

1. Introduction

1.1. Background and Theoretical Foundations

Ensuring reliable and affordable access to electricity is paramount for households and communities to attain fundamental capabilities [1]. The useful energy services associated with adequate access to electricity are a cornerstone for economic development [2,3] but are also indispensable for advancement across diverse dimensions, i.e., education, nutrition, sanitation and health [4,5,6]. Furthermore, access to electricity is a socio-technical imperative, fostering social innovation, which is pivotal in facilitating a low-carbon energy transition, promoting civic empowerment and addressing overarching social objectives [7].
On the global political stage, the acknowledgement of the critical role of universal access to electricity is reflected in target 7.1 of the Sustainable Development Goals (SDGs), adopted by the United Nations in 2015 [8]. While notable progress has been documented in the preceding decade, the realization of universal electrification by 2030, as stipulated within SDG 7.1, remains at a considerable distance. Globally, more than 675 million people lacked access to electricity in 2021 [9]. Rural regions are disproportionally affected, with eight out of ten people without access living in rural areas [9]. In Sub-Saharan Africa, where 567 million people lacked access to electricity in 2021, the disparity in electricity access rates between urban and rural areas has risen in recent years [9]. This trend can be attributed to the financial and technical challenges of reaching the rural population. In rural areas, which are only sparsely populated and where purchase power and electricity consumption can be low [10], extending the national power grid to supply electricity is often economically not viable [11]. Here, isolated renewable-based off-grid systems can be a cost-efficient and sustainable solution to enable electricity access to communities (e.g., [11,12,13,14]) and provide communities with a basis for conducting activities, which enhance development across the various dimensions interlinked with electricity (see, e.g., [2,6,10,15]).
More granular research on the interlinkage of access to electricity and development on the micro-level (see, for example, [16]) has shown that while access to electricity via off-grid energy systems can stimulate development in rural communities, access to electricity alone does not guarantee development. One must note that the literature assessing the correlation between electricity access and development often identifies economic metrics as a central effect measure for development, e.g., household income (e.g., [16,17]). Given the significance of household income for causally related household activities, which may lead to changes evoking development in other dimensions [17], this is a meaningful indication. Nevertheless, evidence of projects, in which access to electricity in rural locations was enabled and no direct effect on income or well-being was observed, is abundant (e.g., [18]). In fact, the impact of electrification projects on enhanced development (i.e., increasing economic activities or household income) seems to crucially depend on the community’s choice of how to use the electricity within the scope of action, which is facilitated by the local energy system. Thus, the literature evidence is strong that the outcomes and impact of electrification projects (note that in this paper, we understand—as per the logical framework theory—“outcomes” as the project’s effects at the target-group level, as opposed to “impact” as the project’s effects at the societal or regional level) depend on (i) the ability and choice of the community to use the electricity for productive activities [19,20]; (ii) external factors supporting the community in their capacity to utilize electricity for productive activities, e.g., finance, training, awareness, etc. [15,17]; and (iii) the degree to which the energy system design facilitates the community’s choices.
The use of electricity for productive uses is commonly referred to as productive use of electricity (PUE), as opposed to consumptive use of electricity in households [19]. Such PUE commonly comprises electrically powered machinery used by the community, according to their operational preferences, and may be directly integrated into the electricity supply system, which serves residential loads of the community. Thus, the PUE appliances and the user of the PUE asset directly influence the operational requirements of the electricity supply system and its financial viability. Energy system planners (note that we use the term “energy system” instead of “electricity system” to account for potential additional energy vectors in the system) pay increasing attention to PUE system integration and PUE user behavior. In addition to supporting the stimulation of economic and social development of the community or individual user [15,17], PUE appliances can benefit the financial viability of the energy supply system. PUE appliances typically consume more energy than residential appliances in rural villages [21,22] and may therefore provide a reliable (and relatively larger) source of income for the system operator compared to domestic loads (see the relevant discussions on “anchor loads” as relatively large non-domestic loads in [23]). Prominently, the financially viable operation of off-grid energy supply systems serving residential customers with a low electricity consumption poses significant challenges. Including PUE assets as anchor loads can increase the energy system utilization rate and provide a predictable high off-take guarantee, which in turn improves the projects’ bankability [21] and de-risks electrification projects for the private sector [10]. One must note that the prevailing narrative in the relevant literature that PUEs represent a reliable and relatively higher source of income for rural electrification operators (“anchor load”) is not universally applicable and depends on the respective context. In rural businesses, which are often operated by single informal entrepreneurs and may not be well organized, the operation of PUE may in fact be erratic. In addition, the continuous electricity demand for the PUE asset depends on the economic success of the associated business. The dependency poses a financial risk to the energy system operator. This is especially relevant in contexts, which are characterized by short lifetimes of businesses. Nevertheless, in communities with limited financial capacity to invest in stand-alone energy systems, which power a PUE asset, the systematic planning of integrated energy systems serving both PUE assets and residential loads is imperative for the utilization of electricity for productive uses and the development of associated capacities within the community.
The essential aim of off-grid energy system planning is to design a system, which adequately addresses the electricity-related needs of the community it serves. In this, the system must be financially viable to be sustainably operated and maintained to ensure its proper function. 
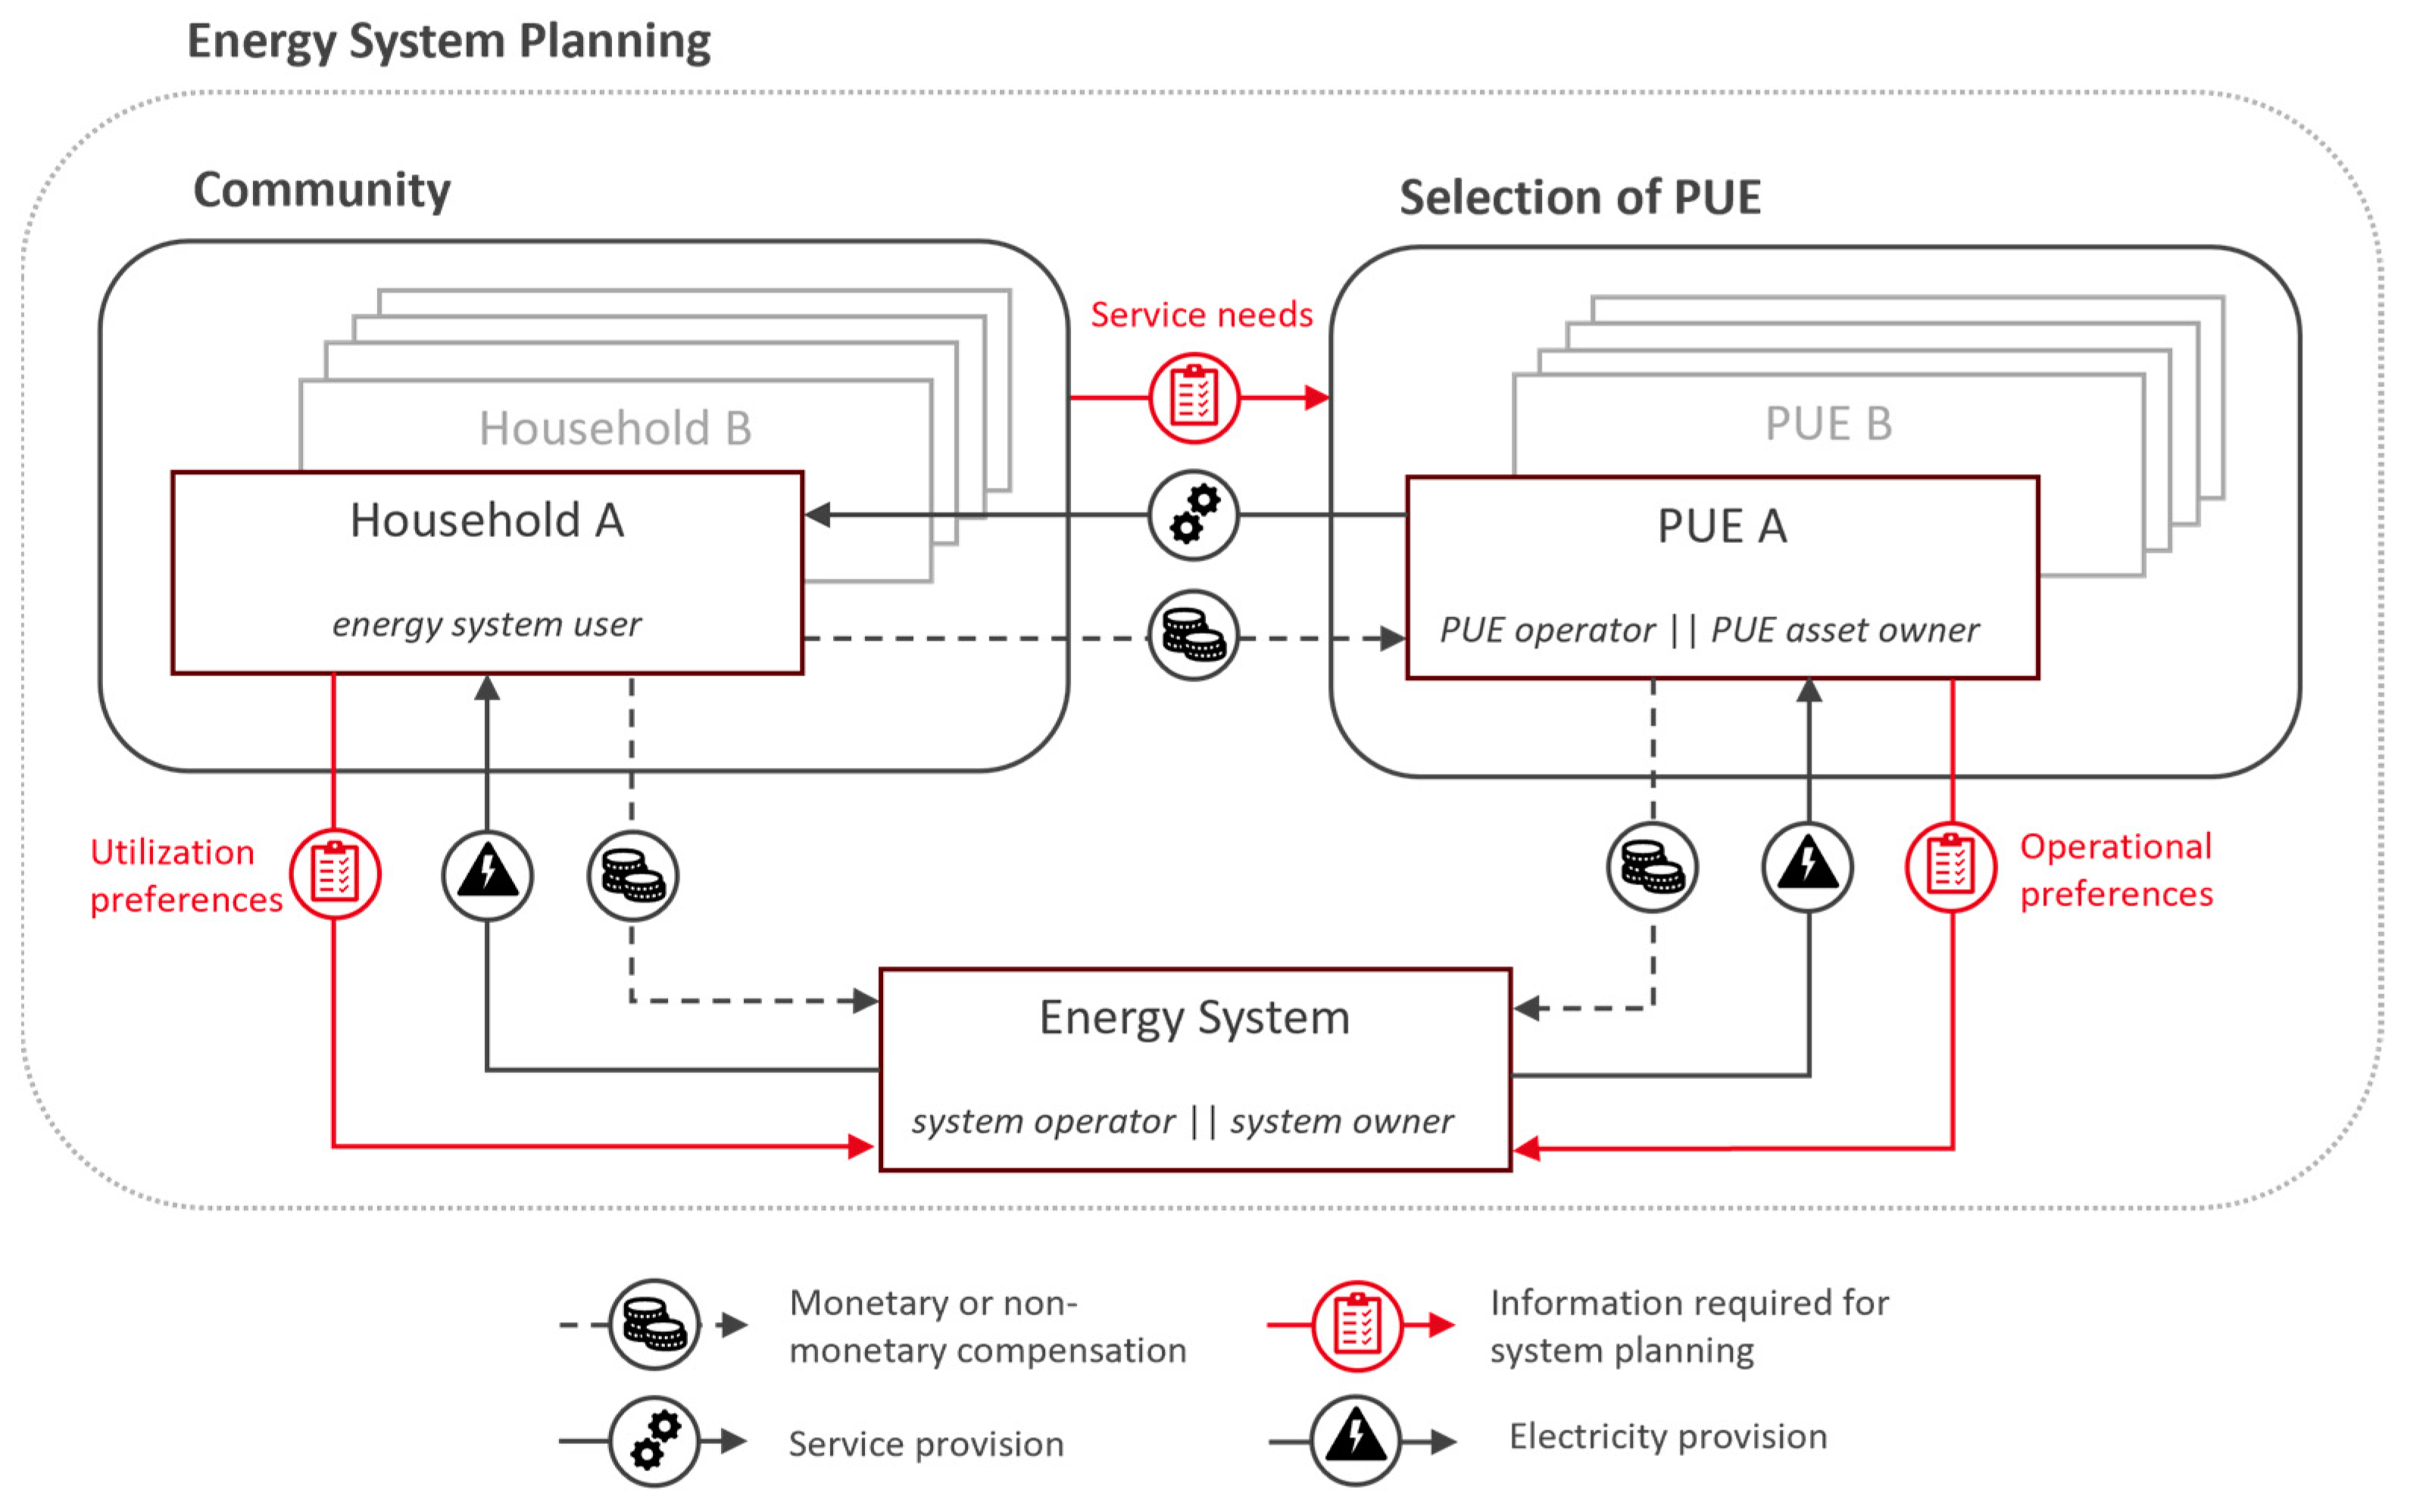
Figure 1 describes the basic dynamics and interactions between local parties involved in and relevant to the description of the considerations, which guide the planning of an off-grid energy system integrating domestic household loads and PUE loads.
The community is composed of individual households using the energy system. These households have individual time-variable preferences and capabilities (i.e., assets) to utilize electricity. Within the community, there are needs for services, some of which can be supplied by specific PUE, which can be integrated in the local electricity supply system. The electricity and service needs are highly context-specific. The electricity utilization preferences of the individual households and the operational preferences of the PUE operator determine the principal design requirements for the integrated energy system. For the energy system and the PUE, two roles are relevant, namely the role of operation and the role of financing and ownership. These roles may be assumed by the community, a single member of the community or an external entity, including the energy system planner.
We make use of Figure 1 to both guide the discussion of existing literature and its respective underlying perspectives and to describe the deliberate assumptions we made in our analysis. In research and in the practical implementation of a project, the planning rationale deviates from a generalized perspective. For context-specific relevance, it is useful to deviate from a generalized consideration, presume system design choice and make context-specific assumptions. The assumptions made may be a result of limitations of the available data, e.g., the household electricity demand, or they may result from the intention to study certain underlying dynamics or the consequences of specific system choices, e.g., applicable business models. In practice, the basis for decision making is, in many cases, the financial viability of the energy system, as rural electrification efforts are often driven by the private sector, which requires a cost recovery business model. It is important to note that this constitutes a specific perspective, namely system financing and operation. Accordingly, the current literature investigating the integration of PUE in off-grid systems supplying electricity to household loads often and usefully considers the financial perspective and evaluates the integration of PUE in off-grid systems based on its expected financial impact. Given the complexity and the various possible constellations of interaction and behavior of the parties involved in the local energy system, as depicted in Figure 1, it is no surprise that the existing literature finds contradictory results regarding the financial benefits of integration of PUE in off-grid energy systems. For example, Booth et al. [24], in a hypothetical community micro-grid scenario (peak load of 5.7 kW), find that integrating a single 10 kW maize mill could either decrease the cost of electricity provided by the system by 14% or increase it by 7% compared to a system only serving domestic loads, depending on the mill’s daily and seasonal operational parameters (notably, the authors exclude the costs of the mill from their calculation, assuming a community member or external party is responsible for the financing of the PUE asset). Specifically, the authors find that the economic impact of integrating the maize mill varies across “operating scenarios”, which denote different usage patterns of the mill across days of the week or seasons of the year. Similarly, van Hove et al. [21], studying the economic impact of integrating various PUEs in mini-grids serving household loads, find that the impact is determined by the usage patterns of the PUE. Seasonally used PUEs in particular may offer only little improvements in the system costs, as they require additional energy system assets to meet peak demand during the high season, which are under-utilized during the low season [21]. These two examples (for other similar examples, see [25,26]) support our suggestion that in order to ensure economic improvements in off-grid electricity supply via integration of PUE, the energy consumption patterns of the PUE appliances (notably determined via usage patterns and community preferences) need to fit into the household residential electricity consumption patterns to avoid costly additional production (and storage) devices being required to power the PUE, aside from the residential loads.

1.2. Motivation and Ambition

Supported by this evidence, we determine that the economic benefit of integrating PUE in energy systems will only be substantiated for all parties involved when (i) the PUE asset integrated in the system addresses the service needs of the community, thus being used and consuming electricity sustainedly, (ii) the electricity load patterns of the PUE and residential loads—each determined by the individual community member using the respective load—enable operational synergies; and (iii) the energy system infrastructure is sufficiently flexible to accommodate varying demand conditions (i.e., measures to efficiently add or remove production, storage and distribution assets). Thus, energy system planners integrating PUE in off-grid systems simultaneously serving residential loads are challenged in identifying the PUEs, which are relevant to fulfilling the service needs of the local community (Challenge I), and identifying PUEs with load profiles, which do not conflict with the domestic household load profiles (Challenge II). While the first issue may be solvable by observing local value streams of the communities, the latter poses a significant challenge. To identify a well-fitting PUE for a residential system, practitioners often integrate PUE ex post within existing residential off-grid energy systems to use historical data of the system under consideration or similar systems to identify PUEs matching the current residential energy consumption. However, historical data of residential users in off-grid energy systems are often not available, not generalizable [27] or require complex processing. Therefore, practitioners rely on trial and error, often ending up with inefficient solutions and energy systems ill-suited to their application [27]. Further, ex post integration of PUE in existing residential systems may hinge on the decisions made in conceptualizing the residential system, which leads to inefficient path dependencies for the entire PUE system. For example, if the primary energy generation asset is already fixed, it may be inefficient to install additional production equipment required to supply the PUE appliance, which could potentially prevent the simultaneous scaling of the residential and PUE systems (Challenge III). Third, it is well known that the usage patterns of PUE appliances, dictated by the activities and behavior of residents using the appliances, can affect the requirements of the system components, scaling, and therefore, economics [21]. Co-creating an energy system with the PUE user and residential energy system users (see Figure 1) may unlock cost savings, which cannot be achieved under ex post integration of PUE systems. While such co-creation approach is increasingly discussed in the academic literature (see, e.g., [28,29]), it is rarely used in practice. However, in fact, energy system users—i.e., community members—are implicitly included in system conceptualization by energy system planners at the beginning of the conceptual design of energy systems (e.g., by assuming consumption patterns based on previous experience, etc.), but they are not comprehensively integrated in the planning process. The potential of fully integrating co-creation approaches in energy systems is yet to be explored (Challenge IV). A maximum participation of (future) users—as will be discussed in this paper—can contribute to optimal alignment of the various electricity consumptions in a system—dictated by user behavior—with the planned energy system assets to minimize the energy supply costs and, as a result, also minimize the possible energy costs for the users.
Therefore, in this paper, we propose a methodology to tackle the prevailing challenges in energy system planning for off-grid electricity systems to cost-efficiently design off-grid energy systems, including PUE, improve the project’s financial viability and increase the potential contribution of electricity access to enhance the development of electrified communities. We therefore aim to address the following challenges:
Challenge I: Identify a PUE appliance, which fulfils the service needs of the local community and guarantees sustained usage and electricity consumption;
Challenge II: Identify PUE appliances with load profiles, which do not conflict with the residential load profiles, with the aim to improve the financial viability of the project via PUE integration;
Challenge III: Design an energy system, which serves both residential loads and the PUE appliance to make use of synergies;
Challenge IV: Showcase the potential for energy system cost reduction, which can be achieved by matching the user behavior of PUE and of household appliances when co-creating energy systems with their users.
Our methodology combines qualitative interviews, advanced statistical analysis and energy system modeling. First, in a community in Madagascar, we identify the relevant PUE assets, which address the community’s service needs, the associated value streams and the associated operational patterns. Next, we use the historical data of residential nanogrid energy systems to study the development of electricity consumption over time, identify the statistically significant predictors of electricity consumption and derive representative load profiles. Subsequently, we apply energy system modeling to model the scenarios of integrating PUE appliances with representative residential load profiles, which represent socio-economic characteristics, and optimize the models with regard to the lowest total system costs, including the investment decision in energy system assets and PUE and their dispatch. We evaluate the results based on key economic and technical metrics. By interpreting the key figures, we can derive statements regarding the suitability of matching different PUE appliances with households based on their socio-economic and demographic description. In addition, we can observe the distributional effects of cost sharing between residential electricity users and PUE users across different PUEs.
The methodology was developed in a case study of a rural village in northern Madagascar, and two PUE appliances were exemplarily assessed (an electric rice huller and a freezer). We provide evidence from semi-structured interviews with local communities to calibrate the model and derive additional qualitative evidence of PUE integration in energy system planning.

2. Materials and Methods

We first provide an overview of the setting of our case study (Section 2.1). Subsequently, in Section 2.2, we describe the generalized and replicable methodological workflow of our analysis. We explain the respective methods and the data used in each step of the workflow in detail within Section 2.2.1, Section 2.2.2, Section 2.2.3, Section 2.2.4 and Section 2.2.5.

2.1. Case Study

The methodology was developed based on a case study encompassing data from the village Ambohimena in the Diana region in northern Madagascar. The overall electricity access rate in the Diana region is estimated at 5% (national average overall: 35%; rural: 10.9% in 2021) [30]. Increasing electrification in the Diana region is challenged by the predominant settlement patterns. Aside from a few densely populated (and electrified) cities, the population density is low, dominated by small villages with closely built households. Hence, small-scale grids connecting a few households are seen as an economically reasonable pathway for electrification.
Ambohimena is near mangrove forests and is set along one main road, which is unpaved and connects the coast with the city Ambanja. In contrast to other villages in the region, the village is accessible via car and motorbike during most of the year. In Ambohimena, electricity is available primarily through the services of the locally based company Nanoé, which offers electricity supply via direct current (DC) PV-battery hybrid nanogrids. The nanogrids typically connect 3–5 households with 100–200 Wp installed PV and 90 Ah or 130 Ah battery storage capacity. Ambohimena was chosen as a case study because (i) the historic residential electricity consumption patterns of nanogrid users are available; (ii) the socio-economic data of residents are available; (iii) the residents of the village could be interviewed during a field trip conducted in October and November 2022.

2.2. Methods

As part of this study, a novel methodological workflow was developed to evaluate different PUEs’ technical and economic fit with residential household energy consumption patterns based on the residential community’s socio-economic and demographic composition.
Figure 2 illustrates the proposed methodological workflow. The workflow is divided into five steps, for each of which the applied methods and integrated data are described in detail in dedicated subsections (Section 2.2.1, Section 2.2.2, Section 2.2.3, Section 2.2.4 and Section 2.2.5).

2.2.1. Consumption Data Analysis

Our methodology relies on thoroughly assessing the historical electricity consumption patterns of a representative residential community connected to a nanogrid. The consumption data analysis aims to identify (i) the time-dependent determinants of residential electricity consumption patterns (based on power and energy demand in an hourly resolution) and (ii) the socio-economic and demographic determinants of electricity consumption patterns. In total, 107 village residents currently connected to nanogrids were chosen as the sample size for the study due to the consistency of electricity consumption data and socio-economic data. The following data were used:
  • Electricity consumption data: In order to reconstruct the historic hourly electricity consumption patterns, the sample’s electricity current measurements (10 min resolution) between January 2018 and December 2021 (earliest data point: 10 February 2018; latest data point: 1 December 2021) were multiplied by the measured voltage (hourly resolution) and interpolated. The data were cleaned to cover for eventual reboot events of the electricity consumption logging system or other missing values and passed to a Python-capable environment for further processing.
  • Socio-economic and demographic data: We used socio-economic data from irregularly conducted household surveys undertaken by Nanoé in 2018–2021 for the purpose of assessing potential nanogrid clients. As the surveys at that time were not intended to be used for a thorough statistical treatment to identify the socio-economic predictors of energy consumption patterns, only a few useful characteristics were assessed (this represents a major aspect to be improved in future work within this research). However, in order to develop the methodology, we relied on these secondary survey data. The surveys were conducted with any household resident available, with the option to reject the answer to any question. The characteristics assessed (indicating the descriptive statistics of valid answers only within brackets) included
    Housing occupant status (74.7% owners, 5% tenants);
    Number of adults (median (Md): 2);
    Number of children (Md: 2);
    Monthly income (Md: MGA 150,000~EUR 30);
    Housing wall type (Ravinala wood (40%), wood–concrete structure (18%), concrete–stone (22%), tin (2%));
    Housing roof type (tin (73%), leaves (9%), concrete (1%)), floor type (concrete (77%), board (4%));
    Appliance ownership (LED bulb, LED spot, TV, USB phone charger, 12 V plug);
    Profession of the client (grouped into trader (22.2%), farmer (31.6%), employee (6.8%), other (6.8%), public lighting (32.5%)). Notably, “public lighting” was included as a “profession” for the stated purpose of electricity use in the client data.
In addition to the socio-economic and demographic data, the historical tariff subscription option of residents was identified from the records. Notably, to mitigate the data availability limitations within tariff records, we applied a machine-leaning algorithm to calculate tariff subscriptions based on a multi-class problem. A detailed description of the method and its application in our analysis is available in the public project report [31]. For a description of the tariffs, see Appendix A Table A1. For a more extensive presentation and investigation of the descriptive statistics of our sample group—and the entire Ambohimena village members—we refer to our related public project report [32]. The report also includes a visual representation of the descriptive statistics of the clusters identified during cluster analysis (see Section 3.1.1).
We used advanced statistical analysis to identify the socio-economic and demographic determinants of electricity consumption patterns, including preferred tariffs. First, we applied cluster analysis to historical electricity consumption data to identify the common clusters of representative annual electricity consumption patterns. K-means clustering was used as the clustering method. K-means clustering is a machine-learning algorithm used to partition a given dataset into k clusters based on the similarity of the data points [33]. It effectively identifies similarities between numerical data, defining distinct groups of patterns [33]. K-means clustering does not require uniform cluster densities and allows for multiple dimensional data [34]. Before applying the sensitive-to-outliers k-means algorithm, the data must be cleaned of the outliers and re-scaled. Common min–max normalization was applied; compared to other kinds of cluster analyses, the main shortcoming of the method is the challenge of pre-determining the appropriate number of clusters [34]. However, this drawback can be overcome by calculating similarity measures (silhouette score) [35]. Given that the data comprised numerical data, we used Gower as a dissimilarity measure (for mathematical equations, see [36]).
Having established representative clusters of the annual electricity consumption patterns within the representative sample group, we aimed to identify the socio-economic and demographic characteristics, which could be used to predict the electricity consumption behavior of a specific community resident. Thus, we searched for statistically significant predictors of cluster membership. Therefore, we used the chi-square test or Fisher’s exact probability test (depending on the type of underlying variable) to identify the socio-economic characteristics, which occurred significantly often within the distinct load profiles. The chi-square test of independence, a non-parametric method, assesses the potential association between two categorical variables in a contingency table [32]. The test involves organizing the variables into rows (variable i ) and columns (variable j ), with cells containing the total count of cases for each category pair. By comparing the observed counts ( o i j ) with the expected counts ( e i j ) for the sample size, the significant difference between the expected and observed counts can be calculated (for mathematical equations, see [37]). If the resulting X 2 is greater than the redefined critical X 2 , the null hypothesis of independent variables may be rejected [32].
Like the chi-square test, the Fisher exact test can assess the significance of the relationship between two categorical variables. The test calculates the probability of obtaining the observed distribution of frequencies or more extreme ones, assuming that the row and column marginal totals are fixed (i.e., the marginal totals are the same as those in the observed data). The Fisher exact test provides an exact p-value, making it suitable for situations where the chi-square approximation might be unreliable due to small sample sizes [38].
The chi-square test and the Fisher exact test assess the significance of the relationship between two variables. However, to quantify the strength of the significance, we calculated Cramer’s V, which is a normalized version of the chi-square statistic. Cramer’s V effect size assumes values between 0 and 1 with increasing relationship strength. Values up to 0.1 indicate weak association; values around 0.3 indicate moderate association; and values around 0.5 or higher indicate strong association [36]. In addition, it is determined whether the variables are characteristic of a single group, thus allowing it to be distinguished from the other two.
As a final output of the consumption data analysis (Step 1), we obtain a set of representative annual residential electricity consumption load profiles, which relate to the residential community’s socio-economic and demographic characteristics (including preferred tariffs).

2.2.2. Productive Use of Electricity Analysis

As a critical challenge when aiming to integrate PUE in off-grid energy systems, the services needed by the local community and the respective PUE asset delivering the service must be identified. On the one hand, this ensures that the PUE asset will be operated, and electricity will be consumed sustainedly. On the other hand, the identification of service needs is essential to ensure value creation for and improved development of the local community. Thus, the PUE services and assets, which are relevant for the given context, i.e., significantly intertwined within existing value streams, must be identified and characterized. Further, the potential usage patterns of the PUE must be assessed, including the factors influencing possible alterations to usage patterns.
In the case under investigation, a market assessment revealed rice hulling and ice production as relevant activities to be targeted with PUE due to their current dominance and importance in the local value chains. A DC rice huller and a DC freezer were identified as the respective relevant PUEs, technically feasible for integration into the nanogrids. The required characteristics of the technical assets were identified during semi-structured interviews with key informants in the study area—who already owned the respective assets or fossil alternatives (i.e., diesel-based rice hullers)—local market analysis and previous market assessments conducted by Nanoé. Semi-structured interviews with open-ended questions based on the guidelines of Witzel [39] were introduced as a tool for information acquisition to understand the context of the study and the complex correlation of local issues. The interviews were used to capture (i) the status of PUE, (ii) the prospects of PUE, (iii) local value chains, (iv) community structures and—essentially—(v) the time-dependent usage patterns of PUE. A detailed evaluation of the interviews can be found in the publicly available project report of the ENERGICA project [31].
The load curve of the DC freezer was obtained from historical consumption data of a freezer (type: Steca PF166-H [40]) operated in the Ambohimena village, used to produce ice and conserve juice. The load curve of the rice huller was estimated by observing the usage patterns and product flows of currently used diesel-based rice hullers. The interviews suggested a substantial seasonal variation in the use of the rice huller, ranging from 1 h to 2 h a day in the rainy season up to 9 h a day in June, which is the peak month of the harvest season. Based on the monthly production of rice hullers assessed via a survey by Nanoé, we interpolated the required rice to be processed in every respective hour of the year. We further assumed that the operation of the rice huller would start at 6 am, as suggested by one interviewee, and finalize once the calculated output of the specific day has been reached (with a 3 h break between 11 am and 2 pm). Fitting the load curve in our hourly based model, the rice huller would, for example, produce 84 kg paddy rice/h between 6 am and 8 am in January but 71 kg/h between 6 am and 11 am and again from 2 pm until 6 pm in June. The PUE’s average daily electricity load patterns are illustrated in Appendix A Figure A1, Figure A2 and Figure A3.
Due to time restrictions and the language barrier, it was only possible to record to a limited extent which factors, in addition to external influences, determine user behavior and to what extent user behavior is therefore variable. The answers received suggested that the user behavior of the rice huller is largely determined by seasonal weather and vegetation cycles but otherwise offers little flexibility.
We used Microsoft Excel Version 2403 to transfer the information into numerical data and process the data. As a final output of the PUE analysis, we established (i) the time series of the assumed electricity consumption over the year (8760 timesteps) and (ii) the technical and economic characteristics of the PUE assets as numerical data.

2.2.3. Scenario Formulation

In the scenario formulation, we performed the matchmaking of residential electricity consumption compositions and PUE asset electricity consumption patterns, as illustrated in Figure 3.
We first developed five distinct sets of residential nanogrids reflecting distinct residential community compositions, as explained in Section 3. These differ in the constellation of the five residential load average profiles representing the respective electricity consumption pattern profile cluster identified during cluster analysis.
The five residential load sets were matched with different PUE and respective load profiles. With this, we could derive valuable information on the fit of a PUE in specific residential energy systems, reflecting residents’ distinct socio-economic and demographic characteristics. Therefore, we matched four PUE integration scenarios with the five distinct residential compositions. The PUE integration scenarios consisted of (1) a base case residential nanogrid without any integrated PUE according to the five distinct sets of residential load compositions (C1–C5 in Figure 3); (2) integration of a rice huller in a nanogrid with residential load profiles C1–C5; (4) integration of a freezer; and (3) integration of an unconstrained and flexible-in-operation rice huller in a nanogrid. While the interviews insufficiently assessed the flexibility of the users in adopting beneficial energy system usage patterns, we additionally introduced a scenario, which offered “total operational freedom” to the rice huller (4). In this “flexible operation” scenario, the only constraint was the minimum required yearly rice output. Notably, this scenario presents an unrealistic extreme. However, it reflects the (extreme) adoption of a user behavior to respect energy system constraints.

2.2.4. Energy System Modeling

We applied computational energy system modeling to derive a quantitative basis to evaluate the fit of PUE and different residential electricity consumption profiles. Via energy system modeling, we obtained the technical (i.e., component capacity and dispatch) and economic (cost) information of how a nanogrid serving the included residential and productive loads would ideally be designed.
We relied on the open energy modeling framework (oemof). For a detailed description of the framework, see Hilpert et al. [41]. Oemof is based on a graph-based approach, setting components and buses into a mathematical relationship, holding both technical and economic numerical data. With this, we can establish a mathematical representation of the energy systems and underlying economic characteristics to perform an economic optimization. We established a linear problem to be optimized. For this analysis, we applied the minimization of the total annualized energy system costs (including capital and operational expenditures) as the objective function. We estimated the economic and technical characteristics of the energy system asset based on local market data, experiences in the local context and key informant interviews, as summarized in Table 1 and Table 2. The financial project life was assumed to be 10 years. This corresponds to an industry average adapted to the Madagascar context, regardless of the type and origin of the entity (e.g., private person, company or other), and it may differ in other settings. The technical and economic characteristics of the energy system assets assumed reflect the experiences of operating in the local context. Poor market regulation, low quality of the imported components and a harsh environment, which drives degradation, are the decisive factors in reducing the lifetime of components in Madagascar. Kinally et.al [42] provide an extensive review on e-waste in Sub-Saharan Africa, reporting similar observations of reduced component lifetimes.
The weighted average costs of capital (WACC) are estimated at 10%. Note that the WACC may significantly differ depending on the entity investing in the energy system, i.e., in a corridor between close to 0% for local private companies receiving funding grants and up to 30% for local individuals. As the input data for a time series of PV irradiation in an hourly resolution, we relied on the MERRA-2 dataset, with the reference year 2019. Data were accessed via [43].
Table 1. Economic parameters of energy system assets assumed in the analyses. * According to a market-available product [40]. ** While re-fitting diesel-based rice hullers with a DC motor is tested within the ENERGICA project, the assumed costs are in line with commercially available DC products [44].
ComponentCAPEXfixCAPEXvariableOPEX
PVEUR 101 EUR 540/kWEUR 14/kW/year
BatteryEUR 26 EUR 246/kWhEUR 14/kW/year
Supplementary componentsEUR 306 -EUR 9.2/year
DC freezer *EUR 1220 -
DC rice huller **-EUR 607/kWEUR 28/kW/year
Table 2. Technical characteristics of energy system assets assumed in the analyses.
ComponentParameterValue
PVLifetime10 year
Optimal tilt−29° [45]
Loss fraction10% [46]
BatteryLifetime3.5 year
Efficiency0.8
SOC min0.3
C-rateC/10
DC rice hullerLifetime5 year
Conversion rate of electricity to rice flour70 kg/kWh
DC freezerLifetime10

2.2.5. Evaluation

To evaluate the modeled scenarios, we further computed the technical and economic measures of the optimized energy systems. As economic measures, we calculated the levelized costs of the entire energy system (LCOS), levelized costs of residential electricity consumption ( L C O E R e s i d e n t i a l ) and levelized costs of providing the PUE service ( L C O E S e r v i c e ). The L C O S reflect the average costs per kWh of useful electricity the system generates. We calculated the L C O S by dividing the total annualized costs ( T A C ) by the amount of electricity served E l e c t r i c i t y s e r v e d .
L C O S = T A C E l e c t r i c i t y S e r v e d
The terminus E l e c t r i c i t y s e r v e d includes the total energy delivered, including residential and PUE loads. In contrast, the levelized costs of electricity for residential loads L C O E R e s d i d e n t i a l account for the average cost per kWh of useful electricity energy produced by the system to serve residential electric loads only. We divided the annualized costs of producing electricity (notably excluding any cost associated with the potential PUE loads) by the total electric load served.
L C O E R e s i d e n t i a l = T A C TAC asset E l e c t r i c i t y P U E E l e c t r i c i t y R e s i d e n t i a l T A C P U E E l e c t r i c i t y R e s i d e n t i a l
TAC asset represents the total annualized costs of a specific energy system asset (i.e., PV, battery); T A C P U E denotes the costs of the PUE asset itself and E l e c t r i c i t y P U E [kWh/yr]; and E l e c t r i c i t y R e s i d e n t i a l denotes the total electric power served to residential electric loads [kWh/yr]. Notably, as we assumed simultaneously developing the energy system for the residential load and PUE load, we included the costs for the PUE in the calculations, maintaining the approach of optimizing the entire energy system without considering a specific perspective (see Section 4.1 for a related discussion of alternative calculation methods). Vice versa, we computed the levelized costs of electricity for service of the PUE ( L C O E S e r v i c e ), accounting for the costs and energy share associated with the PUE load.
Notably, to calculate the share of costs of the PUE subsystem and residential electricity supply subsystem, respectively (analogous to L C O E S e r v i c e and L C O E r e s i d e n t i a l ), we considered an objective technical perspective, sharing the costs of installation and use of the total system based on the share of energy consumption (bottom-up). We therefore calculated the fraction of asset costs, e.g., PV investment costs, which are required to feed the PUE or residential electricity supply subsystems, respectively, by relying on the share of PV electricity flows through each subsystem. While this technical approach is useful for evaluating the performance of the entire system, it may differ from the approach adopted by current off-grid system operators to calculate tariffs (see Section 4.1 for a related discussion).

3. Results

The following section first describes the significant influences of residential electricity consumption. Subsequently, the techno-economic results of fitting PUE into the community consumption patterns are provided.

3.1. Influences of Electricity Consumption

We observed the time-dependent evolution and variation in electricity consumption patterns (Section 3.1.1) and time-independent variation in consumption patterns based on socio-economic characteristics (Section 3.1.2).

3.1.1. Time-Dependent Influences of Electricity Consumption

We studied the evolution in electricity consumption among 107 residential electricity users over three years (earliest data log: 10 February 2018; latest data log: 1 December 2021). It is important to note that the applied payment scheme foresees optional (daily, weekly or monthly) prepayments, where the user can choose between different credit options reflecting daily power and energy limits. When exceeding the daily energy limit, the user is remotely cut off and connected again when credits are left-over the next day. When exceeding the power limits, the user is cut off only shortly and reconnected if the power load is reduced. Hence, the studied electricity consumption patterns can be constrained by the tariff chosen and the credit management of the household, and they may not reflect an unconstrained evolution. Table 3 presents the evolution in the average energy and power consumption per capita. Whereas the maximum average power demand per household remained more stable over the years, the average daily energy demand increased significantly. While a granular analysis confirms that the average energy demand of the connected households increases over time, we also observe that, more recently, the connected households tend to have higher average energy demands than clients connected several years ago (see also Figure A4 in Appendix A). This is explained by an increasing set of available DC appliances offered to local residents and a higher share of high-consumption public lights integrated in the nanogrids.
Studying the average monthly energy consumption and peak load per household reveals a seasonal variation in electricity consumption (see Figure 4); both increase significantly after the rainy season (January–April). This is explained by the seasonality of crops, the potentially increased liquidity of the households during these months and fewer hours of sunshine.

3.1.2. Socio-Economic Predictors of Electricity Consumption

Based on the cluster analysis (see Section 2.1), we identify three distinct representative annual electricity residential consumption profiles (silhouette score s = 0.53). Figure 5 illustrates the average daily load profile of each household in the sample group within the distinct clusters, with the aggregated average load profile of all households belonging to a cluster highlighted in bold. Cluster 0, including 17% of the residential sample group, exhibits a significant evening peak demand, peaking at 15 W around 8 pm, accompanied by a baseload demand of approximately 3 W throughout the rest of the day. Due to its comparatively high demand (ca. 40 Wh per day), we label the profile as “high consumption”. The majority (66%) of residents belong to Cluster 1—“low consumption”—where we observe minimal day-time consumption, with a low night-time demand of around 1 W and a small evening peak of about 4 W. Cluster 2—“night-time consumption”—(17%) displays a moderate-sized evening peak of 10 W, a night-time consumption around 8 W and no day-time consumption. Within these profiles, two extremes emerge: a low-demand consumer in Cluster 1, characterized by a consumption not exceeding 4 W and consistently lower than other groups, and a high-demand consumer in Cluster 0, with an evening peak demand four times higher than that of the low-demand consumer and twice that of Cluster 2. Throughout the day, the high-demand profile maintains the highest overall demand, dominated by a nearly constant medium baseload at 3 W.
Based on the series of chi-square and Fisher tests, we detect a significant correlation between the socio-economic characteristics and cluster membership of residents in the community. Table 4 presents the socio-economic and demographic variables determined as significant for predicting a distinct cluster membership (for an overview of the statistical analysis results relevant to our study, see Table A2 in Appendix A, as well as [31] for extensive additional statistical analyses of our underlying data). Based on the results, we can characterize the distinct clusters and use the variables to predict a particular energy consumption pattern. For instance, a high share of “Eco” tariffs within the sample group significantly predicts a Cluster 1 membership, expressing a low-load consumption load profile. Similarly, the “Public Lighting” tariff predicts the membership of a high-consumption Cluster 2. While predicting the energy consumption behavior based on tariffs is trivial, we find other more complex correlations. For instance, we see a high share of residents working as traders, which significantly correlates with an electricity consumption profile as reflected in Cluster 0, with a high peak during the evening. Most respondents included in the low-consumption profile (Cluster 1) stated instead that they were farmers (47%). Cluster 0 households also reported the highest number of LED bulbs (2.2). In addition, the presence of a phone charger (83%) and 12 V plugs (56%) correlate with membership of Cluster 0. LED spot ownership, however, predicts the membership of Cluster 2.

3.2. Techno-Economic Evaluation of PUE

According to the findings of the statistical analysis in the previous section, we established scenarios to compare the integration of PUE in residential energy systems with different compositions of residential consumption patterns, as explained in Section 2.2.3. Hence, we matched four PUE integration scenarios with five distinct residential load profile sets, each comprising five households representing the average daily load profile of a certain cluster (see Figure 5). With this, we can derive valuable information on the fit of a PUE in specific residential energy systems, reflecting residents’ distinct socio-economic and demographic characteristics.
The residential load profile sets are labeled as
  • Representative demand”: Five residential loads, including three Cluster 1 loads (“low consumption”) as the most common cluster, one Cluster 0 load (“high consumption”) and one Cluster 2 load (“night-time consumption”). This set reflects the overall percentage distribution of all samples. Annual residential demand: 101 kWh.
  • Low demand”: Five residential loads in Cluster 1 (“low consumption”). Annual residential demand: 43 kWh.
  • High demand”: Five residential loads in Cluster 0 (“high consumption”). Annual residential demand: 202 kWh.
  • Low demand with night-time load”: Four residential loads in Cluster 1 (“low consumption”) and one load with a Cluster 2 profile representing a night-time load (public lighting). Annual residential demand: 70 kWh.
  • High demand with night-time load”: Four residential loads in Cluster 0 (“high consumption”) and one load with a Cluster 2 profile representing a night-time load (public lighting). Annual residential demand: 196 kWh.
We evaluate the integration of PUE within the different composite residential energy systems using technical metrics in Figure 6, demonstrating the example of representative residential electricity consumption patterns (see Table A3 in Appendix A for all scenarios and compositions), and economic metrics in Figure 7.
In order to interpret the economic results illustrated in Figure 7, we may compare
(i)
The difference in L C O S within one PUE integration scenario across the different residential load profile sets to understand the suitability of the specific PUE for different communities;
(ii)
The difference in L C O S across different PUE integration scenarios within one specific residential load profile set to understand the best fitting PUE for the respective socio-economic character of the community;
(iii)
The distribution of L C O S , L C O E R e s d i d e n t i a l and L C O E S e r v i c e within each combination of PUE integration and residential cluster composition to understand the share of costs associated with supplying electricity to the residential users or the PUE appliance.
Below, we highlight some of the key results derivable from Figure 7 based on PUE integration scenarios:
Scenario: Base case residential nanogrid: Supplying only residential loads, the optimized energy system considering a representative demand residential load profile set consists of 160 Wp PV and 560 Wh battery storage. The costs of the system are dominated by battery storage (43% of the TAC; see Figure 8). Considering a low demand profile set—characteristic of a community significantly consisting of residents subscribing to the “Eco” tariff and characterized by owning only a few appliances (light bulbs), with a high share of farmers—results in lower total system costs (EUR 110/year versus EUR 205/yr). However, considering the relative costs of supplying electricity to the opposite high demand consumption profile set expected in communities with a significantly increased share of traders, many residents changing tariffs to the “Multimedia” tariff, and many LED bulbs, are identified higher. This tendency can increase when considering public lighting as a night-time load (high demand with night-time load) to be included in the residential energy system with a relatively high demand.
Scenario: Integrated rice huller: Integrating a DC rice huller following the current consumption patterns of fossil alternatives into a residential energy system increases the TAC of the system by ten times (high demand residential load profile set) or up to twenty times (low demand residential load profile set). The costs of the rice huller—with an optimized capacity of 1.57 kWel—account for 15% of the total system costs. However, with the PUE load dominating the share of energy consumed in the nanogrid (six-fold the residential consumption in a high demand residential load composition set; see Table A3), it also dominates the system costs. Hence, the benefits of integrating the rice huller toward reducing the L C O S depend on the residential load composition set, reflecting a different socio-economic and demographic community composition. With the rice huller relatively increasing the costs of electricity production (as seen with the L C O E S e r v i c e exceeding the L C O E R e s d i d e n t i a l under any residential load composition set), we observe increasing L C O S when including a rice huller in a high demand load profile composition set while observing beneficial effects on the L C O S when the utilization of low demand residential load compositions is increased. With splitting the costs across residential and PUE via energy shares (see Section 2.1), the L C O E R e s d i d e n t i a l may decrease by EUR 1.35/kWh (see a related discussion on cost distribution in Section 4). However, accordingly, we must carefully note that the integration of PUE can in fact result in higher cost of residential electricity consumption (based on the applied calculation of electricity cost) if the two load profiles conflict.
Scenario: Integrated flexible rice huller: Assuming the DC rice huller to have “total operational freedom” and only requiring a minimum throughput within one year is an unrealistic extreme (assuming abundant rice resources and ubiquitous storage opportunities). However, some increased flexibility in the operation—ergo, some changes in the usage patterns of the asset’s users compared to the current usage patterns of fossil counterparts—can arguably be expected to a certain degree to maneuver operational constraints imposed by the DC system (see Section 4 for a related discussion). A comparison of the results with the ones of the constrained rice huller scenario shows the significant cost reduction achievable when increasing the flexibility of PUEs, which is unlocked by shifting the load of the PUE toward the peak PV irradiation hours with least conflicting residential loads, thus avoiding costly energy storage (see Figure A2 for a representative load profile). The required power for the PUE asset is reduced to 0.6 kWel (compared to 1.57 kWel). Further, the additional amount of PV and battery to be installed is reduced compared to a residential system in order to satisfy the PUE load. While, for example, in a representative demand residential household composition set, the optimal size and associated share of TAC of the PV and battery exclusively feeding residential loads are 160 Wp and 0.56 kWh, the size and costs (see Figure 8) increase to 3.43 kWp (20% of the TAC) and 13.28 kWh (60% of the TAC), respectively, when integrating a DC rice huller following the load profile of the fossil alternatives currently used (scenario: integrated rice huller). However, when maximizing the flexibility of the huller (scenario: integrated flexible rice huller), the required PV size increases to ca. 900 Wp compared to the residential system, while the battery size remains the same compared to feeding residential loads only. Hence, significant battery costs can be saved when increasing the flexibility of the PUE to be operated at peak irradiation times. Consequently, with the amount of energy consumed in the nanogrid being dominated by the rice huller (see Table A3), achieving low costs of supplying the rice huller with electricity due to its operation harnessing excess electricity from the residential grid only, the L C O S can be reduced to less than EUR 0.3/kWh. Significantly, by smoothening the load curve in low-demand consumption scenarios, increasing the total system utilization and reducing the excess electricity share (see Table A3), the cost efficiency measures are improved compared to a high demand residential load profile set (see Figure 7).
Scenario: Integrated freezer: Integrating a freezer into the energy system quadruples the TAC of the nanogrid when considering a low demand residential load composition set of the community (EUR 552/yr versus EUR 139/yr) and triples the costs when assuming a high demand residential community set (EUR 607/yr versus EUR 205/yr) (see Figure 8). There is only slight variance in the L C O E R e s i d e n t i a l , suggesting that the applicable consumption composition has little impact on the cost of electricity provision for households. The comparison of the base case residential nanogrid only feeding residential loads and the integrated freezer scenarios reveals that through the integration of the freezer, the L C O E R e s i d e n t i a l can be reduced substantially. For the low demand residential load composition set, the L C O E R e s i d e n t i a l are reduced by 75%, and for the high demand consumption composition set, the L C O E R e s i d e n t i a l are reduced by 43%. Compared to the integrated rice huller, the PV and battery optimized capacity and share of costs of the TAC are 1.1 kWp (23% of TAC) and 1.84 kWh (31% of TAC), the latter of which is a sixth of the capacity required to satisfy the rice huller. Notably, the freezer device (150 W) constitutes a third of the TAC (EUR 198/yr) (see Figure 8).

4. Discussion

In this section, we first critically reflect on the limitations of our analysis, discuss the impact of the limitations on the results and outline alternative pathways and approaches to follow up on in future work (Section 4.1). Subsequently, we present and discuss the implications of our study results (Section 4.2). Lastly, we consider the impacts of PUE integration on the local value streams of communities (Section 4.3).

4.1. Critical Reflection on the Study

Our investigation was motivated by the potential to enhance off-grid electrification by systematically integrating residential and PUE loads in early energy system planning. PUEs are seen as a potential driver for facilitating local value creation in rural communities. Integrating PUE in residential off-grid systems is challenging, as the electricity consumption profile of the PUE must not conflict with the residential consumption patterns of the community. Thus, the residential consumption patterns must be known—a condition often not met due to lack of data and complex data acquisition. We suggest a methodology for overcoming this barrier by identifying the socio-economic and demographic predictors of residential electricity consumption patterns, which are easily accessible via a survey. We developed and tested our methodology by relying on data accessible from the operations of a local company providing nanogrids to residential customers in northern Madagascar. The available data were acquired for a different purpose. Their utilization as part of this study is a secondary application. Because the scope and content of the data were not specifically tailored to serve the use of this study, they lacked relevant accuracy and constituted limitations, especially regarding the exploration of potential socio-economic and demographic variables. For instance, these variables neglected some common socio-economic characteristics, which are often reported to influence energy-related decisions, such as the educational level (e.g., [47]). For the presented case study, this is a key limitation, which has direct implications for the information value of the derived results. While our results showcase the general relevance of utilizing determinants for the estimation of residential demand profiles, the potential for applying the proposed methodology for the exploration of relevant determinants is larger than what our results may suggest. Future studies should meticulously design and tailor socio-economic and demographic data collection for the analysis’s purpose. It is important to collaborate with local experts to specify the set of variables to be investigated. In addition to the consideration of further socio-demographic variables, which may determine the residential electricity consumption pattern and the PUE operational pattern, future studies should make informed decisions regarding whom to survey and interview. It is not a given that household members have the equivalent information or views on relevant questions. This applies particularly to questions exploring the possible future use of PUE assets, such as usage patterns. Here, it is advisable to first determine the possible individual distribution of roles (owner, operator, employee, etc.) to subsequently develop an appropriate strategy for conducting interviews and to obtain information, which is as practical as possible. Participatory research approaches may be especially suitable for revealing the relevant context-specific insights. McGookin et al. [29] highlight increased robustness, including the production of broader knowledge and more comprehensive hypotheses, as a key benefit of participatory approaches in energy system planning. There is a wide range of participatory approaches, which can guide the data inquiry to improve its relevance and sensitivity to context. Vaughn and Jacquez [48] outline the relevant participatory research approaches and frameworks.
Further, the uncertainty in constructing the estimated load profiles for PUE assets—which we derived from users (or users of the currently used fossil counterparts) descriptions assessed via interviews—highlights the need for closer monitoring of user behavior and preferences for usage patterns when implementing DC-based PUE alternatives. For instance, we derived the load curve for a rice huller based on interviews conducted with current users of diesel-based rice hullers. While we relied on users’ descriptions of the usage patterns, including the start and the duration of operating hours, close monitoring of users’ daily routines would be required to reconstruct a valid daily load profile. In addition, participatory workshops can be conducted to gain a more accurate understanding of the degree of flexibility in the operational preferences of users of PUE assets. This is especially to be considered when substituting the current fossil-based PUE with renewable-powered alternatives (as suggested in the integrated rice huller scenario of our analysis), as the degree of flexibility of the asset itself and the usage preferences of PUE users may differ compared to the fossil counterpart. It is important to note that in order to fully understand the potential for an adaptive PUE operation, one must also consider the product and value flows associated with a PUE asset. It should generally be noted that user behavior and consumption patterns (given that the PUE asset is technically flexible) are based on individual preferences and constraints. Conclusive PUE load profiles are difficult to predict, may change over time, and the generalization and transfer to other locations are limited. However, the risk of flawed prediction of the load profiles may be reduced by establishing a continuous and meaningful exchange and creating a shared sense of responsibility for the system, which includes sharing and communicating the benefits of increased system efficiency. With a shared sense of ownership and responsibility, the willingness to adapt the PUE asset—operational in such a way, that it benefits the system efficiency—may increase. However, the operational flexibility of PUE assets is also constrained by their function. For example, a freezer may offer limited flexibility in operational patterns when maintaining a specific output quality of the product. Here, technical solutions (e.g., modifying the control algorithms) may be further investigated.
Our economic calculations included PUE asset costs in the TAC and cost efficiency measures ( L C O S and L C O E S e r v i c e ). This approach was chosen for the following reasons. First, there are significant (financial) barriers for local community members to purchase DC PUE assets. Thus, arguably, the PUE assets should be supplied as part of the system infrastructure; otherwise, it is unlikely that the asset could be financed by a single potential asset operator. Second, the perspective adopted holds the view of designing optimal energy systems. Reflecting on the complex interrelation and roles within the community and energy system (see Figure 1), we are explicitly not considering the perspective of the energy system operator (who operates the energy system and only sells electricity). As underpinned by our study, the energy system is designed and tailored to one specific PUE; hence, it is not reasonable to strictly separate the energy generation from PUE operation, but the PUE asset and energy system are inherently linked. In fact, a PUE operator may not even be free to decide what asset to connect to the system, as this may be constrained by the energy system in place. This observation underlines the imperative need for the co-design of energy systems to maximize the value creation of all parties involved and to ensure the energy system design is tailored to serving prioritized needs.
In order to increase the local relevance of system planning analyses, locally applicable circumstances need to be integrated as design choices, as was performed in our study, with the deliberate design regarding gate PUE asset financing. However, to understand the implications of a study, it is important to understand the underlying respective design choices and perspectives. Generalized analyses, which go beyond the scope of the case study in this paper, may consider not including PUE asset costs as system costs, assuming residential user ownership. This can significantly lower the costs of providing electricity. However, with our approach of calculating the costs of delivering electricity to residents and the PUE service, respectively, by splitting the costs of energy system assets among the two loads based on the share of energy consumed, the cost efficiency measures would be equal, with the costs of providing electricity to the PUE being significantly lower compared to the current calculation method (e.g., in the scenario of an integrated freezer and a representative household load composition set, the L C O E S e r v i c e would be reduced from EUR 1.01/kWh to EUR 0.6/kWh). Hence, one could argue that the costs of providing electricity to the PUE load in our calculation may be overestimated. A detailed investigation of the share of energy system costs would require studying the actual utilization of energy system assets (e.g., battery storage) to satisfy each load (this could, for example, be integrated by considering the time of use of assets).
Alternatively, energy system planners may choose to evaluate the integration of PUE based only on the additional costs incurred by the integration compared to an energy system, which only serves residential loads—quasi ex post. To illustrate this consideration, we use the example of an integrated freezer in a residential nanogrid with a representative load profile set. The residential system’s TAC and L C O S —representing the L C O E R e s i d e n t i a l —are only EUR 138/yr and EUR 1.37/kWh, respectively. Integrating the freezer increases the system’s TAC to EUR 553/yr or EUR 353/yr when including or excluding the PUE asset. The costs are split, as suggested by our technically neutral calculation: the L C O E S e r v i c e and L C O E R e s i d e n t i a l amount to EUR 0.94/kWh and EUR 0.6/kWh, respectively, when including the PUE, or EUR 0.6/kWh each when neglecting the costs of the freezer (notably substantially reducing the relative costs of electricity supply). However, when only accounting for the additional energy system costs (PV, battery) incurred by the integration of the freezer compared to the residential system, we may only consider EUR 414/yr (including PUE investment costs) or EUR 215/yr (excluding PUE investment costs) as additional TAC accountable for the service provision. The respective calculated L C O E S e r v i c e are EUR 0.85/kWh and EUR 0.44/kWh—lower than those calculated via our technically neutral approach—while the L C O E R e s i d e n t i a l would remain at EUR 1.37/kWh. This example shows very well the impact the different calculation methods may have when energy planners use cost efficiency measures as a benchmark for setting tariffs.
By using the calculation approach proposed in our study, we implicitly offer a novelty for energy system planners to provide a particular service rather than electricity only, which would crucially align with the rationale of PUE integration in energy systems (see Section 1). While our analysis still compares the energy systems based on the costs per unit of energy (kWh), we suggest following the approach of comparing energy systems based on the services delivered. However, this may significantly increase the complexity of evaluating the costs and end products. For example, the “hulling rice” product comprises various components, e.g., energy system costs, operating and maintenance costs, service commission, etc. Hence, a close look into the entire value chain is required rather than separate evaluation of individual components. This is only possible for services, which already exist locally.
The stated calculation examples and the subsequent discussion of the implication showcase the importance of understanding the rationale of energy system planning in a given context. The assumptions for energy system planning should be formulated in collaboration with the local community to increase the relevance.
Our study provides insights into the associated costs of providing services. The proposed methodology enables a cost-based system optimization from a system planning perspective, which facilitates the needs of the energy system users and the energy system operator (see Figure 1). To conclude energy system planning, our methodology may be complemented by financial analyses including the relevant tariff structures, business models and income considerations. These analyses require additional context-specific data and are necessary to fully comprehend the implications of the system design for the energy system operator and the PUE asset operator. We recommend that our proposed methodology is further developed to include financial analyses. These studies may be viewed as a subsequent step to our proposed methodology.

4.2. Implications of the Key Findings

This study shows that the integration of PUE can reduce the costs of residential energy provision. However, for individuals, the costs of PUE assets may represent a significant barrier to its uptake. In the case of a DC freezer, one interviewee, whose family owns a DC freezer, reported paying off the micro-credit over a duration of two years, with monthly paybacks of MGA 160,000 (ca. EUR 33). In addition, the electricity consumed by the freezer was charged via a dedicated tariff (we may approximate a fictive tariff with the L C O E S e r v i c e to approximately MGA 38,000 per week (ca. EUR 8)). The owner reported daily profits of MGA 5000 after paying bills (ca. EUR 1) from selling a broad spectrum of goods, including iced water, ice for cooling food and beverages, and frozen juice. While the economic benefits for the PUE owner are therefore evident, our analysis shows the potential for other community members to gain financial benefits from the integration of PUEs, assuming that different stacked tariffs are in place. We observed the difference in L C O E R e s i d e n t i a l and L C O E S e r v i c e during the analysis. Notably, the LCOE only reflects part of the costs to be included when determining a tariff but may be seen as indicative of the tariff to be set. Based on our analysis, we can observe that the L C O E r e s i d e n t i a l (significantly) decreases when the PUE is integrated (integrated freezer), while the L C O E S e r v i c e exceeds the L C O E R e s i d e n t i a l .
To illustrate the consequences, we conducted a very simplified thought experiment. Considering a low demand residential composition set, the average annual electricity consumption per household is 10.6 kWh. When adopting the L C O E R e s i d e n t i a l as a tariff, in a base case nanogrid ( L C O E R e s i d e n t i a l = EUR 2.5/kWh), the annual costs of electricity per household would be approximately EUR 27. We now consider the case of having five low demand loads and one freezer integrated into the system, the operator of which is charged a tariff in the magnitude of the L C O E S e r v i c e . Adopting the new L C O E R e s i d e n t i a l found within the analysis for integrating a freezer ( L C O E R e s i d e n t i a l = ca. EUR 0.6/kWh), the annual costs of electricity to be paid by each household are reduced by 74 percent to approximately EUR 6.5, while the costs of operating the freezer would total EUR 533 per year. While this calculation is a simplification, it shows the distributional monetary benefits among the community to be potentially unlocked when setting an appropriate tariff scheme. Thus, our analysis supports the suggestion from the literature [15] that the entire local economy may be improved when initial barriers to investing in PUE to be integrated into the system are overcome. However, one must carefully note that we also reported the exact opposite and increasing L C O E R e s i d e n t i a l when PUE and residential load consumption patterns conflict, incurring additional energy system costs (integrated rice huller in a high demand residential load composition set).
Our study highlights the importance of matching the electricity consumption patterns of the residential community and the PUE to minimize the costs of electricity production. The associated cost of electricity production varies significantly between the different scenarios and underlying household load composition sets considered in this case study. Figure 9 shows the L C O S and the respective excess electricity percentage share for every scenario and residential load profile composition set considered in this study. Significant deviations in the associated cost of supplying electricity can be observed for both different residential consumption compositions when considering a single selected PUE asset, which is indicated with a uniform color code but different marker in Figure 9, and between different PUE assets, which are represented in different colors. The high variance among the electricity generation costs underlines the potential arising from a “matchmaking” approach, as proposed in this study. The spread of costs within a specific PUE integration scenario across the different residential load composition sets can be interpreted as “robustness” of the PUE load curve toward potentially conflicting residential load profiles. The results indicate that the robustness of the associated electricity provision cost can be increased when non-integrated and integrated systems are compared. The maximum spread of L C O S in the base case scenarios is EUR 1.5/kWh, whereas it is only EUR 0.13/kWh for the integrated freezer scenario and the integrated rice huller scenario. The economic impact of integrating a rice huller into a residential energy system in the flexible rice huller scenario is even less sensitive toward the load profiles of the residents than a freezer, with a spread of only EUR 0.02/kWh. This demonstrates that PUE integration into a residential off-gid energy system decreases the sensitivity of the economic results (measured by L C O S ) toward underlying residential community electricity consumption patterns.
The proposed matchmaking approach necessitates information regarding the locally relevant PUE and the associated operational behavior. In our study, we propose an approach using survey data and statistical analysis to identify the consumption determinants and calculate the representative consumption profiles. Provided that sufficient data can be collected to ensure a high degree of informative value, the identified determinants can be an efficient shortcut toward identifying favorable locations for integrated energy systems. Further statistical verification may expand the area of application to a broader geographical scope, beyond the surveyed region. The appropriate selection of PUE for a given location ultimately requires close collaboration with the community, which the energy system serves. The identification of existing value streams, the selection of relevant PUE and thorough understanding of the operational preferences, which can be achieved through KIIs, are the key requirements for the efficient integration of household and PUE loads. The long-term success of a deployed energy system is substantially influenced by the accuracy of the assumptions made regarding the energy-related needs in the community while planning the energy system. To improve the accuracy and to increase the overall value of the energy system, it is essential to include the community in energy system planning. We explored the potential of adapted operational behavior for PUE. To showcase the impact on electricity provision cost, we defined a PUE asset integration case, in which its operation did not collide with residential patterns and to harness peak PV irradiation. In line with the current literature (e.g., [21]), our study underscores the substantial impact of increasing the operational flexibility of PUEs on decreasing energy system costs. This is reflected in the fundamental differences in the percentage share of excess electricity when comparing the rice huller and the flexible rice huller in Figure 9. While the assumed operational adaptation is not realistically achievable and represents an extreme case, it showcases the theoretical potential, which lies in increased operational flexibility. To gain a more accurate understanding of the usage patterns and the associated degree of flexibility, two strategies are advisable. First, close monitoring and detailed recordings of appliance usage of existing PUE assets may significantly improve informed decision making. A systematic integration of usage monitoring in energy projects will improve the information base and sustainably improve the efficient integration of PUE assets in off-grid energy systems. Second, the actual operational preferences and willingness to adapt can only be determined in close collaboration with the PUE operator and may be linked to further product and value streams within the community. The importance of community participation in energy system planning and a meaningful exchange between an energy system investor and energy system users is further underlined by the previously (see Section 1) discussed risk of the business associated with PUE ceasing to exist prior to the point in time when a positive return on investment for the energy system is achieved. Such financial risks may be mitigated by facilitating continous exchange with the users of the energy system and providing supportive measures where relevant.

4.3. Considerations of PUE Impact on Value Streams of the Community and Its Environment

Our results highlight the crucial importance of including the local community in the decision-making and energy system design processes. First, energy system planners must identify a PUE asset, which is relevant for addressing the service needs of the community to ensure a sustained uptake of the service and electricity consumption. Hence, a close interaction with community members is inevitable. Second, identifying individual preferences and the degree of flexibility in the usage patterns of PUE users can support alignment of the PUE load profile with residential load profiles, which is critical to minimizing the costs of electricity supply (see Section 3.2). In the qualitative data acquisition and in our analysis, we focused on the local community directly interacting with the energy system. These considerations offer new insights into more relevant and more efficient designs of off-grid energy systems. However, we recommend that future studies further systematically integrate considerations regarding the external environment in which the community is set. The interaction of the community with the external environment further improves the information value of the conducted analysis in several ways. First, the potential for a flexible operation of the PUE asset is constrained by the product and value streams of local markets. Second, the identification of relevant service needs (see Section 2.2.2) is linked to services, which may exist outside the scope of the community. Third, the impact of introducing PUE assets—in terms of development—may have implications beyond the community, as it will change the existing value and product streams.
To showcase the relevance of integrating considerations regarding the environment in which the community is set, in the following, we discuss the potential implications. The results of our economic analysis (see Section 3.2) suggest that the integration of PUE can improve the economics of off-grid energy systems. As suggested in our discussion, these benefits could be further distributed to residential energy system users. Additionally, we provided evidence of a potential for improved household income (Section 4.2) as a result of investing in PUE. It is important to note that in this analysis, we only consider improved household income via potential savings on energy expenditures. A detailed description of additional income generated via the PUE products is laid out in a report of the associated ENERGICA project [31]. However, we must bear in mind that the integration of PUEs impacts the energy system operator and the PUE user, and it may disrupt the local value stream patterns of the community and its external environment. The integration of PUE in energy systems, communities and energy access projects is complex, given the multidimensional and bilateral relation of PUE with the embedded ecosystem. Previous research has developed the causal relation of PUE integration in energy access projects, identifying the risks, preconditions and external factors impacting the implementation of PUE in projects [15,49]. Riva et al. [17] show the complex causal loops associated with energy access and productive activities. Based on interviews with several community members in our case study, we can illustrate the changes in local community value streams when, for example, considering the uptake of a freezer in a village (Figure 10). A corresponding description for the case of an electric rice huller is documented in the associated ENERGICA project [31].
Figure 10 depicts the systems and value streams of the environment associated with the product “ice”, which is anticipated in a scenario introducing decentralized ice production via a nanogrid-connected freezer. The value streams in existence prior to the availability of locally produced ice are disrupted. It is expected that ice buyers (i.e., grocery shops and bars) previously purchasing ice from mobile retailers—who transport the ice from large factories in nearby cities—may now buy ice, which is produced locally. Hence, one must note that the introduction of PUE in a decentralized grid and the associated increased local economic activity may lead to other stakeholders experiencing negative consequences (e.g., ice delivery or fuel delivery). Consequently, it is not a given per se that all local stakeholders will profit from an increased uptake of PUE. For the planning of off-grid energy systems, it is therefore relevant to be aware of the entire associated value chains of products and thoroughly establish potential negative consequences. The importance of carefully weighing potential system disruptions is acknowledged in the literature. The literature shows that the uptake of PUE may increase inequalities or may have negative impacts on the incomes of some parts of the population. For example, Khandker et al. [50] find comparatively wealthier families, who can afford to invest in PUE to increase their income due to PUE usage. In contrast, families who cannot afford a PUE remain comparatively poor. Further, substituting labor-intensive jobs with PUE appliances threatens the jobs of low-income families. This also applies to the eradication of jobs associated with fossil fuels when implementing renewable energy sources (i.e., selling candles or kerosene [51]). Prominently, the threat of increasing inequalities associated with PUE applies to gender-based inequalities. Many PUEs stimulate activities and professions, which either men or women predominantly carry out. Hence, a discrepancy in income stimulation as a result of PUE is evident in the literature [49]. Given the risk of unintended consequences, in particular with regard to reinforcing local inequalities, the type of employment should also be evaluated to determine whether certain PUEs actually contribute to livelihood improvements [52]. In addition, Terrapon-Paff et al. [49] highlight the inclusion of dedicated activities toward raising awareness among stakeholders across the entire value chain to avoid the creation of inequalities when implementing PUEs.

5. Conclusions

Our study proposes a novel methodology for identifying PUE, which fit into the community structures and off-grid residential energy systems, improving the (financial) sustainability of rural electrification projects and the efficiency of energy system planning. In contrast to the current methods, our approach has the potential to avoid extensive data collection and overcome data gaps.
Our key findings emphasize the significance of aligning PUE electricity consumption patterns with residential patterns to minimize electricity production costs. We observe that considering the preferences for and the degree of flexibility in the usage patterns of PUE users within the energy system design process is crucial to aligning the different loads, unlocking synergies, and finally, reducing the LCOE.
We further discuss the financial capacity of community members to invest in PUE assets as a critical determinant of electricity production costs. In our analysis, we explore the different perspectives of energy system planning and discuss the different ownership and finance models of PUE assets and their impact on the cost distribution of the system, as well as the potential implications for the consequent electricity tariffs. This discussion complements the existing literature advocating for strengthening the financial capacity of rural community members to invest in PUE assets. According to our analysis, if the PUE asset is taken over by the investor in the energy system itself, cost distributions are possible (depending on the PUE asset and the structure of the community load patterns), which may increase the total electricity generation costs. Accordingly, a sustainable economic benefit for all parties through the financing of PUE assets as part of the energy system is not unconditional.
In the existing literature, PUEs are essentially justified by the narrative of an anchor load—a reliable and relatively higher demand for electricity and thus a source of income. While this must be carefully reviewed in practice and is not generalizable (i.e., considering short business lifetimes or erratic operation of PUE businesses), our analysis confirms a plausible potential of the PUE attributed to reducing the financial risk of a project. Provided that the PUE operational lifetime matches the economic lifetime of the energy project, and a reliable operational pattern of the PUE asset can be assumed, we observe that the integration of PUE assets in residential community energy systems reduces the sensitivity of energy supply costs toward different community energy consumption patterns and thus offers the potential for reducing the financial risk of the project. However, given the preconditions of reliable and sustained electricity off-take by the PUE enterprises, we again highlight the crucial role of offering support and actively engaging with the community and PUE users not only during energy system planning but throughout the project operation.
Our discussion highlights the spectrum of rationales for off-grid energy system planning and the importance of transparency in the energy system planning process and continuous project operation. The locally relevant rationale for energy system planning can only be formulated in a collaborative process involving all locally relevant stakeholders, and it is influenced by local dependencies, opportunities, community structures and the external environment in which the community is set. The identified rationale translates into applicable energy system design criteria, business models and ownership models. Future research should develop novel approaches for facilitating a collaborative process, fostering co-creation activities in off-grid energy system planning and harmonizing the expectations and goals among the actors involved in energy system decision making, including residential community members, PUE users and energy system operators.
Exploring the local value streams of the community and its environment, we observe the need for energy system planners to address the broader implications of PUE integration, such as its impact on local community value streams and potential unintended consequences, including increased inequalities. In line with the literature, our study underlines that PUE can positively impact the energy system and the local community’s economy. However, this is not unconditional, and we must respect that the benefits of PUE are not equally shared among all community stakeholders. We recommend the consideration of local value stream patterns beyond the community directly impacted by PUE asset integration and inclusion of the complex interactions of the community with its surrounding environment to prevent adverse negative effects of PUE integration in rural settings.

Author Contributions

Conceptualization, N.S. (Nikolas Schöne), T.R.B. and E.D.; Methodology, N.S. (Nikolas Schöne), T.R.B. and E.D.; Software, E.D. and N.S. (Nikolas Schöne); Validation, E.D., N.S. (Nikolas Schöne), T.R.B. and N.S. (Nicolas Saincy); Formal analysis, E.D., N.S. (Nikolas Schöne) and T.R.B.; Investigation, N.S. (Nikolas Schöne), T.R.B. and E.D.; Resources, N.S. (Nicolas Saincy); Data curation, E.D., N.S. (Nikolas Schöne) and T.R.B.; Writing—original draft preparation, N.S. (Nikolas Schöne) and T.R.B.; Writing—review and editing, N.S. (Nikolas Schöne), T.R.B., N.S. (Nicolas Saincy) and B.H.; Visualization, N.S. (Nikolas Schöne) and T.R.B.; Supervision, B.H.; Project administration, B.H.; Funding acquisition, B.H. All authors have read and agreed to the published version of the manuscript.

Funding

This research was funded by the Horizon 2020 research program under the grant agreement No. 101037428 (ENERGICA). The outcomes will feed into full reports submitted to the European Commission and will be available on www.energica-h2020.eu.

Institutional Review Board Statement

The study was conducted according to the guidelines of the Declaration of Helsinki, and approved by the European Commission via the ethics and safeguarding procedures as laid out in the Ethics Deliverables in the ENERGICA project (ID 101037428 on 31.4.2022).

Informed Consent Statement

Informed consent was obtained from all subjects involved in the study.

Data Availability Statement

Data are contained within the article and Ref. [31].

Acknowledgments

We acknowledge support by the German Research Foundation and the Open Access Publication Fund of TU Berlin. Many thanks to Ida Fuchs, Paul Cairns, Guilhem Desentenac, Lucas Richard, Nolwenn Le Saux, Archille Elia Befeno and the team at Nanoé for supporting the key informant interviews and market study.

Conflicts of Interest

Author Nicolas Saincy was employed by the company Nanoé. The remaining authors declare that the research was conducted in the absence of any commercial or financial relationships that could be construed as a potential conflict of interest.

Appendix A

Table A1. Subscription options included in the analysis.
Tariff NameMaximum Power (W)Maximum Energy Consumption per Day (Wh)
Eco1050
Eclairage1890
Eclairage Plus30150
Multimedia42210
Multimedia Plus66330
Congel1251250
Figure A1. Load profile examples of the electric rice huller.
Sustainability 16 03442 g0a1
Figure A2. Load profile of the electric rice huller assuming maximum flexibility by only determining a minimum rice production over the entire year. Notably, this scenario represents an unrealistic extreme.
Sustainability 16 03442 g0a2
Figure A3. Load profile examples of the electric freezer.
Sustainability 16 03442 g0a3
Figure A4. Average daily electricity consumption per household across all nanogrid clients in the case study area. The dashed line indicates the commissioning of new nanogrids.
Sustainability 16 03442 g0a4
Table A2. Results of the statistical analysis of the socio-economic and demographic predictors of energy consumption patterns.
Variables Cluster 0Cluster 1Cluster 2χ2dfFisher’s Exact TestpCramer’s V
CECCECCEC
Tariff Group
EcoYes05.73322.615.721.1722 <0.0010.445
No1812.33848.41712.3
EclairageYes65.72322.655.70.1652 0.9540.047
No1212.34848.41312.3
Eclairage PlusYes94.71718.624.77.58526.980.0250.275
No913.35452.41613.3
MultimediaYes724812.216.654212.370.0010.395
No111667631716
Multimedia PlusYes2144012.09921.8270.3920.144
No161767671817
Public LightingYes021811254.137237.199<0.0010.711
No18167063716
Tariff SwitchYes1151719.92512.92 0.0020.347
No7135251.11613
Appliance Ownership
LED BulbYes1614.16155.7714.120.201216.635<0.0010.435
No23.91015.3113.9
LED SpotYes021811254.137237.199<0.0010.711
No18167063716
TVYes3288121.11621.0950.60.102
No151663631716
USB Phone ChargerYes158.93135.278.910.021210.1990.0060.306
No39.14035.8119.1
12 V Plug (Simple and Double)Yes105.72122.635.76.7492 0.0340.251
No812.35048.41512.3
LED Bulb Quantity023.91015.3113.940.8831235.687<0.0010.437
167.94031.217.9
2441415.964
331.244.601.2
410.732.700.7
510.200.700.2
810.200.700.2
Survey Variables
Occupant StatusFree10.200.700.15.18245.9460.1950.181
Owner1414.85452.755.5
Tenant1133.610.4
House SizeLarge841115.221.88.51547.0270.0890.226
Medium810.64239.854.6
Small01.375.100.6
Household Monthly Income000.210.700.16.689108.6610.5680.207
100,00002.5108.620.9
150,000772524.422.6
200,00064.51415.821.7
300,00021.244.300.5
500,00010.622.200.2
Number of Household Members00153.600.416.7661214.9220.1490.312
110.411.400.2
213.41512.311.4
384.21315.101.7
4341514.421.6
533.6111341.5
610.622.200.2
Number of Adults000.842.900.34.86564.8180.6080.169
1131310.811.2
216134346.665.4
300.210.700.1
Number of Children012.91310.911.316.175813.2830.0650.31
184.61617.402
234.41916.711.9
333.61113.851.6
410.622.200.3
Job Group
TraderYes95.41714.805.813.2632 0.0010.429
No69.62426.21610.2
FarmerYes87.92521.658.44.0832 0.130.238
No77.11619.4117.6
EmployeeYes41.744.601.85.75124.9590.0560.283
No1113.33736.41614.2
Public LightingYes02.516.8112.740.226231.89<0.0010.747
No1512.54034.2513.3
OtherYes11.764.611.81.19820.8490.6760.129
No1413.33536.41514.2
Table A3. Technical results for the PUE integration scenarios.
Representative DemandLow DemandHigh DemandLow Demand with Night-Time LoadHigh Demand with Night-Time Load
PUE Integration ScenarioBase caseResidential Demand [kWh]101.2443.08201.7669.51196.45
PUE Demand [kWh]0.000.000.000.000.00
Excess Electricity Share [%]51.9746.0253.6436.3955.18
Excess Hours34332804347426703575
Rice hullerResidential Demand [kWh]101.2443.08201.7669.51196.45
PUE Demand [kWh]1309.151309.151309.151309.151309.15
Excess Electricity Share [%]70.6770.5169.2870.7169.43
Excess Hours3142.003289.003303.003236.003297.00
Flexible rice hullerResidential Demand [kWh]101.2443.08201.7669.51196.45
PUE Demand [kWh]1309.141309.141309.141309.141309.14
Excess Electricity Share [%]0.120.120.120.120.12
Excess Hours137136132132136
FreezerResidential Demand [kWh]101.243.1201.869.5196.4
PUE Demand [kWh]485.0485.0485.0485.0485.0
Excess Electricity Share [%]63.363.362.863.263.1
Excess Hours38413892385638593901

References

  1. Frigo, G.; Baumann, M.; Hillerbrand, R. Energy and the Good Life: Capabilities as the Foundation of the Right to Access Energy Services. J. Hum. Dev. Capab. 2021, 22, 218–248. [Google Scholar] [CrossRef]
  2. González-Eguino, M. Energy Poverty: An Overview. Renew. Sust. Energ. Rev. 2015, 47, 377–385. [Google Scholar] [CrossRef]
  3. Arto, I.; Capellan-Perez, I.; Lago, R.; Bueno, G.; Bermejo, R. The Energy Requirements of a Developed World. Energy Sustain. Dev. 2016, 33, 1–13. [Google Scholar] [CrossRef]
  4. McCollum, D.L.; Echeverri, L.G.; Busch, S.; Pachauri, S.; Parkinson, S.; Rogelj, J.; Krey, V.; Minx, J.C.; Nilsson, M.; Stevance, A.-S.; et al. Connecting the Sustainable Development Goals by Their Energy Inter-Linkages. Environ. Res. Lett. 2018, 13, 033006. [Google Scholar] [CrossRef]
  5. Fuso Nerini, F.; Tomei, J.; To, L.S.; Bisaga, I.; Borrion, A.; Spataru, C.; Castán Broto, V.; Mulugetta, Y. Mapping Synergies and Trade-Offs between Energy and the Sustainable Development Goals. Nat. Energy 2017, 3, 10–15. [Google Scholar] [CrossRef]
  6. Schöne, N.; Timofeeva, E.; Heinz, B. Sustainable Development Goal Indicators as the Foundation for a Holistic Impact Assessment of Access-to-Energy Projects. J. Sustain. Dev. Energy Water Environ. Syst. 2022, 10, 1090400. [Google Scholar] [CrossRef]
  7. Dall-Orsoletta, A.; Cunha, J.; Araújo, M.; Ferreira, P. A Systematic Review of Social Innovation and Community Energy Transitions. Energy Res. Soc. Sci. 2022, 88, 102625. [Google Scholar] [CrossRef]
  8. United Nations Sustainable Development Goals Knowledge Platform. Available online: https://sustainabledevelopment.un.org (accessed on 11 July 2022).
  9. IEA. Tracking SDG7: The Energy Progress Report; IEA: Paris, France, 2023. [Google Scholar]
  10. Liu, Y.; Bah, Z. Enabling Development Impact of Solar Mini-Grids through the Community Engagement: Evidence from Rural Sierra Leone. Energy Policy 2021, 154, 112294. [Google Scholar] [CrossRef]
  11. Morrissey, J. The Energy Challenge in Sub-Saharan Africa: A Guide for Advocates and Policy Makers: Part 2: Addressing Energy Poverty; Oxfam Research Backgrounder; Oxfam: Boston, MA, USA; Washington, DC, USA, 2017; pp. 23–44. [Google Scholar]
  12. ESMAP. Mini Grids for Half a Billion People: Market Outlook and Handbook for Decision Makers; ESMAP: Washington, DC, USA, 2019. [Google Scholar]
  13. Azimoh, C.L.; Klintenberg, P.; Mbohwa, C.; Wallin, F. Replicability and Scalability of Mini-Grid Solution to Rural Electrification Programs in Sub-Saharan Africa. Renew. Energy 2017, 106, 222–231. [Google Scholar] [CrossRef]
  14. Agenbroad, J.; Carlin, K.; Ernst, K.; Doig, S. Minigrids in the Money: Six Ways to Reduce Minigrid Costs by 60% for Rural Electrification; Rocky Mountain Institute: Basalt, CO, USA, 2018. [Google Scholar]
  15. Terrapon-Pfaff, J.; Gröne, M.-C.; Dienst, C.; Ortiz, W. Impact Pathways of Small Energy Projects in the Global South—Findings from a Systematic Evaluation. Renew. Sust. Energ. Rev. 2018, 95, 84–94. [Google Scholar] [CrossRef]
  16. Kooijman-van Dijk, A.L. The Role of Energy in Creating Opportunities for Income Generation in the Indian Himalayas. Energy Policy 2012, 41, 529–536. [Google Scholar] [CrossRef]
  17. Riva, F.; Ahlborg, H.; Hartvigsson, E.; Pachauri, S.; Colombo, E. Electricity Access and Rural Development: Review of Complex Socio-Economic Dynamics and Causal Diagrams for More Appropriate Energy Modelling. Energy Sustain. Dev. 2018, 43, 203–223. [Google Scholar] [CrossRef]
  18. Madon, R. Energy, Poverty, and Gender: Impacts of Rural Electrification on Poverty and Gender in Indonesia Volume 1: Facts, Analysis, and Recommendations; ENPOGEN, MARGE France for The World Bank, ASTAE: Washington, DC, USA, 2003. [Google Scholar]
  19. ESMAP. Productive Use of Energy—PRODUSE Measuring Impacts of Electrification on Small and Micro-Enterprises in Sub-Saharan Africa; ESMAP: Washington, DC, USA, 2013. [Google Scholar]
  20. Domegni, K.M.S.; Azouma, Y.O. Productive Uses of Energy: A Solution for Promoting Energy Justice in Rural Areas in West Africa. Renew. Sustain. Energy Rev. 2022, 160, 112298. [Google Scholar] [CrossRef]
  21. van Hove, E.; Johnson, N.G.; Blechinger, P. Evaluating the Impact of Productive Uses of Electricity on Mini-Grid Bankability. Energy Sustain. Dev. 2022, 71, 238–250. [Google Scholar] [CrossRef]
  22. Little, M.; Blanchard, R. Pre-Feasibility Methodology to Compare Productive Uses of Energy Supplied by Stand-Alone Solar Photovoltaic Systems: A Tanzanian Case Study. Energy Sustain. Dev. 2022, 70, 497–510. [Google Scholar] [CrossRef]
  23. Beath, H.; Hauser, M.; Sandwell, P.; Gambhir, A.; Few, S.; Chambon, C.L.; Nelson, J. The Cost and Emissions Advantages of Incorporating Anchor Loads into Solar Mini-Grids in India. Renew. Sustain. Energy Transit. 2021, 1, 100003. [Google Scholar] [CrossRef]
  24. Booth, S.; Li, X.; Baring-Gould, I.; Kollanyi, D.; Bharadwaj, G.; Weston, P. Productive Use of Energy in African Micro-Grids: Technical and Business Considerations; NREL, Energy 4 Impact; NREL: Golden, CO, USA, 2018. [Google Scholar]
  25. Kyriakarakos, G.; Balafoutis, A.T.; Bochtis, D. Proposing a Paradigm Shift in Rural Electrification Investments in Sub-Saharan Africa through Agriculture. Sustainability 2020, 12, 3096. [Google Scholar] [CrossRef]
  26. Farthing, A.; Rosenlieb, E.; Steward, D.; Reber, T.; Njobvu, C.; Moyo, C. Quantifying Agricultural Productive Use of Energy Load in Sub-Saharan Africa and Its Impact on Microgrid Configurations and Costs. Appl. Energy 2023, 343, 121131. [Google Scholar] [CrossRef]
  27. Louie, H.; Dauenhauer, P. Effects of Load Estimation Error on Small-Scale off-Grid Photovoltaic System Design, Cost and Reliability. Energy Sustain. Dev. 2016, 34, 30–43. [Google Scholar] [CrossRef]
  28. Hunink, Y.T.A.; Kamp, L.M.; Blom, E.M. Co-Creating Responsible Energy Systems. In ISGW 2018 Compendium of Technical Papers; Pillai, R.K., Ghatikar, G., Seethapathy, R., Sonavane, V.L., Khaparde, S.A., Yemula, P.K., Chaudhuri, S., Eds.; Lecture Notes in Electrical Engineering; Springer: Singapore, 2020; Volume 580, pp. 329–342. ISBN 978-981-329-118-8. [Google Scholar]
  29. McGookin, C.; Ó Gallachóir, B.; Byrne, E. Participatory Methods in Energy System Modelling and Planning—A Review. Renew. Sustain. Energy Rev. 2021, 151, 111504. [Google Scholar] [CrossRef]
  30. The World Bank Access to Electricity (% of Population)—Madagascar, Arab World. Available online: https://data.worldbank.org/indicator/EG.ELC.ACCS.ZS?locations=MG-1A (accessed on 12 January 2024).
  31. Mwasaru, J.; Schöne, N.; Britton, T.R. D2.4 Energy Flow Patterns for Productive Uses of Energy; ENERGICA Consortium: Modena, Italy, 2023. [Google Scholar]
  32. Siegel, S. Nonparametric Statistics. Am. Stat. 1957, 11, 13–19. [Google Scholar] [CrossRef]
  33. Sterling, T.; Anderson, M.; Brodowicz, M. High Performance Computing: Modern Systems and Practices; Elsevier: Amsterdam, The Netherlands, 2018; ISBN 978-0-12-420158-3. [Google Scholar]
  34. Schöne, N.; Greilmeier, K.; Heinz, B. Survey-Based Assessment of the Preferences in Residential Demand Response on the Island of Mayotte. Energies 2022, 15, 1338. [Google Scholar] [CrossRef]
  35. Rousseeuw, P.J. Silhouettes: A Graphical Aid to the Interpretation and Validation of Cluster Analysis. J. Comput. Appl. Math. 1987, 20, 53–65. [Google Scholar] [CrossRef]
  36. Field, A. Discovering Statistics Using IBM SPSS Statistics, 5th ed.; SAGE Publications Ltd.: Sussex, UK, 2017; ISBN 978-1-5264-4578-0. [Google Scholar]
  37. McHugh, M.L. The Chi-Square Test of Independence. Biochem. Med. 2013, 23, 143–149. [Google Scholar] [CrossRef] [PubMed]
  38. Haschek, W.; Rousseaux, C.; Wallig, M. Handbook of Toxicologic Pathology; Elsevier: Amsterdam, The Netherlands, 2002; ISBN 978-0-12-330215-1. [Google Scholar]
  39. Witzel, A. The Problem-Centered Interview. In Qualitative Forschung in der Psychologie: Grundfragen, Verfahrensweisen, Anwendungsfelder; Beltz: Weinheim, Germany, 2000; ISBN 3-407-54680-7. [Google Scholar]
  40. Steca PF166-H. Available online: https://www.steca.com/Steca-PF-166-H-PF-240-H (accessed on 17 November 2022).
  41. Hilpert, S.; Kaldemeyera, C.; Krien, U.; Günther, S.; Wingenbach, C.; Plessmann, G. The Open Energy Modelling Framework (Oemof)—A New Approach to Facilitate Open Science in Energy System Modelling. Energy Strategy Rev. 2018, 22, 16–25. [Google Scholar] [CrossRef]
  42. Kinally, C.; Antonanzas-Torres, F.; Podd, F.; Gallego-Schmid, A. Off-Grid Solar Waste in Sub-Saharan Africa: Market Dynamics, Barriers to Sustainability, and Circular Economy Solutions. Energy Sustain. Dev. 2022, 70, 415–429. [Google Scholar] [CrossRef]
  43. Renewables. Ninja Simulations of the Hourly Power Output from Wind and Solar Power Plants. Available online: https://www.renewables.ninja (accessed on 11 July 2022).
  44. Agsol. Micromill; Agsol: Kikuyu, Kenya, 2023. [Google Scholar]
  45. Jacobson, M.Z.; Jadhav, V. World Estimates of PV Optimal Tilt Angles and Ratios of Sunlight Incident upon Tilted and Tracked PV Panels Relative to Horizontal Panels. Sol. Energy 2018, 169, 55–66. [Google Scholar] [CrossRef]
  46. Pfenninger, S.; Staffell, I. Long-Term Patterns of European PV Output Using 30 Years of Validated Hourly Reanalysis and Satellite Data. Energy 2016, 114, 1251–1265. [Google Scholar] [CrossRef]
  47. Yilmaz, S.; Xu, X.; Cabrera, D.; Chanez, C.; Cuony, P.; Patel, M.K. Analysis of Demand-Side Response Preferences Regarding Electricity Tariffs and Direct Load Control: Key Findings from a Swiss Survey. Energy 2020, 212, 118217. [Google Scholar] [CrossRef]
  48. Vaughn, L.M.; Jacquez, F. Participatory Research Methods—Choice Points in the Research Process. J. Particip. Res. Methods 2020, 1. [Google Scholar] [CrossRef]
  49. Terrapon-Pfaff, J.; Gröne, M.-C.; Dienst, C.; Ortiz, W. Productive Use of Energy—Pathway to Development? Reviewing the Outcomes and Impacts of Small-Scale Energy Projects in the Global South. Renew. Sustain. Energy Rev. 2018, 96, 198–209. [Google Scholar] [CrossRef]
  50. Khandker, S.R.; Barnes, D.F.; Samad, H.A. Welfare Impacts of Rural Electrification: A Case Study from Bangladesh; World Bank Policy Research Working Paper 4859; World Bank: Washington, DC, USA, 2009. [Google Scholar]
  51. Rao, N.D.; Agarwal, A.; Wood, D. Impacts of Small-Scale Electricity Systems: A Study of Rural Communities in India and Nepal; World Resources Institute: Washington, DC, USA, 2016. [Google Scholar]
  52. Poor People’s Energy Outlook 2012; Practical Action Publishing: Rugby, UK, 2012.
Figure 1. Conceptual considerations for the integration of PUE and household electricity demands in off-grid energy system planning.
Sustainability 16 03442 g001
Figure 2. Methodological workflow of the analysis.
Sustainability 16 03442 g002
Figure 3. Scheme of the matchmaking performed, matching different residential electricity demand profile compositions (C1–C5) with different PUE assets (Base, PUE1–PUE3). Each electricity demand profile comprises five residential loads.
Sustainability 16 03442 g003
Figure 4. Seasonal variation in the average maximum peak power demand per household and average daily electricity consumption.
Sustainability 16 03442 g004
Figure 5. Representative daily electricity consumption profile of each household in a cluster and the average cluster profile, highlighted in bold.
Sustainability 16 03442 g005
Figure 6. Annual energy generation (kWh/year) (left) and share of energy consumption of residential loads, PUE loads and excess generation across the different PUE integration scenarios for the example of the representative demand residential load profile set.
Sustainability 16 03442 g006
Figure 7. Economic results for the PUE integration scenarios across the different residential load composition sets.
Sustainability 16 03442 g007
Figure 8. Share of energy system asset costs of total annualized costs for the different residential load profile sets and PUE integration scenarios.
Sustainability 16 03442 g008
Figure 9. LCOS and percentage share of excess electricity for the scenarios considered in the relevant case study.
Sustainability 16 03442 g009
Figure 10. Simplified schematic representation of community value flows when adopting a freezer in a village. For an analogous description of changes in community dynamics for an electrified rice processing machine, see [31].
Sustainability 16 03442 g010
Table 3. Evolution in the daily average energy consumption and peak power load per household.
YearAverage Daily Household Electricity Consumption [Wh]Annual Change in Average Daily Electricity Consumption [%]Average Daily Maximum Household Power Demand [W]Annual Change in Maximum Average Power Consumption [%]
20188.16-2.26-
201921.88168.272.25−0.75
202035.4762.112.270.92
202150.6242.722.9932.11
Table 4. Socio-economic correlation with cluster groups. EC = Expected count, C = Count. Statistically significant at p-value confidence level = 0.05. * Statistically significant at p-value confidence level = 0.1.
Variables Cluster 0Cluster 1Cluster 2χ2dfFisher’s Exact Testp-ValueCramer’s V
CECCECCEC
Tariff Group
EcoYes05.73322.615.721.1722 <0.0010.445
No1812.33848.41712.3
Eclairage PlusYes94.71718.624.77.58526.980.0250.275
No913.35452.41613.3
MultimediaYes724812.216.654212.370.0010.395
No111667631716
Public LightingYes021811254.137237.199<0.0010.711
No18167063716
Tariff SwitchYes1151719.92512.92 0.0020.347
No7135251.11613
Appliance Ownership
LED BulbYes1614.16155.7714.120.201216.635<0.0010.435
No23.91015.3113.9
LED SpotYes021811254.137237.199<0.0010.711
No18167063716
USB Phone ChargerYes158.93135.278.910.021210.1990.0060.306
No39.14035.8119.1
12 V Plug Yes105.72122.635.76.7492 0.0340.251
No812.35048.41512.3
LED Bulb Quantity023.91015.3113.940.8831235.687<0.0010.437
167.94031.217.9
2441415.964
331.244.601.2
410.732.700.7
510.200.700.2
810.200.700.2
Demographic Variable
Number of Children *012.91310.911.316.175813.2830.0650.31
184.61617.402
234.41916.711.9
333.61113.851.6
410.622.200.3
Job Group
TraderYes95.41714.805.813.2632 0.0010.429
No69.62426.21610.2
Employee *Yes41.744.601.85.75124.9590.0560.283
No1113.33736.41614.2
Public LightingYes02.516.8112.740.226231.89<0.0010.747
No1512.54034.2513.3
Disclaimer/Publisher’s Note: The statements, opinions and data contained in all publications are solely those of the individual author(s) and contributor(s) and not of MDPI and/or the editor(s). MDPI and/or the editor(s) disclaim responsibility for any injury to people or property resulting from any ideas, methods, instructions or products referred to in the content.

