

Physical Model Test on the Deformation and Fracturing Process of Underground Research Laboratory during Excavation and Overloading Test
 ,
,
Abstract
:1. Introduction
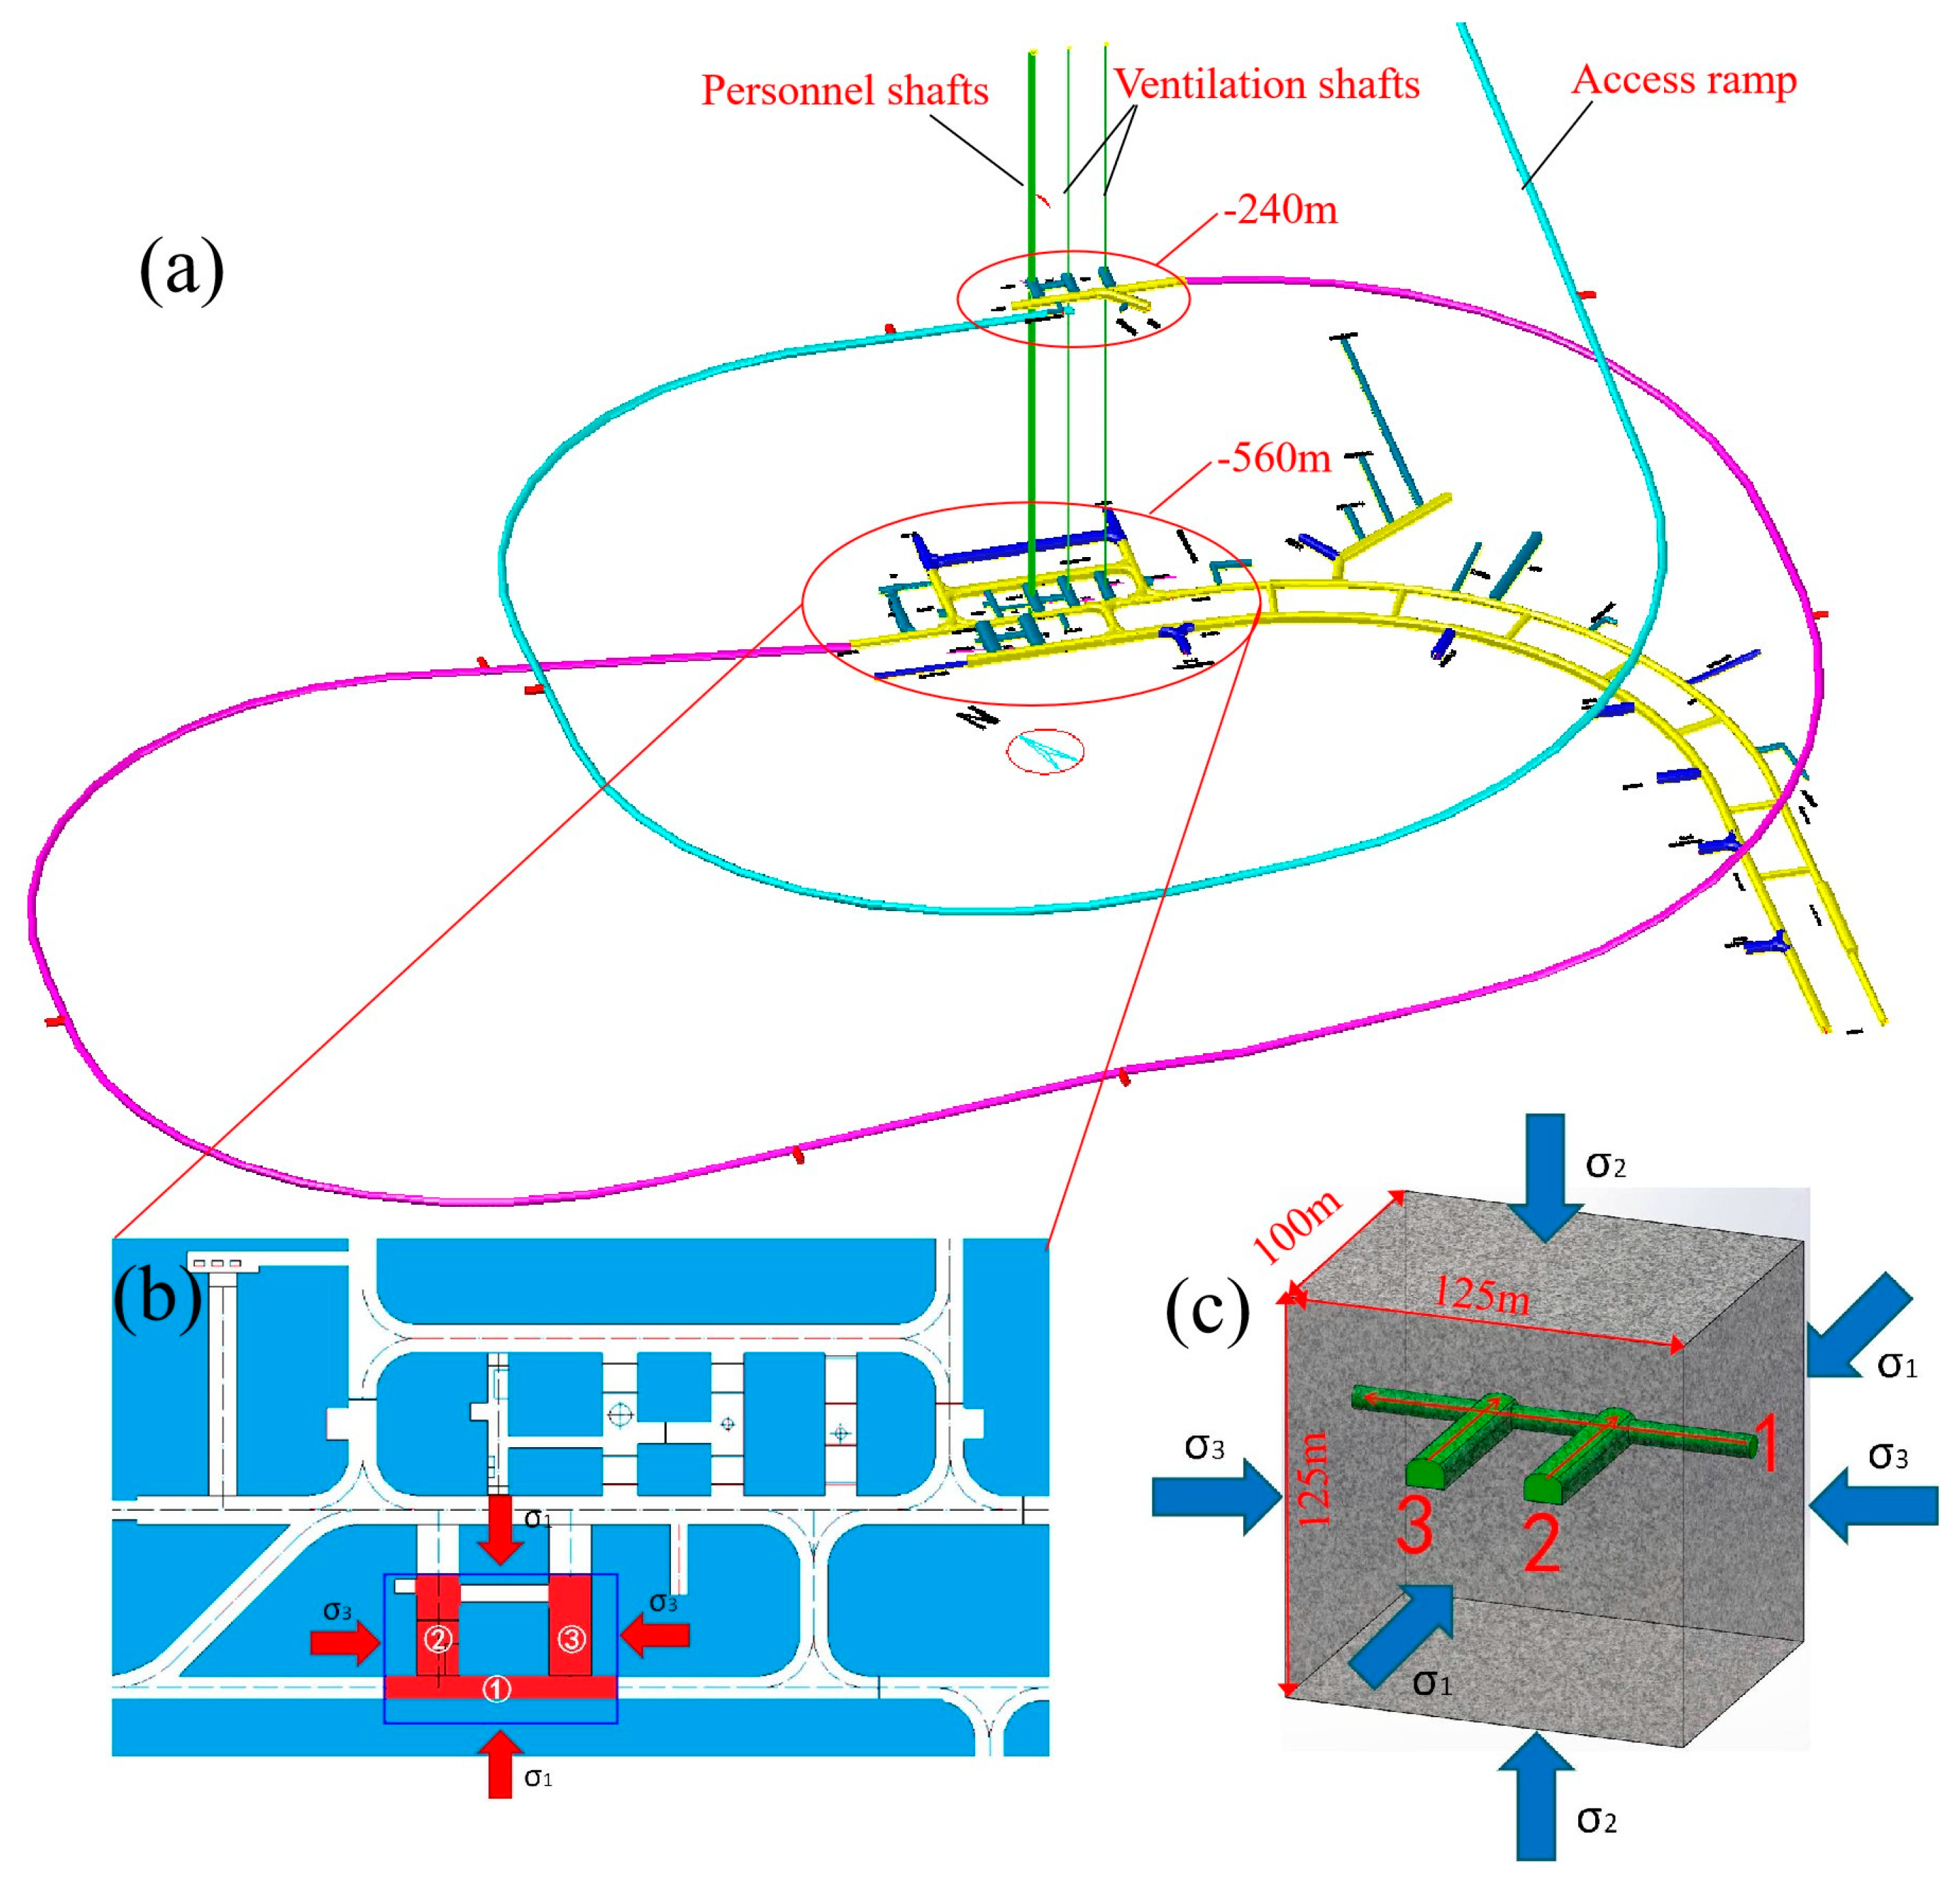
2. Project Overview
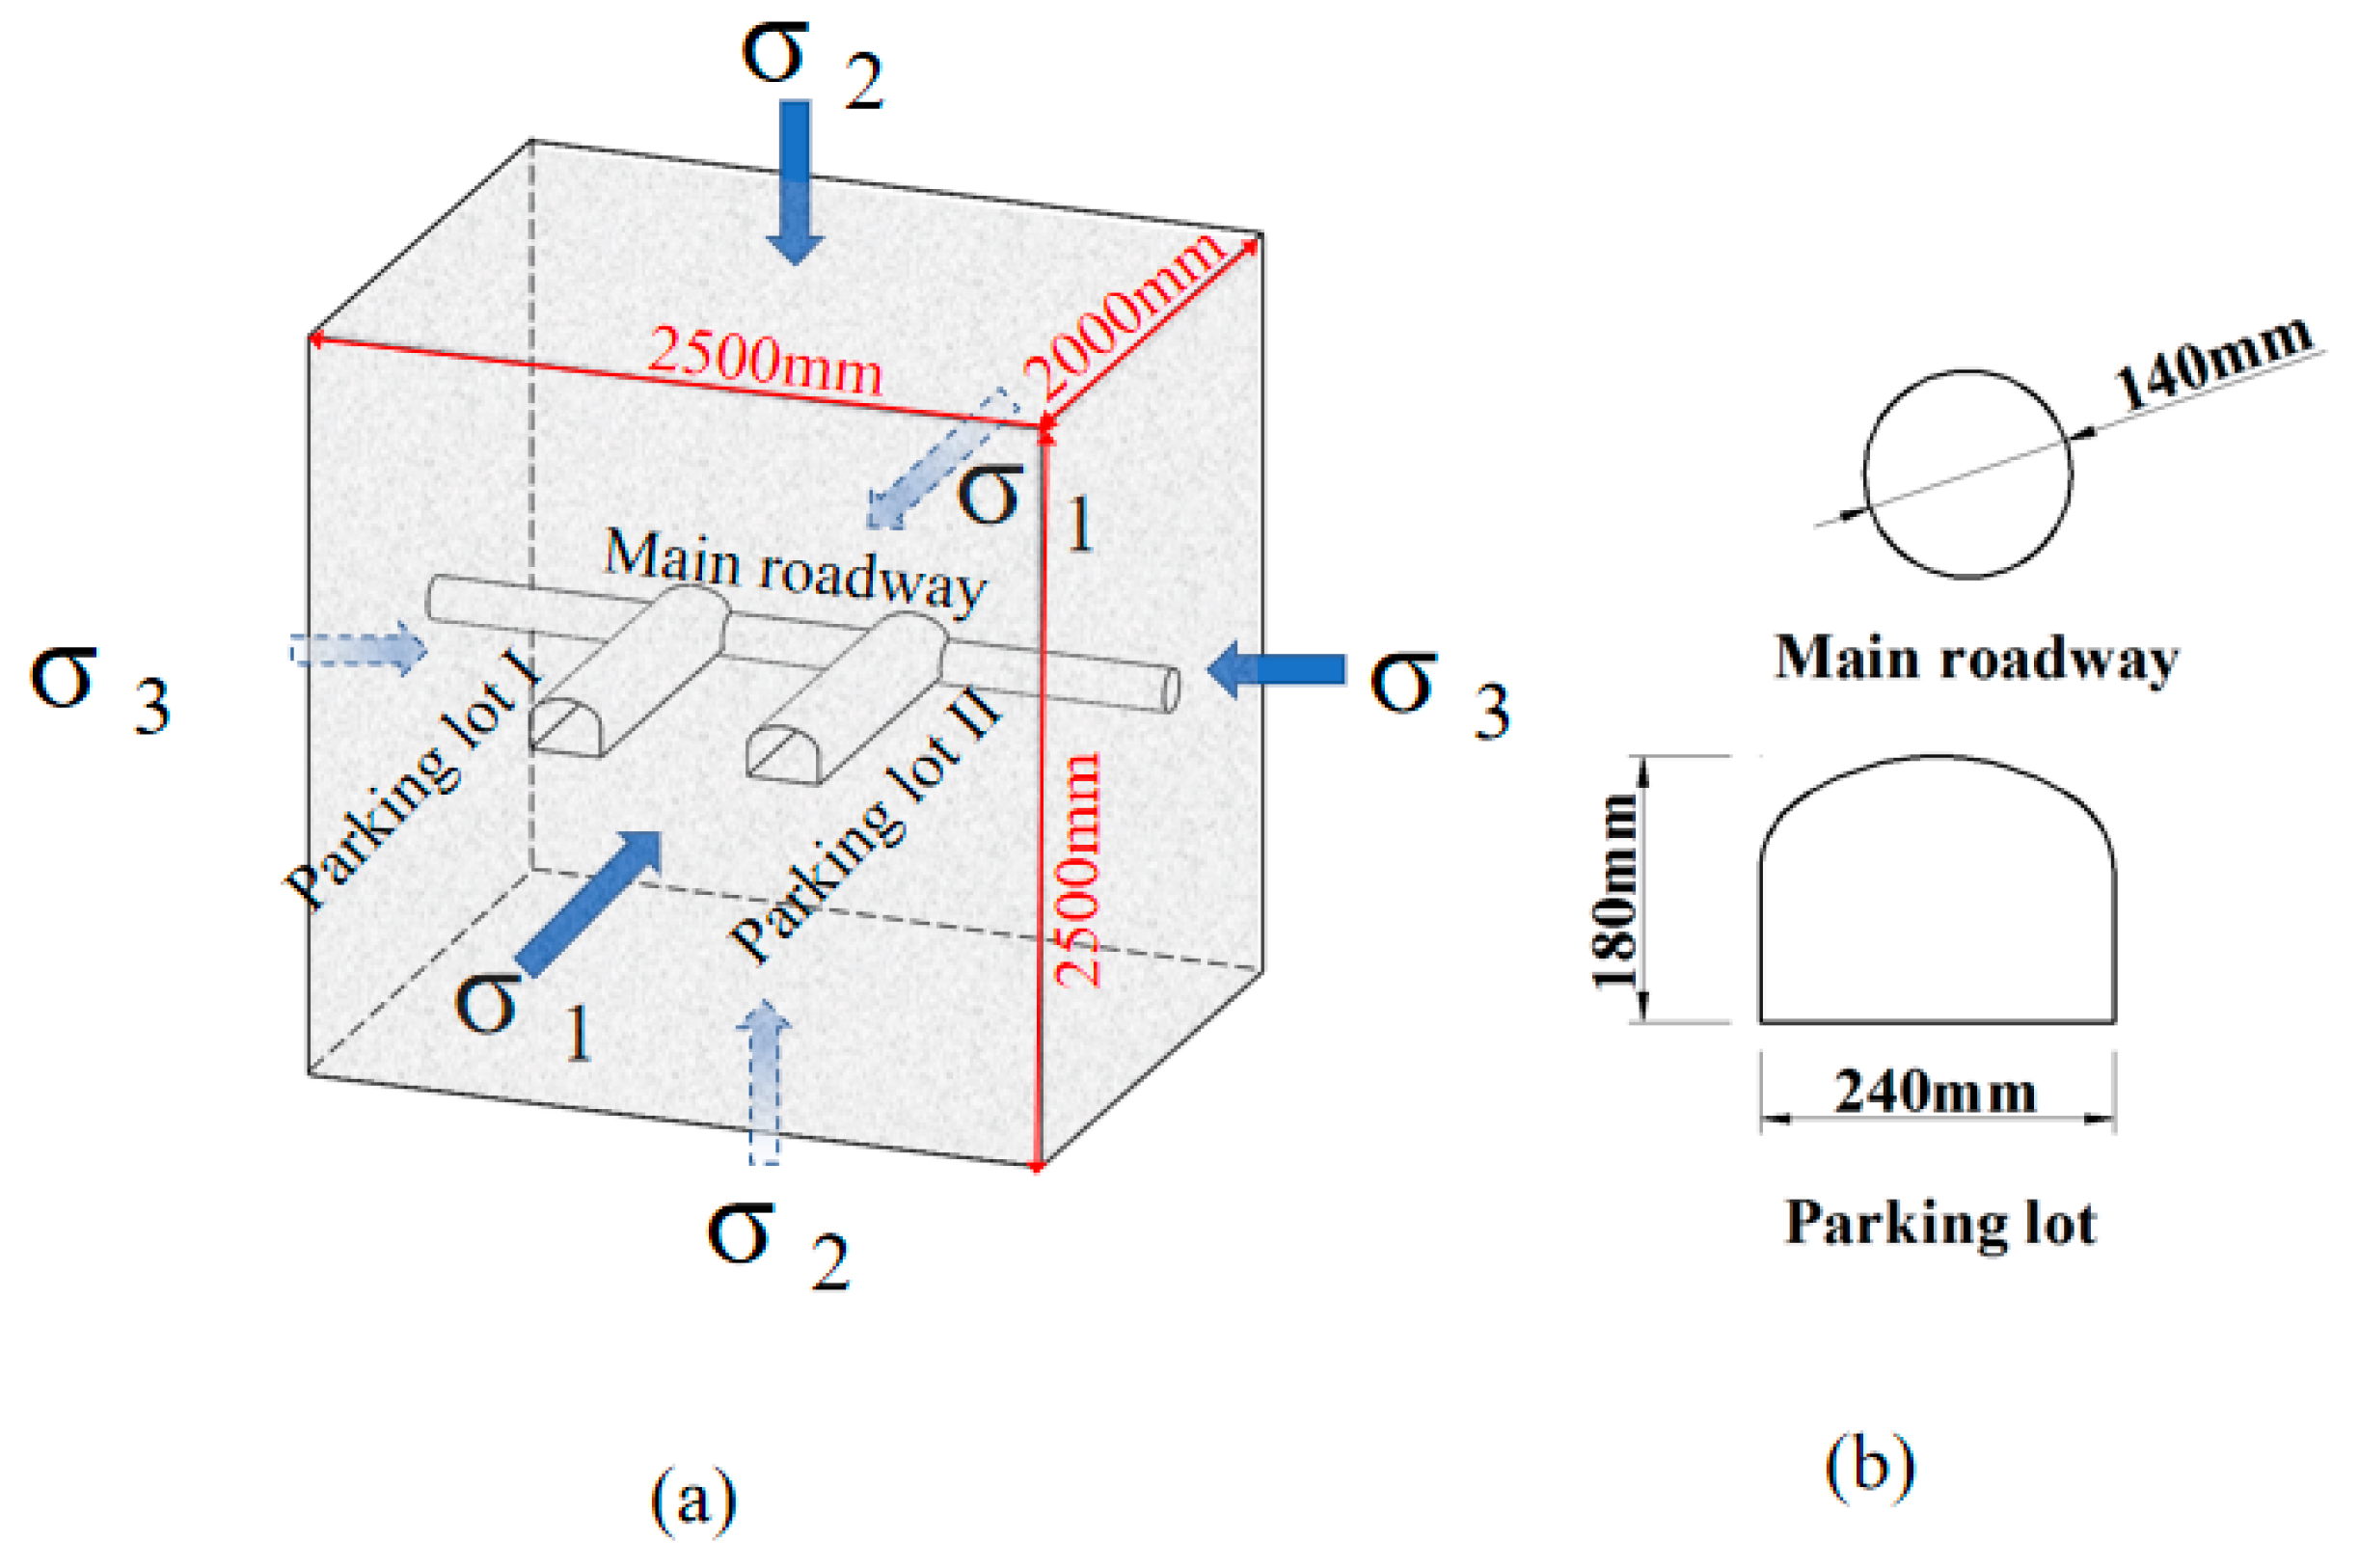
3. Physical Model Test
3.1. Similarity Principles
3.2. Development of the Similar Materials
3.2.1. Similar Materials of Surrounding Rock
3.2.2. Simulation of the Support
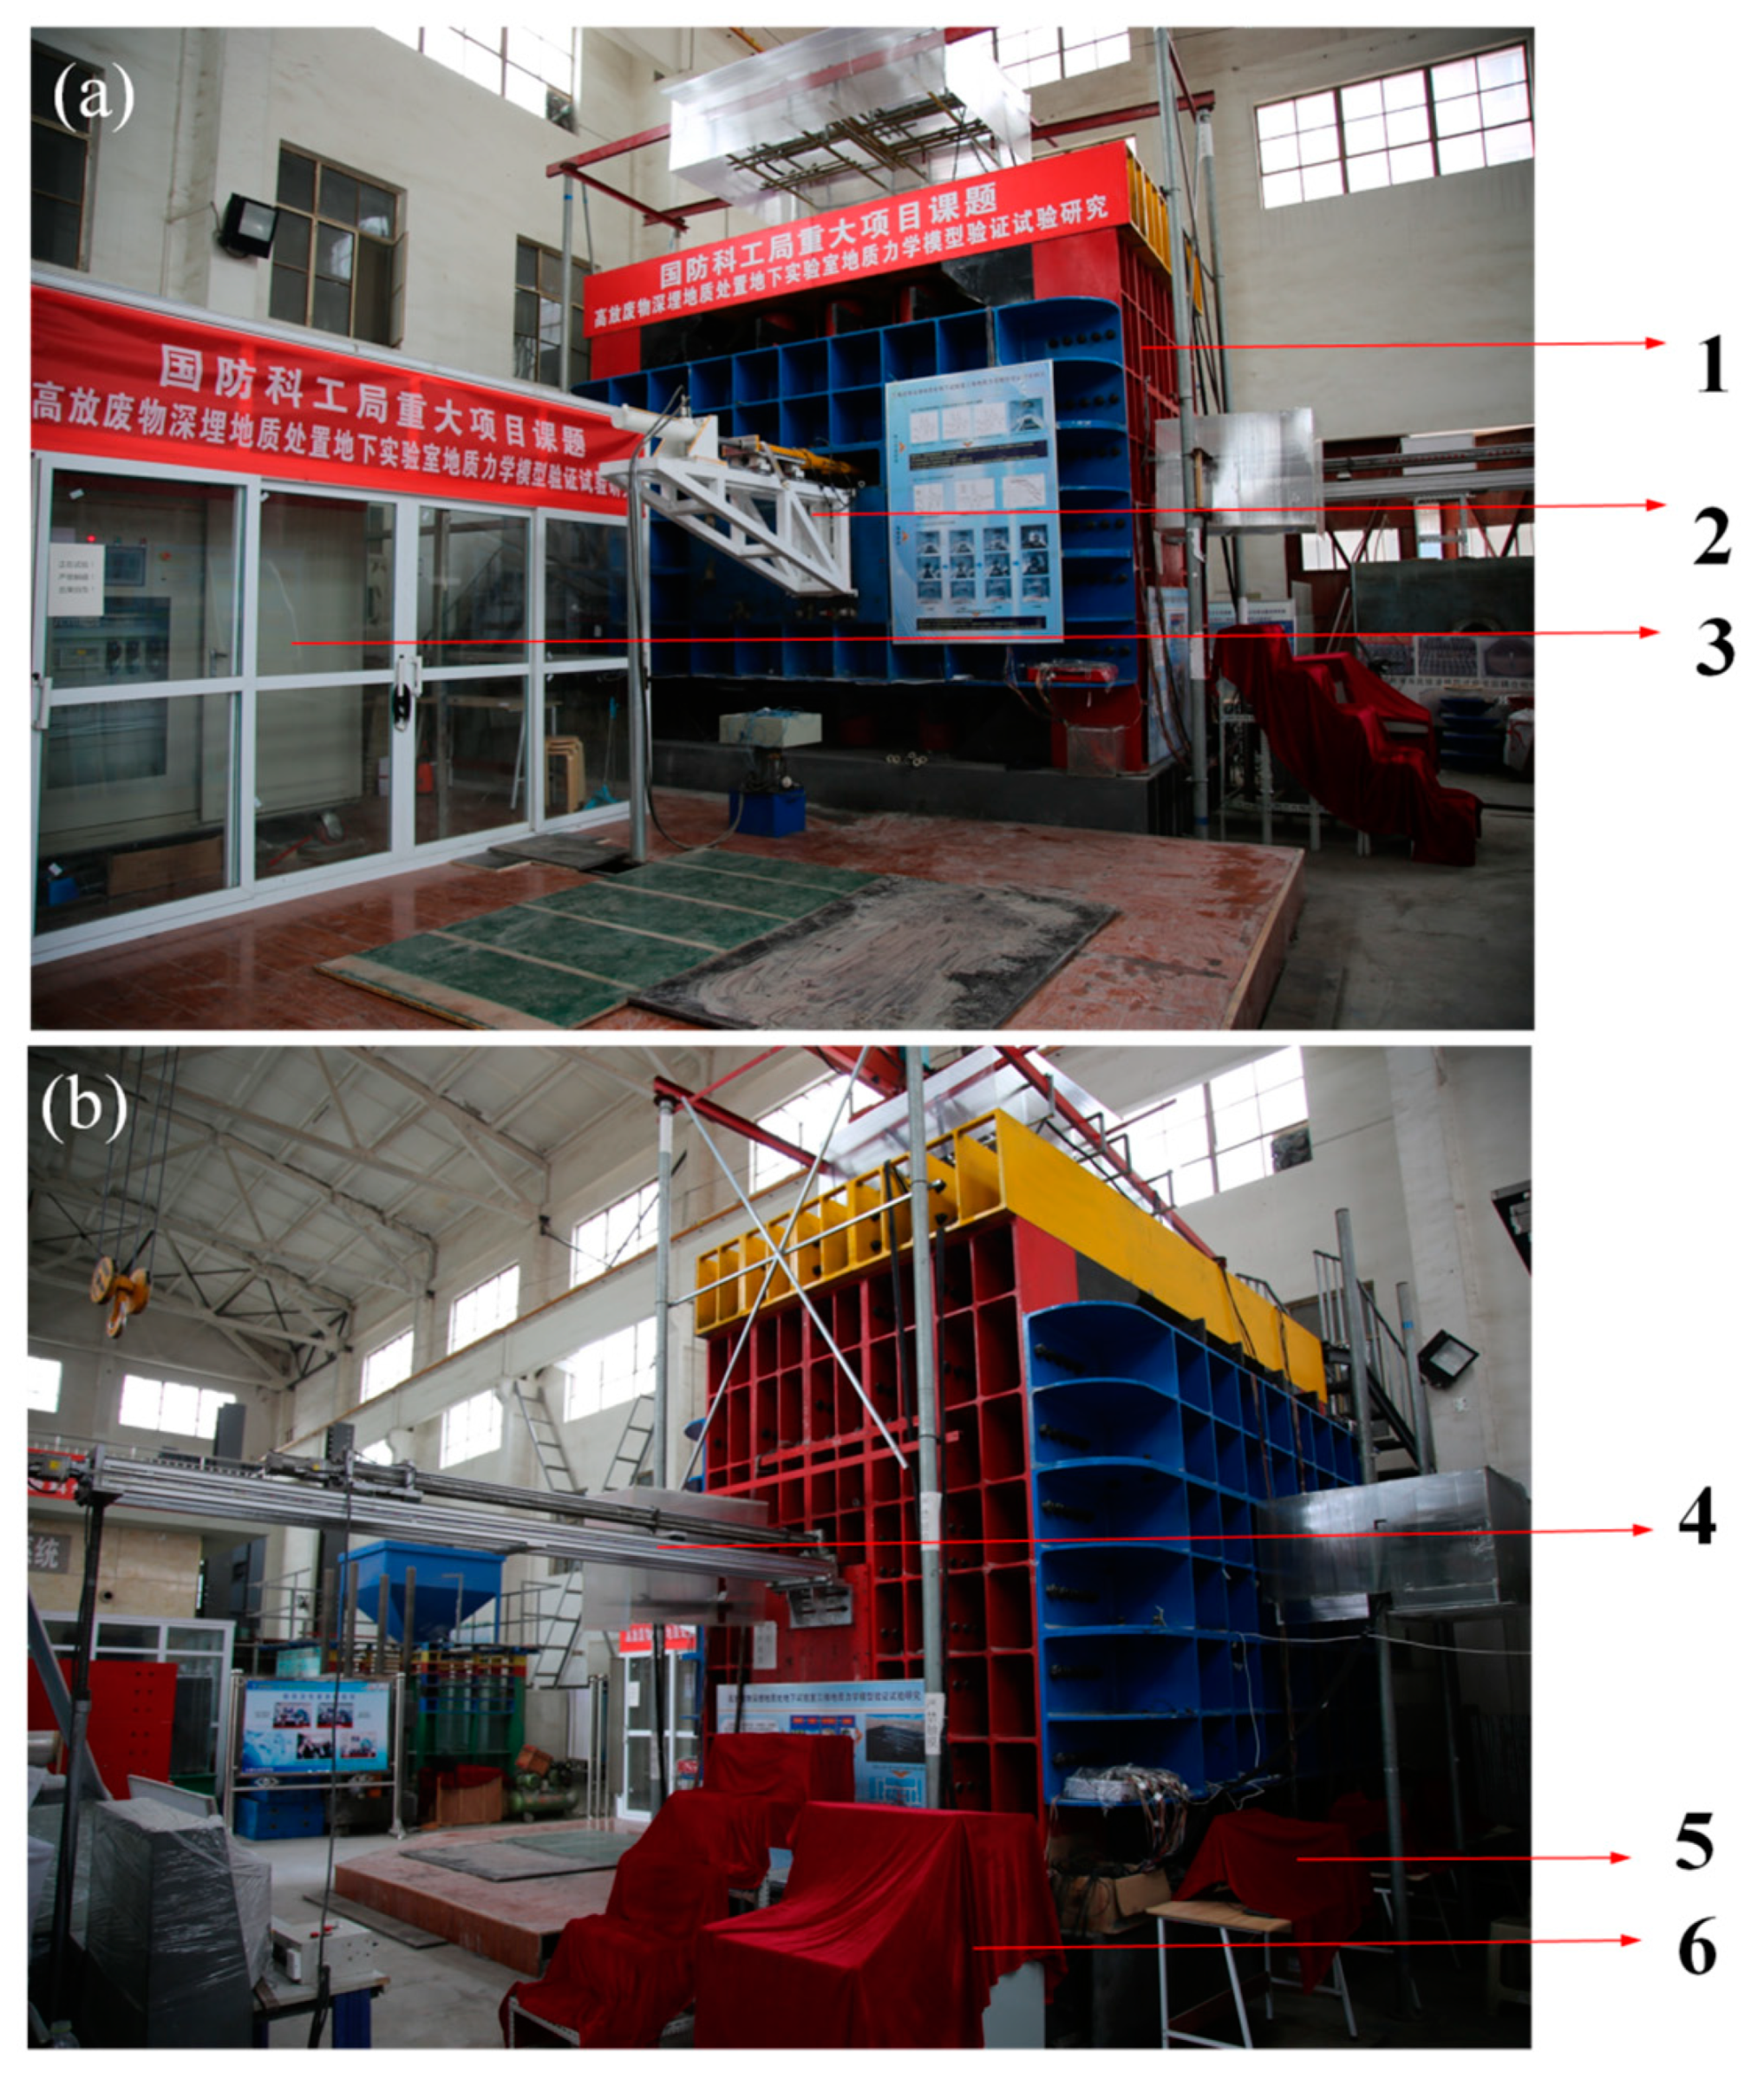
3.3. Construction of the Physics Model
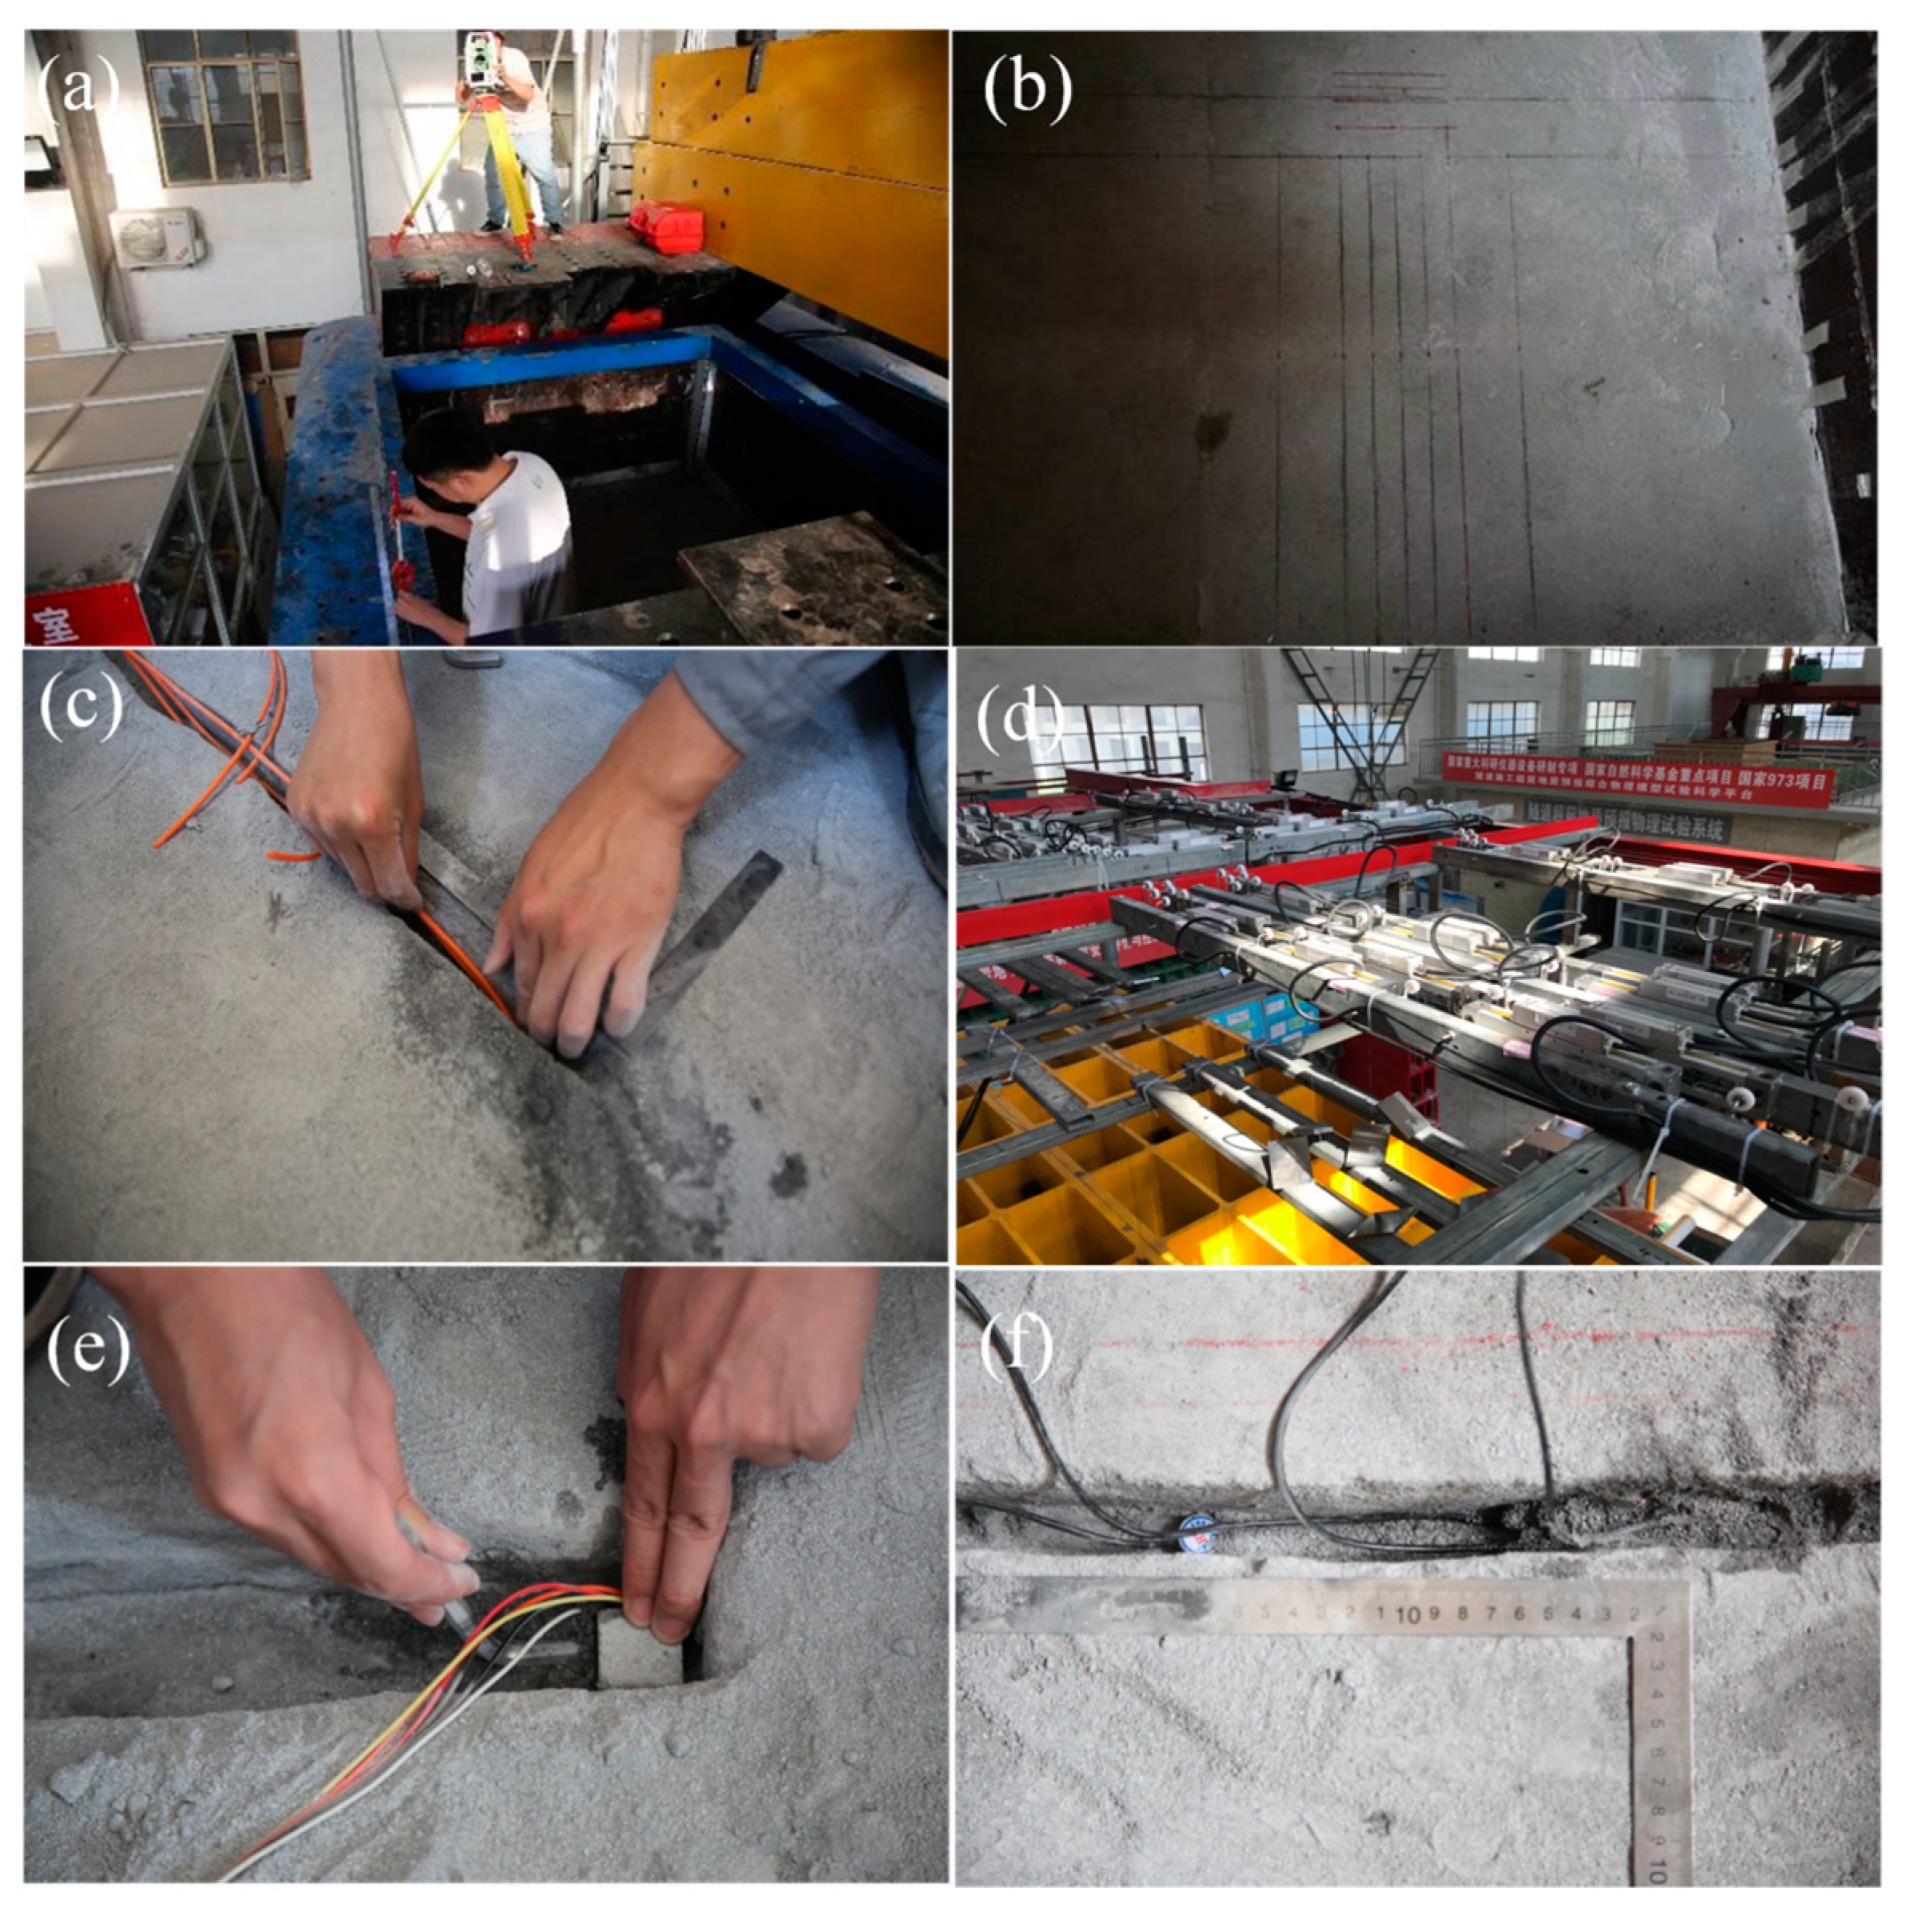
3.3.1. Construction Procedures
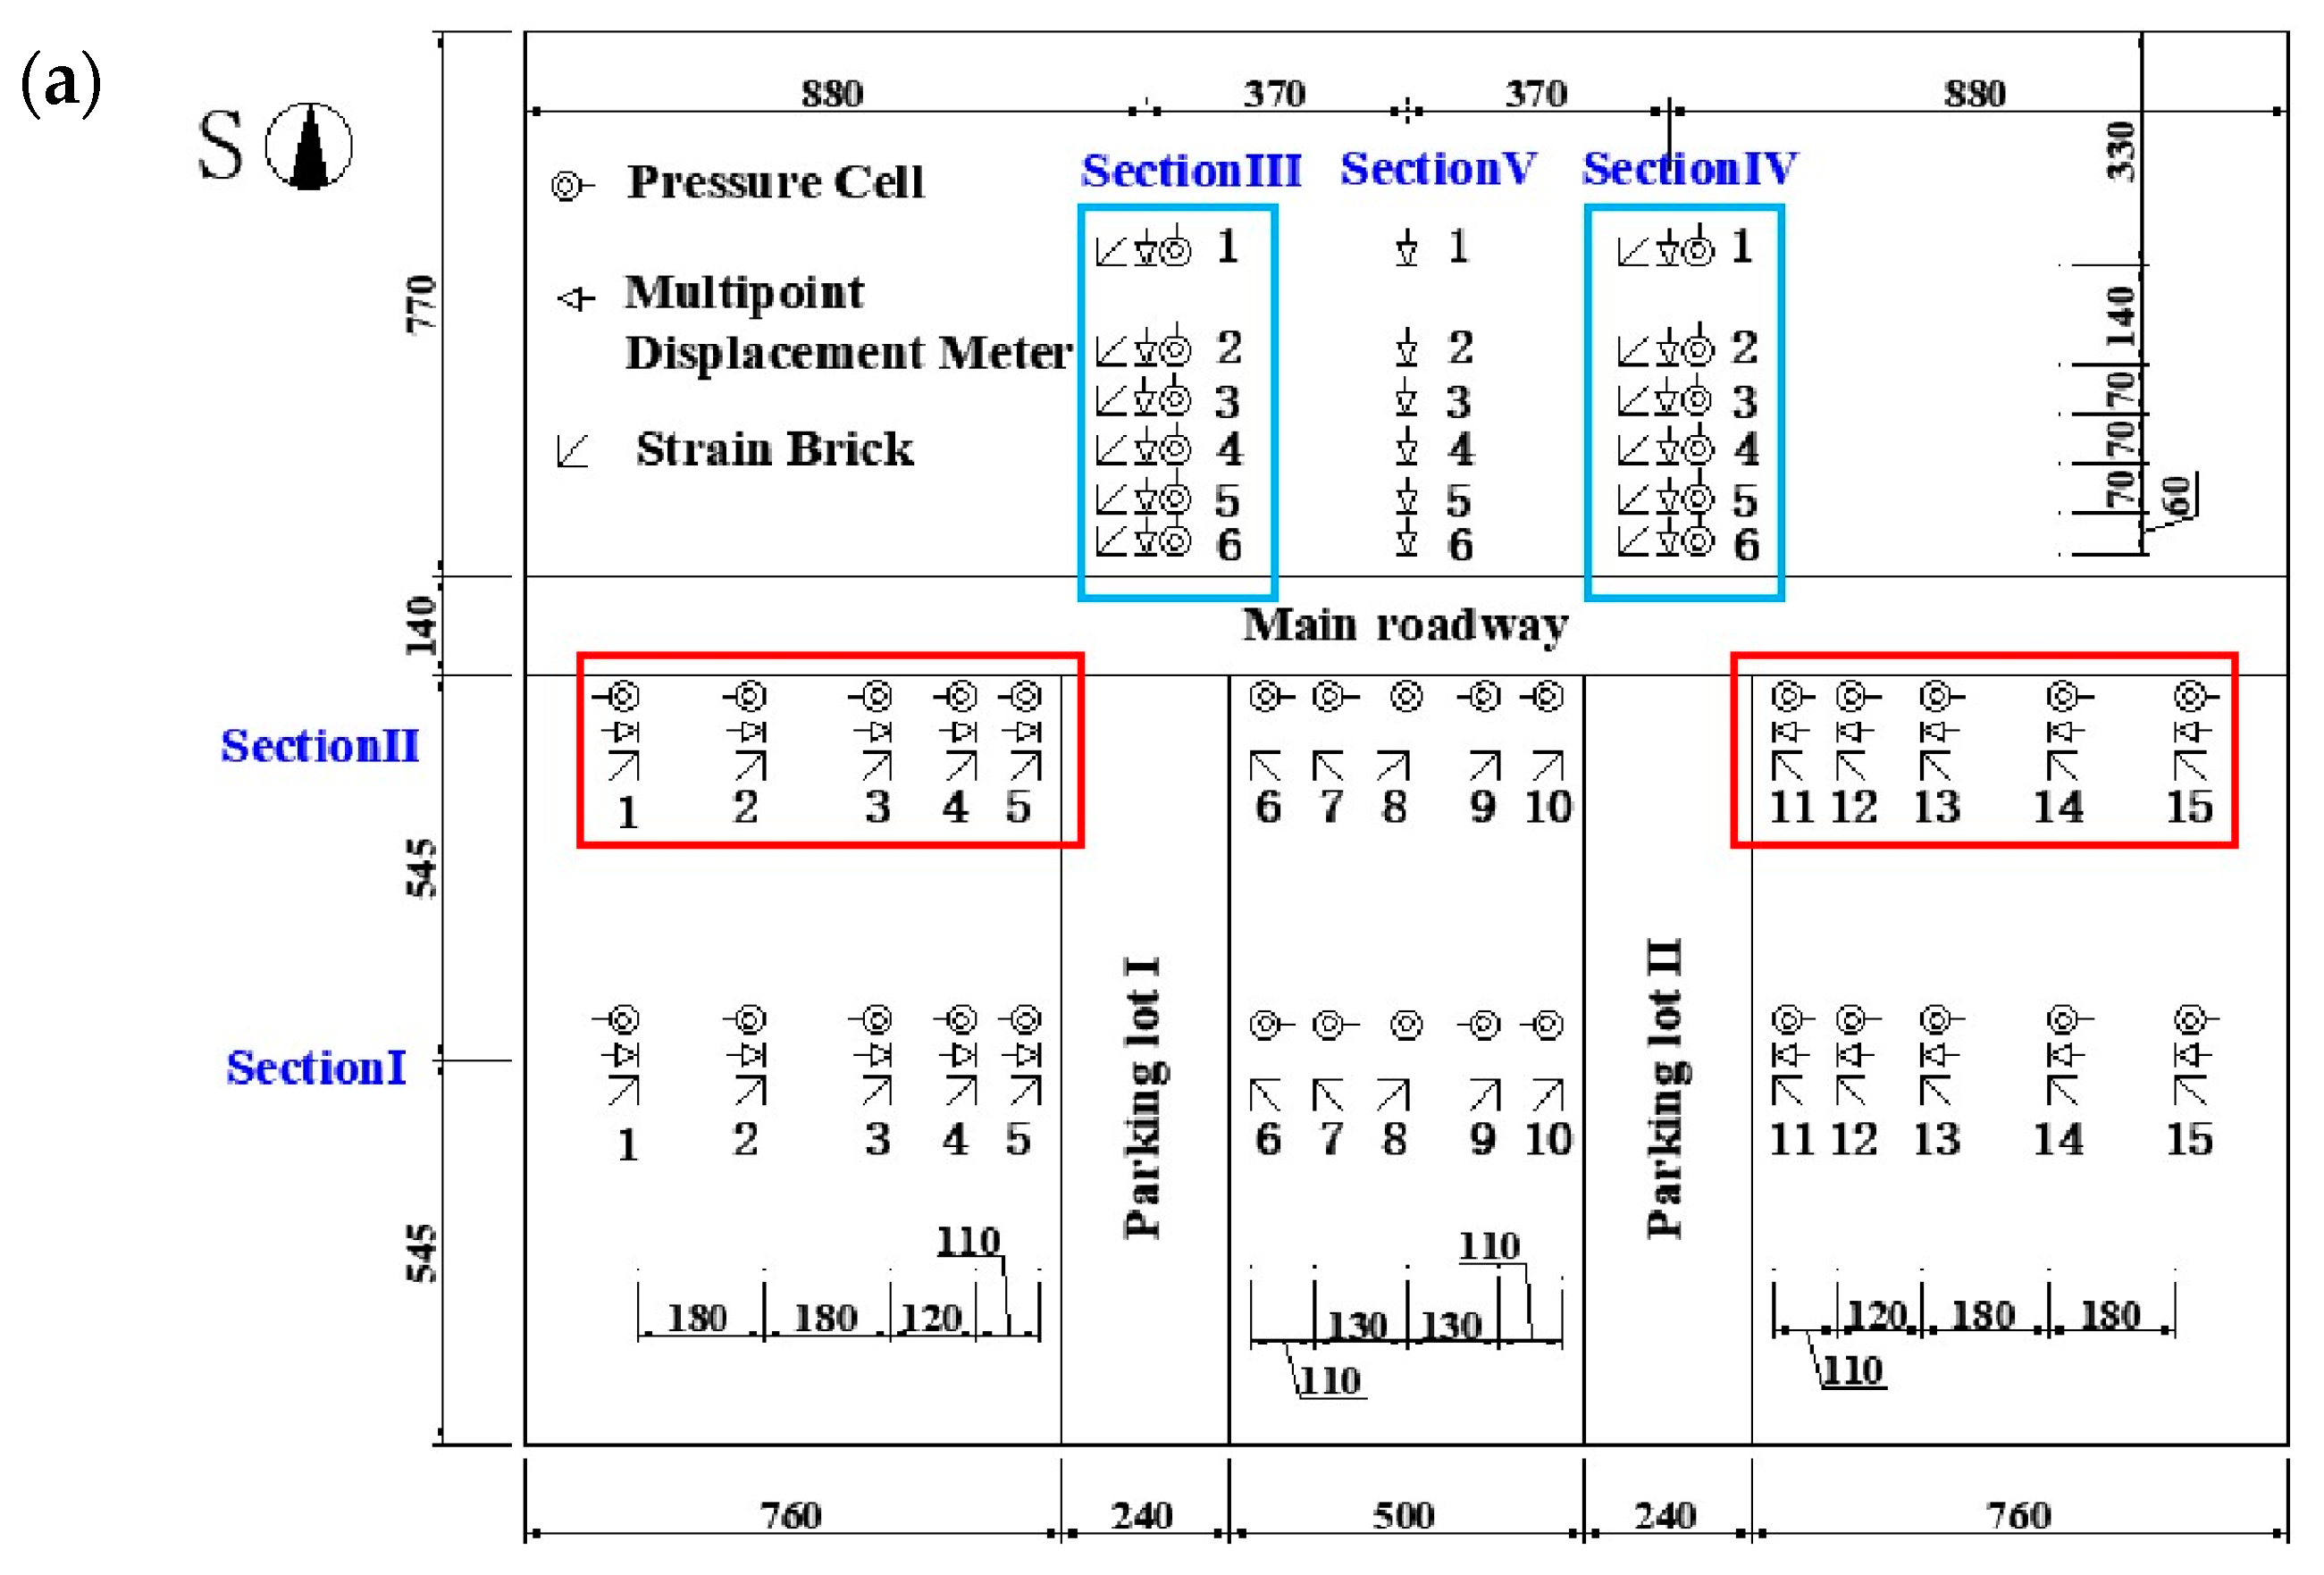
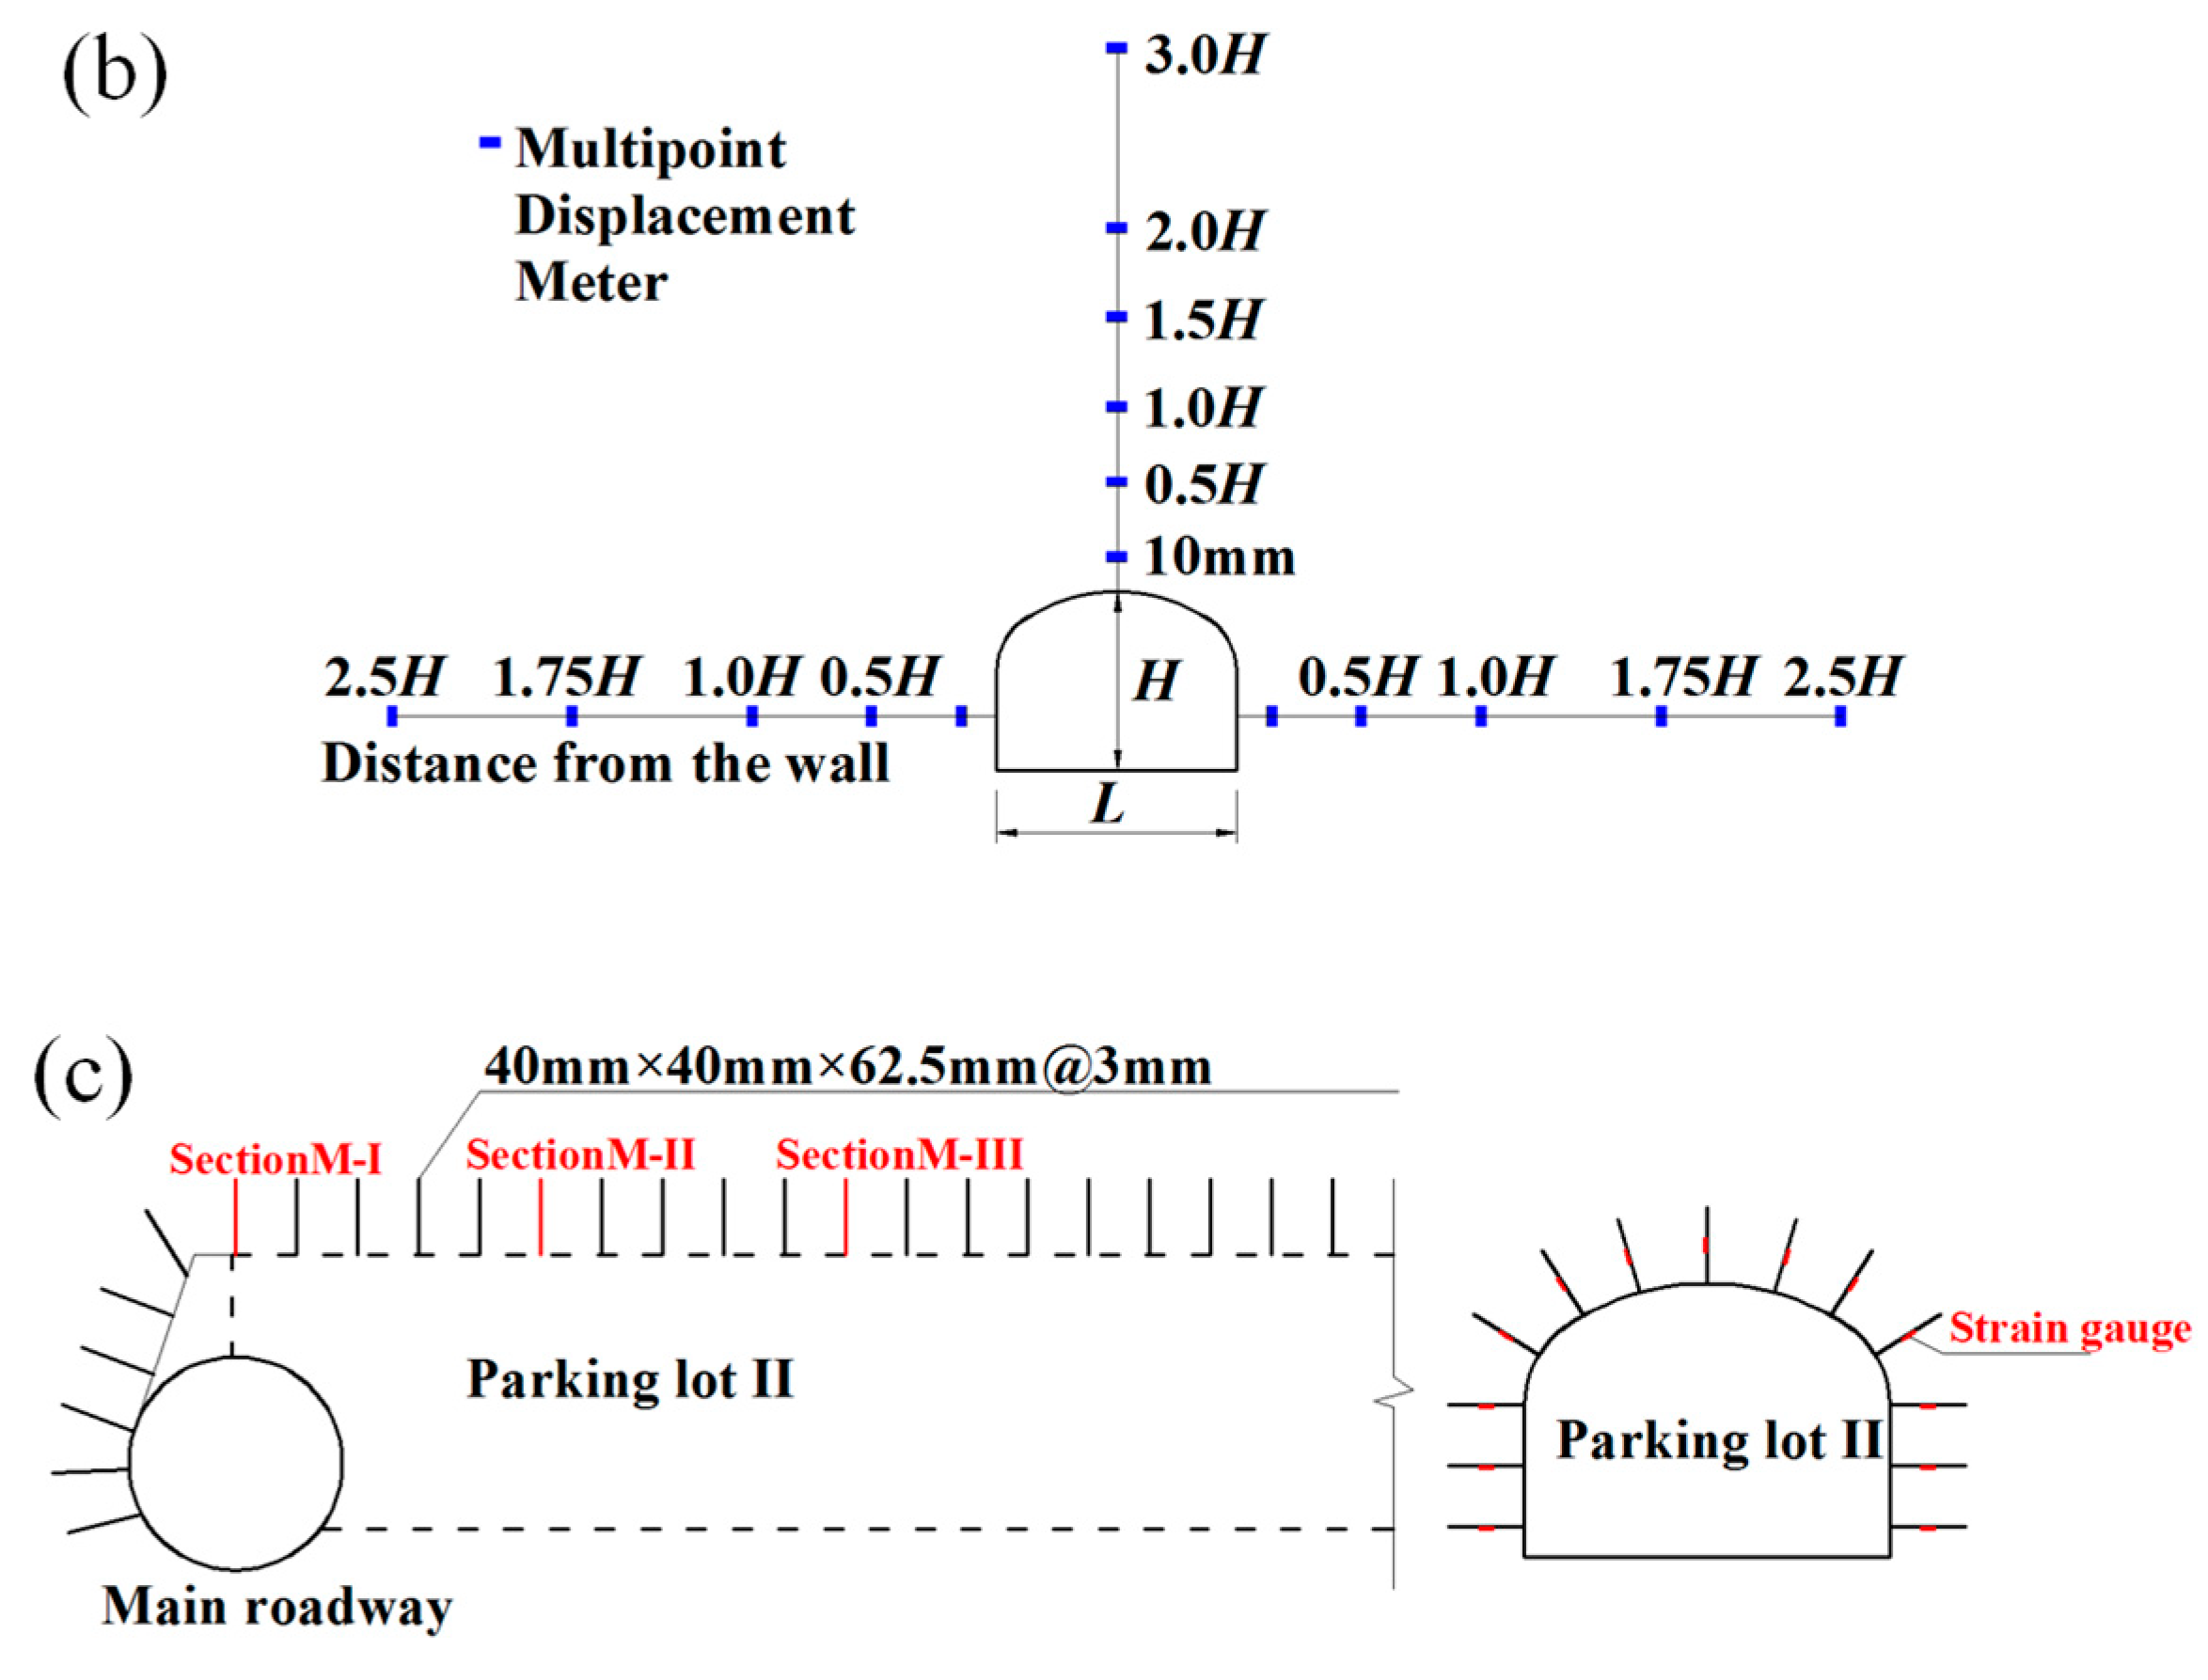
3.3.2. Installation of the Monitoring Sensors
3.4. Model Excavation
3.5. Test Results
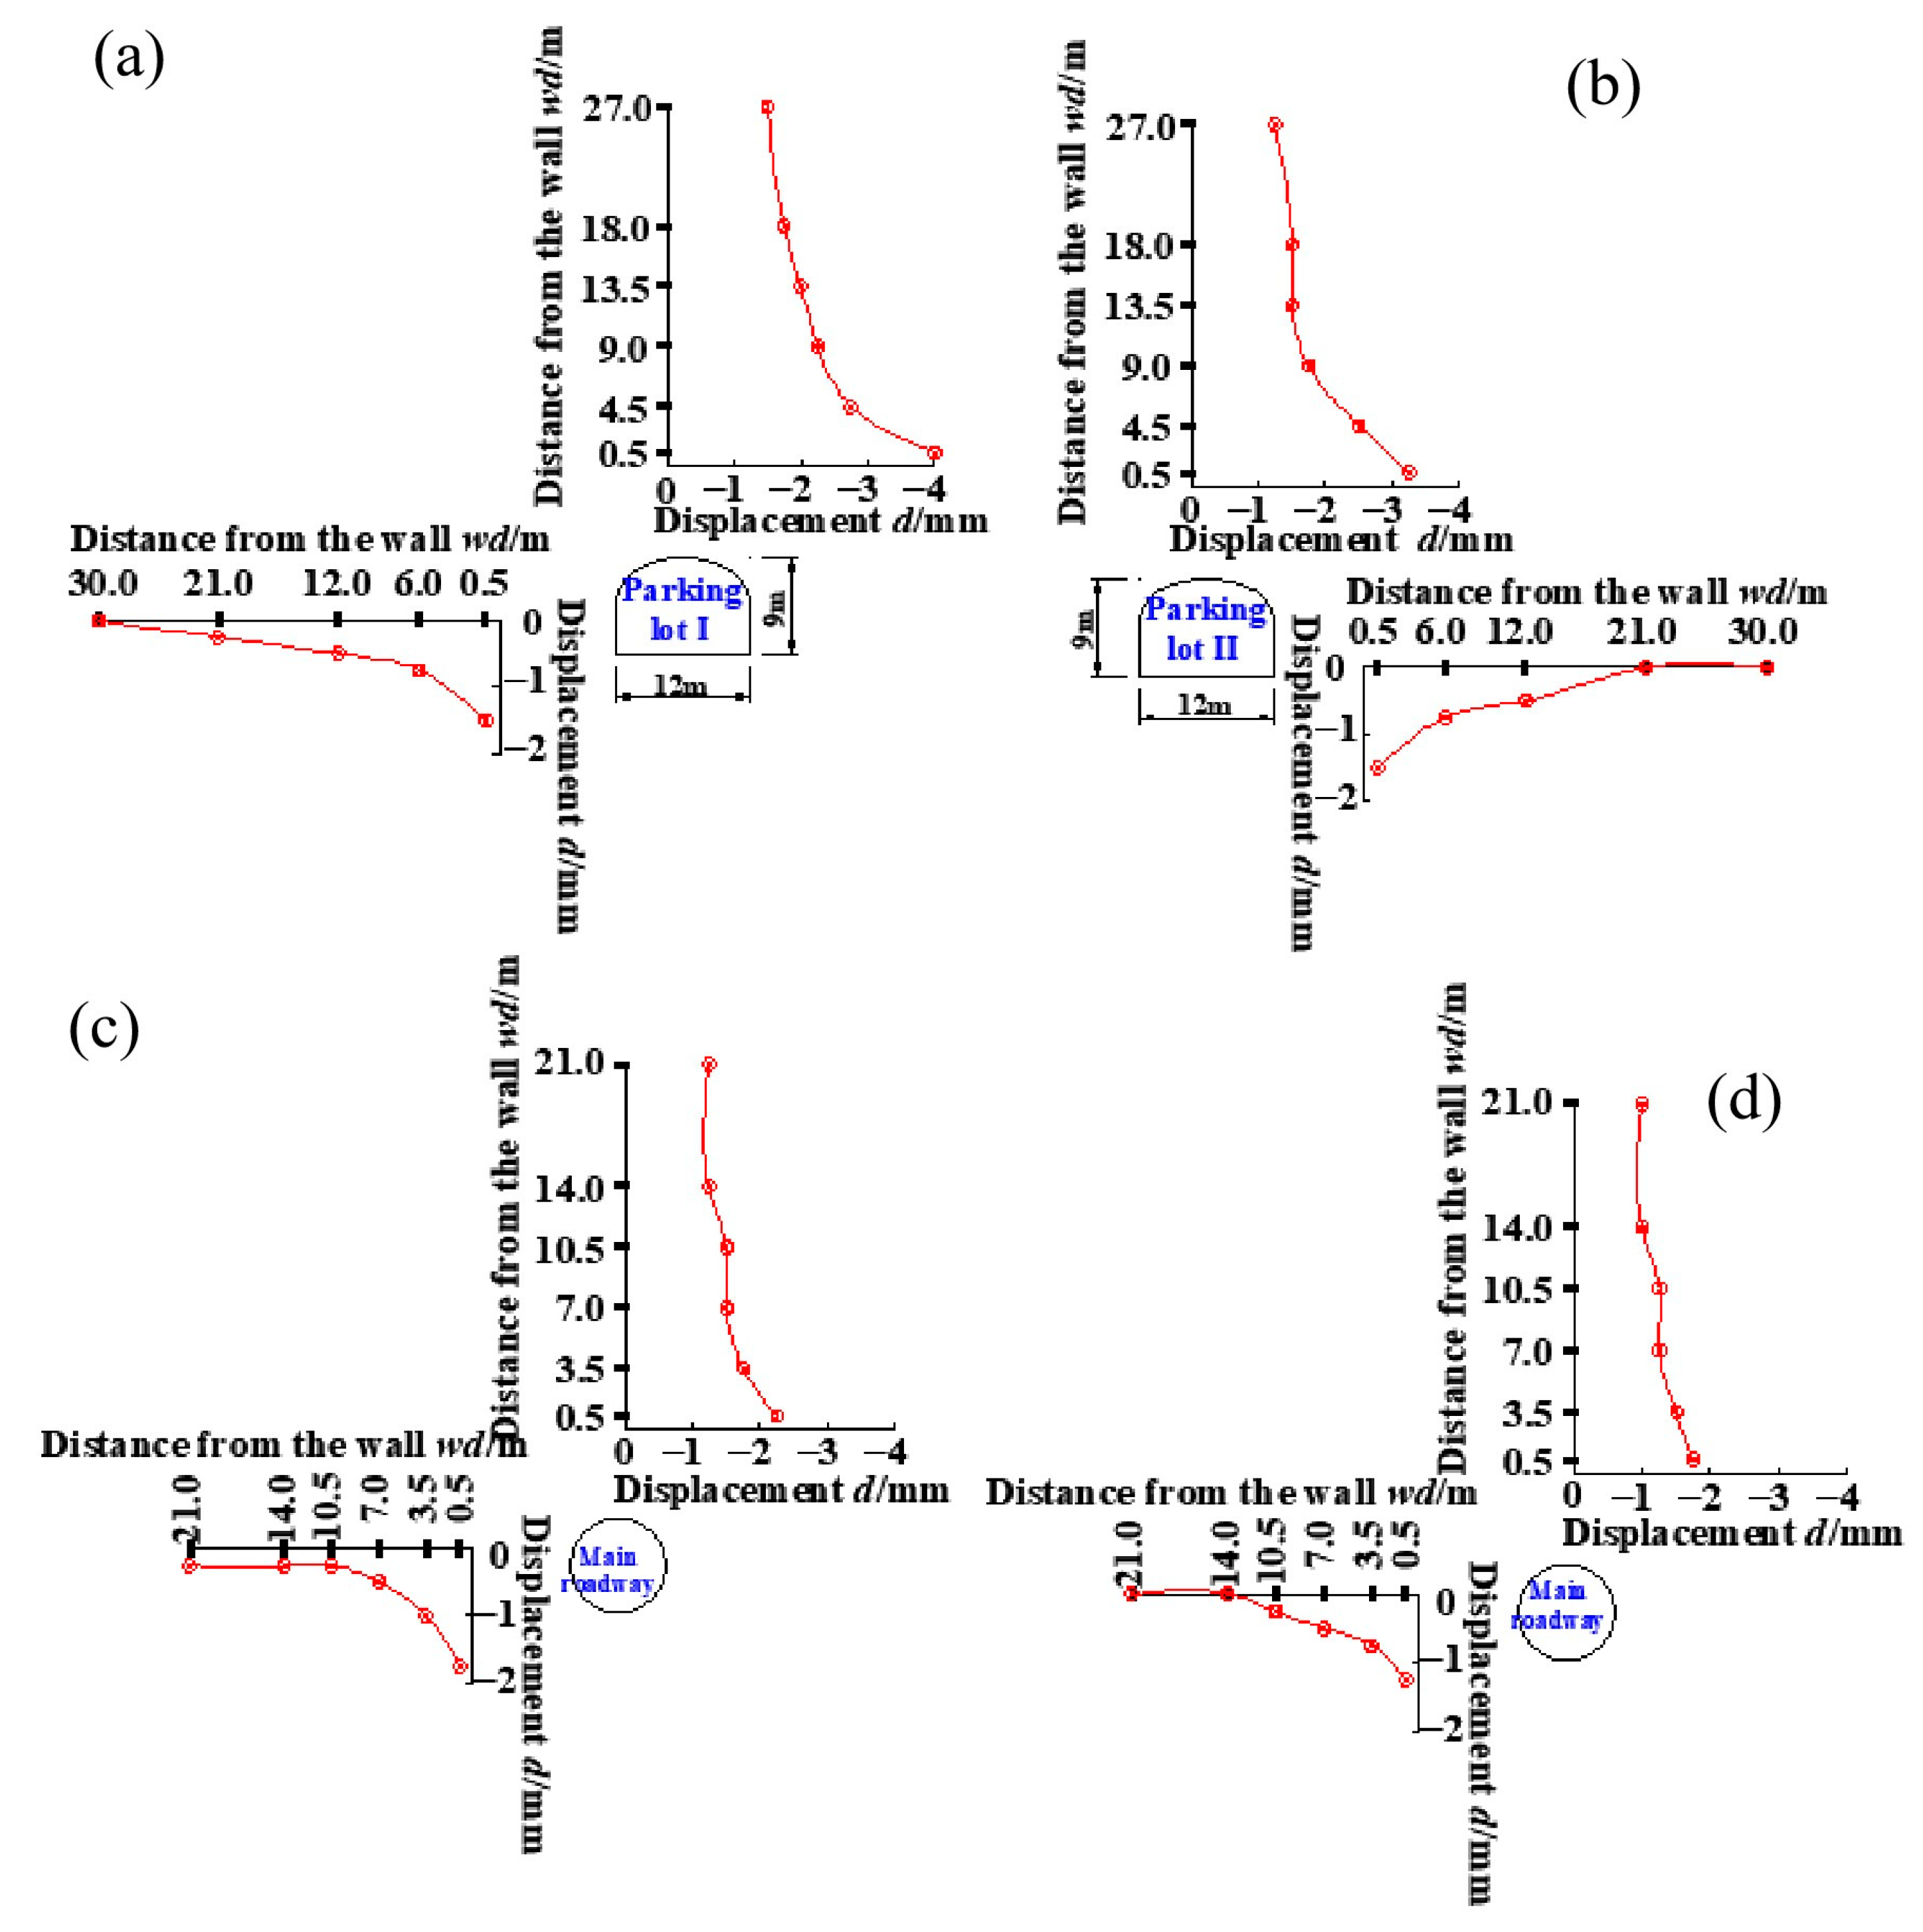
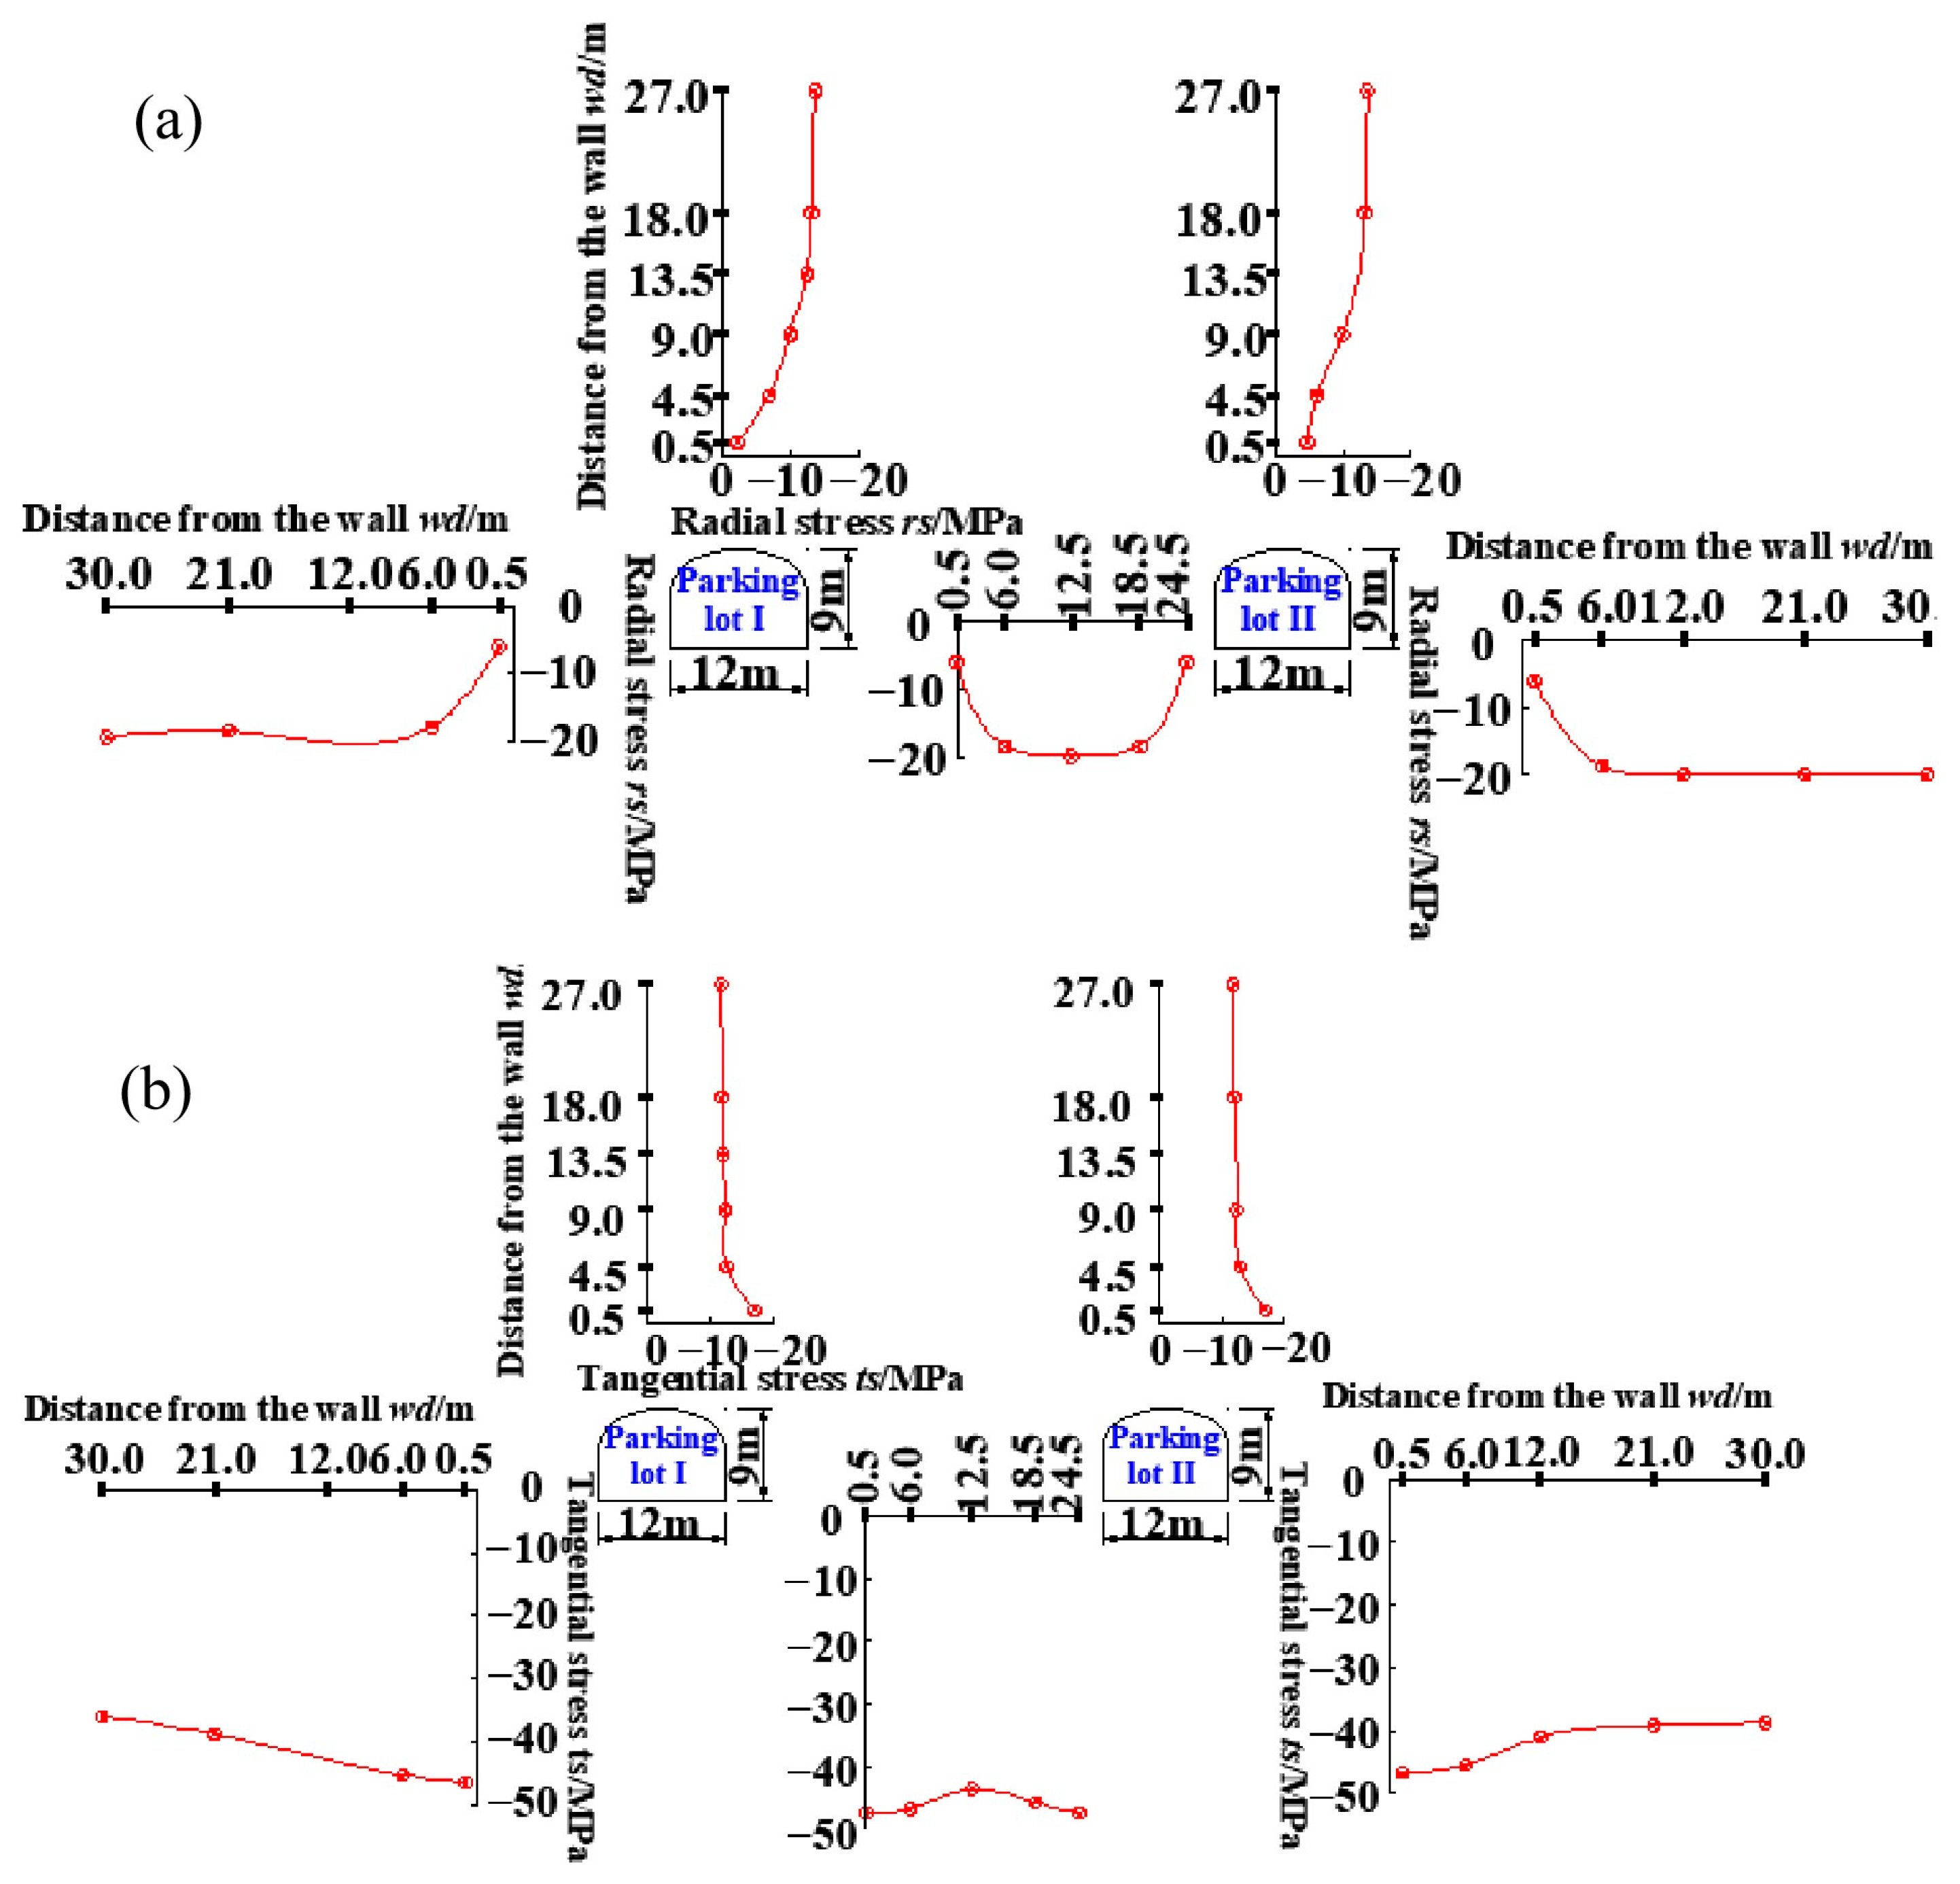
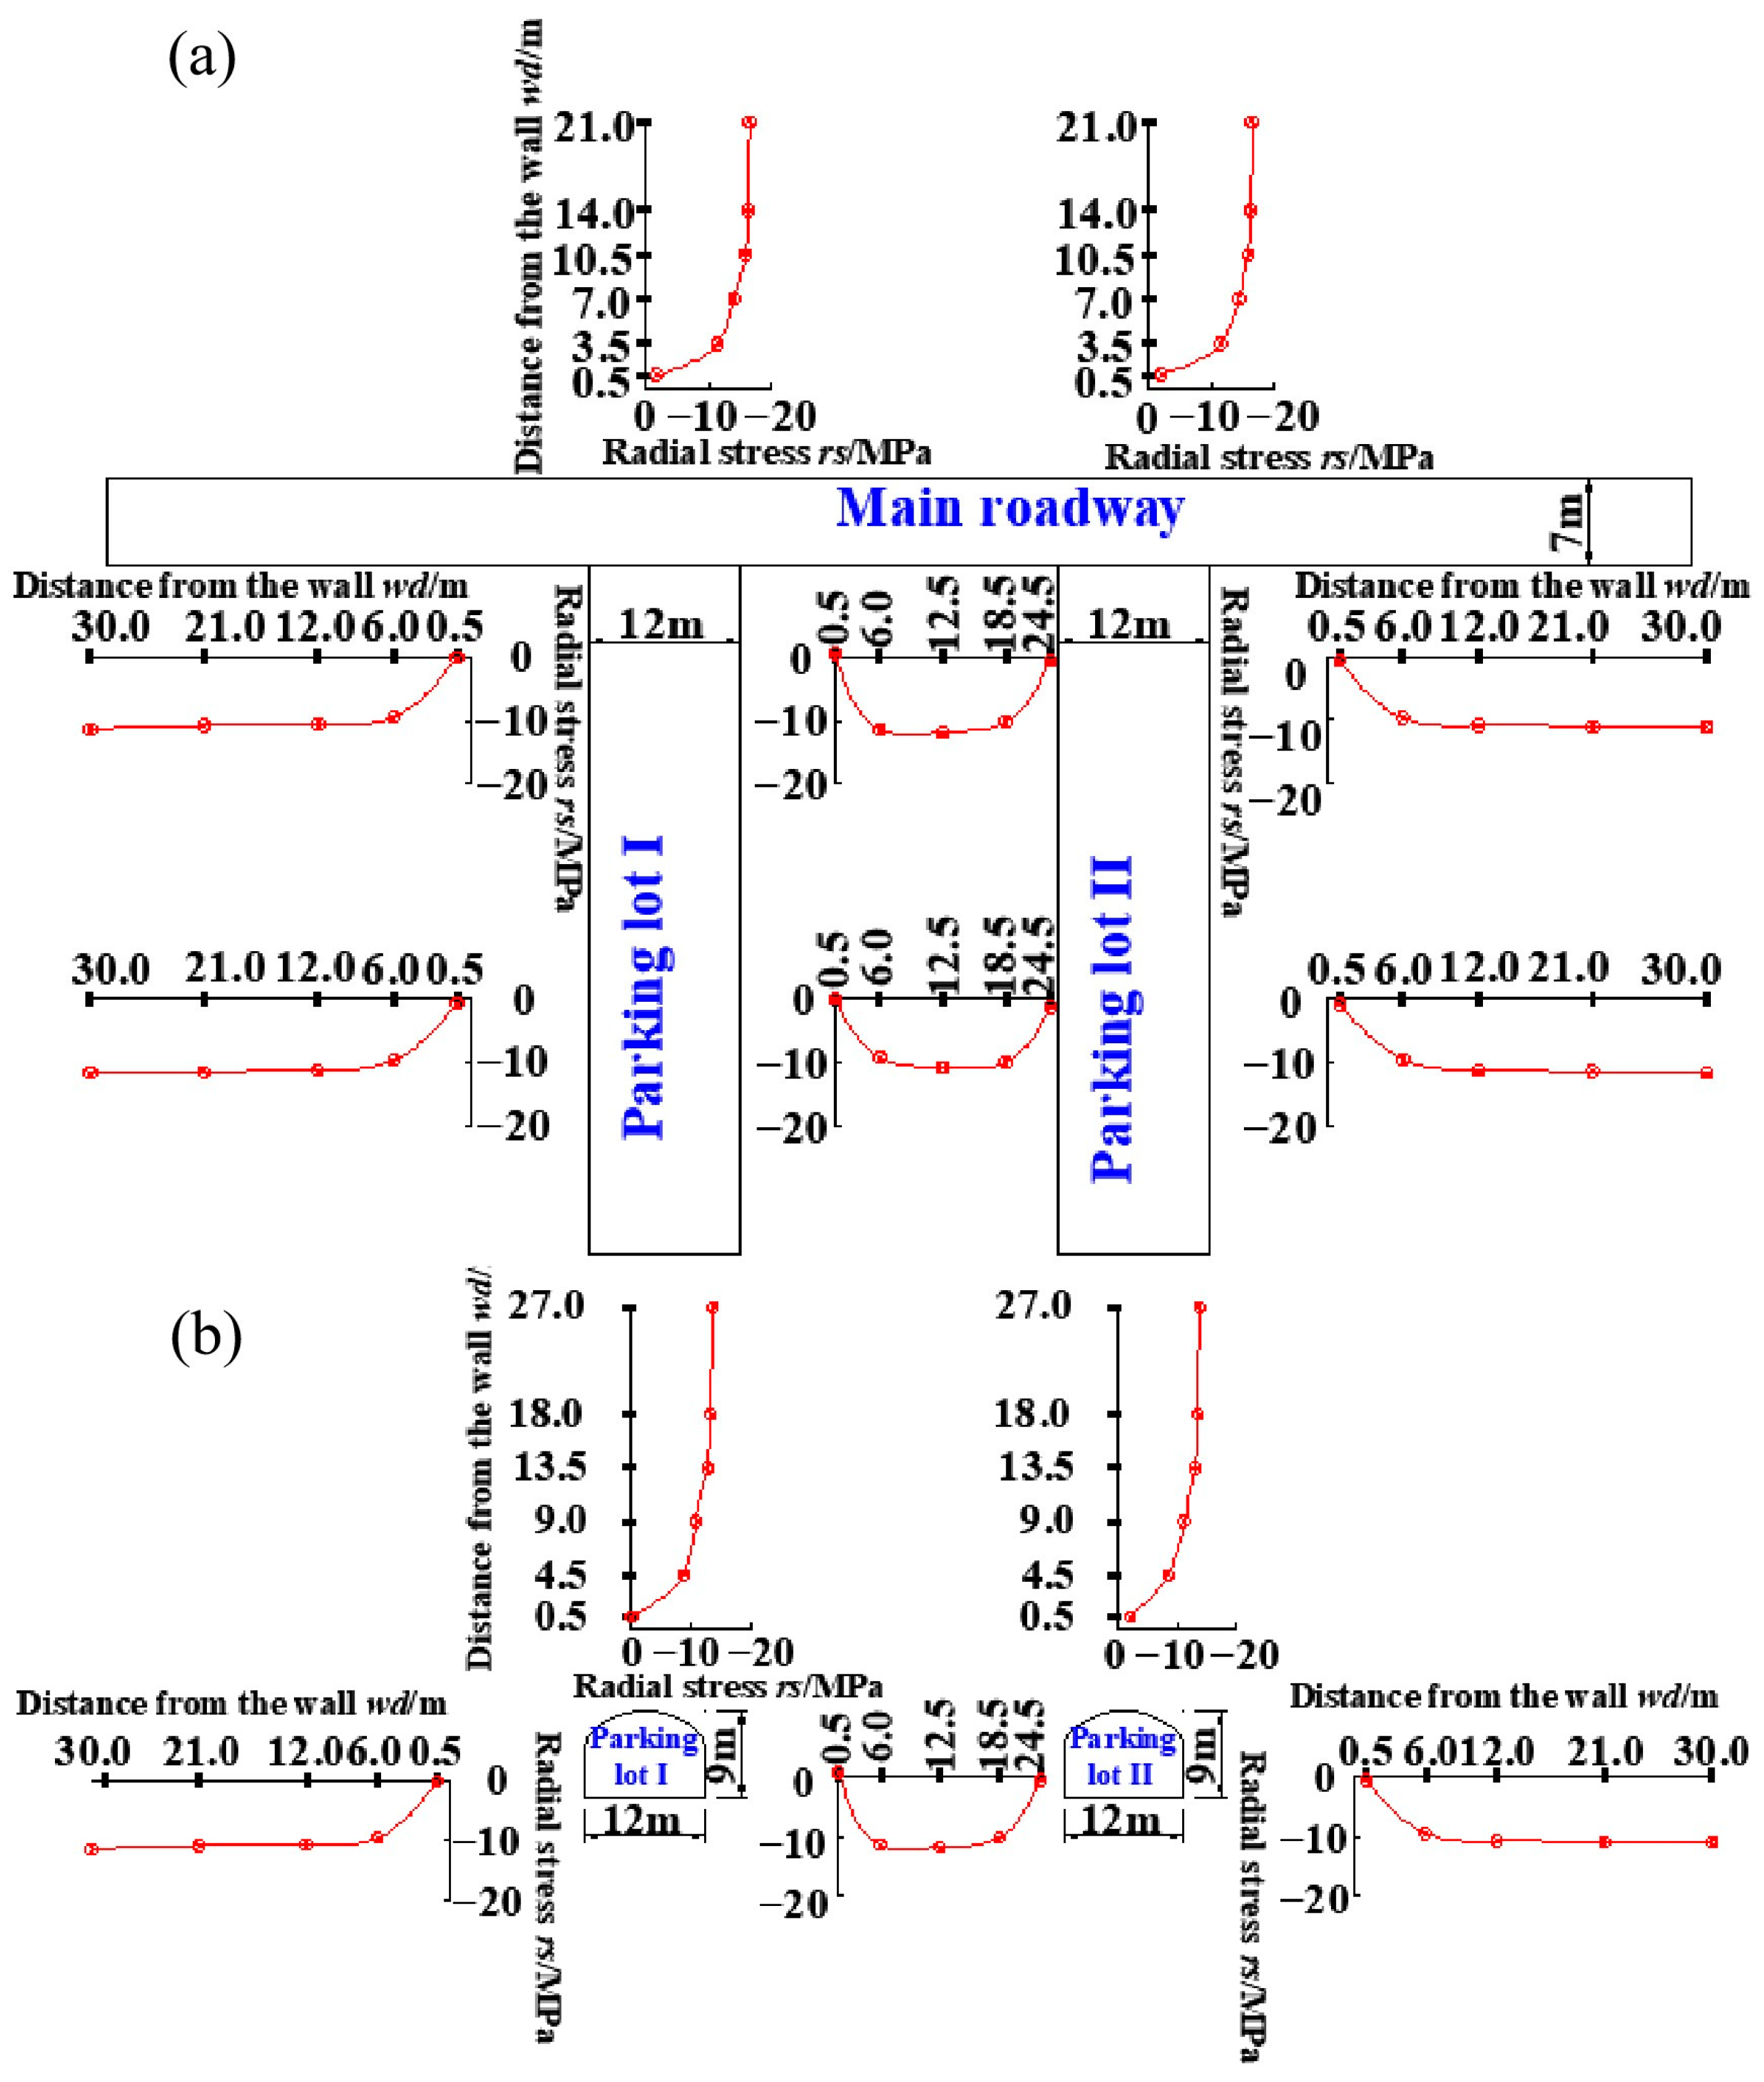
3.5.1. Test Results of Surrounding Rock
3.5.2. Test Results of the Bolt
4. Overloading Test
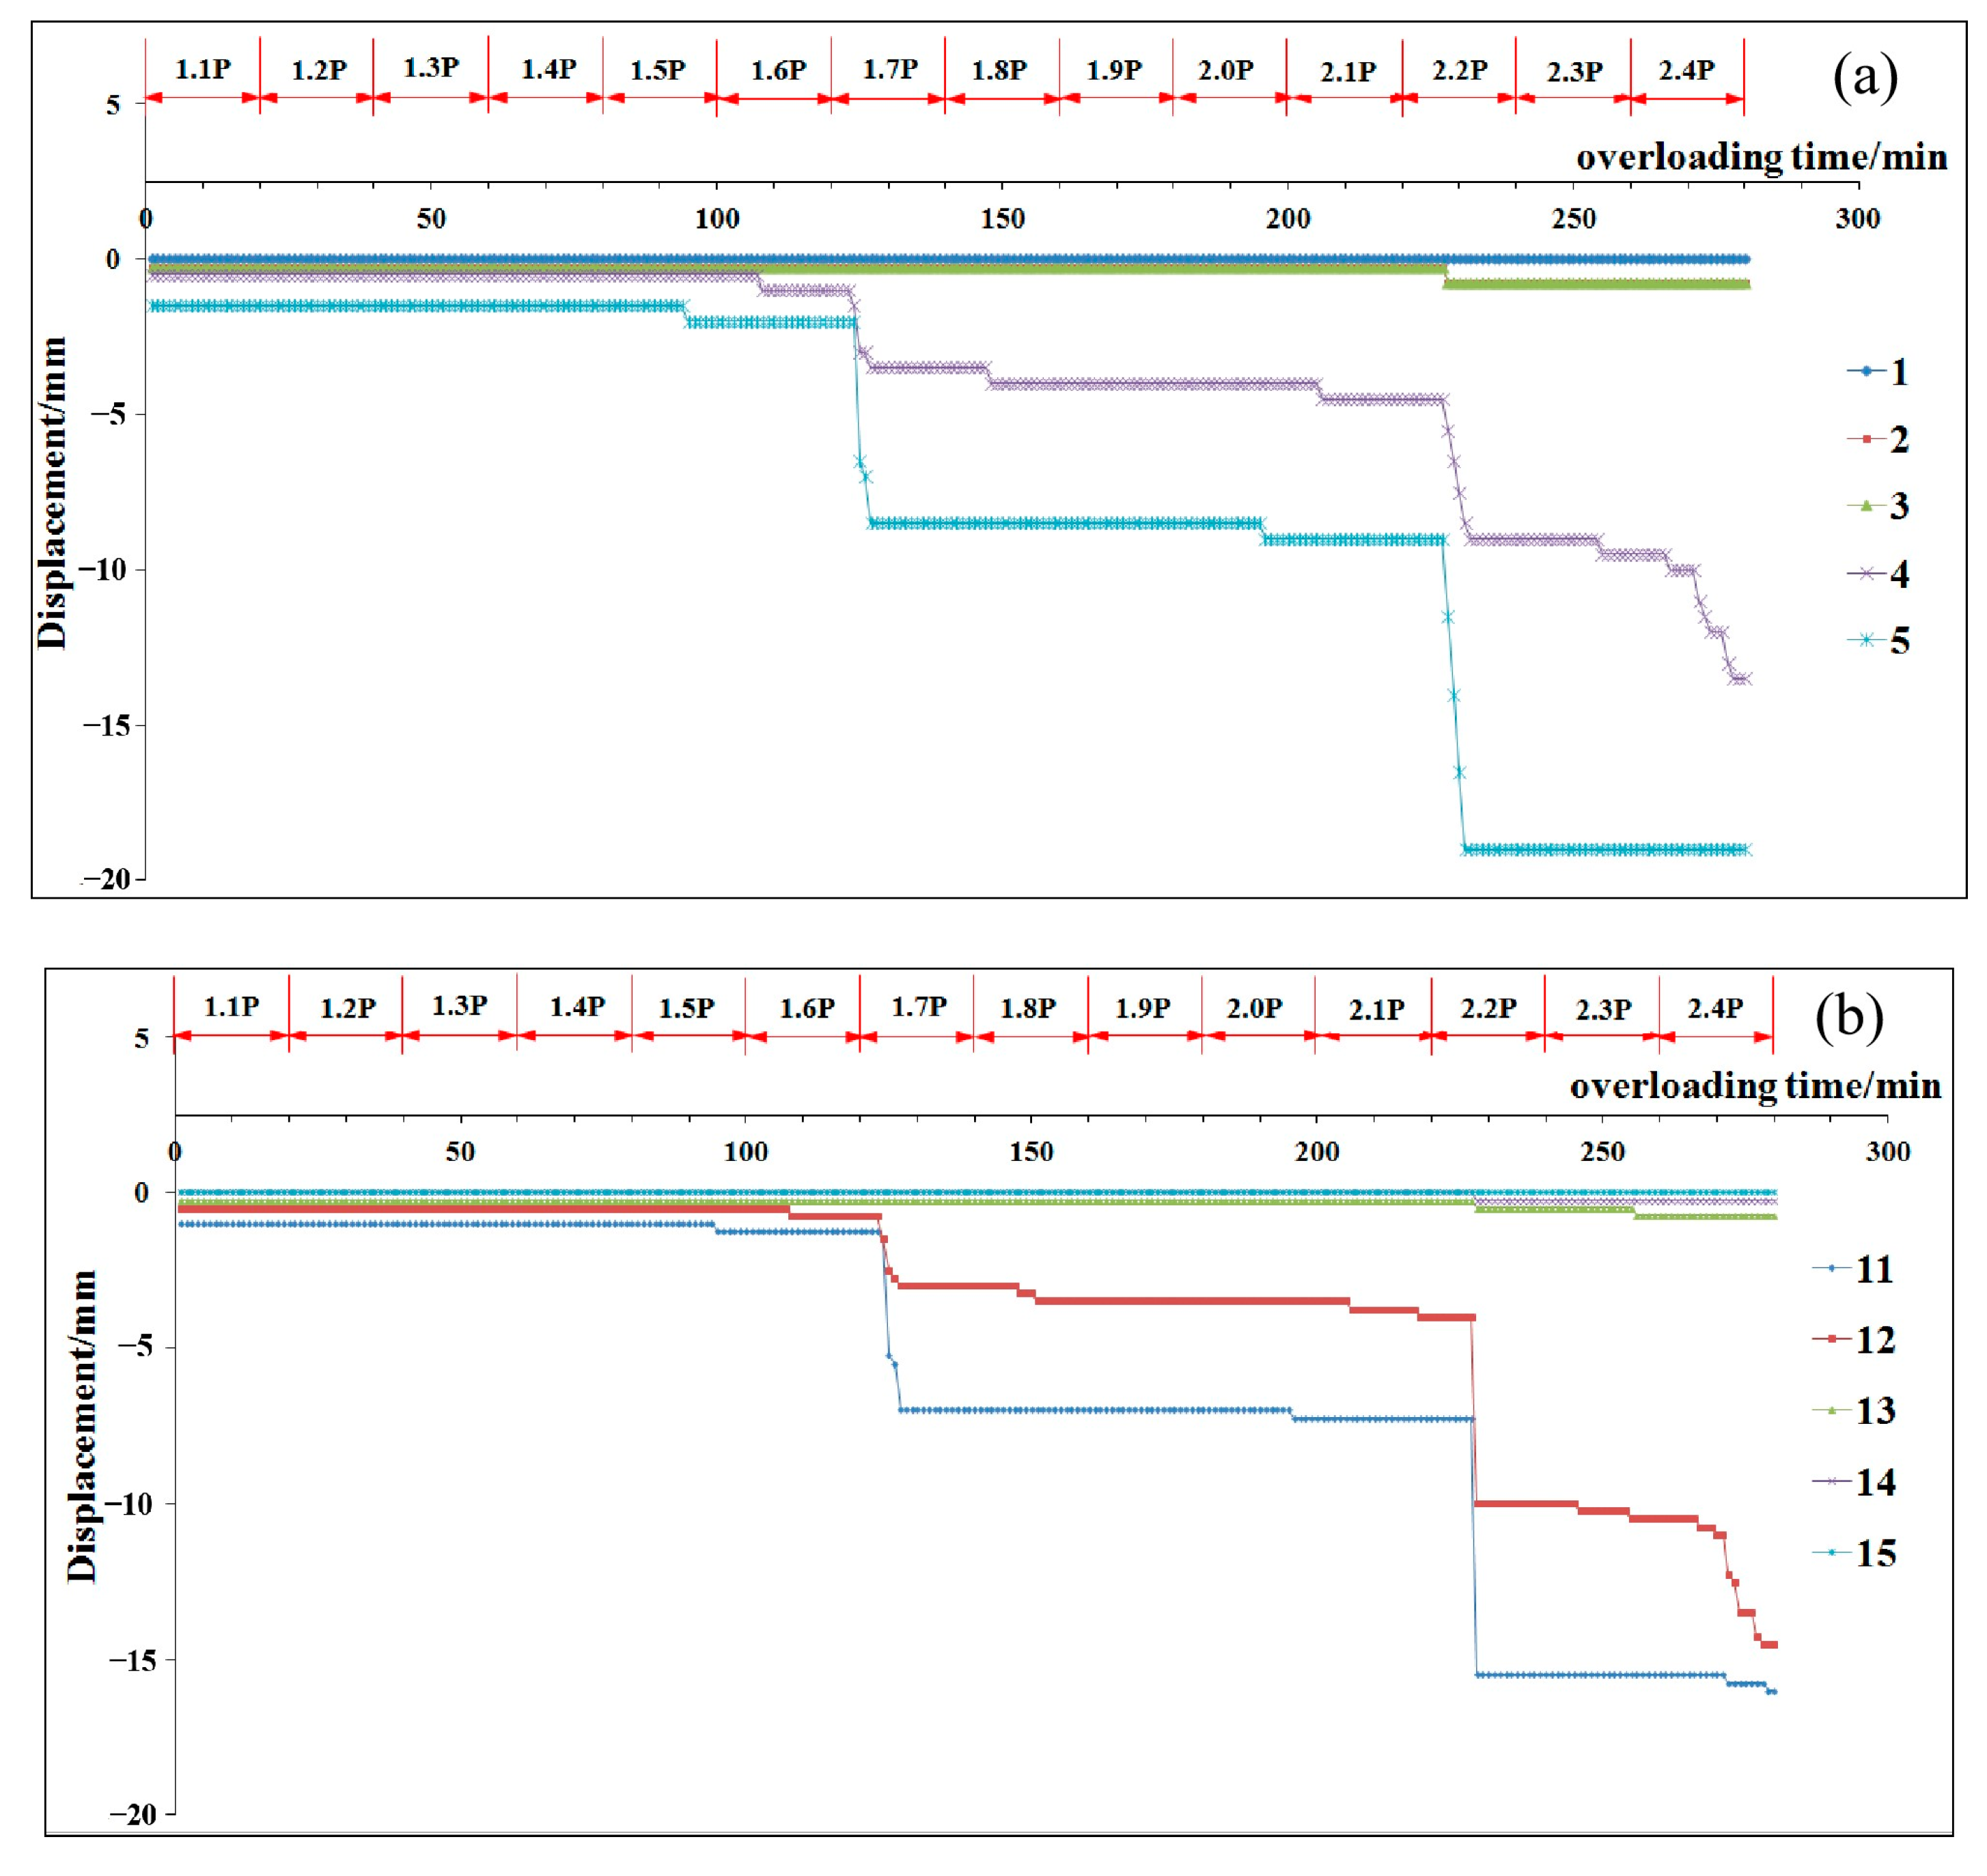
4.1. Process of the Overloading Test
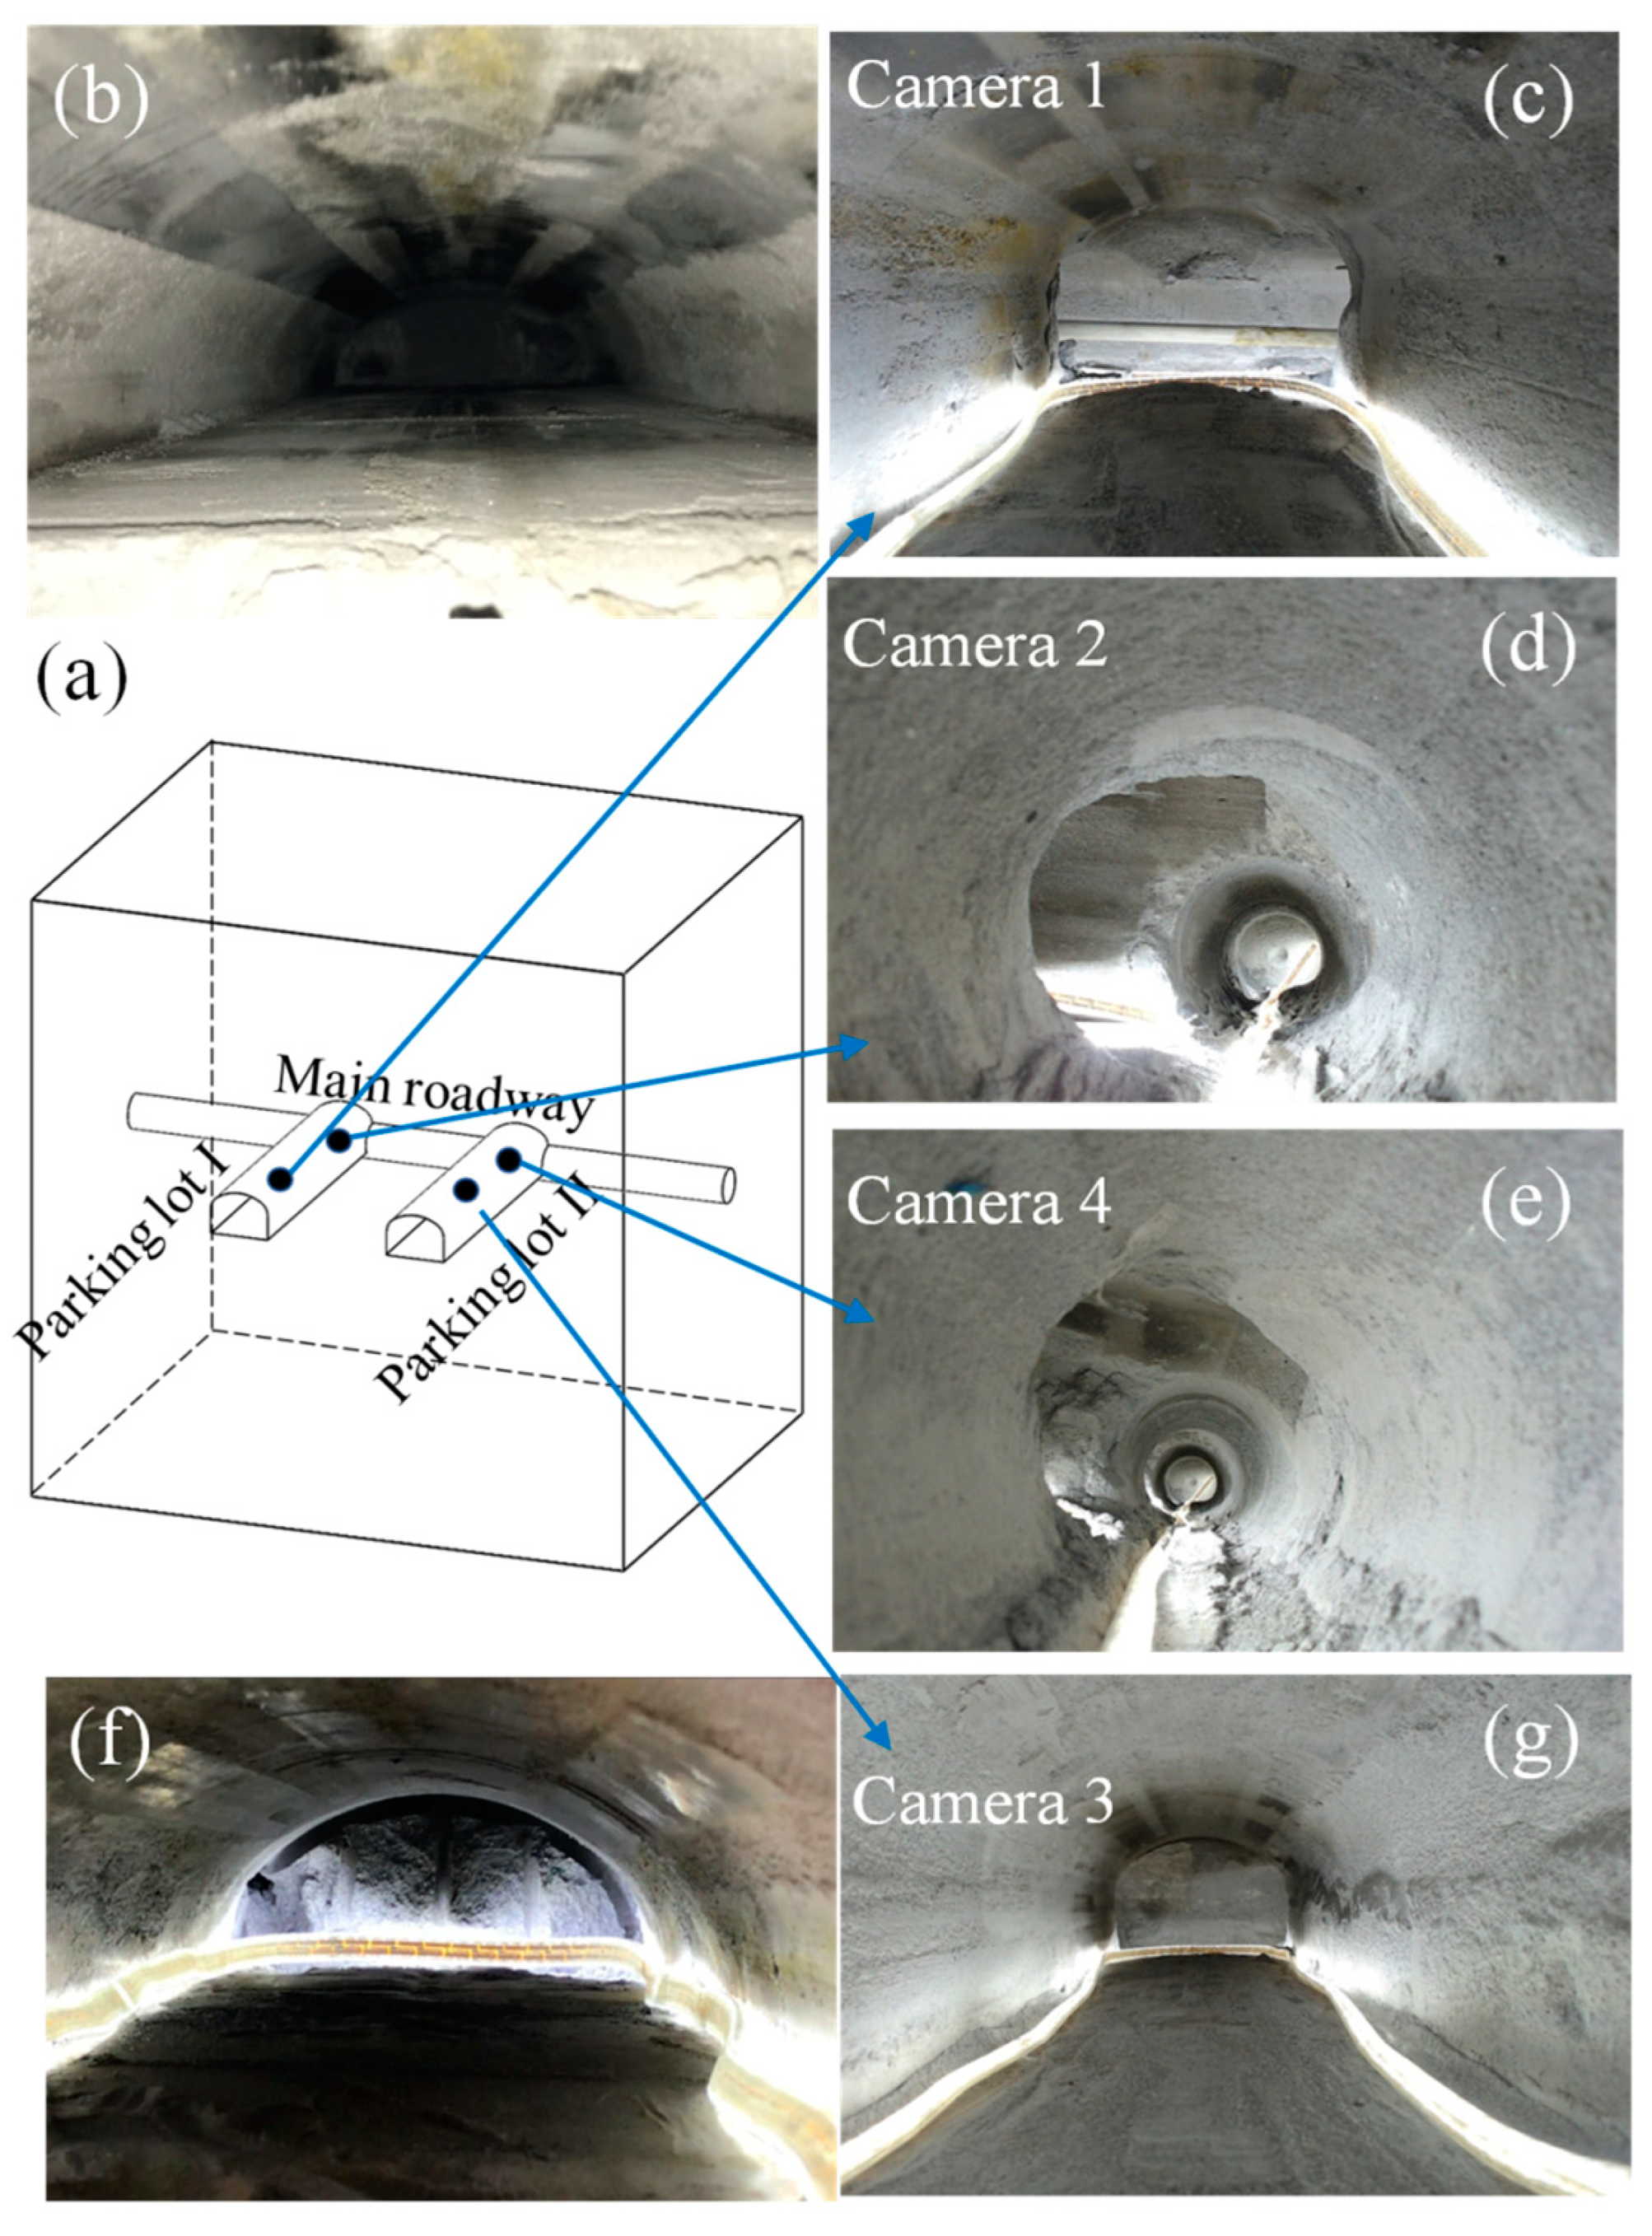
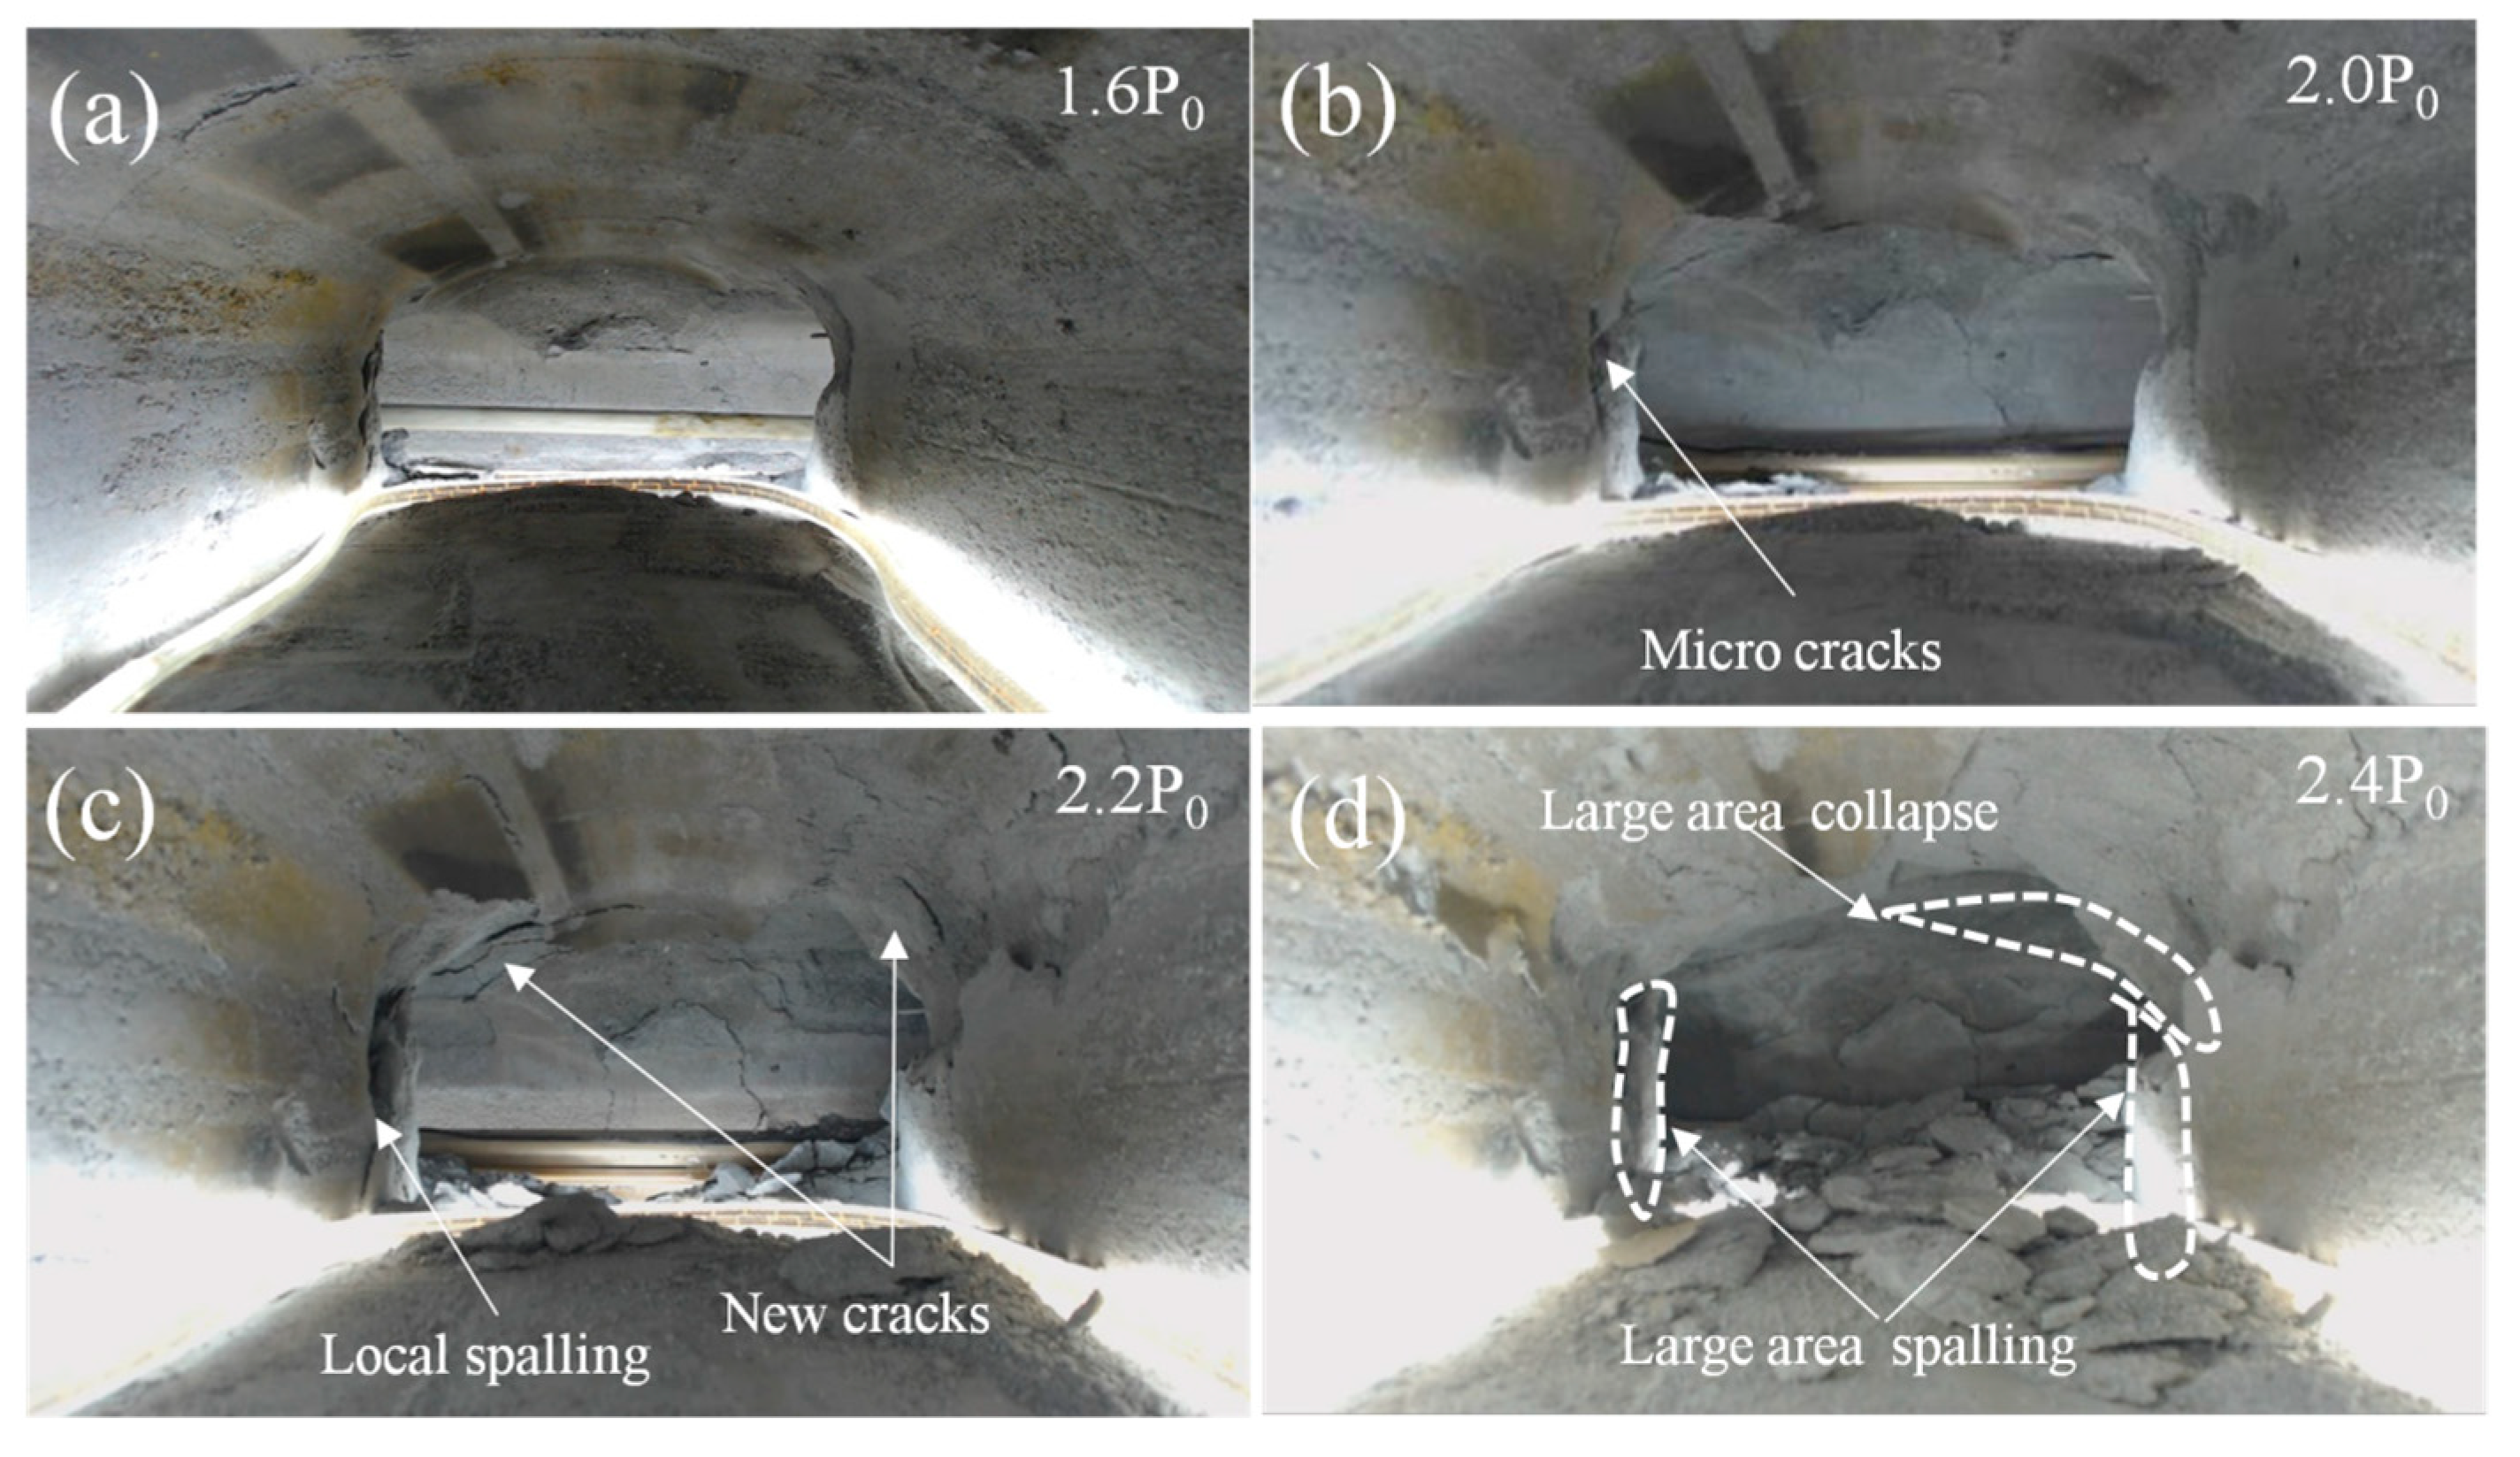
4.2. Destruction Phenomena and Fracturing Patterns
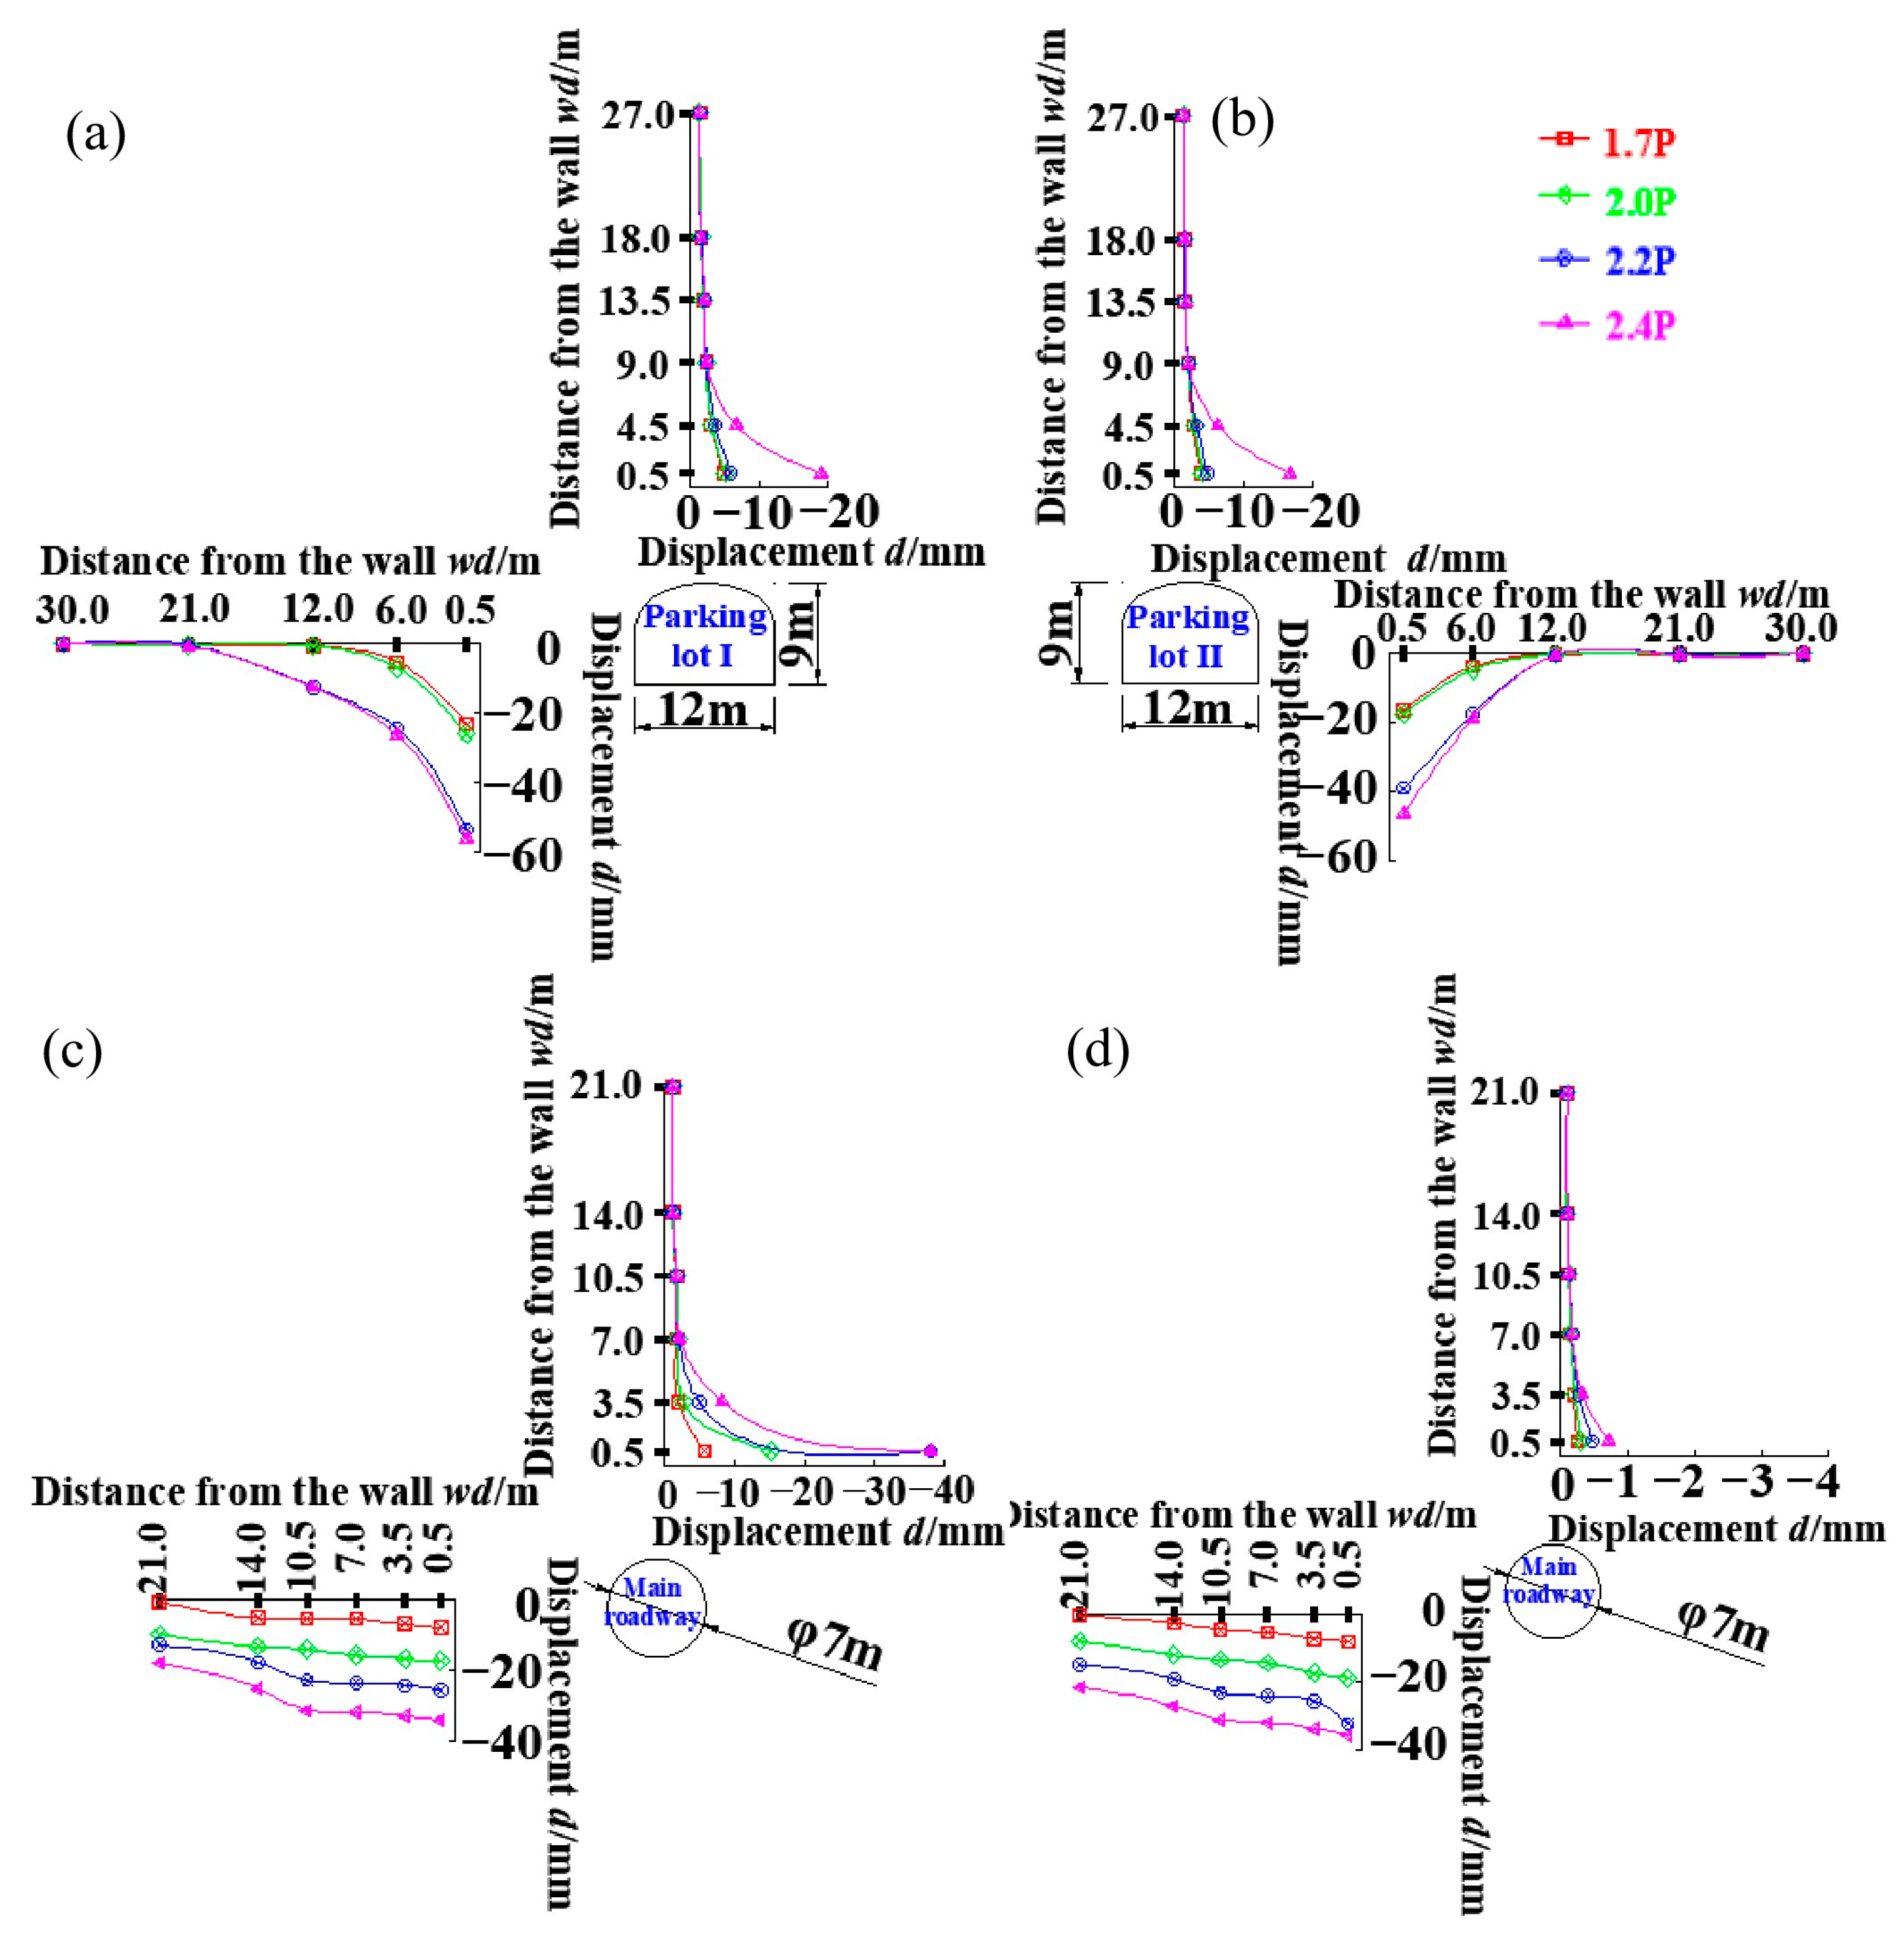
4.3. Overloading Induced Deformation
4.4. Discussions
5. Conclusions
- (1)
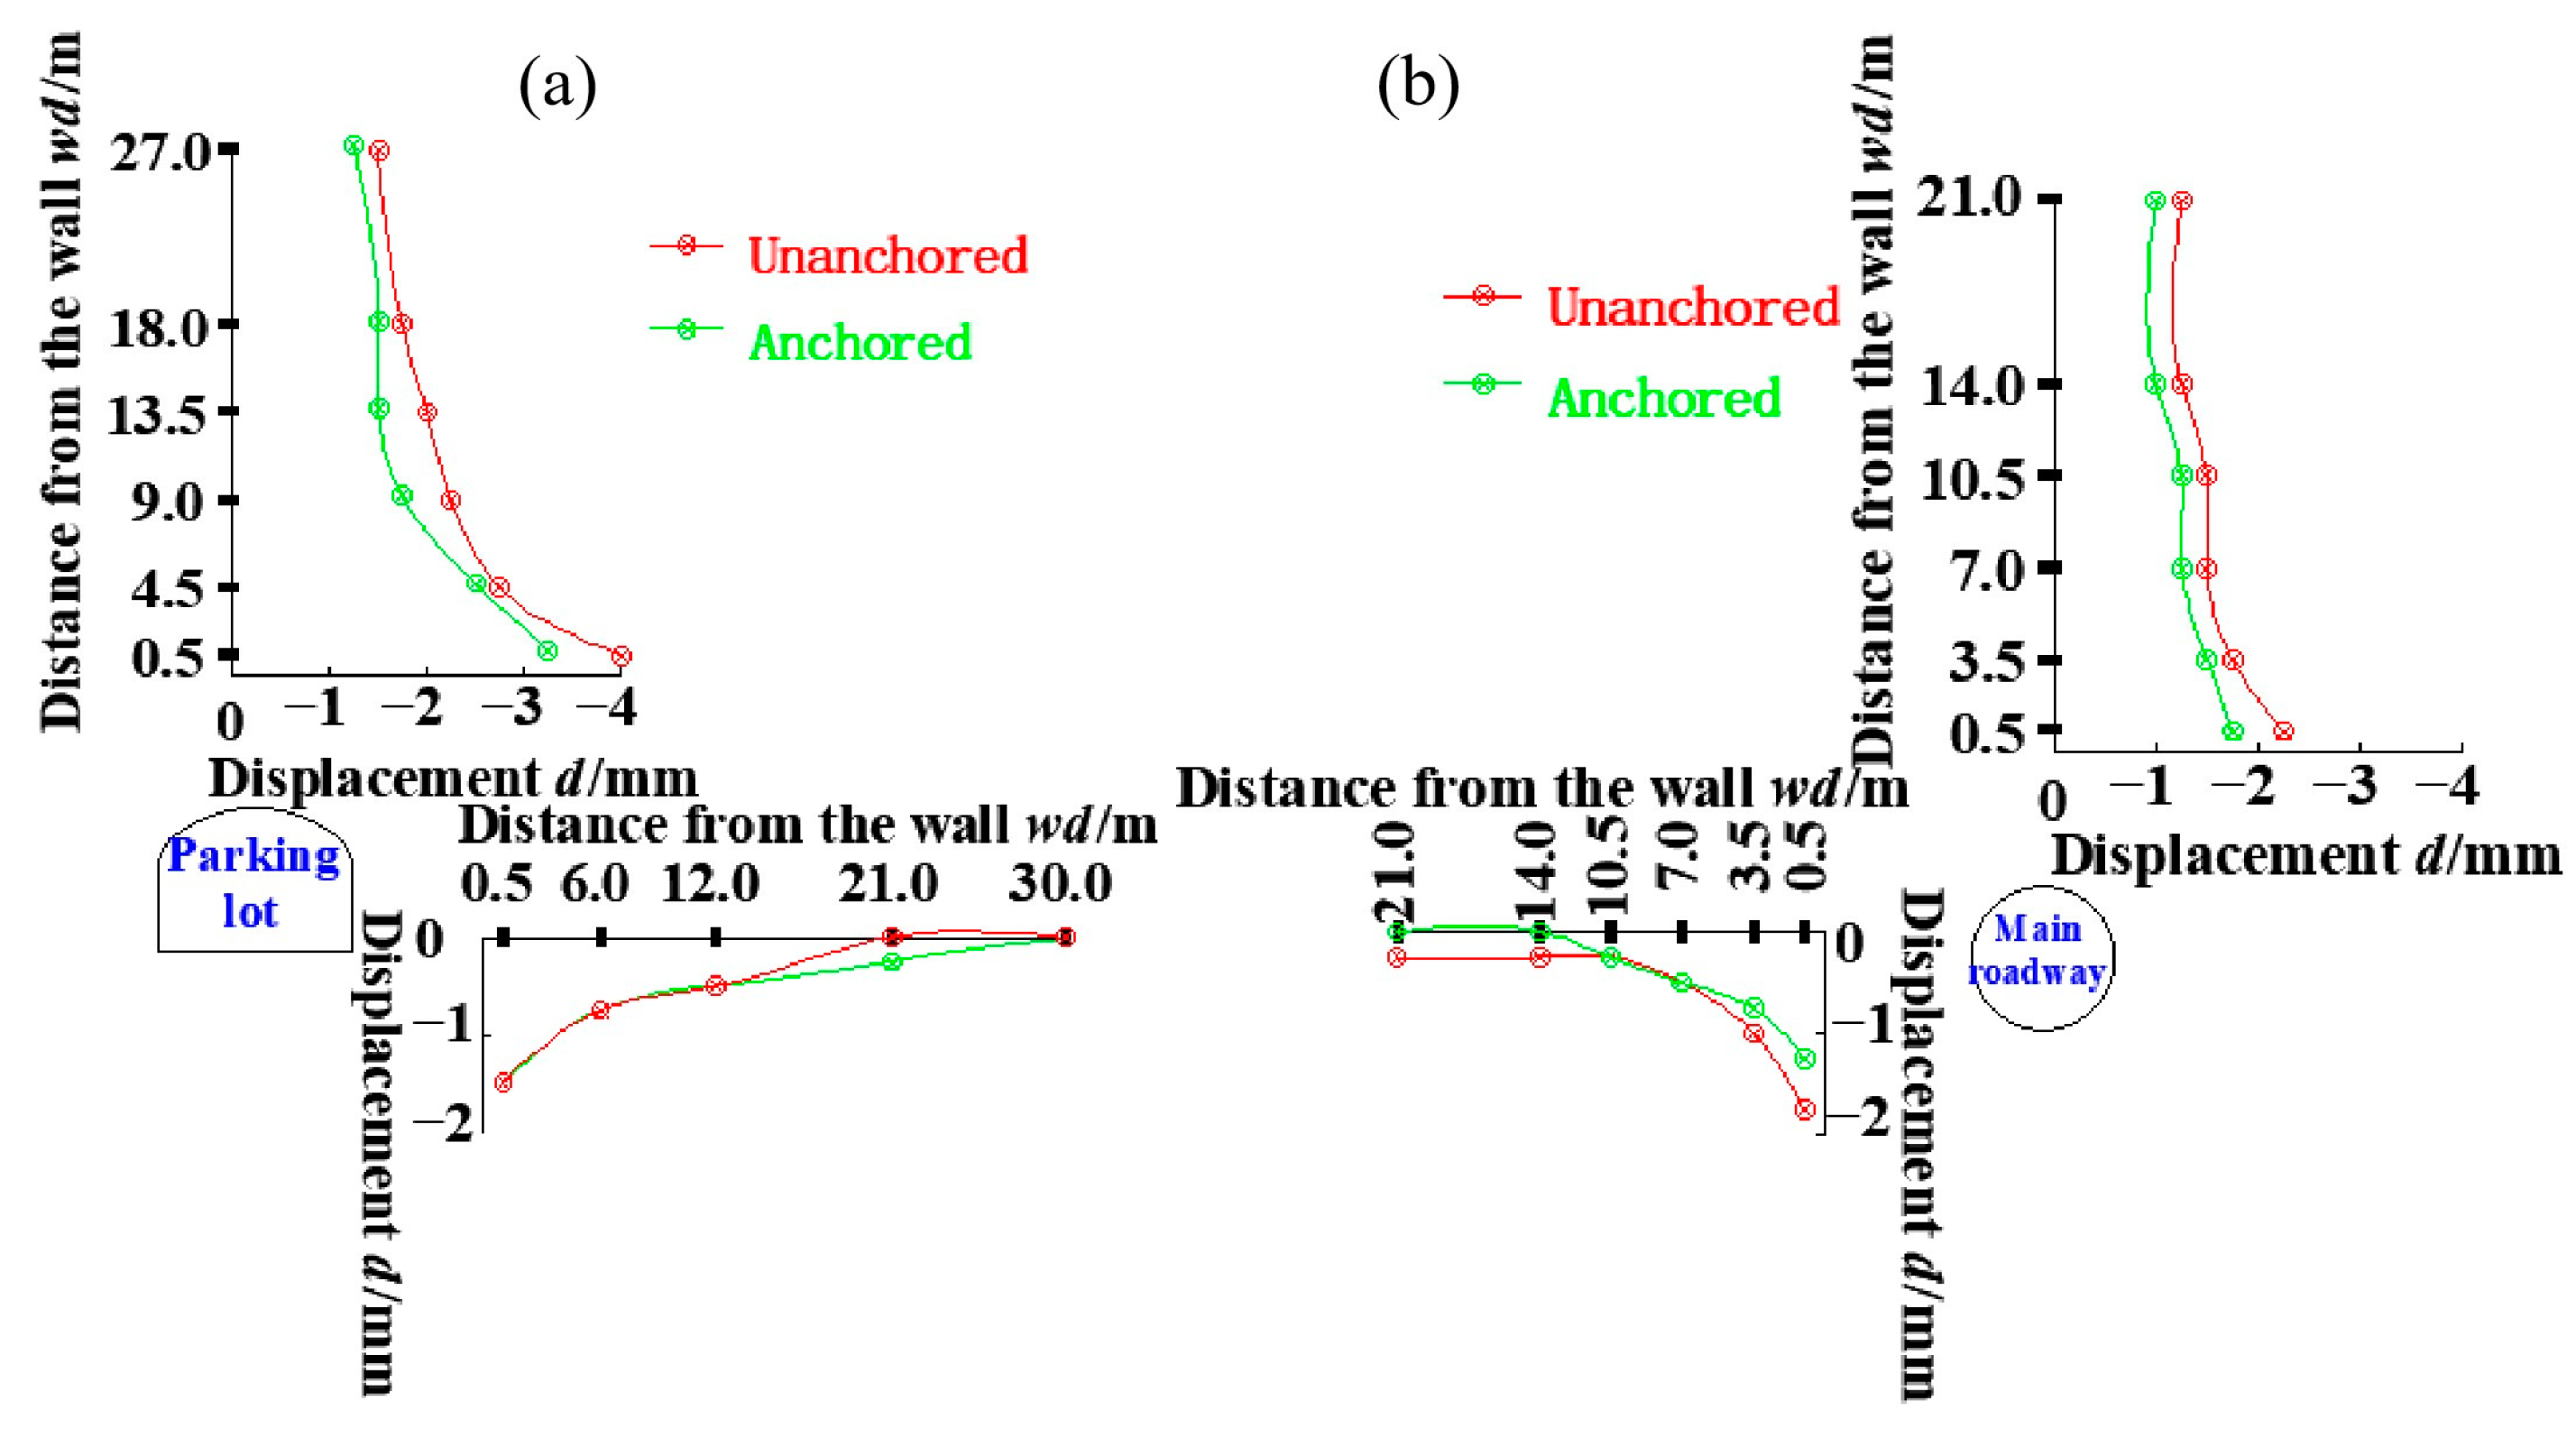
- After the excavation, convergent deformation occurs in the surrounding rock with the maximum value of more than 4 mm. The displacement of the intersection is 7–33% larger than that of the non-intersection. The displacement of the supporting chamber is reduced by 14–22% compared with that of the unsupported chamber.
- (2)
- After the excavation, the axial force of bolts is all tensile force. The tension of the bolt at the vault top is greater than that at the waist of the cave, indicating that the supporting effect of the bolt at the vault top of the chamber is greater than that of the waist bolt.
- (3)
- Support significantly increased the safety factor. Specifically, the safety coefficient of crack initiation is increased from 1.7 to 1.9, the safety coefficient of local destruction is increased from 2.1 to 2.2 and the safety coefficient of general demolition is increased from 2.3 to 2.4.
- (4)
- The failure of surrounding rock firstly occurs in the intersection area of the chamber group, and the damage degree in the intersection area is significantly more severe than in other parts. Therefore, intensive monitoring should be performed on the large intersection, and appropriate support should be carried out according to the monitoring results. In the next step, we will improve the traditional strength reduction method based on the safety factor obtained from the research to obtain a more accurate and reliable numerical calculation method for evaluating the safety factor of the chamber group.
Author Contributions
Funding
Institutional Review Board Statement
Informed Consent Statement
Data Availability Statement
Acknowledgments
Conflicts of Interest
References
- Wang, J.; Pang, Z. Chapter 17 Comparison Between Geological Disposal of Carbon Dioxide and Radioactive Waste in China; Springer Science and Business Media LLC: Berlin, Germany, 2011. [Google Scholar]
- Wang, J.; Chen, L.; Su, R.; Zhao, X.G. The Beishan underground research laboratory for geological disposal of high-level radioactive waste in China: Planning, site selection, site characterization and in situ tests. J. Rock Mech. Geotech. Eng. 2018, 10, 411–435. [Google Scholar] [CrossRef]
- Li, J.; Su, R.; Zhou, Z. The Single Deposit Scale Scenario at Granite Area in A Long-Term Safety Assessment of A Radioactive Waste Repository. IOP Conf. Ser. Earth Environ. Sci. 2019, 237, 022012. [Google Scholar] [CrossRef] [Green Version]
- Hou, J.X.; Wu, Y.D.; Xu, Y.J.; Li, X.J.; Wang, S.; Wang, F.P.; Zhang, X.R. 3D Data Visualization System of Immersive Underground Laboratory. Sustain. Cities Soc. 2019, 46, 101439. [Google Scholar] [CrossRef]
- Zhang, C.L.; Wang, J.; Su, K. Concepts and tests for disposal of radioactive waste in deep geological formations. Chin. J. Rock Mech. Eng. 2006, 25, 750–767. [Google Scholar]
- NEA (Nuclear Energy Agency). The Role of Underground Laboratories in Nuclear Waste Disposal Programmes; OECD Publications: Paris, France, 2001. [Google Scholar]
- Wang, J.; Chen, W.M.; Su, R. Geological disposal of high-level radioactive waste and its key scientific issues. Chin. J. Rock Mech. Eng. 2006, 4, 801–812. [Google Scholar]
- Wang, J. On area-specific underground research laboratory for geological disposal of high-level radioactive waste in China. J. Rock Mech. Geotech. Eng. 2014, 6, 99–104. [Google Scholar] [CrossRef] [Green Version]
- Delay, J.; Lebon, P.; Rebours, H. Meuse/Haute-Marne centre: Next steps towards a deep disposal facility. J. Rock Mech. Geotech. Eng. 2010, 2, 52–70. [Google Scholar]
- Comino, J.Á.L.; Heimann, S.; Cesca, S.; Claus, M.; Dahm, T.; Zang, A. Automated Full Waveform Detection and Location Algorithm of Acoustic Emissions from Hydraulic Fracturing Experiment. Procedia Eng. 2017, 191, 697–702. [Google Scholar] [CrossRef]
- Liu, J.F.; Chen, L.; Wang, C.P.; Man, K.; Wang, L.; Wang, J.; Su, R. Characterizing the mechanical tensile behavior of Beishan granite with different experimental methods. Int. J. Rock Mech. Min. Sci. 2014, 69, 50–58. [Google Scholar] [CrossRef]
- Man, K.; Liu, X.L.; Gong, F.Q.; Ma, H.S.; Chen, Z.M.; Wang, J. Static & dynamic properties of granite in Xinjiang’s Tianhu area as a pre-selected geological disposal site of HLW. Vib. Shock. 2007, 36, 146–156. [Google Scholar]
- Vasconcelos, R.G.W.; Beaudoin, N.; Hamilton, A.; Hyatt, N.C.; Provis, J.L.; Corkhill, C.L. Characterisation of a high pH cement backfill for the geological disposal of nuclear waste: The Nirex Reference Vault Backfill. Appl. Geochem. 2018, 89, 180–189. [Google Scholar] [CrossRef] [Green Version]
- Pushkareva, R.; Kalinichenko, E.; Lytovchenko, A.; Pushkarev, A.; Kadochnikov, V.; Plastynina, M. Irradiation effect on physico-chemical properties of clay minerals. Appl. Clay Sci. 2002, 21, 117–123. [Google Scholar] [CrossRef]
- Tripathi, K.K.; Viswanadham, B.V.S. Evaluation of the Permeability Behaviour of Sand-Bentonite Mixtures Through Laboratory Tests. Indian Geotech. J. 2012, 42, 267–277. [Google Scholar] [CrossRef]
- Akügn, H.; Ada, M.; Koçkar, M.K. Performance assessment of a bentonite–sand mixture for nuclear waste isolation at the potential Akkuyu Nuclear Waste Disposal Site, southern Turkey. Environ. Earth Sci. 2015, 73, 6101–6116. [Google Scholar] [CrossRef]
- Mokni, N.; Barnichon, J.D. Hydro-mechanical analysis of SEALEX in-situ tests-Impact of technological gaps on long term performance of repository seals. Eng. Geol. 2016, 205, 81–92. [Google Scholar] [CrossRef]
- Hajj, H.E.; Abdelouas, A.; Mendili, Y.E.; Karakurt, G.; Grambow, B.; Martin, C. Corrosion of carbon steel under sequential aerobic–anaerobic environmental conditions. Corros. Sci. 2013, 76, 432–440. [Google Scholar] [CrossRef]
- King, F. Predicting the Lifetimes of Nuclear Waste Containers. J. Miner. Met. Mater. Soc. 2014, 66, 526–537. [Google Scholar] [CrossRef]
- Ahn, T.M. Multiple lines of evidence for performance of the canister and waste form in long-term nuclear waste disposal: Reviews. Prog. Nucl. Energy 2016, 93, 343–350. [Google Scholar] [CrossRef]
- Andersson, P.; Byegård, J.; Tullborg, E.L.; Doe, T.; Hermanson, J.; Winberg, A. In situ tracer tests to determine retention properties of a block scale fracture network in granitic rock at the Äspö Hard Rock Laboratory, Sweden. J. Contam. Hydrol. 2004, 70, 271–297. [Google Scholar] [CrossRef] [PubMed]
- Walton, G.; Lato, M.; Anschütz, H.; Perras, M.A.; Diederichs, M.S. Non-invasive detection of fractures, fracture zones, and rock damage in a hard rock excavation-Experience from the Äspö Hard Rock Laboratory in Sweden. Eng. Geol. 2015, 196, 210–221. [Google Scholar] [CrossRef]
- Zhang, Z.X.; Kou, S.Q.; Lindqvist, P.A. In-situ measurements of TBM cutter temperature in Äspö Hard Rock Laboratory, Sweden. Int. J. Rock Mech. Min. Sci. 2001, 38, 585–590. [Google Scholar] [CrossRef]
- Liu, Y.M.; Wang, J.; Cao, S.F.; Ma, L.K.; Xie, J.L.; Zhao, X.G.; Chen, L. A large-scale THMC experiment of buffer material for geological disposal of high level radioactive waste in China. Rock Soil Mech. 2013, 34, 2756–2762+2789. [Google Scholar]
- Chen, L.; Liu, Y.M.; Wang, J.; Cao, S.F.; Xie, J.L.; Ma, L.K.; Zhao, X.G.; Li, Y.W.; Liu, J. Investigation of the thermal-hydro-mechanical (THM) behavior of GMZ bentonite in the China-Mock-up test. Eng. Geol. 2014, 172, 57–68. [Google Scholar] [CrossRef]
- Cho, W.J.; Kim, J.S.; Lee, C.S.; Kwon, S.; Choi, J.W. In situ experiments on the performance of near-field for nuclear waste repository at KURT. Nucl. Eng. Des. 2014, 252, 278–288. [Google Scholar] [CrossRef]
- Snow, M.S.; Clark, S.B.; Morrison, S.S.; Watrous, M.G.; Olson, J.E.; Snyder, D.C. Mechanical environmental transport of actinides and 137Cs from an arid radioactive waste disposal site. J. Environ. Radioact. 2015, 148, 45–48. [Google Scholar] [CrossRef] [PubMed] [Green Version]
- Armand, G.; Bumbieler, F.; Conil, N.; Vaissière, R.; Bosgiraud, J.M.; Vu, M.N. Main outcomes from in situ thermo-hydro-mechanical experiments programme to demonstrate feasibility of radioactive high-level waste disposal in the Callovo-Oxfordian claystone. J. Rock Mech. Geotech. Eng. 2017, 9, 415–427. [Google Scholar] [CrossRef]
- Denise-Penelope, K.; Ahmed, F. 3D FEM Analysis of a Pile-Supported Riverine Platform under Environmental Loads Incorporating Soil-Pile Interaction. Computation 2018, 6, 10. [Google Scholar]
- Zhang, Q.Y.; Ren, M.Y.; Duan, K.; Wang, W.S.; Gao, Q.; Lin, H.X.; Xiang, W.; Jiao, Y.Y. Geo-mechanical model test on the collaborative bearing effect of rock-support system for deep tunnel in complicated rock strata. Tunn. Undergr. Space Technol. 2019, 91, 103001. [Google Scholar] [CrossRef]
- Zhang, Q.; Liu, C.; Duan, K.; Zhang, Z.; Xiang, W. True Three-Dimensional Geomechanical Model Tests for Stability Analysis of Surrounding Rock During the Excavation of a Deep Underground Laboratory. Rock Mech. Rock Eng. 2020, 53, 517–537. [Google Scholar] [CrossRef]
- He, C.C.; Hu, X.L.; Dwayne, D.; Tan, F.L.; Zhang, Y.M.; Zhang, H. Response of a landslide to reservoir impoundment in model tests. Eng. Geol. 2018, 247, 84–93. [Google Scholar] [CrossRef]
- Zhang, S.; Zhang, X.C.; Pei, X.J.; Wang, S.Y.; Huang, R.H.; Xu, Q.; Wang, Z.L. Model test study on the hydrological mechanisms and early warning thresholds for loess fill slope failure induced by rainfall. Eng. Geol. 2019, 258, 105–135. [Google Scholar] [CrossRef]
- Shin, J.H.; Choi, Y.K.; Kwon, O.Y.; Lee, S.D. Model testing for pipe-reinforced tunnel heading in a granular soil. Tunn. Undergr. Space Technol. 2008, 23, 241–250. [Google Scholar] [CrossRef]
- Hu, X.D.; Fang, T.; Chen, J.; Hui, R.; Wang, G. A large-scale physical model test on frozen status in freeze-sealing pipe roof method for tunnel construction. Tunn. Undergr. Space Technol. 2018, 72, 55–63. [Google Scholar] [CrossRef]
- Bao, Z.; Yuan, Y.; Yu, H.T. Multi-scale physical model of shield tunnels applied in shaking table test. Soil Dyn. Earthq. Eng. 2017, 100, 465–479. [Google Scholar] [CrossRef]
- Zhu, W.S.; Zhang, Q.B.; Li, Y.; Sun, L.F.; Zhang, L.; Zheng, W.H. Development of large-scale physical model test system under true triaxial loading and its applications. Chin. J. Rock Mech. Eng. 2010, 29, 1–7. [Google Scholar]
- Li, Z.K.; Liu, H.; Dai, R.; Su, X. Application of numerical analysis principles and key technology for high fidelity simulation to 3-D physical model tests for underground caverns. Tunn. Undergr. Space Technol. 2005, 20, 390–399. [Google Scholar] [CrossRef]
- Lin, P.; Liu, H.Y.; Zhou, W.Y. Experimental study on failure behaviour of deep tunnels under high in-situ stresses. Tunn. Undergr. Space Technol. 2015, 46, 28–45. [Google Scholar] [CrossRef]
- Wang, S.G.; Liu, Y.R.; Tao, Z.F.; Zhang, Y.; Zhong, D.N.; Wu, Z.S.; Lin, C.; Yang, Q. Physical model test for failure and stability analysis of high arch dam based on acoustic emission technique. Int. J. Rock Mech. Min. Sci. 2018, 112, 95–107. [Google Scholar] [CrossRef]
- Chen, H.M.; Yu, H.S.; Smith, M.J. Physical model tests and numerical simulation for assessing the stability of brick-lined tunnels. Tunn. Undergr. Space Technol. 2016, 53, 109–119. [Google Scholar] [CrossRef]
- Zhang, Q.B.; He, L.; Zhu, W.S. Displacement measurement techniques and numerical verification in 3Dphysical model tests of an underground cavern group. Tunn. Undergr. Space Technol. 2016, 56, 54–56. [Google Scholar] [CrossRef]
- Zhu, W.S.; Li, Y.; Li, S.C.; Wang, S.G.; Zhang, Q.B. Quasi-three-dimensional physical model tests on a cavern complex under high in-situ stresses. Int. J. Rock Mech. Min. Sci. 2011, 48, 199–209. [Google Scholar]
- Nunes, M.A.; Meguid, M.A. A study on the effects of overlying soil strata on the stresses developing in a tunnel lining. Tunn. Undergr. Space Technol. 2009, 24, 716–722. [Google Scholar] [CrossRef]
- Zhang, Q.Y.; Zhang, Y.; Duan, K.; Liu, C.C.; Miao, Y.S.; Wu, D. Large-scale geo-mechanical model tests for the stability assessment of deep underground complex under true-triaxial stress. Tunn. Undergr. Space Technol. 2019, 83, 577–591. [Google Scholar] [CrossRef]
- Zhao, X.G.; Wang, J.; Cai, M.; Ma, L.K.; Zong, Z.H.; Wang, X.Y.; Su, R.; Chen, W.M.; Zhao, H.G.; Chen, Q.C.; et al. In-situ stress measurements and regional stress field assessment of the Beishan area. Eng. Geol. 2013, 163, 26–40. [Google Scholar] [CrossRef]
- Fumagalli, I.E. Statical and Geomechanical Models; Springer: New York, NY, USA, 1973. [Google Scholar]
- Zhang, Q.Y.; Duan, K.; Jiao, Y.Y.; Xiang, W. Physical model test and numerical simulation for the stability analysis of deep gas storage cavern group located in bedded rock salt formation. Int. J. Rock Mech. Min. Sci. 2017, 94, 43–54. [Google Scholar] [CrossRef]
- Zhang, Q.Y.; Zhang, X.T.; Wang, Z.C.; Xiang, W.; Xue, J.H. Failure mechanism and numerical simulation of zonal disintegration around a deep tunnel under high stress. Int. J. Rock Mech. Min. Sci. 2017, 93, 344–355. [Google Scholar] [CrossRef]
- Chen, X.G.; Zhang, Q.Y.; Wang, Y.; Liu, D.J.; Zhang, N. Model test of anchoring effect on zonal disintegration in deep surrounding rock masses. Sci. World J. 2013, 2013, 935148. [Google Scholar] [CrossRef] [Green Version]
- Zhang, Q.Y.; Li, S.C.; Zhu, W.S.; You, C.A.; Guo, X.H.; Ma, G.L.; Chen, J.G.; Li, Y.; Wang, H.P. Cementitious Geotechnical Analogue Material for Iron Crystal Sand and Preparation Method. China Patent CN1792990, 28 June 2006. [Google Scholar]
- Li, S.C.; Liu, Q.; Li, L.P.; Zhao, Y.; Wang, H.P.; Zhao, Y.; Yuan, X.S. Development of large-scale geomechanical model test system for tunnel construction and its application. Chin. J. Rock Mech. Eng. 2011, 30, 1368–1374. [Google Scholar]
- Liu, C.; Zhang, Q.; Duan, K.; Xiang, W.; Jiao, Y. Development and Application of an Intelligent Test System for the Model Test on Deep Underground Rock Caverns. Energies 2020, 13, 358. [Google Scholar] [CrossRef] [Green Version]


| Parameters | Uniaxial Compressive Strength (ucs) (MPa) | Tensile Strength (τ) (MPa) | Deformation Modulus (Eo) (GPa) | Cohesion (c) (MPa) | Friction Angle (φ) (°) | Poisson’s Ratio (μ) | Unit Weight (γ) (kN/m3) |
|---|---|---|---|---|---|---|---|
| Original rock | 132.37 | 6.86 | 49.17 | 28.13 | 50.6 | 0.264 | 26.80 |
| Similar materials (calculated from similarity principles) | 2.647 | 0.134 | 0.983 | 0.563 | 50.6 | 0.264 | 26.80 |
| Similar materials (measured by experiments) | 2.611~2.683 | 0.123~0.142 | 0.955~0.992 | 0.541~0.571 | 49.9~50.6 | 0.25~0.27 | 26.2~27.1 |
| Similar Scale | I:B:S | Concentration (%) | Proportion of Mass of Binder (%) |
|---|---|---|---|
| CL = 50 | 1:0.45:0.25 | 18 | 6 |
| Parameters | Length (L) (m) | Elastic Modulus (E) (GPa) | Yield Strength (σs) (MPa) | Tensile Strength (σt) (MPa) |
|---|---|---|---|---|
| Original bolt | 2.5 | 206 | 315 | 490 |
| Analogue bolt | 0.05 | 3.7 | 6.3 | 8.21 |
| Order of Excavation | Length (mm) | Excavation Method | The Advance Rate (mm/step) | Number of Steps |
|---|---|---|---|---|
| 1. Main roadway | 2500 | Full section | 40 | 60 |
| 2. Parking lot II | 1090 | Upper and lower steps | 40 | 56 |
| 3. Parking lot I | 1090 | Upper and lower steps | 40 | 56 |
Disclaimer/Publisher’s Note: The statements, opinions and data contained in all publications are solely those of the individual author(s) and contributor(s) and not of MDPI and/or the editor(s). MDPI and/or the editor(s) disclaim responsibility for any injury to people or property resulting from any ideas, methods, instructions or products referred to in the content. |
© 2023 by the authors. Licensee MDPI, Basel, Switzerland. This article is an open access article distributed under the terms and conditions of the Creative Commons Attribution (CC BY) license (https://creativecommons.org/licenses/by/4.0/).
Share and Cite
Liu, C.; Sun, X.; Zhang, X.; Zhang, Q.; Chen, Y.; Wang, J. Physical Model Test on the Deformation and Fracturing Process of Underground Research Laboratory during Excavation and Overloading Test. Sustainability 2023, 15, 9416. https://doi.org/10.3390/su15129416
Liu C, Sun X, Zhang X, Zhang Q, Chen Y, Wang J. Physical Model Test on the Deformation and Fracturing Process of Underground Research Laboratory during Excavation and Overloading Test. Sustainability. 2023; 15(12):9416. https://doi.org/10.3390/su15129416
Chicago/Turabian StyleLiu, Chuancheng, Xikui Sun, Xiufeng Zhang, Qiangyong Zhang, Yang Chen, and Jinxi Wang. 2023. "Physical Model Test on the Deformation and Fracturing Process of Underground Research Laboratory during Excavation and Overloading Test" Sustainability 15, no. 12: 9416. https://doi.org/10.3390/su15129416