
Poor Ventilation Habits in Nursing Homes Have Favoured a High Number of COVID-19 Infections


Architecture and Design Department, Escuela Politécnica Superior, Campus Montepríncipe, Universidad San Pablo CEU, CEU Universities, Boadilla del Monte, 28668 Madrid, Spain
*
Author to whom correspondence should be addressed.
Sustainability 2021, 13(21), 11898; https://doi.org/10.3390/su132111898
Submission received: 15 July 2021
/
Revised: 15 October 2021
/
Accepted: 22 October 2021
/
Published: 28 October 2021
(This article belongs to the Special Issue Indoor Environment Quality and Health in Energy-Efficient Buildings)
Abstract
:Residents of nursing homes have been significantly affected by COVID-19 in Spain. The factors that have contributed to the vulnerability of this population are very diverse. In this study, physical agents, chemical pollutants, population density and different capacities of residences were analysed to understand their influence on the number of elderly people who have died in geriatric centres in different autonomous communities (AACCs) of Spain. A statistical analysis was carried out on the variables observed. The results show that many residences with a larger number of deaths were private, with some exceptions. Physical agents and pollutants were found to be determining factors, especially for the communities of Extremadura and Castilla–La Mancha, although the large number of factors involved makes this study complicated. The compromise between air quality and energy efficiency is of great importance, especially when human health is at stake.
1. Introduction
Today, in developed countries, 80–90% of people’s time is spent indoors [1], especially in their homes. The duration spent in the home varies between 60% and 90% of the day, and 30% of the time is spent sleeping [2,3]. Since homes contain air that is inhaled, the greatest exposure to potential air pollutants is in these interior spaces. The indoor environment of the home should facilitate rest and recovery [4,5]; therefore, as poor indoor air quality (IAQ) has harmful effects on health, it prevents these beneficial effects from being realised.
Since the energy crisis of the 1970s, buildings have become increasingly airtight, leading to the appearance of IAQ-related diseases, such as sick building syndrome (SBS) [6]. In addition, a relationship between air movement in buildings due to ventilation and the spread of infectious diseases has been demonstrated [7,8]. In this context, the benefits of indoor air exchange have been confirmed, although the influence of ventilation on the spread of infectious diseases is not clear [6]. Consequently, since the influence of airflow rates on health has not been quantified, the ventilation rates specified in different regulations are usually set according to comfort criteria (perceived conditions) [9,10,11,12].
However, a healthy indoor environment can be achieved by applying strategies necessary to improve the COVID-19 pollutant IAQ, which, in addition to increasing the supply of fresh air, include controlling pollution from emission sources, cleaning the air and improving the efficiency of ventilation [13,14,15]. Therefore, the indoor air quality (IAQ), especially in indoor residential spaces, has a strong influence on human health; thus, it is essential to design adequate ventilation, which ensures good IAQ since the main purpose of ventilation is to dilute or remove indoor contaminants by providing outdoor air [16,17,18,19,20,21].
The values set for air renewal to ensure comfort and eliminate odours have been modified over the course of history, according to variations in ventilation theories. Currently, the Basic Document HS 3 for indoor air quality, included in the Technical Building Code [22], provides data on minimum ventilation rates for residential buildings in Spain, depending on the room of the dwelling. In European countries, in addition to the EN 15251 standard (which should be used if no national standard is available), there are also state regulations that, as in the Spanish standard, provide data on minimum ventilation rates based mainly on body odours (with CO2 as an indicator) and, to some extent, according to primary emissions from some building materials [23,24].
On the other hand, even if the regulations are complied with, indoor air quality may still be inadequate if stagnant air zones are generated, and therefore, health and comfort problems may develop [25,26,27,28,29]. In-depth research in this field is still needed; therefore, the debate on how much ventilation is sufficient to achieve good indoor air quality, capable of preventing both odours and the emergence and spread of diseases, is still ongoing.
Spain is one of the countries most affected by the COVID-19 pandemic. According to data provided by the Spanish Ministry of Health’s Centre for the Coordination of Health Alerts and Emergencies [30], the number of deaths as of 16 May 2020 was 27,563, and 230,698 people were infected.
Based on the number of elderly people who have died in nursing homes [31], we find that the most affected autonomous communities (AACCs) were Castilla–La Mancha (14.44%), Extremadura (14.13%), Castilla y León (13.71%) and Aragón (12.90%), compared to the total number of deaths in these communities (elderly and non-elderly). These numbers are very similar to the number of the elderly who died in these communities: Castilla–La Mancha (17.38%), Extremadura (16.80%) and Aragón (15.36%).
According to data provided by the AACCs, the number of elderly people who have died as a result of COVID-19 in the approximately 5417 Spanish homes for the elderly, including public, subsidised and private residences, stands at 18,354 deaths. Only people who died after testing positive for coronavirus have been registered as casualties of COVID-19, i.e., tests have not been performed post-mortem, so those who were not tested are not listed as having died of coronavirus.
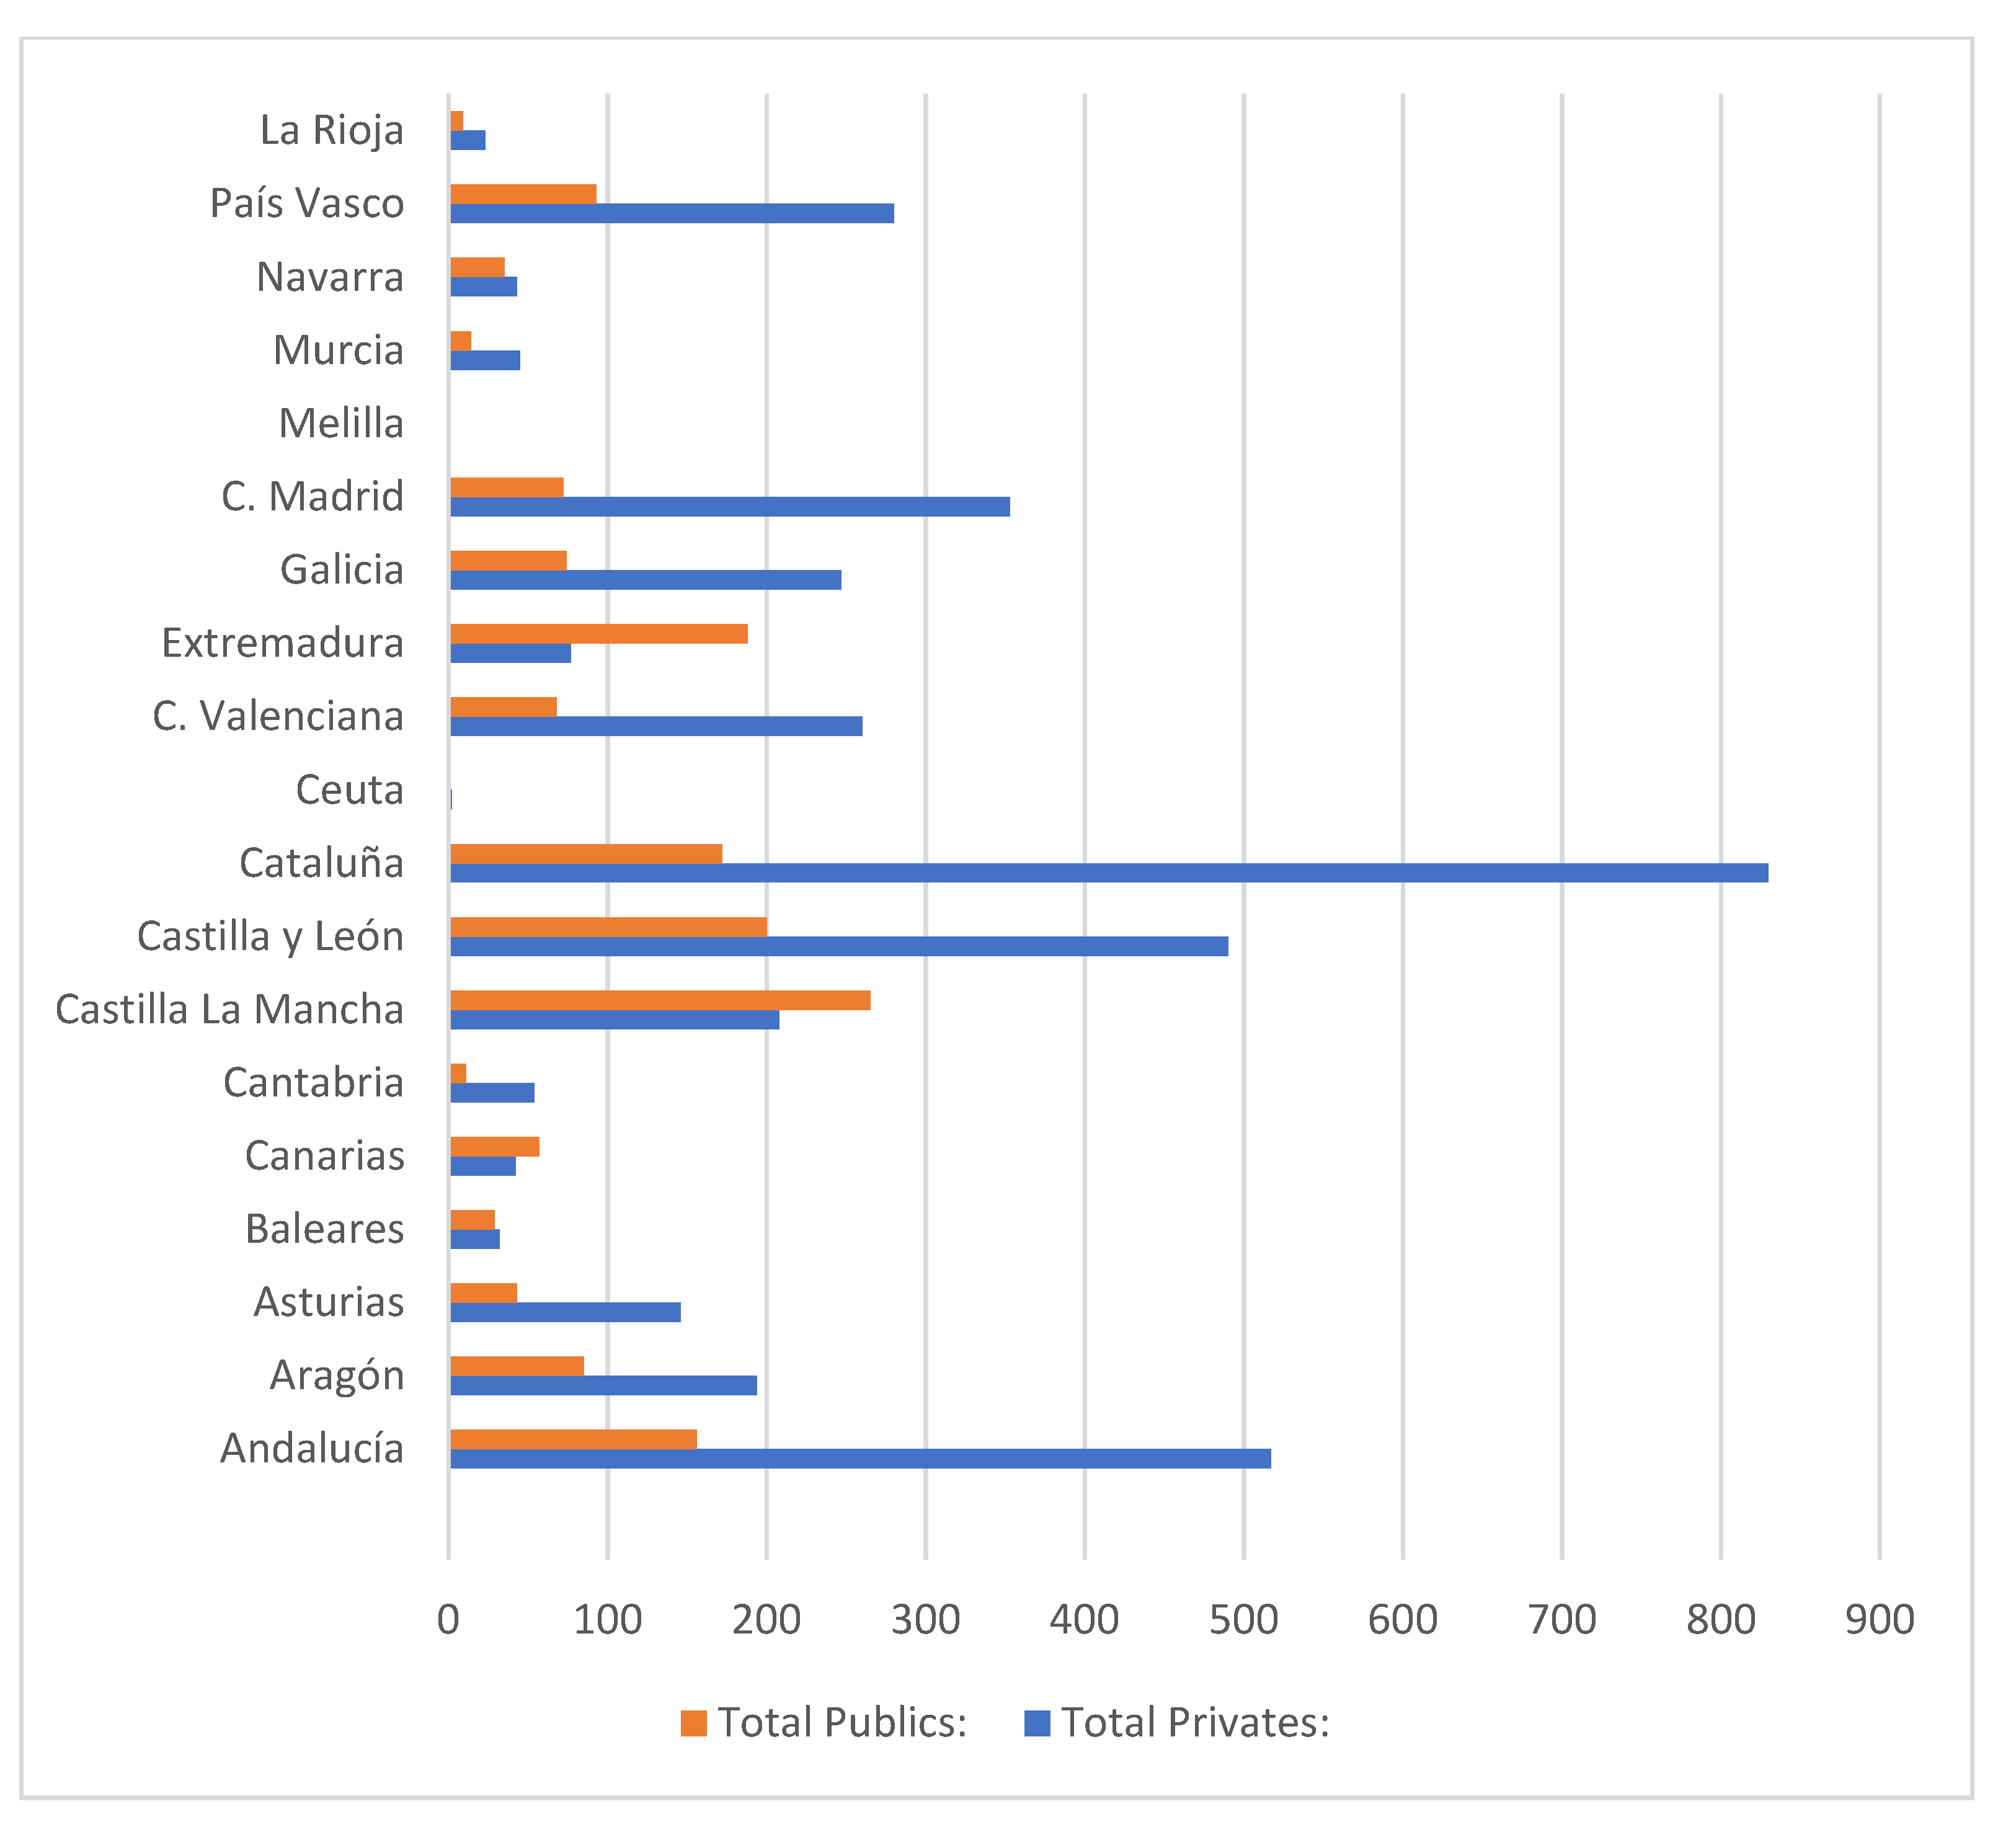
It is observed (Figure 1) that the number of private residences in AACCs is greater than the number of public residences in a proportion of 3 to 1, with the exception of the autonomous communities of Extremadura, Castilla–La Mancha and, to a lesser extent, Canarias.
The population pyramid in Spain continues to reflect population ageing, measured by the increase in the proportion of elderly persons, i.e., those aged 65 years old and over. According to the latest statistical data from the Continuous Register of the National Statistics Institute (INE), on 1 January 2019, there were 9,057,193 elderly people, 19.3% of the total population of 47,026,208 [32]. This population of elderly people continues to increase, both in number and proportion. The average age of the population, which is another way to measure this process, is 43.3 years; in 1970, it was 32.7.
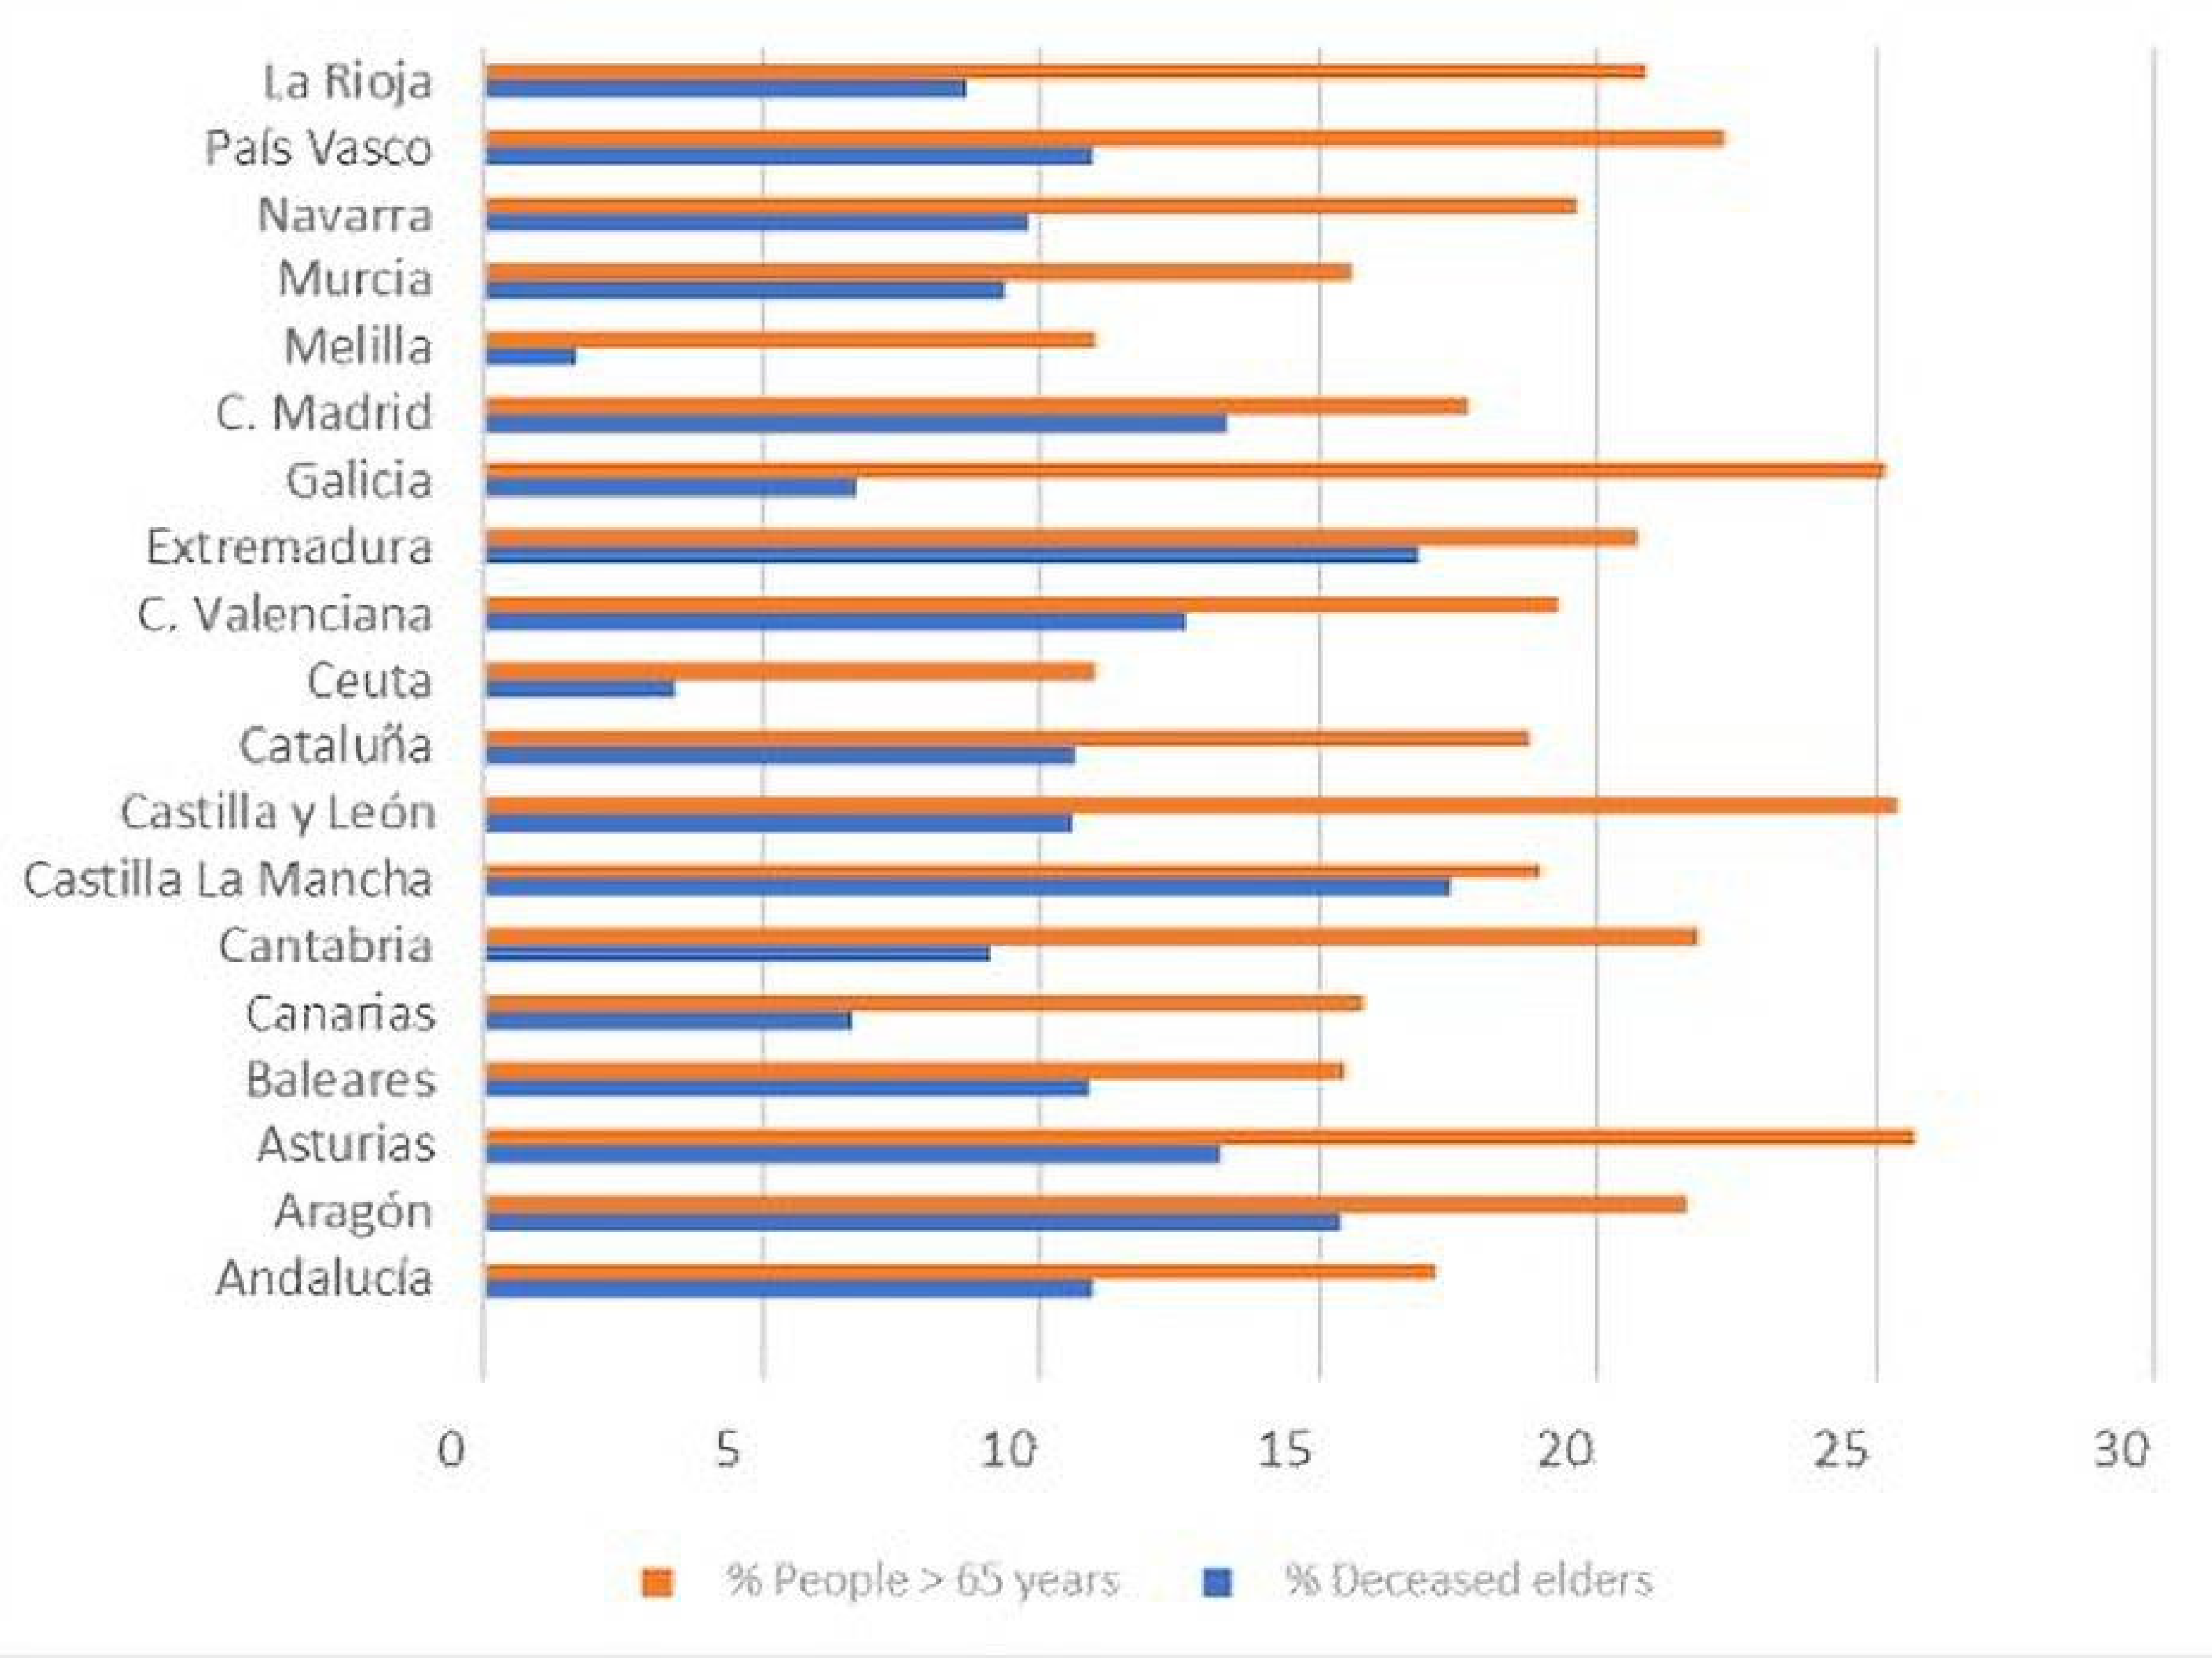
Below is a comparative chart of the population over 65 years of age and the number of deaths in that age range for each AACC.
The data show that the communities of Madrid, Extremadura, Castilla–La Mancha and Baleares have been most affected by deceased elderly persons relative to the population of persons over 65 years of age in these communities (see Figure 1 and Figure 2). On the other hand, Ceuta, Melilla, Canarias and Galicia have been less affected.
The first study carried out in Europe on indoor air quality [33] includes detailed statistical data from the Eurostat Union Statistics on Income and Living Conditions. The data demonstrate a correlation between people’s health and the conditions of the buildings in which they live.
In March of this year, the European Respiratory Journal published a study that revealed the importance of maintaining adequate indoor air quality conditions in residential buildings. Based on this study, it was deduced that older people are more likely to suffer negative effects on lung health due to indoor air pollution in buildings, compared to younger adults.
It has been shown that city dwellers (especially the elderly and children) spend between 58% and 78% of their time in an indoor environment that is polluted to a greater or lesser degree. This is a problem that has been exacerbated by the construction of buildings that are designed to be increasingly airtight and that recycle air with a smaller proportion of fresh air from outside in order to increase energy efficiency. Pollution of the indoor environments of buildings is the cause of many health problems of various kinds, which can range from simple fatigue or discomfort to symptoms consistent with allergies, infections and cancer, among others.
The pollutants present in the indoor air of buildings (residences), whether chemical, physical or biological, vary depending on the activities that take place in such spaces, the health of the occupants, the physical infrastructure of the building and its material assets and the quality of the surrounding air. At present, environmental pollutants, such as environmental tobacco smoke, formaldehyde, radon, mineral fibres, isocyanates and epoxy resins have been identified as some of the main emerging factors that can increase the risk of diseases, such as allergies, asthma, fertility disorders and cancer [34]. Physical factors that influence comfort are mainly related to relative humidity, average air speed, temperature and noise. In addition, there are chemical pollutants, including carbon dioxide (indicative of insufficient indoor air renewal), carbon monoxide, sulphur dioxide, volatile organic compounds, suspended particles, ozone, radon, etc., as well as various pathogens. In short, the population is faced daily with an array of pollutants not only in buildings, but also in the outside air, water, food, consumer products, etc. Determining the pollutant composition, daily exposure dose and interaction with the human body and the environment is quite a complex undertaking [34,35].
Volatile organic compounds (VOCs) play an important role in the process of assessing the IAQ. They negatively affect both the comfort and health of occupants [35,36]. The effects of VOCs in indoor spaces vary from sensory irritation at medium exposure levels to toxic effects at high exposure levels [37]. Formaldehyde (HCHO) is especially important, as it is known to be the most common irritant in indoor air, causing eye, nose and throat irritation (at concentrations above 0.1 mg/m3) and may even cause asthma attacks at high concentrations [38,39].
Previous studies [40,41] provide total VOC concentration data, using the concept of total volatile organic compounds (TVOCs). This parameter is used to allow a simpler and faster assessment than the analysis of a high amount of VOCs, which are usually detected in indoor spaces [42]. The concentration of any pollutant in an indoor space is the result of a balance between the network in that space and what is removed or added by ventilation. Therefore, if the TVOC level is high, it indicates that there are significant sources of contamination or that local ventilation is inadequate. Therefore, it is important to measure TVOCs, as they are an indication of the pollution load in the indoor environment and the sustainability of the ventilation rate [43]. It should be noted that TVOCs do not include all VOCs present in indoor air, as some organic pollutants are excluded, such as low molecular weight aldehydes, e.g., HCHO, because the method of identification differs from that of other VOCs. Therefore, in order to characterise the IAQ and determine the adequate ventilation rate, it is essential to consider the concentration of VOCs and HCHs.
Therefore, it is difficult to assess the health risks (measurement, tolerance level, exposure time, effects, etc.) in the indoor environment; preventive and corrective maintenance in the facilities involved is important in order to promote healthy environments.
In this study, chemical pollutants (such as formaldehyde, nitrogen dioxide, ozone, PM10 and PM2.5 particulate matter and sulphur dioxide), physical agents (such as temperature, humidity, precipitation and hours of sunshine) and socio-demographic variables (such as population density and the capacity of different public or private homes for the elderly) were analysed to understand their association with the indoor air quality of the homes and to determine whether they influence the health of the elderly who live there.
The analysis was carried out in two stages, first taking into account the sizes of different residences and subsequently evaluating the effects of physical agents and pollutants.
For the first stage, the statistical technique of multivariate correlation between the variables was applied in order to determine the relationships between the number of deaths in the residences and the 12 variables based on the size of the residence. Then, a cluster or conglomerate analysis was carried out to determine the relationship between the nursing homes and the autonomous communities under study.
2. Materials and Methods
In addition to children and pregnant women, other population groups are vulnerable to the effects of air pollution. These include people with respiratory diseases, such as asthma, chronic bronchitis or emphysema, those with cardiovascular diseases or diabetes, and elderly people with chronic diseases, particularly those living in residential homes.
The quality of the air in residences is in the IDA2 category, according to the Regulation of Thermal Installations (RITE) in Spain [24]. In this type of building, it is necessary to have a good quality of air in the indoor environment because the elderly population is more vulnerable to infectious agents.
Age and diseases (cardiovascular, respiratory problems) are factors that make the elderly more likely to be negatively affected by pollutants present in the air of residential environments. Susceptibility to pollutant effects is also influenced by the individual’s lifestyle, diet, genetic predisposition, etc.
2.1. Comfort
In indoor environments, the ability to regulate temperature is provided by heating, ventilation and air-conditioning systems. The human body has the ability to regulate its temperature within a range of degrees. Thermal comfort in an indoor environment refers to the general sense of temperature and humidity felt by most people who live there.
Thermal comfort means that a person feels good from the perspective of the surrounding hygrothermal environment. Extreme thermal values can be harmful, even deadly, to human beings. This is because human beings are homeothermic, i.e., they must maintain certain vital parts at an approximately constant temperature. To achieve a feeling of thermal comfort, the most advisable condition is an ambient temperature that is slightly higher than the air temperature and a flow of radiant thermal energy that is the same in all directions and is not excessive above the head. In the UNE EN ISO 7730 standard (thermal comfort in moderate environments) [44], thermal comfort is given by the thermal balance between the body and the environment, i.e., a person will feel comfortable when the internal heat generated and the losses due to evaporation from the body are compensated by the losses or gains due to latent, sensitive or radiant heat with respect to the environment.
2.2. Air Quality Factors
The quality of the environment in nursing homes is affected by indoor air pollutants, such as dust, suspended particles, CO2, CO, NOx, VOCs, bacteria, fungi and viruses, as well as pollution from outside. However, nursing homes need special maintenance of the facilities and environment (air renewal) for the following reasons:
- Elderly residents spend practically all of their time in these places (90%) since it is their home.
- The quality of the environment in the residences will be vitiated by a greater number of viruses, due to the fact that their occupants usually suffer from different infections.
- In residences, food and different types of drugs or medicines are maintained on the premises to care for the elderly, and these products need the air quality to be optimal.
- It is essential to use air-conditioning systems in homes to ensure the comfort of the users and to renew the indoor air. In winter, it is necessary to temper the indoor air to prevent cold currents, which can affect the health of the elderly. In summer, the opposite will occur, and air-conditioning systems need to be used to prevent the occurrence of hot flushes or heat in the occupants.
- The use of air-conditioning systems in residences is as important as their cleaning and maintenance: the lubrication of mechanisms, revision, change of filters, etc.
- Cleaning and disinfection of the building need to be carried out daily to maintain the quality of the indoor environment in the residence halls since different groups of people live together in these areas every day. In the residents’ rooms, in the reception areas and in the corridors, it is necessary to carry out a deep cleaning or even disinfection several times a day to improve the safety of the guests and visitors.
2.3. Consequences of Poor Air Quality
The World Health Organization (WHO) warned that air pollution (outside air) kills about seven million people every year. Indoor pollution levels can be as much as 10–100 times higher than outdoor concentrations, and people (with the elderly being more vulnerable) exposed to poor-quality residential environments can suffer many health problems as a result:
- Airways: dryness, itching/heartburn, nasal congestion, sneezing and sore throat;
- Lungs: chest tightness, choking sensation, dry cough and bronchitis;
- Skin: redness, dryness and generalised itching;
- General malaise: headache, weakness, drowsiness/lethargy, difficulty concentrating, irritability, anxiety, nausea and dizziness;
- Diseases: hypersensitivity pneumonitis, humidification fever, asthma, rhinitis and dermatitis;
- Infections: legionellosis, Pontiac fever, tuberculosis, common cold and flu.
2.4. Chemical Pollutants
The pollutants studied in this work, as well as their impact on human health, are described below.
2.4.1. Nitrogen Oxides (NOx)
The presence of NOx is related to the burning of fuels, mobile sources (vehicles), industrial processes and some natural processes (lightning, and soil microorganisms). Combustion processes emit a mixture of nitric oxide (90%) and nitrogen dioxide (10%). In turn, nitric oxide reacts with other chemicals in the air to become nitrogen dioxide. In indoor environments, the main sources of NO2 emissions are heating systems and gas stoves, as well as tobacco smoke.
At low concentrations, nitrogen oxides are irritating to the upper respiratory tract and eyes. Prolonged exposure can cause pulmonary oedema. Excessive exposure to nitrogen oxides can cause health effects on the blood, liver, lung and spleen. Nitrogen dioxide is also one of the gases that contribute to acid rain that damages vegetation and buildings and contributes to the acidification of lakes and streams.
2.4.2. Suspended Particles
These particles are usually referred to as total suspended particles (TSP) and include all particles with diameters ranging from less than 0.1 microns to 50 microns, as larger particles are deposited by gravity. TSP is expressed as PM (particulate matter) with a sub-index referring to particle diameter, and the unit is the weight of particles per volume of air (mg/m3 or μg/m3). The larger the particle size, the shorter the time they remain suspended in the air and the shorter the distances they can travel. Particles larger than 10 microns fall rapidly near the source that produces them; PM10 particles (with a diameter of ≤10 microns) can remain suspended for hours and travel from 100 m to 40 km, while PM2.5 particles (with a diameter of ≤2.5 microns) can remain in the air for weeks and are capable of moving hundreds of kilometres, moving with air currents and penetrating premises through ventilation systems.
The main sources of particulate matter outdoors are road traffic, especially diesel vehicles, industrial processes, incinerators, quarries, mining, stack emissions, coal heating, etc. Other important sources of particulate matter are dust from agricultural work, road construction or vehicle traffic on unpaved roads. On the other hand, particulate matter is present in almost all indoor environments, mainly from combustion appliances and tobacco smoke. It can also have a biological origin, such as pollen, spores, bacteria and fungi. Typically, most particles of anthropogenic origin are in the range of 0.1–10 μ.
The size range that can be considered dangerous in relation to its effects on human health and air quality is between 0.1 microns and 10 microns in diameter since these particles, once inhaled, generally have a greater capacity to penetrate the respiratory system. PM10 particles are deposited in the upper respiratory tract (nose) and in the trachea and bronchi, while PM2.5 particles with a smaller diameter can reach the bronchioles and alveoli of the lungs.
2.4.3. Formaldehyde
Formaldehyde is a major indoor air pollutant, and due to its chemical properties and serious health effects, an individual assessment is recommended. It is often present in the structure of modern building installations and furnishings, and its concentrations are higher indoors than outdoors. Urea–formaldehyde foam insulation (UFFI) was widely used in the construction of houses until the early 1980s, although its installation is now rare. The main sources of exposure to formaldehyde include particle board, varnishes, lacquers, glues, fibreglass, carpets, non-iron fabrics, paper products and certain cleaning and disinfection products. Due to the extremely high concentrations of formaldehyde in tobacco smoke, smoking is a major source of this compound. Gas stoves and ovens and open fireplaces are also sources of formaldehyde exposure.
Studies conducted in Canada since the early 1990s indicate the presence of formaldehyde in households in concentrations ranging from 2.5 μg/m3 to 88 μg/m3, with an average of between 30 μg/m3 and 40 μg/m3 [46].
The main form of exposure is inhalation; it can also be absorbed through skin contact. The main effects of acute exposure to formaldehyde are irritation of the conjunctiva of the eye and the mucosa of the upper and lower respiratory tract. The symptoms are temporary and depend on the level and duration of exposure. Exposure to high concentrations of formaldehyde may cause burns to the eyes, nose and throat. In the long term, exposure to moderate concentrations of formaldehyde (chronic exposure) may be associated with respiratory symptoms and allergic sensitivity, especially in children. Prolonged or repeated skin contact leads to irritation and dermatitis.
2.4.4. Ozone
In the indoor environment, the ozone originates from equipment that generates a potential discharge between metal plates or with the existence of ultraviolet radiation. This occurs in photocopiers, laser printers, electrostatic equipment for air purification, electric motors and equipment with UV radiation, such as those used in disinfection.
Due to its oxidising power, the immediate health effects are irritation of the respiratory tract and eyes, coughing, breathing difficulties, etc. In the medium term, there may be a general decrease in physical performance, as well as symptoms of general malaise, such as headache, tiredness, heaviness, etc. In the long term, it can produce alterations in pulmonary function (pneumonitis and pneumonia). In general, the effects of exposure to the ozone are accentuated by a higher concentration, longer duration of exposure and higher levels of activity during exposure, although the form of the dose—response relationship is not known. The severity of the response is strongly dependent on the sensitivity of the respiratory system and often on the health status of the exposed person.
2.4.5. Sulphur Dioxide
Data were collected on various pollutants in the different AACCs in Spain. The limit and objective reference values that appear in this study are those established by Directive 2008/50/EC [47] and Royal Decree 102/2011 [48], as well as those recommended by the World Health Organization (WHO) [49]. The data in the following table (Table 2) were extracted from the 127 zones and agglomerations established for the measurement of nitrogen dioxide in the Spanish territory, organised by AACC, with their respective measurement stations. The exceedances of the legal limits and WHO references by zone or agglomeration are reflected in the table. The values that appear correspond to the average value of all of the data collected by the stations in the zone (whether they exceed the limits or not). Some stations are the only representative of their area, and therefore, their data correspond to the average value of the area. The target value for the protection of human health from tropospheric ozone is set for a three-year period, in this case, for the years 2017, 2018 and 2019. The remaining pollutants refer to the year 2019 [50].
For the interpretation of the data in Table 2, the limit values of the analysed pollutants are described below:
- PM10 particles:
- Daily value: No. of days in the year when the 50 μg/m3 limit is exceeded. When it is greater than 35 days, the daily limit established by the regulations is exceeded, and if it is greater than 3 days, the WHO recommendation is exceeded.
- Annual average: Average value of PM10 during the year. The limit established by the regulation is 40 μg/m3 per year, while the WHO recommends not to exceed an annual average of 20 μg/m3.
- PM2.5 particles:
- Daily value: Number of days during the year when 25 μg/m3 is exceeded. When it is greater than 3 days, the WHO recommendation is exceeded.
- Annual average: Average value of PM2.5 during the year. The regulations do not allow exceeding 25 μg/m3 per year. WHO recommends not to exceed 10 μg/m3 as an annual average.
- Nitrogen dioxide NO2:
- Annual average: Average value of NO2 during the year. The annual limit value set by the regulations is 40 μg/m3, which is in line with the WHO recommendation.
- Ozone O3:
- Eight-hour value: Number of days over the year when the average value of 120 μg/m3 (legal) or 100 μg/m3 (WHO) ozone is exceeded in 8 h periods (defined as the maximum daily 8 h moving average). The regulations do not allow more than 25 days per year (averaged over three consecutive years), a threshold also adopted in this report for the WHO recommendation (in 2018).
- AOT40 May–July: Sum of the difference between hourly concentrations above 80 μg/m3 and 80 μg/m3 between 8:00 and 20:00, from 1 May to 31 July. The legal target is 18,000 μg/m3 h (the average of over five consecutive years), and the long-term target is 6000 μg/m3 h (in 2019).
- Sulphur dioxide SO2:
- Daily value: Number of days per year when the average daily value of 125 μg/m3 (legal) or 20 μg/m3 (WHO) of SO2 is exceeded. The regulations do not allow more than 3 days per year, a threshold that is also adopted in this report for the WHO recommendation.
The Table 2 shows the average chemical contaminant measurements for each AACC and the limits according to the regulations specified above.
There are various types of buildings that require special air-conditioning and ventilation conditions, due to their unique use and the special sensitivity of their occupants to temperature changes or indoor air pollution, among other factors.
This is the case for homes for the elderly or geriatric centres, which, although not subject to the regulatory requirements for the specific temperature, relative humidity and ventilation conditions in hospitals, are buildings that require appropriate air-conditioning and ventilation systems; this is necessary to enable the elderly people who live in these facilities to achieve a good standard of living in terms of their personal well-being, due to their special needs in terms of health and comfort.
Air conditioning and other factors related to architecture and interior design can have a profound impact on the sense of home experienced by the elderly who live in this type of centre; furthermore, the dimensions of the room and the position of various elements within a room, such as furniture, have an influence on the movement of air and, therefore, on the efficiency of ventilation [51].
Considering the ventilation of a dwelling in general, research [52] has shown that for an uninhabited dwelling, the concentration of PM2.5 particles for interior conditions without ventilation or forced ventilation is half that of the value in the exterior. In the case of natural ventilation, the difference between inside and outside is almost negligible.
In the analysis of the particle size 10.0 μg/m3 (PM10), there is no appreciable difference between concentrations indoors and outdoors in conditions without ventilation or with natural ventilation, as in both cases, the highest concentration is outside. Finally, in the case of forced ventilation, the concentration sampled outside is double that sampled inside since the filters retain the larger particles.
Geriatric centres are usually full, and the residents are typically sedentary people who move around within small spaces. Residents are also usually together for a long time in different areas (motor room, activity room, dining room, TV room, etc.), which have a high concentration of harmful agents and stale air that must be properly renewed. To optimise the indoor air for these people, good maintenance of air-conditioning equipment is necessary as well as an adequate change of filters.
Based on all of the above and taking into account the two ventilation systems used (natural and forced), it would be logical for nursing homes to use mechanical ventilation systems assisted by natural ventilation.
For the statistical analyses described below, given the condition of forced ventilation, the PM10 and PM2.5 concentrations outside could potentially be regarded as being twice as high as those inside. However, these data were obtained in a passenger compartment (study area) without people. The areas studied in this work are geriatric centres, where there is a great deal of mass, so for this study, the concentrations of both particle types were considered to be identical outside and inside, using the data obtained in Table 2. This hypothesis is described in the Indoor Air Quality study [53] carried out for the National Institute of Safety and Health (INSST) in Spain.
A statistical analysis was performed with the support of the Statgraphics Centurion v.xvi program to determine the influence of all parameters on the number of elderly deaths. A principal component analysis was carried out in order to reduce the number of variables studied with respect to the number of elderly deaths in the homes of each AACC. An analysis of variance was then carried out to identify the convergence of the variables selected in the parameter studied.
3. Results
As indicated at the end of Section 1, the analysis was carried out in two stages, first taking into account the sizes of the different residences, and subsequently evaluating the effects of physical agents and pollutants.
For the first stage, the statistical technique of multivariate correlation between the variables was applied in order to determine the relationships between the number of deaths in the residences and the 12 variables related to the size of the residence. Then, a cluster or conglomerate analysis was carried out to determine the relationship between the nursing homes and the autonomous communities under study.
A total of 3844 private residences and 1573 public residences have been counted in Spain [31]. At this stage of the study, the nursing homes were categorised into private and public, and these, in turn, were classified by their size, resulting in 12 variables, including private residence with less than 25 people (PR < 25), private residence with between 25 and 49 people (PR25_49), private residence with between 50 and 99 people (PR50_99), residences with more than 100 people (PR > 100), residences with an unknown number of people (PR_NI) and the total number of private residences (PR). Similar variables were established for public residences for the elderly, resulting in the following variables: PU < 25, PU25_49, PU50_99, PU > 100, PU_NI and PU [31].
For the statistical study, a multivariate analysis was applied, where the number of elderly persons (old people) who have died in homes is a dependent variable, and the 12 previous variables are independent variables. The following table (Table 3) shows the Pearson correlation coefficients between each pair of variables. The correlation coefficient varies from −1 to +1 and shows the strength of the linear relationship between the variables.
The pairs of variables with P values below 0.05 (95% confidence level) were obtained from the analysis to identify statistically significant correlations. Since the aim is to assess the relationship between residences and the number of deaths in them, the relationships between the RD variable and the other 12 variables must be calculated to then identify independent variables that are significantly related to RD. The variables with the most significant relationships with RD were the following (the p-values obtained are in parentheses): PR25_49 (0.0153), PR50_99 (0.0020), PR ≥ 100 (0.0001), PU50_99 (0.0428) and PU ≥ 100 (0.0000).
It is also observed that for medium-sized and large nursing homes, size is related to the number of deaths; that is, a larger size is associated with more deaths. For different residence types (private or public) with the same size, for example, PR50_99 and PU50_99, the relationship between the number of deceased persons and the size is more significant for the private residence.
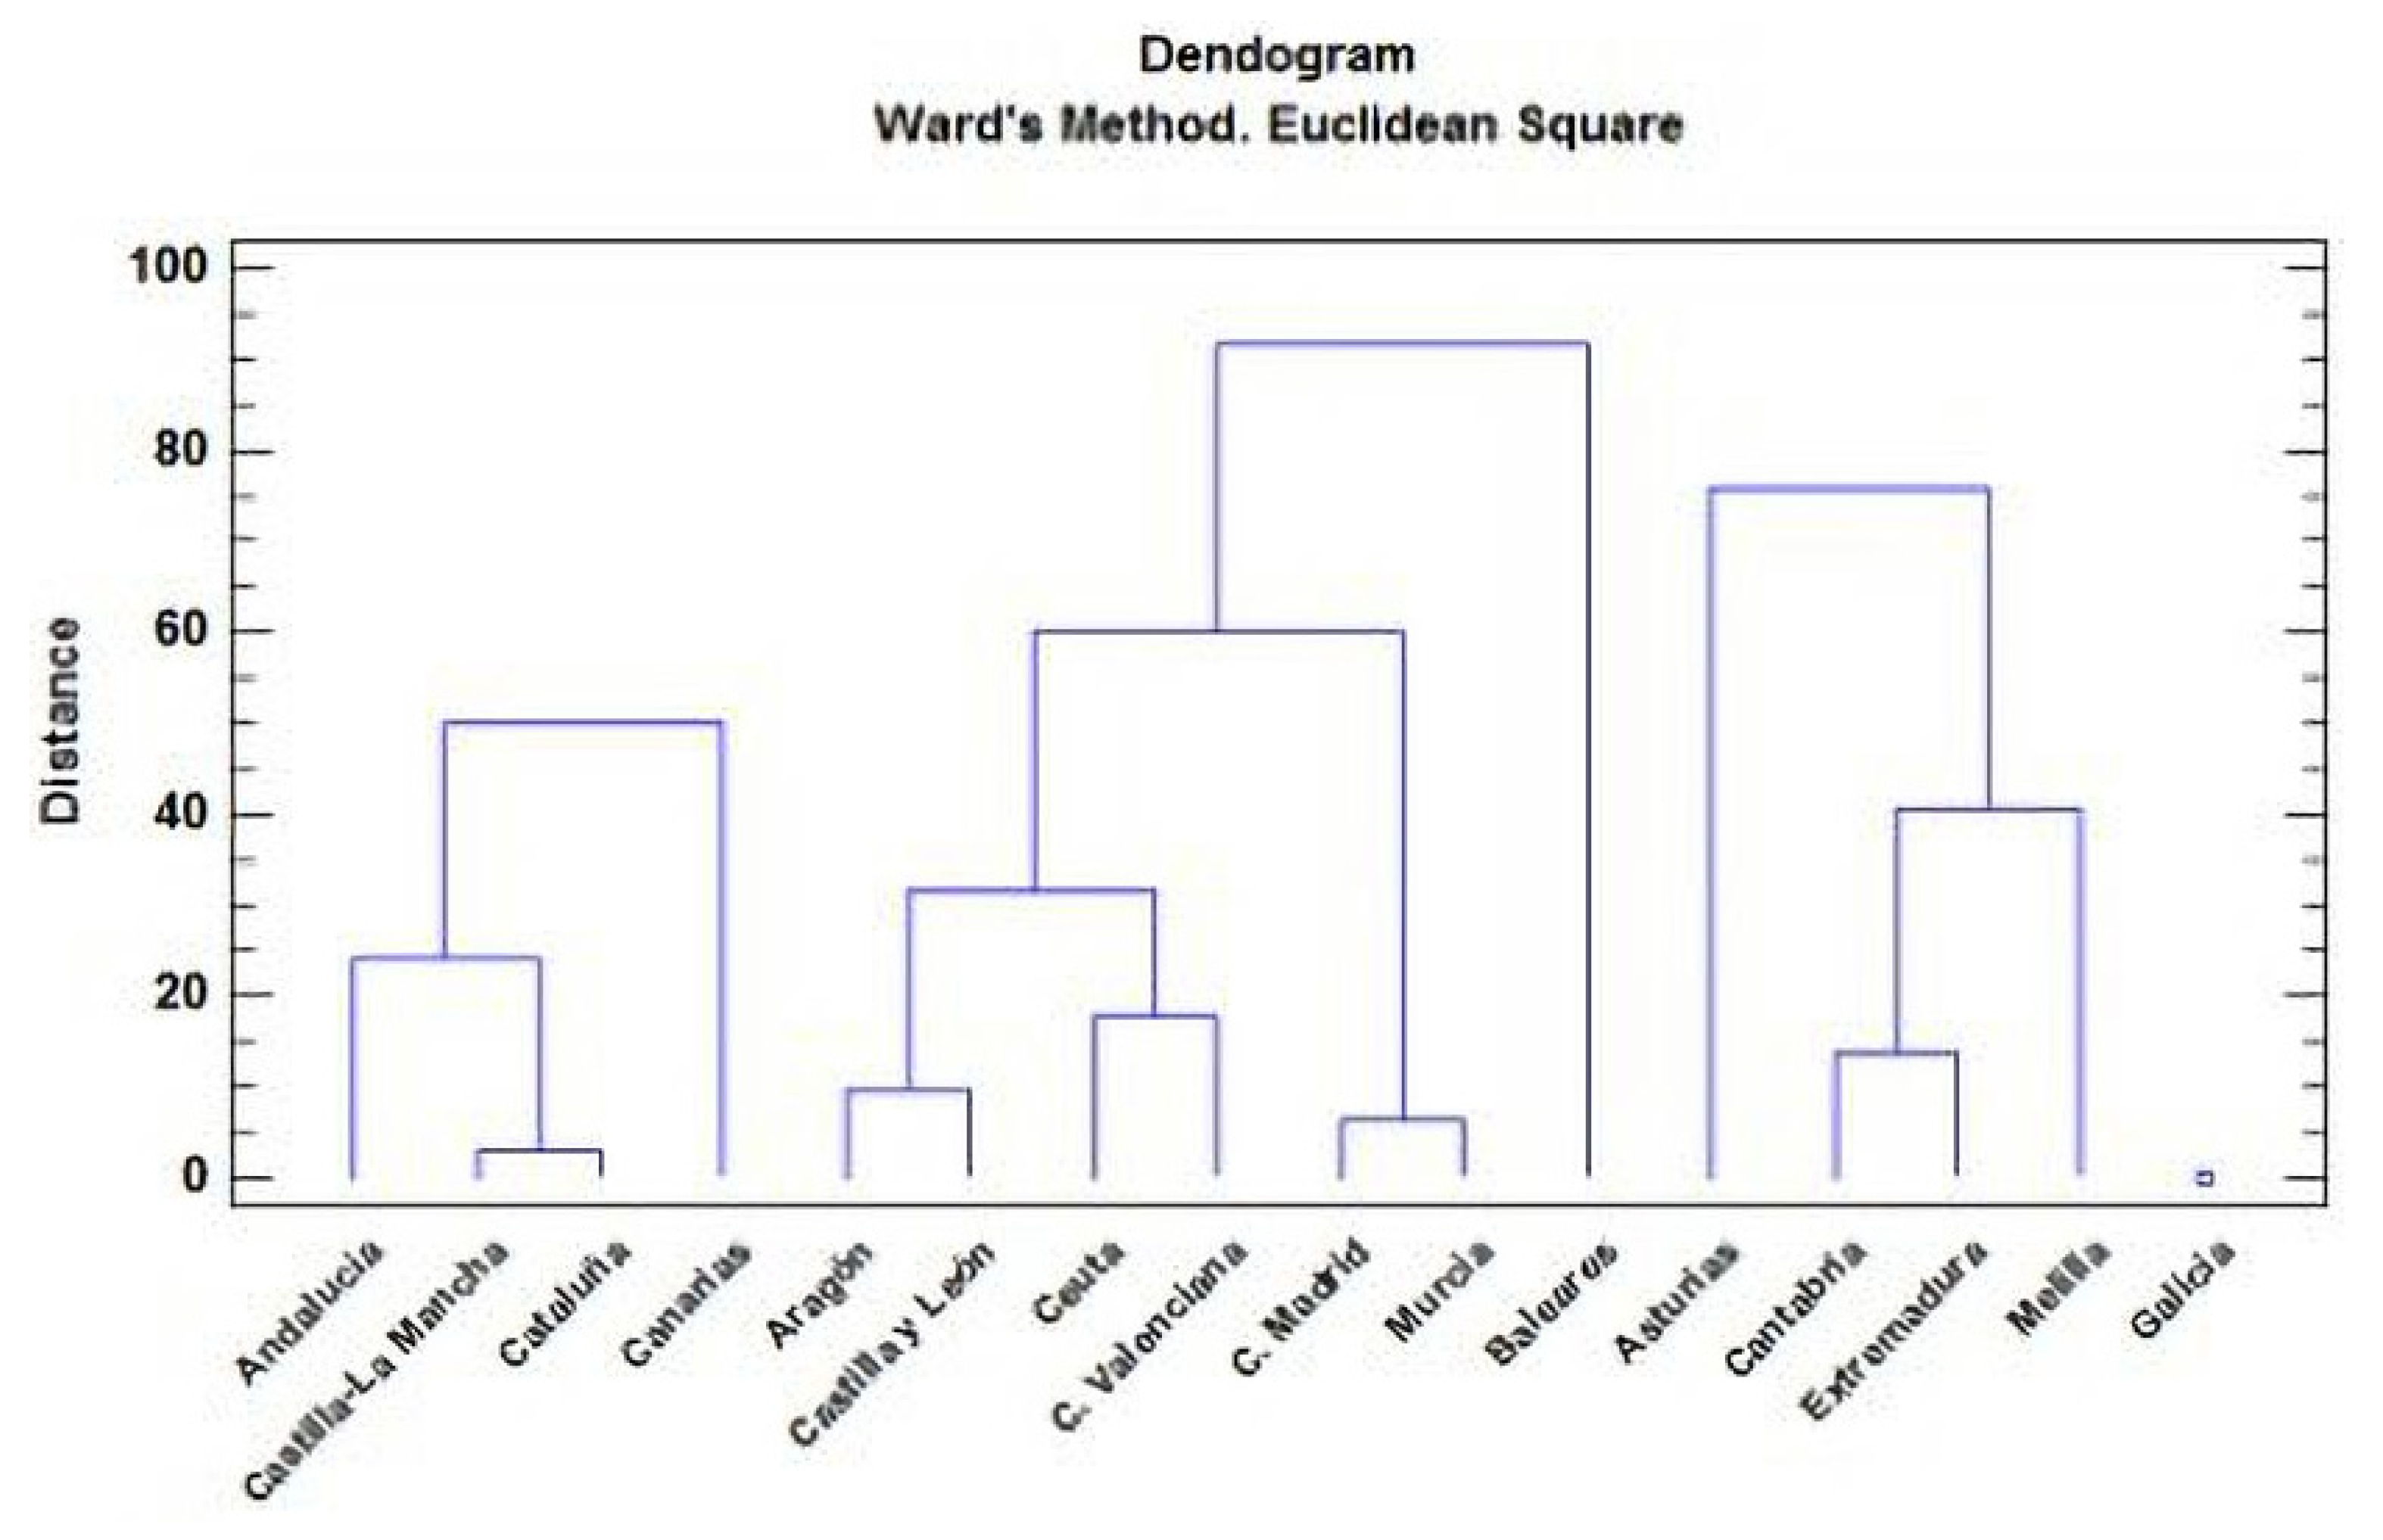
Next, a cluster analysis was performed using the Ward method and the Euclidean square distance metric. Four groups or clusters were established from 19 observations in order to study the groupings of the five variables with the greatest significance or strongest relation with the number of elderly persons who have died in the residences. The six variables of greatest significance are RD, PR25_49, PR50_99, PR ≥ 100, PU50_93 and PU ≥ 100, which were analysed with respect to autonomous communities.
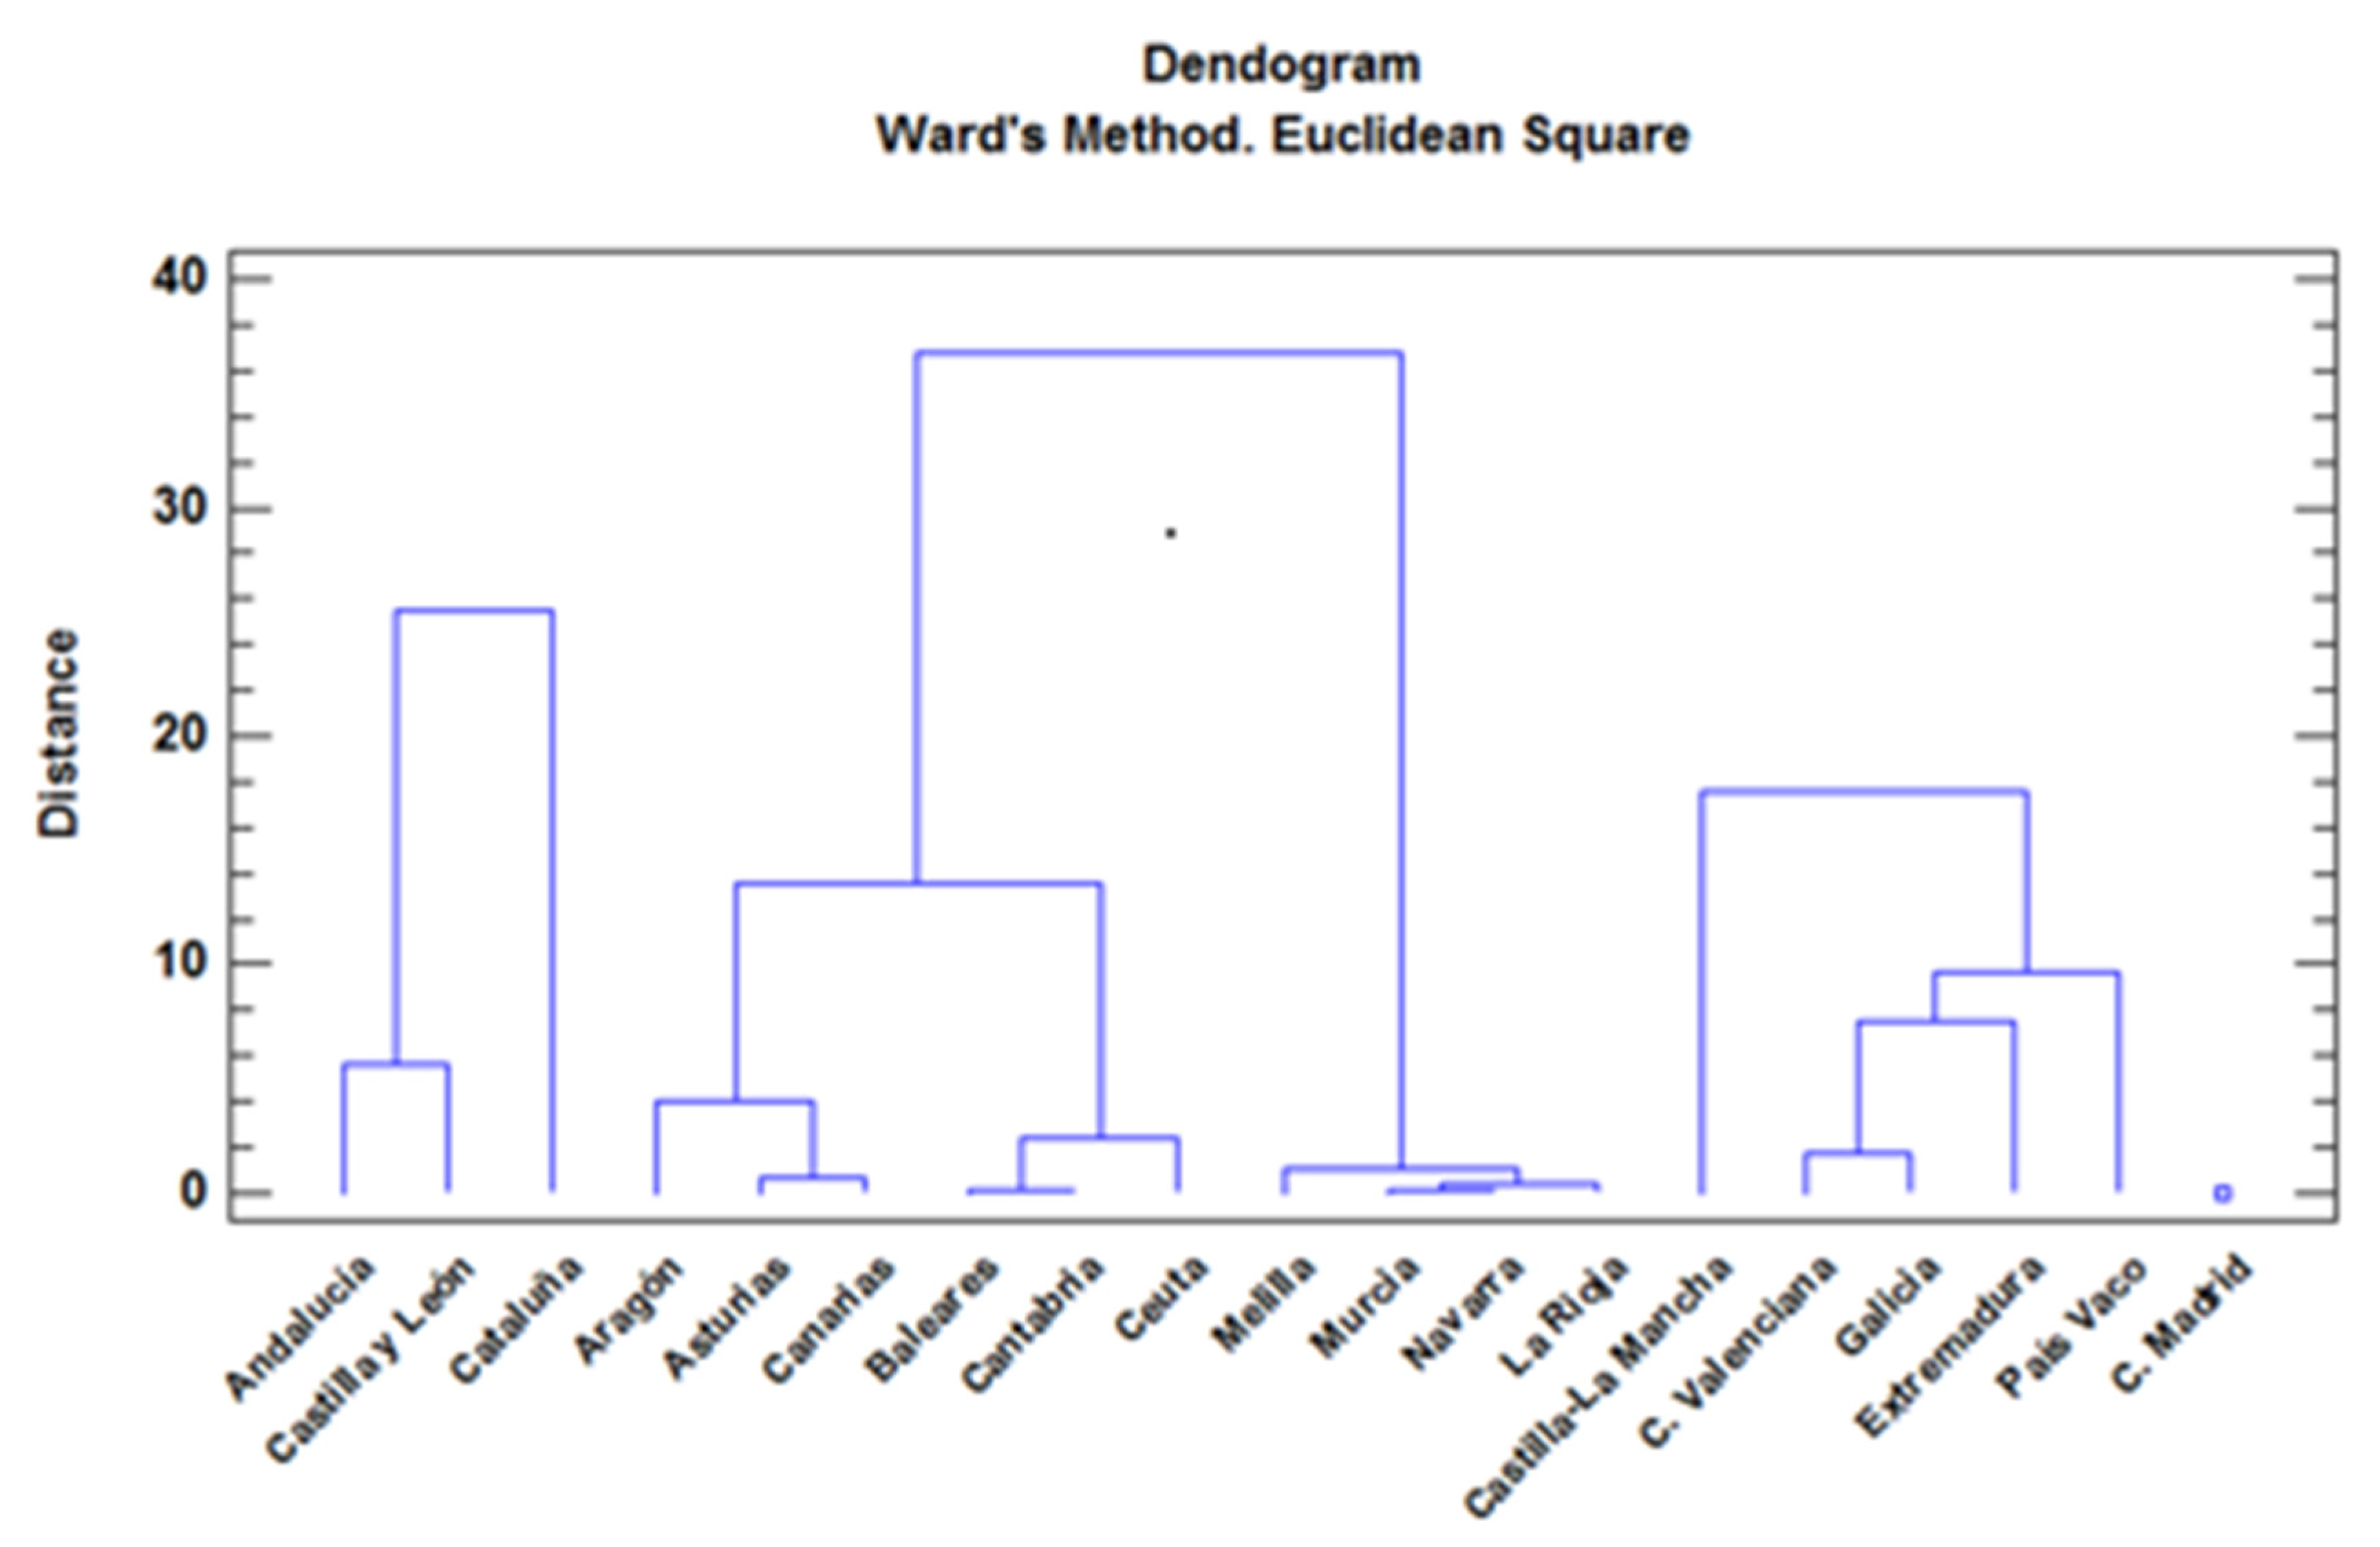
The results are expressed in a graph or dendrogram (Figure 3), which is a type of graphical representation or data diagram in the form of a tree that organises data into subcategories, which are further divided into other subgroups until the desired level of detail is reached. The dendrogram tool uses a hierarchical clustering algorithm. The program first calculates the distances between each pair of classes in the input signature file. It then iteratively merges the closest pair of classes and successively merges the next closest pair of classes and the next closest pair of classes until all classes are merged. After each merge, the distances between all class pairs are updated. The distances at which class signatures are merged are used to construct the dendrogram.
This graph (Figure 3) shows four groups with similar characteristics, according to the variables analysed. To form the groups, the procedure starts with each observation in separate groups, and then the two observations that are closest are combined to form a new group. After recalculating the distance between groups, the closest groups are combined again, and this process is repeated until all four groups are formed.
Figure 3 shows four very clearly defined groups. The first group (G1) is formed by the communities of Catalonia, Andalucia and Castilla y León, and the second group (G2) is formed by the communities of Castilla–La Mancha, C. Valenciana, Galicia, Extremadura and País Vasco. The third group (G3) contains only Madrid, which appears as a point at the lower right of the dendrogram. The rest of the autonomous communities form the fourth group (G4).
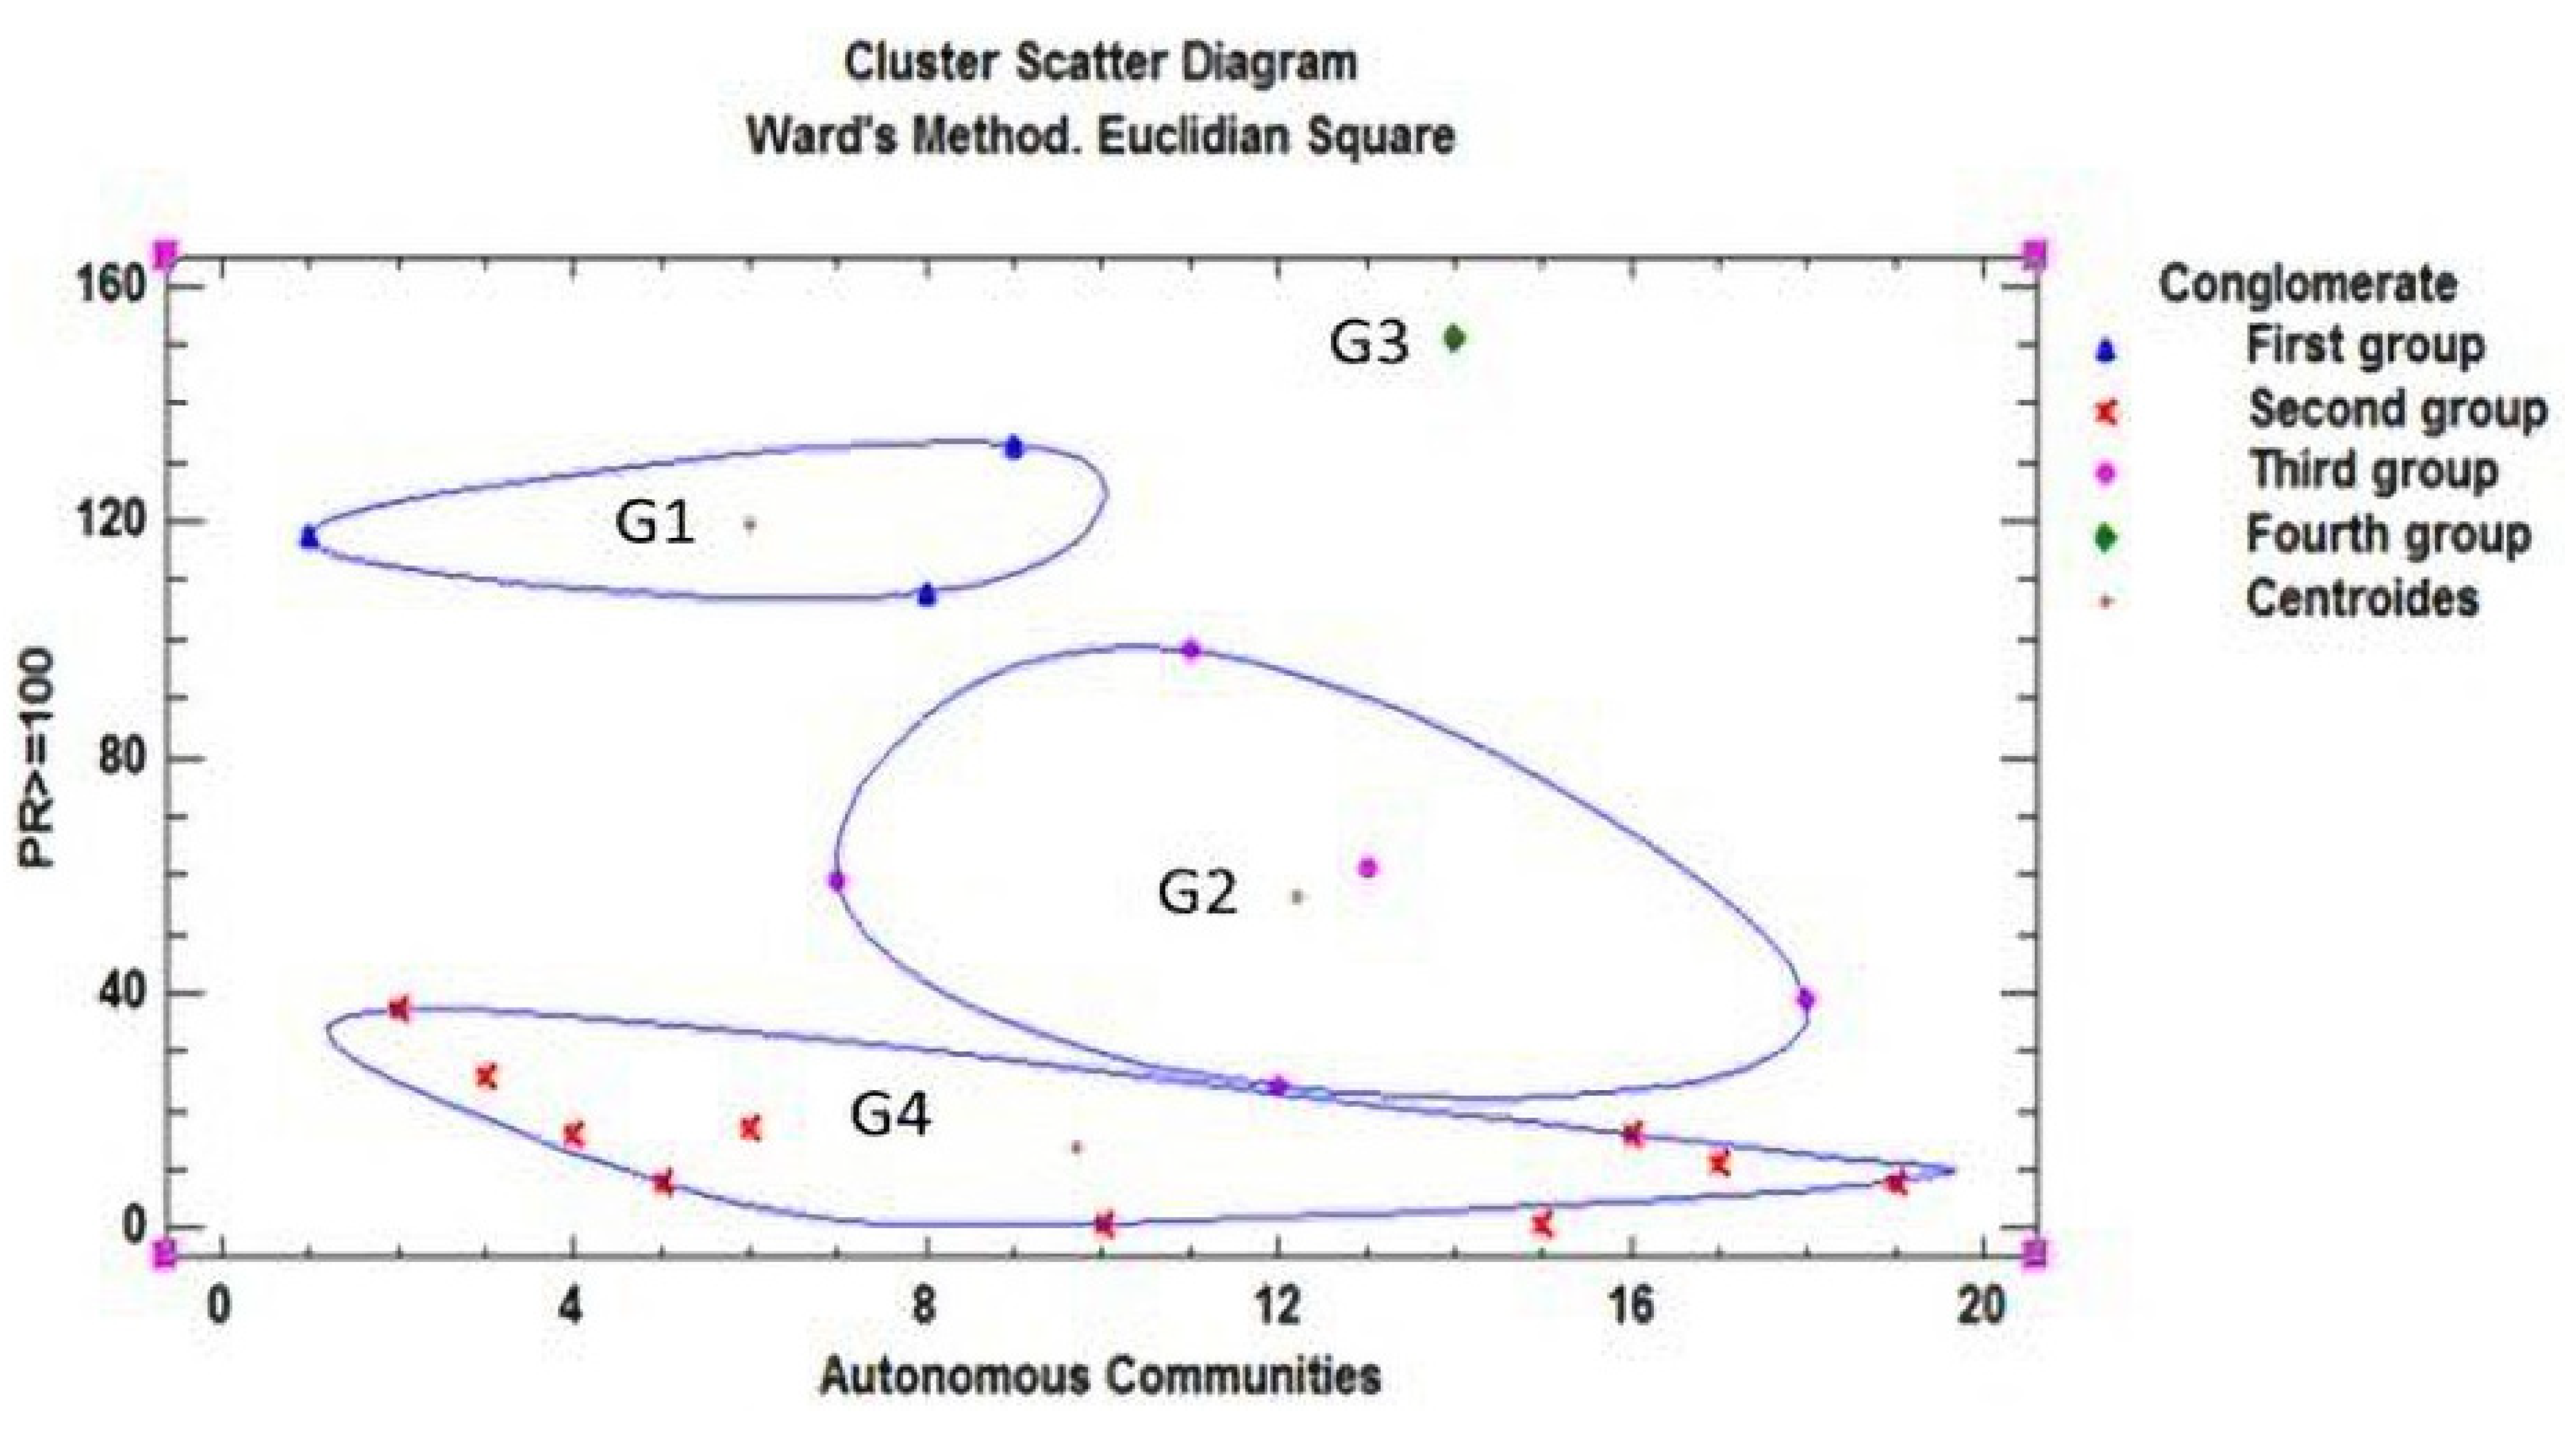
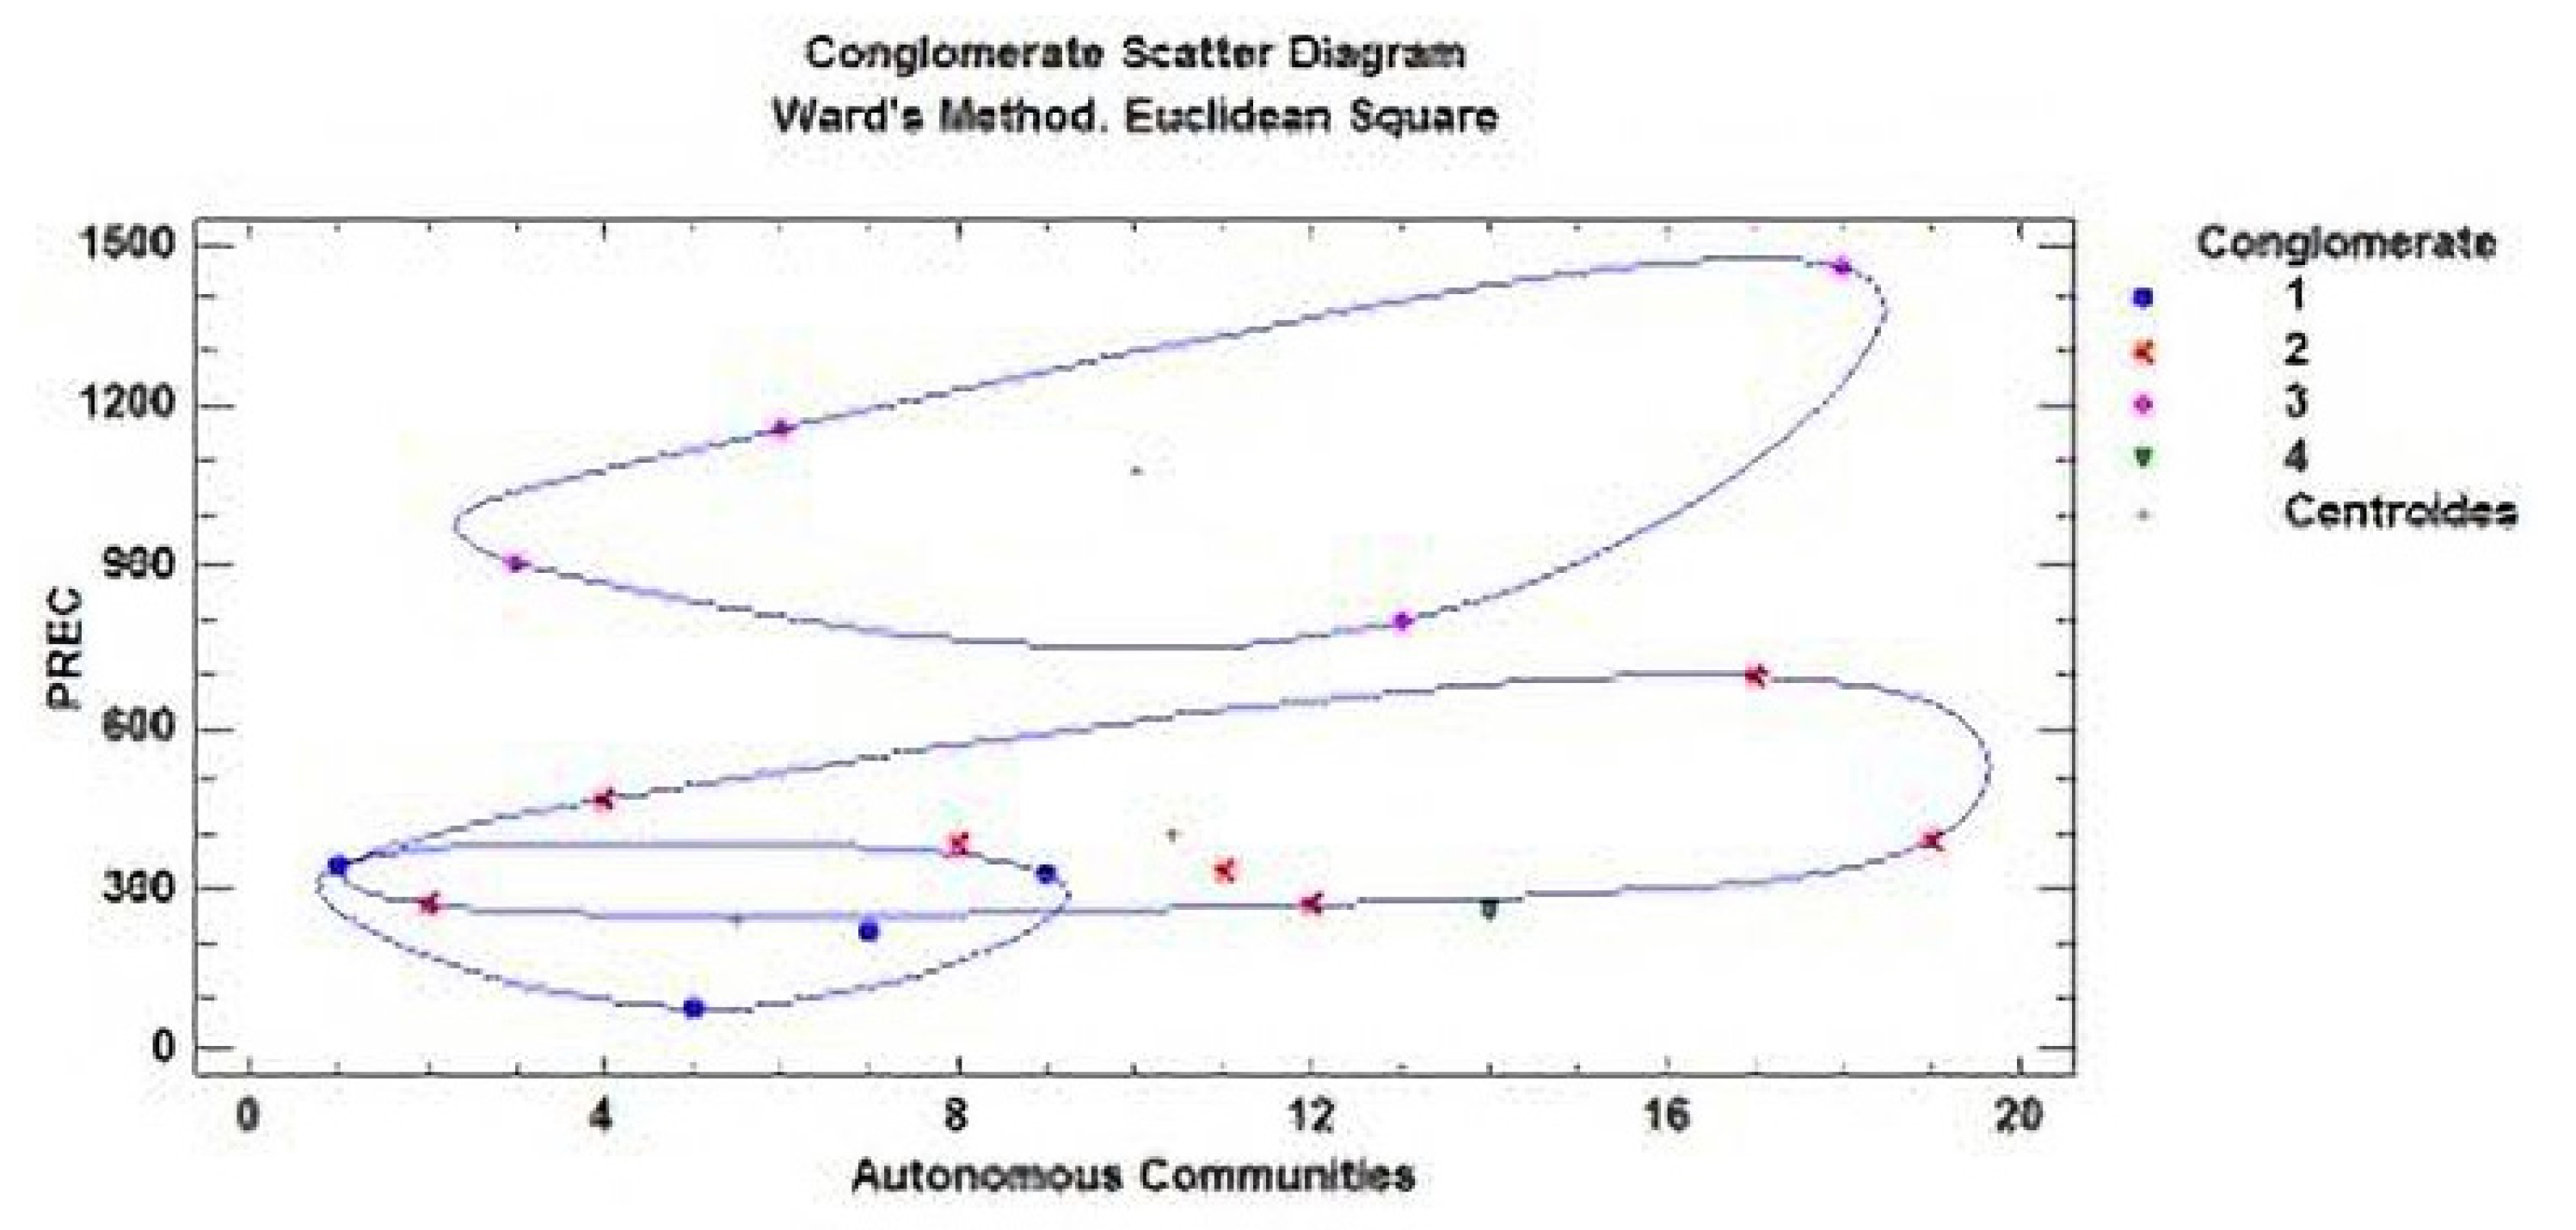
Relating the six previous variables of influence with the four associations or groups of autonomous communities, it was found that the variable most related to the number of deaths in all of the autonomous communities is PR ≥ 100, which denotes private residences with more than 100 persons (large old people’s homes). This relationship is shown in the cluster dispersion diagram in Figure 4. Cluster analysis is a multivariate technique that allows cases or variables in a dataset to be grouped according to the similarity between them, i.e., cluster analysis is a multivariate technique whose main objective is to classify objects by forming groups (clusters) whose within-group homogeneity and between-group heterogeneity are both as high as possible. In each cluster in Figure 4, central points called centroids can be seen. The centroid of a cluster is defined as the equidistant point of the objects belonging to that cluster.
For the second stage, the data corresponding to physical agents and chemical pollutants were analysed to identify relationships between the indoor air quality in the residences and the number of elderly people who have died in different residences in different autonomous communities of Spain. The analysis process was similar to the one carried out in the first stage. To analyse the influence of the size of the residences, a cluster or classification analysis was carried out together with other techniques to relate and compare variables.
The studied variables are the following physical agents: average temperature (AT) in degrees Celsius, average humidity (AH) as a percentage, precipitation (PREC) in millimetres, and hours of sunshine (SH) in hours, among which we included the population density of the communities (PD) in inhabitants per square kilometre. The following variables were the analysed pollutants: average annual particulate matter (PM10AA and PM2.5AA) measured in micrograms per cubic metre, average annual nitrogen dioxide (NO2) measured in micrograms per cubic metre, average annual ozone (O3OCTNOR) measured in micrograms per cubic metre, average annual sulphur dioxide (SO2) measured in micrograms per cubic metre and formaldehyde (FOR) in micrograms per square metre. In total, five variables belonging to physical agents (including population density) and six variables belonging to pollutants were included in this analysis.
The cluster analysis led to the following groups of autonomous communities according to the previous 11 variables and the number of elderly people who have died in the homes.
Figure 5 shows four different groups were obtained, which are labelled differently from those obtained in the analysis of the first stage in order to differentiate them: the first group (FC1) is formed by the communities of Andalusia, Castilla–La Mancha, Catalonia and the Canary Islands; the second group (FC2) is formed by Asturias, Cantabria, Extremadura and Melilla; the third group (FC3) contains only Galicia; and the fourth group (FC4) includes the rest of the autonomous communities.
A multivariate factor analysis was performed using listwise deletion. Factorisation was applied for standardisation of the main components, and a varimax rotation was used to analyse these variables and identify possible relationships. The objective was to extract a small number of the 13 factors (the previous 11, plus DR and AACC) that explain most of the variability considered in the analysis.
Applying the previous statistical methodology, four factors were extracted, because these factors have eigenvalues greater than or equal to the unit. These four factors explain 79.3414% of the variability in all of the data which are shown in Table 4. When carrying out principal component analysis, the initial estimate of the community was established to assume that all variability in the data is due to common factors.
A factor loading matrix was then generated after the Varimax rotation. This is carried out so that the factors have a few high loadings and many near-zero loadings on the variables. This means that there are factors with high correlations with a small number of variables and zero correlation with the rest, thus redistributing the variance of factors.
The following table (Table 5) shows the equations that estimate the values of the common factors after the rotation. The rotation was performed to simplify the explanation of the factors. The first rotated factor is the following equation:
F1 = 0.251871(AA.CC.) − 0.347442(RD) − 0.555084(AT) + 0.912213(AH) + 0.927481(PREC) − 0.920873(SH) − 0.0857457(DP) − 0.070322(PM10AA) + 0.0782349(PM2,5AA) + 0.383983(NO2) − 0.704236(O3OCTNOR) + 0.326536(SO2) + 0.324599(FOR)
The values of the variables in the equation are standardised by subtracting their means and dividing by their standard deviations. The equations for the other three factors, F2, F3 and F4, are obtained in a similar way by simply substituting the coefficients in the corresponding column for each factor.
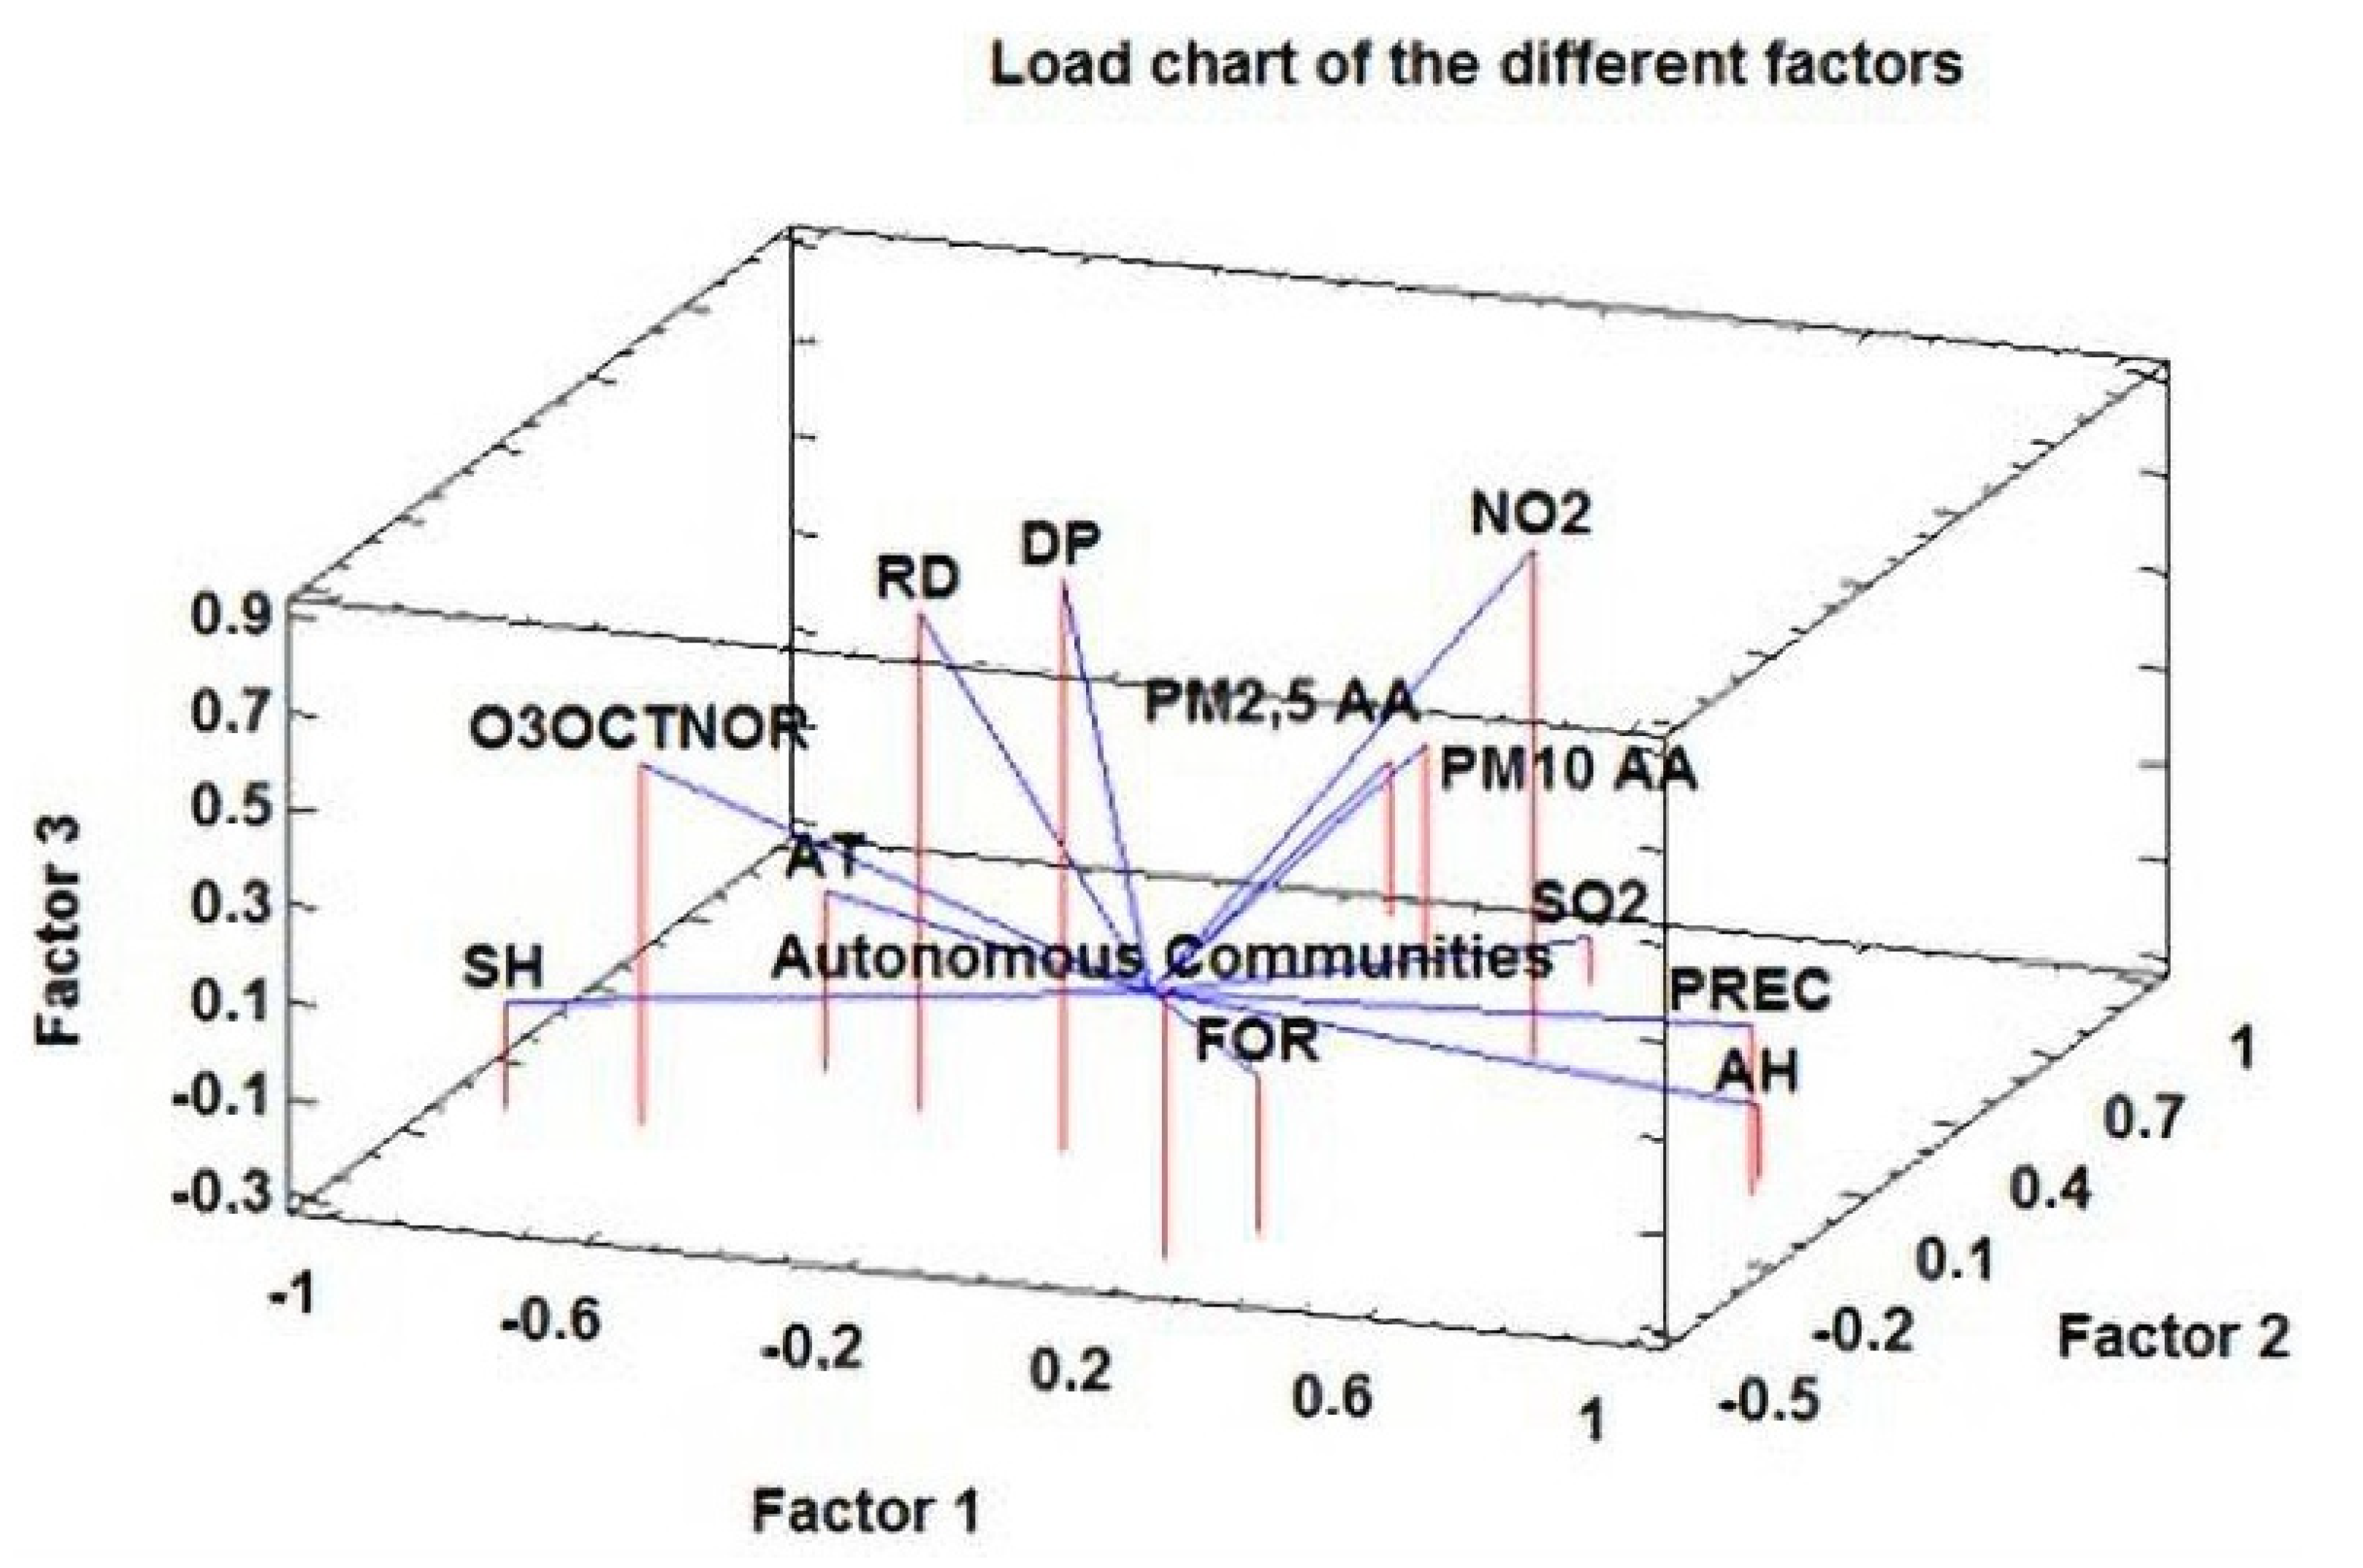
Next, three of the factors obtained are plotted in 3D to evaluate the contributions of the different variables to each factor.
To identify the parameters that influence factor 1, we must look at their position along the length of the box (from the front): the most important parameters are on the right, and the less important ones are on the left. For factor 2, we view the box from the right side (width) and use the same criteria as for factor 1. For factor 3, we examine the height of the box, with the most important ones toward the top and the less important ones toward the bottom.
As indicated by the Figure 6, the highest loadings for factor 1 are provided by the variables PREC, AH, FOR and NO2, whereas AT, RD, SH and O3OCTNOR appear to have low loadings for the same factor. For factor 2, the variables PM10AA, PM2.5AA and SO2 appear to be very important contributors, and the AACC variable appears to be less important. For factor 3, DP, RD and NO2 appear to be influential, and no candidate variables appear to be the contrary. For factor 4, a parallel analysis was carried out, and the results suggest that the variables that most contribute to this factor are FOR and AT, and RD and AACC are of little importance.
Multivariate analysis provides a series of Pearson correlation coefficients between each pair of variables as indicated above. For the two variables X and Y, this coefficient is defined as the quotient between the covariance of the two variables and the product of their standard deviations. The values of the linear correlation coefficient r range between −1 and +1: r = 0 indicates no correlation, r = +1 indicates the maximum positive correlation and linear dependence, and r = −1 indicates the maximum negative correlation and linear dependence. Values close to zero indicate a weak correlation, and values close to extreme values, either −1 or +1, indicate a strong correlation. The sign indicates whether the correlation is direct (positive) or inverse (negative). When the sign is positive, both variables vary in the same direction, either increasing or decreasing. When the sign is negative, even when there is a very high correlation between the two variables, it means that when one increases, the other decreases, i.e., they covary inversely.
The following relationships were found.
The Table 6 shows the pairs of variables identified in the analysis with P-values below 0.05, i.e., with a 95% confidence level. For a better interpretation of the analysis results, a bubble diagram was generated to illustrate the connections between variables. Two groups were obtained. In the first one, the connection of AH, AT, O3OCTNOR and SH to PREC stands out; that is, there is a high correlation between precipitation and humidity, temperature, ozone and sunshine hours. RD, DP and NO2 are connected to this first group through the ozone variable (O3OCTNOR). The main link in the chain, the number of elderly people who have died in homes (RD), depends on population density (PD) and ozone (O3OCTNOR), which in turn depend on the whole chain formed by the other variables analysed. The second group consists of particulate matter and sulphur dioxide. The PM10AA particulate matter acts as a link between the other type of particulate matter (PM2.5AA) and sulphur dioxide (SO2). It is important to note that the formaldehyde variable (FOR) does not appear in any of the above combinations, which may indicate that its contribution to indoor air quality pollution in nursing homes is not very significant.
Carrying out a multivariate cluster or conglomerate analysis, the best combination obtained for the AACC, separated into four groups with all possible combinations with the other 12 variables under study, is the combination obtained with respect to the precipitation variable (PREC). Total significance is not achieved, as can be seen in the Figure 7, because two groups clearly intersect.
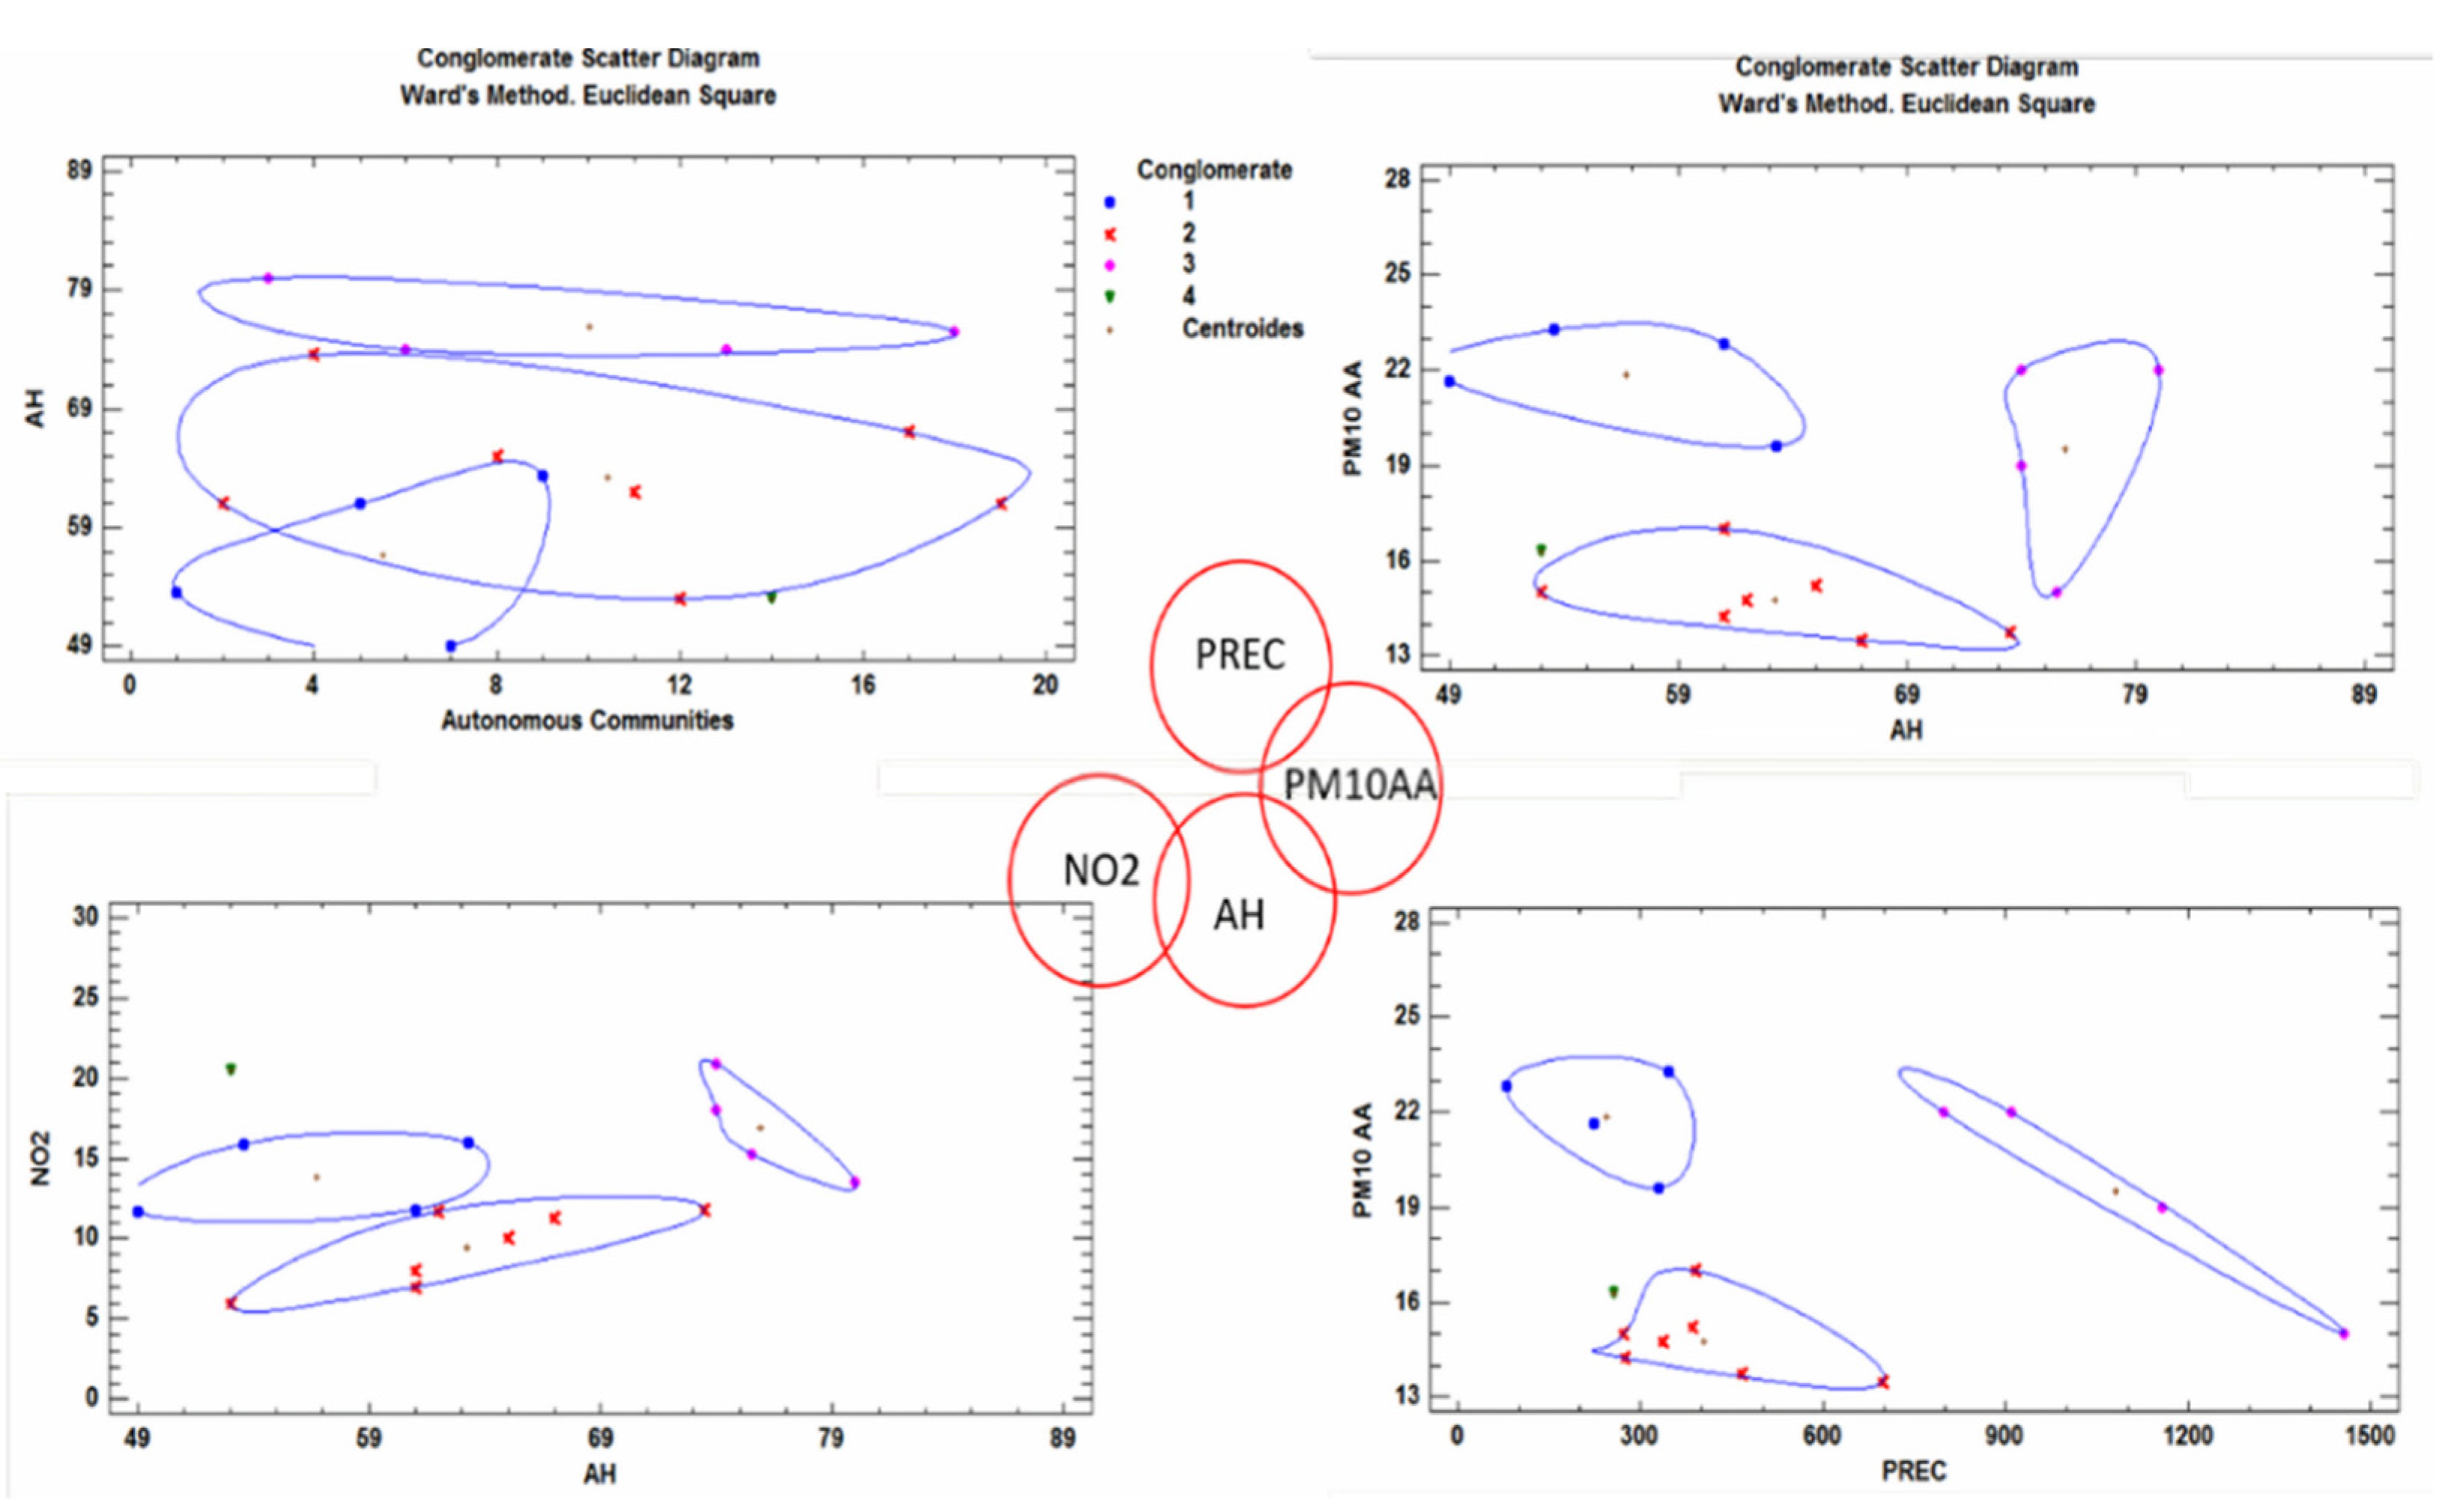
All possible combinations between all variables were tested for a total of 156 combinations. The most significant cases of dependence are between the variables humidity (AH), nitrogen dioxide (NO2), precipitation (PREC) and particulate matter (PM10AA), as can be seen in the following graphs (Figure 8). The graph on the upper left shows the highest significance between the autonomous communities and all of the variables, although the relationship between the AACC and the humidity (HA) is not very strong, as there are intersections between the groups.
In the centre of Figure 8, the relationships through which these four variables influence the number of deaths in nursing homes are indicated by means of red circles.
4. Discussion
The analysis carried out in this work indicates that geriatric homes or senior centres with a capacity of over 100 people in the residence have had the highest number of deaths. The number of elderly persons who have died is greater in private homes than in public homes, probably due to a greater shortage of health resources and personnel, due to their cost.
It was possible to divide both private and public residences, together with the number of deaths therein, into four groups with common or similar characteristics. The first group is formed by the communities of Cataluña, Andalucía and Castilla y León. The second group is formed by Castilla–La Mancha, C. Valenciana, Galicia, Extremadura and País Vasco. The third group is formed only by the Community of Madrid, and finally, the fourth group is formed by the rest of the communities.
Establishing a link between atmospheric factors and harmful effects on human health poses some difficulties. The effects on health are highly variable, and each factor can generate more than one effect on human beings. The physical agents studied, in addition to population density, have a clear connection with the number of deaths through ozone (Table 6). The main meteorological factors that have been shown to have a clear effect on human health are air temperature, humidity, wind speed, hours of solar radiation, pressure and precipitation [54,55], many of which were also analysed in this work, and their dependency relationship was demonstrated.
If the relationship between the number of elderly deaths and the total number of deaths in each community is taken into account, the communities of Castilla–La Mancha (14.40%) and Extremadura (14.13%) present the most significant results. If we study the environmental conditions (physical agents) in these communities compared to their average values in Spain (AT = 16.6 °C, AH = 60.4%, SH = 2739.8 h and PREC = 496.7 mm), then possible contributors to the higher rates of elderly deaths in these regions emerge: their relative humidity is higher than the average, temperatures and hours of sunshine are approximately equal to the average values for the entirety of Spain and, finally, precipitation is lower than the average. Excessive humidity may favour the proliferation of moulds and mites, which increase the risk of respiratory infections [56]. Health problems related to the presence of heat waves (lower rainfall) have worsened, affecting the most vulnerable population groups, i.e., the elderly and children, to a greater extent. The communities of Extremadura and Castilla–La Mancha have a Mediterranean climate type characterised by hot, dry summers with little rainfall in the summer period and long, milder winters.
Six pollutants were studied: ozone, particulate matter (PM2.5 and PM10), sulphur dioxide, nitrogen dioxide and formaldehyde. The results of the analysis indicate that the effects of formaldehyde were not significant. The contribution of this agent to indoor air quality pollution due to construction materials and furniture in the residence was estimated at 3–4% [53].
The ozone values in the communities of Extremadura and Castilla–La Mancha are 32% higher than the average for Spain (60.4 μg/m3). Some studies have shown a direct relationship between daily mortality and tropospheric ozone levels [57]. As tropospheric ozone concentrations increase above the recommended limit (100 μg/m3), health effects are exacerbated, so prolonged exposure can have chronic effects on the respiratory system. These effects may become more pronounced in very hot weather.
The relationship between the two tested types of particulate matter (PM10 and PM2.5) and sulphur dioxide has high significance (Table 6). Anthropogenic activity is the main factor influencing air pollution levels on hourly and daily time scales. However, a clear relationship has also been found between African desert dust intrusions (Saharan air layer) and the number of times that the daily PM10 limit value is exceeded. The contribution of these long-range particulate transport processes to the annual average levels of PM has been especially relevant in the southern and central regions of the peninsula, Melilla and the Canary and Balearic archipelagos. The average annual contribution of African dust episodes to PM10 and PM2.5 levels has also been quantified. There is also a large variation between the north of the peninsula, with annual contributions of 1–2 µgPM10/m3 and <1 µgPM2.5/m3 to the Canary Islands, Melilla and the Balearic Islands, and the south of the peninsula, with 4–6 µgPM10/m3 and 1–2 µgPM2.5/m3 [58].
The factors with the greatest influence on the temporal variability of PM concentration levels include locally recorded surges of anthropogenic pollution (mainly traffic emissions, with some industrial exceptions, demolition–construction, domestic and residential emissions), followed by increases in natural and anthropogenic pollution produced on a regional scale and by African dust episodes. The highest rates of incident solar radiation recorded in the summer months favour the formation of secondary particles, as well as the re-suspension of mineral dust by convective processes in semi-arid environments in the peninsula, such as the autonomous communities of Andalucia, Extremadura and Castilla–La Mancha, which have average PM10/PM2.5 values of (23.27/13.27), (21.66/10.66) and (15/8) in micrograms per cubic metre, respectively. As can be seen from the data, the community closest to the emission of particulate matter from the Sahara Desert has the highest values of particulate matter, compared to the community of Castilla–La Mancha, which is the farthest away, but all of them are strongly affected by this material.
In indoor environments, sulphur dioxide levels are much lower than those outside, provided that there are no indoor sources that might produce it, such as kerosene stoves, boilers or chimneys. For this reason, it is not a pollutant that causes major problems indoors. However, the existence of particles produces a synergistic effect in the presence of sulphur dioxide, since the combination of these two substances produces a greater effect than each substance alone. Sulphur oxides also contribute to the formation of acid rain, as do nitrogen oxides. Murcia and Asturias are the communities with the highest rates of this pollutant. For the communities with the highest rate of elderly deaths in the residence/community, this parameter affects very little. The highest incidence occurs in the community of Extremadura.
The statistical combination of the population density (PD) variable shows that it has the lowest correlation or significance with all of the variables analysed, so it can be ruled out as having an influence on the number of elderly persons who died in the homes.
One more relation that was obtained is the one among precipitation (PREC), humidity (AH), nitrogen dioxide (NO2) and particulate matter (PM10AA). The concentration of PM10 is strongly related to relative humidity and precipitation (Figure 8, upper right and lower right, respectively). The higher the precipitation, the higher the humidity and the higher the particulate matter concentration [59,60]. On the other hand, relative humidity (RH) is closely related to nitrogen oxide (Figure 8, bottom left). There are several internal sources of nitrogen oxide emissions. On the one hand, those that occur in outdoor environments can infiltrate into indoor environments through air change processes. On the other hand, combustion processes in indoor environments are the main internal source of nitrogen oxide emissions. The decreases in industrial, transport and commercial activity since the beginning of the coronavirus outbreak have considerably reduced the levels of atmospheric nitrogen dioxide (NO2) in the AACC, so it is considered a minor factor in this analysis. However, the increase in humidity also causes an increase in the concentration of nitrogen dioxide. For the communities of Extremadura and Castilla–La Mancha, NO2 concentrations show values of 10.66 µg/m3 and 8 µg/m3, respectively, below the national average of 13.89 µg/m3; these values are within the regulations.
Based on the above discussion, it is difficult to establish precisely to what extent indoor air quality may affect the health of elderly people in residential homes, as the data related to exposure and the effect of concentrations are not sufficient. On the one hand, although the effects of acute exposure to many air pollutants are well known, there are important gaps in the data concerning long-term exposures to low concentrations and mixtures of different pollutants. On the other hand, only experience and the rational design of ventilation, occupancy and residential compartmentalisation will guarantee better indoor air quality.
In the last 20 years, studies on the presence of pollutants in many indoor environments have shown higher levels than expected. In addition, pollutants different from those present in outdoor air have been identified. The presence of microorganisms in indoor air can lead to problems of an infectious and allergic nature. Viruses, as in the case of COVID-19, can cause acute respiratory diseases, especially in the most vulnerable people, such as the elderly, particularly those in residences, where the occupation density is usually high and there is significant air recirculation [60,61,62,63].
The ventilation of a building, and thus the ventilation of a nursing home, is measured in air changes per hour. This means that every hour, a volume of air equal to the volume of the nursing home enters from the outside; similarly, every hour, a similar volume of air is expelled from the inside. If there is no forced ventilation, this value usually varies between 0.2 and 2 changes per hour. The concentration of pollutants produced inside the residence will be lower with high values of air changes, although this is not a guarantee of air quality. The compromise between air quality and energy efficiency is of great importance, especially when the residences are private, where the cost factor is very important.
Efforts to reduce the air velocity inside the building, as well as to increase the insulation and waterproofing of residences, require the installation of materials that can be sources of indoor air pollution.
In recent decades, the trend towards designing buildings, including nursing homes, with minimal energy use has led to the development of buildings with very low air infiltration and exfiltration, implemented through equipment such as HVAC systems, which has generally enabled higher concentrations of airborne microorganisms and other types of pollutants. The placement of air inlets near cooling towers or other sources of microorganisms, in addition to making it difficult to access the HVAC system for maintenance and cleaning, is a flaw in the design, operation and maintenance that can affect the health of the occupants, especially the elderly, who live in the building.
5. Conclusions
Based on the data obtained, greater attention should be paid to private residences with a capacity of over 100 people, where the number of deaths is very high.
The data show that the physical agents studied, in addition to meteorological factors, have a clear connection with the number of deaths.
The autonomous communities of Extremadura and Castilla–La Mancha are the most affected by a high number of COVID-19 deaths in the most vulnerable population groups.
Of the pollutants studied, formaldehyde has the least influence on air quality pollution (3–4%).
In addition to carbon dioxide, PM10 and PM2.5 have a strong influence in the southern regions of Spain, Melilla and the Canary and Balearic archipelagos due to dried dust emissions from Africa.
The population density has the weakest correlation with the other variables, so it may be possible to omit this variable in subsequent studies.
PM10 concentration is strongly related to relative humidity and precipitation, and relative humidity is strongly related to nitrogen oxide.
Indoor combustion processes are the main source of nitrogen oxide emissions. Increased humidity also leads to increased nitrogen dioxide concentrations.
Special care must be taken with the data on pollutant concentrations in indoor environments, which, unfortunately, are often below the actual levels.
It is advisable to increase the number of air changes in residences to improve air quality, even if this results in higher energy costs. Health should be prioritised over cost.
These issues should be addressed in the design of buildings, particularly those of nursing homes, where significant deficiencies have been shown in the design of heating, air-conditioning and ventilation systems.
Authors should discuss the results and how they can be interpreted from the perspective of previous studies and of the working hypotheses. The findings and their implications should be discussed in the broadest context possible. Future research directions may also be highlighted.
Author Contributions
Conceptualization, G.S.-C., E.J.L.-F. and R.A.G.-L.; methodology, G.S.-C., E.J.L.-F. and R.A.G.-L.; software, G.S.-C., E.J.L.-F. and R.A.G.-L.; validation, G.S.-C., E.J.L.-F. and R.A.G.-L.; formal analysis G.S.-C., E.J.L.-F. and R.A.G.-L.; investigation, G.S.-C., E.J.L.-F. and R.A.G.-L.; resources G.S.-C., E.J.L.-F. and R.A.G.-L.; data curation, G.S.-C., E.J.L.-F. and R.A.G.-L.; writing—original draft preparation, G.S.-C., E.J.L.-F. and R.A.G.-L.; writing—review and editing, G.S.-C., E.J.L.-F. and R.A.G.-L.; visualization, G.S.-C., E.J.L.-F. and R.A.G.-L.; supervision, G.S.-C. and R.A.G.-L. All authors have read and agreed to the published version of the manuscript.
Funding
This research received no external funding.
Conflicts of Interest
None of the authors have conflict of interest associated with this study to report.
References
- Klepeis, N.E.; Nelson, W.C.; Ott, W.R.; Robinson, J.P.; Tsang, A.M.; Switzer, P.; Behar, J.V.; Hern, S.C.; Engelmann, W.H. The national human activity pattern survey (NHAPS): A resource for assessing exposure to environmental pollutants. J. Expo. Sci. Environ. Epidemiol. 2001, 11, 231–252. [Google Scholar] [CrossRef] [PubMed] [Green Version]
- Wargocki, P. Ventilation, Indoor Air Quality, Health, and Productivity. In Ergonomic Workplace Design for Health, Wellness, and Productivity; Wargocki, P., Ed.; CRC Press: Boca Raton, FL, USA, 2016; pp. 39–72. [Google Scholar]
- Borsboom, W.; De Gids, W.; Logue, J.; Sherman, M.; Wargocki, P.; Civil Engineering, Technical University of Denmark (Eds.) Technical Note AIVC 68 Residential Ventilation and Health; INIVE: Brussels, Belgium, 2016. [Google Scholar]
- Wargocki, P. The effects of outdoor air supply rate in an office on perceived air quality, sick building syndrome (SBS) symptoms and productivity. Indoor Air 2000, 10, 222–236. [Google Scholar] [CrossRef]
- Nathanson, T. Indoor Air Quality in Office Buildings: A Technical Guide; Health Canadá: Ottawa, ON, Canada, 1993.
- Cao, G.; Awbi, H.; Yao, R.; Fan, Y.; Sirén, K.; Kosonen, R.; Zhang, J. A review of the performance of different ventilation and airflow distribution systems in buildings. Build. Environ. 2014, 73, 171–186. [Google Scholar] [CrossRef]
- Li, Y.; Leung, G.M.; Tang, J.W.; Yang, X.; Chao CY, H.; Lin, J.Z.; Yuen, P.L. Role of ventilation in airborne transmission of infectious agents in the built environment-A multidisciplinary systematic review. Indoor Air 2007, 17, 2–18. [Google Scholar] [CrossRef] [PubMed]
- Daisey, J.M.; Angell, W.J.; Apte, M.G. Indoor air quality, ventilation and health symptoms in schools: An analysis of existing information. Indoor Air 2003, 13, 53–64. [Google Scholar] [CrossRef]
- Wagner, H.U.; Verhoeff, A.P.; Colombi, A.; Flannigan, B.; Gravesen, S.; Moulliseux, A.; Nevelainen, A.; Papadakis, J.; Sebel, K. Biological Particles. In In-Door Environments. Indoor Air Quality and Its Impact on Man; Comisión Europea: Brussels, Belgium, 1993. [Google Scholar]
- Wargocki, P. What Are Indoor Air Quality Priorities for Energy-Efficient Buildings? Indoor and Built Environment; SAGE Publications Ltd.: Thousand Oaks, CA, USA, 2015. [Google Scholar] [CrossRef]
- González-Lezcano, R.A.; Hormigos-Jiménez, S. Energy saving Due to Natural Ventilation in Housing Blocks in Madrid. In IOP Conference Series: Materials Science and Engineering; Institute of Physics Publishing: Bristol, UK, 2016; Volume 138. [Google Scholar] [CrossRef]
- Organización Mundial de la Salud. Air Quality Guidelines for Europe, European Series, no. 23; Publicaciones Regionales de la OMS: Copenhagen, Denmark, 1987. [Google Scholar]
- Yocom, J.E.; McCarthy, S.M. Measuring Indoor Air Quality: A Practical Guide; Wiley: Chichester, UK, 1991. [Google Scholar]
- Spengler, J.D.; Chen, Q. Indoor air quality factors in designing a healthy building. Annu. Rev. Energy Environ. 2000, 25, 567–600. [Google Scholar] [CrossRef] [Green Version]
- Hormigos-Jimenez, S.; Padilla-Marcos, M.A.; Meiss, A.; Gonzalez-Lezcano, R.A.; Feijó-MuÑoz, J. Experimental validation of the age-of-the-air CFD analysis: A case study. Sci. Technol. Built Environ. 2018, 24, 994–1003. [Google Scholar] [CrossRef]
- Turiel, I. Indoor Air Quality and Human Health; Stanford University Press: Palo Alto, CA, USA, 1986. [Google Scholar]
- Berenguer, M.J.; Guardino, X.; Hernández, A.; Martí, M.C.; Nogareda, C.; Solé, M.D. El Síndrome del Edificio Enfermo. Guía Para su Evaluación; Instituto Nacional de Seguridad e Higiene en el Trabajo: Madrid, Spain, 1994.
- Wadden, R.A.; Schelf, P.A. Indoor Air Pollution. Characterization, Prediction and Control; Wiley: New York, NY, USA, 1983. [Google Scholar]
- Dimitroulopoulou, C. Ventilation in European dwellings: A review. Build. Environ. 2012, 47, 109–125. [Google Scholar] [CrossRef]
- Van Buggenhout, S.; Zerihun Desta, T.; Van Brecht, A.; Vranken, E.; Quanten, S.; Van Malcot, W.; Berckmans, D. Data-based mechanistic modelling approach to determine the age of air in a ventilated space. Build. Environ. 2006, 41, 557–567. [Google Scholar] [CrossRef]
- Xu, C.; Luo, X.; Yu, C.; Cao, S.J. The 2019-nCoV Epidemic Control Strategies and Future Challenges of Building Healthy Smart Cities. Indoor and Built Environment; SAGE Publications Ltd.: Thousand Oaks, CA, USA, 2020. [Google Scholar] [CrossRef] [Green Version]
- Código Técnico de la Edificación (CTE). Documento Básico HS3: Calidad del Aire Interior; Ministerio de Fomento del Gobierno de España: Madrid, Spain, 2018.
- Fernández, M. Sistema Integral de Ventilación de Viviendas de Acuerdo con el Código Técnico de la Edificación (HS3). Instalaciones y Técnicas del Confort; Ministerio De Fomento: Madrid, Spain, 2008; pp. 10–21.
- RITE. Reglamento de Instalaciones Térmicas de los Edificios; Ministerio para la Transición Ecológica y el Reto Demográfico: Madrid, Spain, 2020.
- Namiesnik, J.; Gorecki, T.; Krosdon-Zabiegala, B.; Lusiak, J. Indoor air quality pollutants, their sources and concentration levels. Build Environ. 1992, 27, 339–356. [Google Scholar] [CrossRef]
- Knoppel, H.; Wolkoff, P. Chemical, Microbiological, Health and Confort Aspects of Indoor Air Quality-State of the Art in SBS; Kluwert Academic: Dordrecht, The Netherlands, 1992. [Google Scholar]
- Davidson, L.; Olsson, E. Calculation of age and local purging flow rate in rooms. Build. Environ. 1987, 22, 111–127. [Google Scholar] [CrossRef]
- Kwon, K.S.; Lee, I.B.; Han, H.T.; Shin, C.Y.; Hwang, H.S.; Hong, S.W.; Han, C.P. Analysing ventilation efficiency in a test chamber using age-of-air concept and CFD technology. Biosyst. Eng. 2011, 110, 421–433. [Google Scholar] [CrossRef]
- Li, J.; Tartarini, F. Changes in Air Quality during the COVID-19 Lockdown in Singapore and Associations with Human Mobility Trends. Aerosol Air Qual. Res. 2020, 20, 1748–1758. [Google Scholar] [CrossRef]
- Liu, M.; Tilton, J.N. Spatial distributions of mean age and higher moments in steady continuous flows. AIChE J. 2010, 56, 2561–2572. [Google Scholar] [CrossRef]
- CCAyES. Centro de Coordinación de Alertas y Emergencias Sanitarias del Ministerio de Sanidad. 2020. Available online: https://www.mscbs.gob.es/profesionales/saludPublica/ccayes/home.htm (accessed on 6 March 2021).
- Abellán García, A.; Aceituno Nieto, P.; Ramiro Fariñas, D. Estadísticas Sobre Residencias: Distribución de Centros y Plazas Residenciales por Provincia. Datos de Abril de 2019. Available online: http://envejecimiento.csic.es/documentos/documentos/enred-estadisticasresidencias2019.pdf (accessed on 22 October 2021).
- INE 2020. Instituto Nacional de Estadística. Available online: https://www.ine.es/covid/covid_inicio.htm (accessed on 6 March 2021).
- Rasmussen, M.; Foldbjerg, P.; Christoffersen, J.; Daniell, J.; Bang, U.; Galiatto, N.; Bjerre, K. Healthy Homes Barometer 2017-Buildings and Their Impact on the Health of Europeans; Rasmussen, M.K., Ed.; VELUX Group: Hørsholm, Denmark, 2017. [Google Scholar]
- Sanglier, G.; Robas, M.; Jiménez, P.A. Gamma Radiation in Aid of the Population in Covid-19 Type Pandemics. Contemporary Eng. Sci. 2020, 13, 113–129. [Google Scholar] [CrossRef]
- Wargocki, P. The Effects of Ventilation in Homes on Health. Int. J. Vent. 2013, 12, 101–118. [Google Scholar] [CrossRef]
- Kim, S.; Kim, J.A.; Kim, H.J.; Do Kim, S. Determination of formaldehyde and TVOC emission factor from wood-based composites by small chamber method. Polym. Test. 2006, 25, 605–614. [Google Scholar] [CrossRef]
- Guo, H. Source apportionment of volatile organic compounds in Hong Kong homes. Build. Environ. 2011, 46, 2280–2286. [Google Scholar] [CrossRef]
- World Health Organization. Guidelines for Indoor Air Quality: Selected Pollutants; WHO Regional Office for Europe: Bonn, Germany, 2010. [Google Scholar]
- Prevención de la Exposición a Formaldehído; Nota Técnica de Prevención; Instituto Nacional de Seguridad e Higiene en el Trabajo (INSHT): Madrid, Spain, 2010; Volume 830.
- Stymne, H.; Axel Boman, C.; Kronvall, J. Measuring ventilation rates in the Swedish housing stock. Build. Environ. 1994, 29, 373–379. [Google Scholar] [CrossRef]
- Kostiainen, R. Volatile organic compounds in the indoor air of normal and sick houses. Atmos. Environ. 1995, 29, 693–702. [Google Scholar] [CrossRef]
- Tham, K.W. Indoor air quality and its effects on humans—A review of challenges and developments in the last 30 years. Energy Build. 2016, 130, 637–650. [Google Scholar] [CrossRef]
- European Collaborative Action. Indoor Air Quality and its Impact on Man. Report No.11: Guidelines for Ventilation Requirements in Buildings; Office fot Publications of EU: Luxembourg, 1992. [Google Scholar]
- UNE EN ISO 7730:2006. Determinación analítica e interpretación del bienestar térmico mediante el cálculo de los índices PMV y PPD y los criterios de bienestar térmico local; ISO: Geneva, Switzerland, 2006. [Google Scholar]
- AEMet. Agencia Estatal de Meteorología. 2020. Available online: http://www.aemet.es/es/portada (accessed on 12 February 2021).
- Health Canadá. 2005. Available online: https://www.canada.ca/en/health-canada/services/health-care-system/reports-publications/canada-health-act-annual-reports/annual-report-2004-2005.html (accessed on 6 January 2021).
- Directiva 2008/50/CE Del Parlamento Europeo y del Consejo. 2008. Relativa a la calidad del aire ambiente y a una atmósfera más limpia en Europa. Available online: https://www.boe.es/doue/2008/152/L00001-00044.pdf (accessed on 14 March 2021).
- Real Decreto 102/2011 (2011). Relativo a la mejora de la calidad del aire. Available online: https://www.boe.es/buscar/act.php?id=BOE-A-2011-1645 (accessed on 10 December 2020).
- Organización Mundial de la Salud (OMS) y Organización Meteorológica Mundial. Atlas de la Salud y del Clima; World Health Organization: Geneva, Switzerland, 2012. [Google Scholar]
- Ceballos, M.A.; Segura, P.; Gutiérrez, E.; Gracia, J.C.; Ramos, P.; Reaño, M.; García, B. La Calidad del Aire en el Estado Español Durante 2018; Ecologistas en Acción: Madrid, Spain, 2018. [Google Scholar]
- Hormigos-Jimenez, S.; Padilla-Marcos, M.Á.; Meiss, A.; Gonzalez-Lezcano, R.A.; Feijó-Muñoz, J. Computational fluid dynamics evaluation of the furniture arrangement for ventilation efficiency. Build. Serv. Eng. Res. Technol. 2018, 39, 557–571. [Google Scholar] [CrossRef]
- Saéz, E. Análisis de la Calidad del Aire en Función de la Tipología de Ventilación. Aplicación al Frototipo E3. Edificación Eco-Eficiente de la UPM; Universidad Politécnica de Valencia: Valencia, Spain, 2017. [Google Scholar]
- Guardino, X. Calidad del Aire Interior; Instituto Nacional de Seguridad e Higiene en el Trabajo (INSHT): Madrid, Spain, 2012; Chapter 44; p. 36. [Google Scholar]
- Sanglier, G.; Robas, M.; Jiménez, P.A. Application of Forecasting to a Mathematical Models for adjusting the Determination of the Number of People Infected by Covid-19 in the Comunity of Madrid (Spain). Contemp. Eng. Sci. 2020, 13, 89–101. [Google Scholar] [CrossRef]
- Fernández-García, J.; Dosil Díaz, O.; Taboada Hidalgo, J.; Fernández, J.; Sánchez-Santos, L. Influencia del clima en el infarto de miocardio en Galicia. Med. Clín. 2014, 145, 97–101. [Google Scholar] [CrossRef]
- Monsalve, F. Influencia del Tiempo y de la Contaminación Atmosférica Sbre Enfermedades de los Sistemas Circulatorio y Respiratorio en Castilla-La Mancha; University of La Rioja: La Rioja, Spain, 2011. [Google Scholar]
- Organización Mundial de la Salud (OMS/WHO). Guías de Calidad del Aire de la OMS Relativas al Material Particulado, el Ozono, el Dióxido de Nitrógeno y el Dióxido de Azufre; World Health Organization: Geneva, Switzerland, 2005. [Google Scholar]
- Querol, X.; Viana, M.; Moreno, T.; Alastuy, A. Bases Científicos-Técnicas Para un Plan Nacional de Mejora de la Calidad del Aire; Spanish National Research Council: Madrid, Spain, 2012.
- Sanglier, G.; González, R.A.; Cesteros, S.; López, E.J. Validation of the Mathematical Model Applied to Four Autonomous Communities in Spain to Determine the Number of People Infected by Covid-19. Mod. Appl. Sci. 2020, 14. [Google Scholar] [CrossRef]
- Villalba, D.; Fajardo, E.; Romero, H. Relación entre el material particulado PM10 y variables meteorológicas en la ciudad de Bucaramanga–Colombia: Una aplicación del análisis de datos longitudinal. In Proceedings of the XXVIII Simposio Internacional de Estadística, Bucaramanga, Colombia, 23–27 July 2018. [Google Scholar]
- Harapan Harapan Itoh, N.; Yufita, A.; Winardi, W.; Te, H.; Megawati, D.; Hayati, Z.; Wagner, A.L.; Mudatsir, M. Coronavirus disease 2019 (COVID-19): A literature review. J. Infect. Public Health 2020, 13, 667–673. [Google Scholar] [CrossRef]
- Law, R.C.K.; Lai, J.H.K.; Edwards, J.D.; Hou, H. COVID-19: Research directions for non-clinical aerosol-generating facilities in the built environmental. Buildings 2021, 11, 282. [Google Scholar] [CrossRef]
Figure 1.
Distribution of the number of public and private nursing homes in the different autonomous communities of Spain.
Figure 1.
Distribution of the number of public and private nursing homes in the different autonomous communities of Spain.

Figure 2.
Graph of number of people >65 years old and deaths of people in this range by autonomous community.
Figure 2.
Graph of number of people >65 years old and deaths of people in this range by autonomous community.

Figure 3.
Dendrogram with the four final groups of analysis.

Figure 4.
Diagram of the dispersion of conglomerates of the autonomous communities, compared to public residences with a capacity of more than 100 people.
Figure 4.
Diagram of the dispersion of conglomerates of the autonomous communities, compared to public residences with a capacity of more than 100 people.

Figure 5.
Cluster diagram of physical agents and contaminants in AACCs.

Figure 6.
Graph of loadings for the different factors.

Figure 7.
Greatest significance of all parameters against AACC.

Figure 8.
Most significant relationships among all parameters studied.


Table 1.
Data on deceased elderly people and physical agents in the autonomous communities.
| CC.AA. | (RD) Residential Deaths | (CD) Community Deaths | Average Temperature (C) | Average Humidity (%) | Precipitation (mm) | Sum Hours (h) |
|---|---|---|---|---|---|---|
| Andalucía | 527 | 1355 | 19.4 | 53.6 | 344.5 | 3342 |
| Aragón | 704 | 838 | 14.6 | 61 | 272.7 | 3112 |
| Asturias | 192 | 313 | 13.8 | 80 | 908.2 | 1962 |
| Baleares | 84 | 216 | 19.3 | 73.5 | 466.5 | 3034 |
| Canarias | 18 | 151 | 22 | 61 | 78.5 | 3165 |
| Cantabria | 135 | 206 | 13.8 | 74 | 1157.6 | 1826 |
| Castilla–La Mancha | 2395 | 2883 | 16.4 | 49 | 221.8 | 2779 |
| Castilla y León | 2519 | 1940 | 12.1 | 65 | 384.3 | 2894 |
| Cataluña | 3394 | 5915 | 16.9 | 63.3 | 329.3 | 2731 |
| Ceuta | 0 | 4 | 19.1 | 74 | 650.2 | 2640 |
| C. Valenciana | 518 | 1365 | 19.1 | 62 | 335.6 | 2808 |
| Extremadura | 418 | 497 | 17.4 | 53 | 271.8 | 3326 |
| Galicia | 269 | 604 | 14.5 | 74 | 798.5 | 2342 |
| C. Madrid | 5909 | 8826 | 16 | 53 | 256.1 | 2970 |
| Melilla | 0 | 2 | 19.6 | 70 | 239.7 | 2778 |
| Murcia | 67 | 144 | 20 | 55 | 177.9 | 3348 |
| Navarra | 422 | 501 | 13.2 | 67 | 696.9 | 2512 |
| País Vasco | 584 | 1455 | 14.4 | 75.5 | 1456.7 | 1780 |
| La Rioja | 199 | 348 | 144 | 61 | 3907 | 2708 |
Table 2.
Table of chemical contaminants with their limits according to regulations.
| PM10 (Particles < 10 Micras) | PM2,5 (Particles < 2.5 Micras) | NO2 | O3 (Tropospheric Ozone) | SO2 | Formal-dehyde | |||||
|---|---|---|---|---|---|---|---|---|---|---|
| Daily Value | Annual Average | Daily Value (OMS) | Annual Average | Annual Average | Eighth Hour (Normative) | Eighth Hour (OMS) | AOT40 (Normative) | Daily Value (OMS) | Annual Average | |
| No Days > 50 µg/m3 Normative: Máx = 35 OMS: Máx:3 | µg/m3 Normative: Máx = 40 OMS: Máx:20 | No Days > 50 µg/m3 OMS: Máx:3 | µg/m3 Normative: Máx = 25 OMS: Máx:10 | µg/m3 Normative: Máx = 40 OMS: Máx:40 | No Days > 120 µg/m3 Normative: Máx = 25 | No Days > 100 µg/m3 OMS: Máx = 3 | Normative: Máx: 18,000 | No Days > 20 µg/m3 OMS: Máx = 3 | µg*m2 | |
| Andalucía | 5.36 | 23.27 | 12.36 | 13.27 | 15,9 | 18.36 | 94.18 | 18,767.54 | 0.36 | 59.2 |
| Aragón | 1 | 14.25 | 2.75 | 8.75 | 8 | 12.75 | 69.5 | 13,766.5 | 0 | 60.4 |
| Asturias | 7.75 | 22 | 6.25 | 11.75 | 13.5 | 1.75 | 18.75 | 3223.25 | 8.25 | 54.6 |
| Baleares | 1 | 13.75 | 1.33 | 7.33 | 11.75 | 8.75 | 77 | 14,018.5 | 0.75 | 76.1 |
| Canarias | 17 | 22.83 | 7.5 | 8.16 | 11.83 | 0.83 | 16.16 | 2274.66 | 2.66 | 57.4 |
| Cantabria | 4.33 | 19 | 1.66 | 9.3 | 18 | 1 | 35.33 | 4180.66 | 1.33 | 68 |
| Castilla La Mancha | 15.33 | 21.66 | 13.66 | 10.66 | 11.66 | 23.66 | 88 | 18,153.66 | 2.33 | 59.3 |
| Castilla y León | 3.1 | 15.2 | 1.8 | 6.4 | 10.1 | 9.6 | 66.1 | 10,345.5 | 2 | 57 |
| Cataluña | 2.2 | 19.6 | 5.64 | 10.5 | 15.92 | 14.66 | 77 | 19,245.78 | 1.76 | 58.2 |
| Ceuta | N/A | N/A | N/A | N/A | N/A | N/A | N/A | N/A | N/A | 61.3 |
| C.Valenciana | 1.21 | 14.78 | 4.28 | 9 | 11.71 | 16.64 | 90.28 | 19,060.35 | 0.64 | 61 |
| Extremadura | 5.5 | 15 | 4.5 | 9 | 11.71 | 16.64 | 90.28 | 19,060.35 | 0.64 | 61 |
| Galicia | 5 | 22 | 10.66 | 12.33 | 20.83 | 6.5 | 33.5 | 4911.16 | 2.66 | 65 |
| C.Madrid | 4.71 | 16.28 | 4 | 10 | 20.42 | 36.14 | 110.71 | 22,506.42 | 0.42 | 57.1 |
| Melilla | N/A | N/A | N/A | N/A | N/A | N/A | N/A | N/A | N/A | 60.6 |
| Murcia | 26.5 | 27 | N/A | N/A | 27 | 28.5 | 76.5 | 22,224.5 | 20.5 | 57.8 |
| Navarra | 0.5 | 13.5 | 5 | 12 | 11.25 | 5 | 29.75 | 8902 | 1.5 | 59.8 |
| País Vasco | 0.87 | 15 | 1.62 | 8.25 | 15.25 | 5 | 36 | 7419.25 | 0.28 | 58.6 |
| La Rioja | 2 | 17 | 1 | 9 | 7 | 7 | 59 | 10,237 | 0 | 60.1 |
Table 3.
Correlations between the different variables analysed.
| CC.AA. | (RD) Residential Deads | (RD) Community Deads | (TD) Total Deads | PR<25 Private Residences (<25) | PR25_49 (25–49) | PR50_93 (50–93) | PR ≥ 100 (≥100) | PR_NI No inf. | PR Total Privates: | PU < 25 Public Residences (<25) | PU25_49 (25–49) | PU50_93 (50–93) | PU ≥ 100 (≥100) | PU_NI No inf. | PU Total Publics: | |
|---|---|---|---|---|---|---|---|---|---|---|---|---|---|---|---|---|
| CC.AA | 0.0458 | 0.0706 | 0.0819 | –0.0371 | –0.2717 | –0.2076 | –0.1577 | –0.4264 | –0.2107 | –0.1546 | –0.3066 | –0.278 | –0.1034 | –0.2121 | –0.273 | |
| (RD) | 0.0458 | 0.9699 | 0.9737 | 0.8801 | 0.5474 | 0.6624 | 0.7889 | –0.0744 | 0.6228 | 0.2255 | 0.2891 | 0.4689 | 0.8157 | –0.0005 | 0.4605 | |
| (CD) | 0.0706 | 0.9699 | 0.9862 | 0.4415 | 0.5704 | 0.6802 | 0.8094 | –0.0124 | 0.6595 | 0.1169 | 0.1946 | 0.5065 | 0.8079 | 0.0174 | 0.3872 | |
| (TD) | 0.0819 | 0.9437 | 0.9862 | 0.545 | 0.6585 | 0.749 | 0.8319 | –0.0041 | 0.7366 | 0.0492 | 0.2005 | 0.5835 | 0.7946 | –0.042 | 0.3741 | |
| PR < 25 | –0.0371 | 0.3659 | 0.4415 | 0.545 | 0.8066 | 0.7652 | 0.5907 | 0.1824 | 0.8462 | 0.02 | 0.3536 | 0.7683 | 0.6352 | –0.0992 | 0.4313 | |
| PR25_49 | –0.2719 | 0.5474 | 0.57 | 0.65 | 0.8 | 0.96 | 0.79 | 0.33 | 0.97 | 0.12 | 0.58 | 0.92 | 0.69 | 0.11 | 0.6 | |
| PR50_93 | –0.2 | 0.66 | 0.68 | 0.74 | 0.76 | 0.96 | 0.87 | 0.23 | 0.97 | 0.22 | 0.57 | 0.92 | 0.69 | 0.11 | 0.6 | |
| PR ≥ 100 | –0.15 | 0.78 | 0.8 | 0.83 | 0.59 | 0.79 | 0.82 | 0.35 | 0.87 | 0.14 | 0.48 | 0.71 | 0.86 | 0.28 | 0.55 | |
| PR_NI | –0.42 | –0.074 | –0.012 | –0.004 | 0.18 | 0.33 | 0.23 | 0.35 | 0.34 | –0.02 | 0.37 | 0.24 | 0.23 | 0.47 | 0.21 | |
| PR | –0.21 | 0.62 | 0.65 | 0.73 | 0.84 | 0.97 | 0.97 | 0.87 | 0.34 | 0.14 | 0.56 | 0.9 | 0.79 | 0.15 | 0.61 | |
| PU < 25 | –0.15 | 0.22 | 0.11 | 0.04 | 0.02 | 0.12 | 0.22 | 0.14 | –0.02 | 0.14 | 0.71 | 0.2 | 0.39 | 0.6 | 0.83 | |
| PU25_49 | –0.3 | 0.28 | 0.19 | 0.2 | 0.35 | 0.58 | 0.57 | 0.48 | 0.37 | 0.56 | 0.71 | 0.62 | 0.55 | 0.58 | 0.92 | |
| PU50_93 | –0.27 | 0.46 | 0.5 | 0.58 | 0.76 | 0.92 | 0.9 | 0.71 | 0.24 | 0.9 | 0.2 | 0.62 | 0.63 | 0.23 | 0.66 | |
| PU ≥ 100 | –0.1 | 0.81 | 0.8 | 0.79 | 0.63 | 0.69 | 0.77 | 0.86 | 0.23 | 0.79 | 0.39 | 0.55 | 0.63 | 0.24 | 0.69 | |
| PU_NI | –0.21 | –0.0005 | 0.0174 | –0.0042 | –0.00992 | 0.11 | 0.18 | 0.28 | 0.47 | 0.15 | 0.6 | 0.58 | 0.23 | 0.24 | 0.59 | |
| PU | –0.27 | 0.46 | 0.38 | 0.37 | 0.43 | 0.6 | 0.66 | 0.55 | 0.21 | 0.61 | 0.83 | 0.92 | 0.66 | 0.69 | 0.59 |
Table 4.
Factor analysis table.
| Factor | Variance | Cumulative | |
|---|---|---|---|
| Number | Eigenvalor | Porcentage | Porcentage |
| 1 | 4.09141 | 31.472 | 31.472 |
| 2 | 2.43407 | 18.724 | 50.196 |
| 3 | 2.28212 | 17.555 | 67.751 |
| 4 | 1.50677 | 11.591 | −79.341 |
| 5 | 0.9121 | 7.016 | 86.358 |
| 6 | 0.67221 | 5.171 | 91.528 |
| 7 | 0.347443 | 2.673 | 94..201 |
| 8 | 0.315038 | 2.423 | 96.624 |
| 9 | 0..22916 | 1.763 | 98.387 |
| 10 | 0.099754 | 0.767 | 99.l54 |
| 11 | 0.0636375 | 0.490 | 99.644 |
| 12 | 0.029118 | 0.224 | 99.868 |
| 13 | 0.0171641 | 0.132 | 100.000 |
Table 5.
Factor loading matrix after applying Varimax rotation.
| Factor | Factor | Factor | Factor | |
|---|---|---|---|---|
| 1 | 2 | 3 | 4 | |
| Autonomous Communities | 0.251871 | −0.471631 | 0.262884 | −0.52807 |
| RD | −0.347442 | −0.0841992 | 0.744084 | −0.367933 |
| AT | −0.555084 | 0.1I2131 | 0.0783305 | 0.662564 |
| AH | 0.912213 | 0.0516618 | −0.145363 | 0.185372 |
| PREC | 0.927481 | −0.00501128 | 0.0524455 | −0.0907723 |
| SH | −0.920873 | −0.145316 | −0.0741857 | 0.215049 |
| DP | −0.0857457 | −0.09622712 | 0.886502 | 0.076693 |
| PM10 AA | −0.070322 | 0.904561 | 0.0244 | 0.1497t4 |
| PM 2.5 AA | 0.0782149 | 0.714746 | 0.174668 | 0.128887 |
| NO2 | 0.383983 | 0.424818 | 0.760336 | 0.172825 |
| O3OCTNOR | −0.704236 | −0.157771 | 0.455243 | −0.23757 |
| SO2 | 0.326536 | 0.72773 | −0.200042 | −0.13505 |
| FOR | 0.324599 | −0.325889 | 0.0236463 | 0.75947 |
Table 6.
Significant relationships between variables and bubble diagram.
| Combination of Factors | Bubble Diagram |
|---|---|
| RD + DP |  |
| RD + O3OCTNOR | |
| AH + PREC | |
| AH + SH | |
| AH + O3OCTNOR | |
| AT + PREC | |
| AT + SH | |
| PREC + SH | |
| PREC + O3OCTNOR | |
| PREC + NO2 | |
| PM10AA + PM2.5AA |  |
| PM10AA + SO2 |
Publisher’s Note: MDPI stays neutral with regard to jurisdictional claims in published maps and institutional affiliations. |
© 2021 by the authors. Licensee MDPI, Basel, Switzerland. This article is an open access article distributed under the terms and conditions of the Creative Commons Attribution (CC BY) license (https://creativecommons.org/licenses/by/4.0/).
Share and Cite
MDPI and ACS Style
Sanglier-Contreras, G.; López-Fernández, E.J.; González-Lezcano, R.A. Poor Ventilation Habits in Nursing Homes Have Favoured a High Number of COVID-19 Infections. Sustainability 2021, 13, 11898. https://doi.org/10.3390/su132111898
AMA Style
Sanglier-Contreras G, López-Fernández EJ, González-Lezcano RA. Poor Ventilation Habits in Nursing Homes Have Favoured a High Number of COVID-19 Infections. Sustainability. 2021; 13(21):11898. https://doi.org/10.3390/su132111898
Chicago/Turabian StyleSanglier-Contreras, Gastón, Eduardo J. López-Fernández, and Roberto Alonso González-Lezcano. 2021. "Poor Ventilation Habits in Nursing Homes Have Favoured a High Number of COVID-19 Infections" Sustainability 13, no. 21: 11898. https://doi.org/10.3390/su132111898
Note that from the first issue of 2016, this journal uses article numbers instead of page numbers. See further details here.