Abstract
Building design is one of the essential elements to consider for maximizing the sustainability of construction. Prior studies on energy and resource consumption and on indoor environmental quality indicators (IEQs) are increasingly frequent; however, attention has not been focused on design as supporting the function performed within architecture. Educational buildings have specific conditions related to teaching methodologies, including activating students and promoting participation and interaction in the classroom. This manuscript aims to explore whether the social dimension of physical space in educational settings can explain a student’s academic outcome. For this, the Learning Environment and Social Interaction Scale was designed and validated and applied to 796 undergraduate students at the University of Coruña, and multiple linear regression analysis was applied to the academic results. The results display a structure comprising five factors; these include novelties such as the division of conventional IEQs into two groups: the workspace and the classroom environment. In addition, place attachment, the design of the classroom as a facilitator of social interaction, the learning value of social interaction, and the satisfaction of the IEQ demonstrated their influence on the academic result.
1. Introduction
Indoor environment quality indicators have been recognized as main features of sustainable design. Therefore, research on their influence is increasingly abundant [1,2,3]. However, an evident sustainability factor—the suitability or usefulness of the environment for the use of the building—has not received the same attention. It seems logical that if the relationship between built space and its function is consistent, the energy and resources required will be more efficient.
Previous studies have focused on the technical measurement of learning spaces through indoor environment quality indicators, which include lighting, ventilation, thermal levels, connection with nature, acoustics, etc. [4,5,6,7,8,9]. The validity of this approach is proven and of great relevance to understand to what extent and how the indoor environment can influence the users of the space. The IEQ has become a key factor in the design and construction of buildings, since internal conditions can significantly influence the well-being, productivity, health and safety of people [10]. Therefore, in recent decades, different certifications have been designed, such as LEED (Leadership in Energy and Environment Design), the WELL Building Standard and Fitwel, for different types of buildings. However, these focus on low energy consumption or technical aspects of the building or on the health and comfort of the users. However, both the socio-psychological factors and those related to intended activities are significant in this field.
Since 1960, attempts have been made to study social interactions and the user’s perception of the environment, an issue that emerged in the field of environmental psychology through post-occupancy evaluation (POE) studies [11]. Sustainable design is not only about reducing emissions and saving energy but also about providing the necessary comfort in the environment for the development of human activities [12,13]. For this reason, in POE studies, it is usual to include user characteristics, work processes, user satisfaction regarding the possibilities of interaction with their colleagues, and privacy and comfort [14].
Current studies have explored the effects of poor environments on cognitive functions, including social cognition [15]. Advances in this field confirm that subjective issues play an important role in user behavior, such as attitude, social customs, or perceived behavioral control, as well as intentionality [16]. Social values, cultural differences, and personality traits have also become factors to be valued among the scientific community [17,18,19]. However, there is still some uncertainty about the selection and use of appropriate contextual, social and personal variables; this could be addressed through the implementation of interdisciplinary frameworks [20]. In addition, recent studies have emphasized the need to consider the relationships and interactions between physical or technical variables and personal and social factors [9,21].
This manuscript deals with the learning space typology that considers social interactions as a means of learning. Regarding educational buildings, the literature has already identified that elements such as satisfaction or comfort, functionality, the possibilities of social interaction and place attachment are key for the development of learning [22]; this will be considered in this research as part of the social dimension of space.
1.1. Peer Effect and Active Methodologies in Higher Education
In recent decades, peer effect studies have provided contradictory results, including positive and negative influences [23,24] as well as large or small effects in similar contexts. Some investigations have focused on the characteristics of classmates. Booij, Leuven, and Oosterbeek [25] found that low-ability students perform better when in groups with peers of a similar skill level. Others have focused on group size, such as Brady, Insler, and Rahman [26], who identified different social influences depending on group size, showing negative effects at a broader company level and positive effects at a narrower company level.
The influences of social interactions and the peer effect have been analyzed in recent studies on educational buildings that include disruptive and attractive methodologies such as gamification [27,28]. In addition, classroom design can foster interaction and collaboration among peers, affecting teaching methodology and improving learning [29]. Specifically, flexible spaces are more appropriate for adapting to different teaching methodologies, including a better flow of interactions between users [30].
There is general agreement on the benefits of social relationships among classmates [31,32], since they provide companionship, affection, intimacy, assistance, improvement of self-esteem and emotional support, as a basis for the development of identity [33]. The results show that those students who participate in positive social interactions with other classmates are associated with greater academic motivation as well as a higher academic result [34,35].
1.2. Satisfaction and IEQ Perception
Comfort and satisfaction are social constructions that can influence the value of the indoor environment, not only over time, but also from one culture to another [36]. However, this satisfaction covers environmental aspects and social characteristics that can contribute to the mental harmony or instability of the users [37]. This indicator has been correlated with building characteristics, personal characteristics and variables related to the purpose of the space [38]. Under these premises, studies were carried out regarding buildings classified as “green”, showing that the interior environments led to a positive perception that affected productivity [39,40]. In addition, some research has focused on how the social influence of friends and family affects the opinion and satisfaction of sustainable elements [41]. Non-physical and subjective aspects influence the way occupants perceive environmental comfort; therefore, psychological and social factors can positively affect users’ perception of comfort [42]. For this reason, satisfaction as a variable that favors social relations is part of Kopec’s theory of integration [43] on the relationship between human beings and space. The literature on buildings destined for education reiterates that the satisfaction of students with their environment is related to their academic results [44,45].
Studies on the comfort and satisfaction in school buildings have identified that a good quality environment positively affects the well-being, learning capacity and comfort of students [46]. It has been suggested that a better understanding of students’ perceptions is necessary to understand their comfort level with the different variables of building design, such as temperature or lighting [47]. The effects of artificial light on the emotional state of adolescent students have also been explored, since inadequate lighting can be very harmful to the psyche of young people. Thus, ethical and healthy regulations regarding the optimization of lighting have been put forward [48]. Satisfaction regarding the indoor environment of schools, according to thermal comfort, air quality, and visual and acoustic comfort, has been addressed in recent studies, verifying that the discomfort of a specific element does not result in general discomfort; thus, individualized treatment of IEQs is necessary [49]. The literature has brought to light visual or aesthetic satisfaction, beyond the color of the classroom, as being influenced by images in primary education settings [50]. This is an unusual practice in university classrooms, but it is important to keep in mind the possible relationship with the place attachment. Other studies have shown that the level of satisfaction decreased when there were many people in the same room, which can be attributed to a lower degree of perceived control and greater necessary social interactions [51].
However, perceptions of comfort and satisfaction are usually incomplete or biased, which leads to failure when performing any type of intervention. Specifically, in educational buildings, the approach that involves students in POE provides researchers with contextualized information on which elements are most influential in overall comfort. This helps analyses to be carried out with greater precision, taking into account the factors that maximize solutions [13,52].
1.3. Place Attachment
In recent years, researchers have become more interested in the human dimension of sustainable design as it relates to health and well-being [53]. POE studies identified a series of outcomes related to the well-being of users, such as reduced absenteeism and stress, greater comfort and learning outcomes, and more positive attitudes [54,55]. However, among these human factors, place attachment and the relationships between people and their places have received little attention in the literature [56]. This fact is reflected in the multiple definitions of this construct in the literature before Scannell and Gifford [57] synthesized them and created an organizational framework with three main dimensions.
The first focuses on a personal and cultural dimension and is centered on who is becoming attached and how places are meaningful, both in individual and collective experience. The second brings a dimension that focuses on what a person is attached to, including physical and social characteristics, such as the natural environment that surrounds him or her or the opportunities for interaction with the rest of the users. The third, a psychological process dimension that focuses on how attachment includes certain behaviors, affective bonds and cognition, such as memories. Thus, in the case of students, their need to define their territory and their sense of belonging to it can be seen, for example, in the choice of seating area [58]. Affection is a key element in the process of creating a bond between the person and the place. Therefore, place attachment is more likely to occur in spaces with physical characteristics that support stress reduction, that evoke memories of people, and that facilitate the inclusion and interaction of other people [59,60]. It is also related to the personal or cultural circumstances of the users, which can lead to variations in the affective bonds with the different architectural contexts and even with the other users of the space [61].
Several studies have highlighted the value of place attachment concerning green or sustainable buildings and have tried to determine a connection between these feelings and pro-environmental behavior [62]. Thus, its consideration in educational buildings has the potential to support sustainable behavior, providing an incentive for green building practices [63]. Building design strategies focused on human attachment have also been found to improve community well-being, quality of life, and resilience [64]. They can also increase the amount of time spent in the building and the kinds of activity engaged in [65]. In this sense, Heerwagen and Zagreus [66] found an association between the feeling of place attachment and pride in the adoption of actions focused on sustainability. The results provided information on a series of psychosocial benefits, such as a more positive work experience, better communication between colleagues, and a strong connection with the environment and the company.
Regarding learning spaces, holistic studies on place attachment have shown that it has a greater value than other common IEQs, such as light, in the development of educational activities [67].
1.4. Objective
The objective of this research is to explore whether the social dimension of physical space in educational settings explains a student’s academic results through a post-occupancy evaluation design.
2. Materials and Methods
The research was conducted using a quantitative approach that sought to understand the perception of students regarding their satisfaction with their indoor environment and its ability to foster learning interactions.
First, appointments were arranged with each dean or person in charge of infrastructure to visit centers to identify the learning space designs. Figure 1 shows selected classrooms and their diversity in layout design, lighting typology, furniture, information technology support, etc. Then, the professors who teach in these classrooms were identified, and they were contacted to determine their availability for applying the data collection instrument to their students. The purpose of the study and the average time of responding to the questionnaire were indicated. Consequently 21 of the 30 groups were able to establish a date to conduct the test.
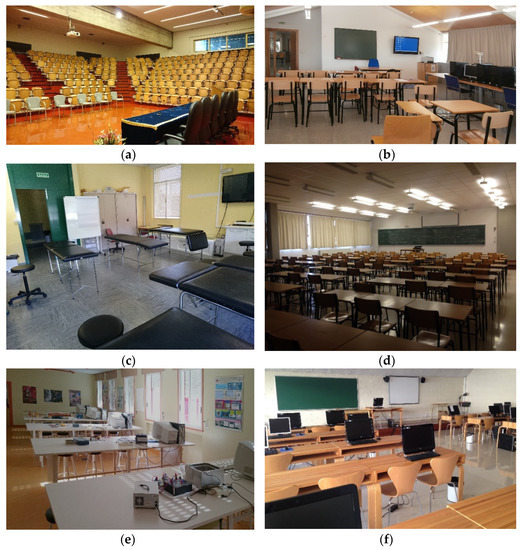
Figure 1.
Pictures of some classrooms in the sample: (a) lecture hall; (b) practice room; (c) health practice room; (d) lecture room; (e) engineering practice room; (f) computer lab.
The Learning Environment and Social Interaction scale (LESI) was provided in hard copy, and the students’ answers were entered into a digital spreadsheet (educational Microsoft Excel 365).
The analysis of data consisted of a description of the sample, the reliability and validity, and prediction of the Grade Point Average (GPA) from IEQ satisfaction and learning interaction. First, the mean value and the standard deviation were defined to determine the empirical framework. Then, Cronbach’s Alpha and Exploratory Factor Analysis were conducted to evidence the reliability and the construct validity of the data collection instrument. Finally, multiple linear regression was calculated to identify which items of the scale could predict academic performance and to what extent. The linear independence of predictor variables and the homoscedasticity of residuals were checked.
2.1. Sample
The sampling model is non-probabilistic by convenience and intentional, based on the representativeness of the areas of knowledge and the diversity of the space design. In other words, more and less illuminated rooms, more and less ventilated rooms, etc., were searched to obtain a sample with a wide range of possibilities in order to be able to relate the different levels of the predictor variables. The LESI scale was completed by 796 undergraduate students from 18 bachelor degree programs at Universidade da Coruña, who were reasonably balanced among arts and humanities, engineering and architecture, health science, science, and social and legal sciences. Table 1 shows the distribution of participants by bachelor degree program. The number of students in each degree program is proportional to participants in the study.

Table 1.
Sample distribution by bachelor degree program.
2.2. Data Collection Instrument
Learning Environment and Social Interaction (LESI) is a 1–7 Likert scale that is part of the Student Perception Questionnaire of Learning Space [68]. The instrument seeks to measure the collective perception of the environment by users regarding its power to favor learning interactions, the indoor environment quality satisfaction, and the importance of learning interaction in education. Students rated 18 independent variables from 1 (completely disagree) to 7 (completely agree). In addition, grade point average was requested at the beginning of the test template (Table 2).
Table 2.
LESI scale items.
3. Results
3.1. Descriptive Analysis
Regarding the descriptive analyses (see Table 3), the LESI items could be grouped around four values:
Table 3.
Descriptive results of LELI scale.
- A value close to 3.40 was determined for the ventilation satisfaction degree (m = 3.32), the importance of interactions with professors from other courses (m = 3.43), the thermal level satisfaction (m = 3.45) and the furniture comfort satisfaction (m = 3.52).
- Values close to 4 represent the learning space attachment (m = 3.80), the connection with nature satisfaction (m = 3.84), the room layout satisfaction (m = 4.04), the acoustic satisfaction degree (m = 4.08), the importance of interactions with students from other courses (m = 4.14), the lecture classroom favors teacher–student interactions (m = 4.30) and the practice classroom favors teacher–student interactions (m = 4.31).
- A score of over 4.70 was determined for the wall color satisfaction (m = 4.62), the lighting satisfaction (m = 4.69), the lecture classroom favors interactions between students (m = 4.76), the practice classroom favors interactions between students (m = 4.82) and the classroom design encourages participation (m = 4.82).
- The best scored items received values close to 5.50, including the importance of interactions between students (m = 5.48) and the importance of professor–student interactions (m = 5.51).
3.2. Reliability and Sample Adequacy
The sample for internal consistency analysis was 796. The Cronbach’s Alpha index was used to check the level of reliability. Table 4 shows the results of Cronbach’s α for the LESI scale, obtaining appropriate results (0.809).
Table 4.
LESI internal consistency.
3.3. Exploratory Factor Analysis
Exploratory Factor Analysis (EFA) was applied using the Principal Components method and Varimax rotation for the LESI scale. Previously, the Kaiser–Meyer–Olkin Sample Adequacy Measure (KMO = 0.767) was performed (see Table 5), which showed a high partial correlation coefficient. This result evidenced that the variance was not caused by underlying factors. Subsequently, the Bartlett’s test of Sphericity was 4416.101 (p153 < 0.001), which demonstrated that there is no relationship between the test items.
Table 5.
Kaiser–Meyer–Olkin (KMO) and Bartlett’s test.
The analysis provides a structure of five factors that explain 60.158% of the total variance. During the process, coefficients lower than 0.3 were suppressed. Figure 2 shows a sedimentation graph of the factorial structure of five factors on the abscissa axis and the eigenvalues on the ordinate. The factors with high variances are located in the first five components, evidenced by a steep slope. After the fifth component, there is an evident change in slope, correlating with a weaker interpretation of the construct.
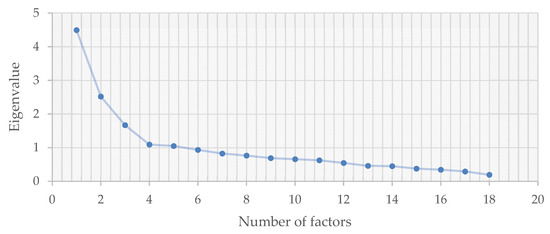
Figure 2.
Sedimentation graph of the factor components.
The variables were grouped as follows (see Table 6):
Table 6.
Exploratory Factor Analysis results.
- Classroom design as a facilitator of social interactions: This factor describes the extent to which the classroom design supports social interaction between students, both among those in the same classroom and different classrooms, as well as between students and professors in the same classroom and different classrooms.
- Workspace design satisfaction: This factor describes satisfaction in terms of organization, comfort of furniture, acoustic conditions, connection to the outside, and color of the classroom walls.
- Learning value of social interaction: This factor describes the extent to which students believe that social relationships with professors in other classrooms or between students in the same classroom and in different classrooms influence learning.
- Classroom environmental satisfaction: This factor is interpreted as satisfaction with regard to air renewal and thermal and light conditions.
- Place attachment: This factor describes the perception regarding the feeling of belonging to one’s own space or a certain privacy within a broader social space, as well as the extent to which the relationship with the classroom professor influences learning.
3.4. Multiple Linear Regression Analysis
In order to verify the prediction assumption, a multiple linear regression analysis of the sample was applied using the Stepwise method. For this, the 18 LESI variables were included. As a result, a general model of seven variables was established (see Table 7): Learning space attachment (v5), Wall color satisfaction degree (v10), Importance of interactions with students from other courses (v18), Acoustics satisfaction level (v11), Ventilation satisfaction degree (v8), Importance of professor–student interactions (v15) and Practice classroom favors teacher–student interactions (v3). The model explains 7.6% of the academic outcome (GPA), establishing direct and inverse relationships. In addition, the Durbin-Watson statistic is 1.519, which fulfills the assumption of residual independence (Table 7).
Table 7.
Multiple linear regression results: LESI variables on GPA.
The Pearson correlations of the seven-variable model are provided in Table 7. Positive Beta values, indicating a direct relationship with the academic outcome variable, are associated with five variables: Learning space attachment (v5), Wall color satisfaction degree (v10), Acoustics satisfaction level (v11), Ventilation satisfaction degree (v8), Importance of professor–student interactions (v15). Negative Beta values, indicating an inverse relationship with the academic outcome, as provided by the remaining variables: Importance of interactions with students from other courses (v18) and Practice classroom favors teacher–student interactions (v3).
In addition, it must be verified that perfect multicollinearity does not exist, to validate the model; for this, the variance inflation test was applied. Table 8 provides the VIF values that are close to one, indicating no collinearity problems or correlation between the input variables. Furthermore, the tolerance values are also close to one, so the other independent variables do not explain any of them in particular.
Table 8.
Standardized coefficients and collinearity statistics: LESI variables on GPA.
Another of the assumptions to be checked is linearity; Figure 3 displays the values that predict our estimation with respect to the values of the regression residuals. The result confirms the assumption of homoscedasticity, since the variance is practically homogeneous for the entire range of values. This figure also demonstrates compliance with the principle of linearity, since there is no non-linear pattern in the data cloud.
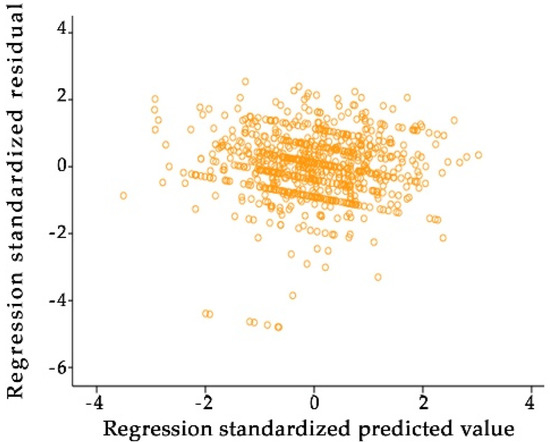
Figure 3.
Cloud points of standardized predicted values vs. standardized residuals.
The last check requires that the distribution of the residuals follow a pattern close to normality. The P-P plot verifies compliance since, in general, the factors are close to or above the line (see Figure 4).
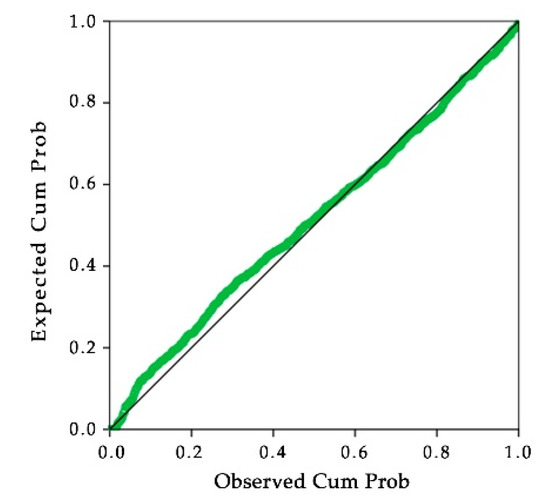
Figure 4.
Normal P-P plot of Regression Standardized Residual. Dependent variable: GPA.
Once the validity of the model is verified, it is necessary to analyze the ANOVA results (see Table 9). This provides an F statistic value and an associated probability value, as well as sums of squares, degrees of freedom, and mean squares. A probability value less than 0.05 indicates that the model is consistent, thus allowing us to explain the relationship between the input and output variables.
Table 9.
ANOVA results.
Finally, Figure 5 shows the partial regression graphs of each variable in the model, where the line is the equation obtained from the linear regression analysis.
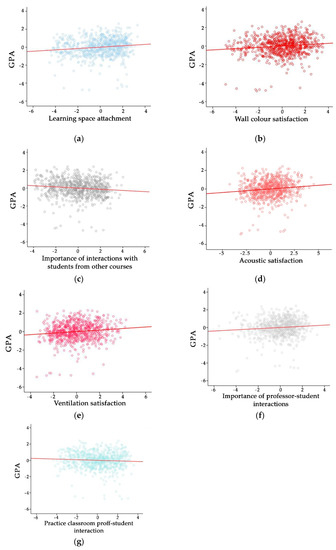
Figure 5.
Partial regression graphs: LESI variables on GPA. (a) Learning space attachment; (b) Wall color satisfaction degree; (c) Importance of interactions with students from other courses; (d) Acoustics satisfaction level; (e) Ventilation satisfaction degree; (f) Importance of professor–student interactions; (g) Practice classroom favors teacher–student interactions.
The multiple linear regression analysis performed on LESI demonstrated the existence of a relationship with academic outcome. The coefficient of determination was 0.076, while the mean square error was 0.9540.
4. Discussion and Conclusions
Sustainable building design is one of the priorities for the preservation of resources and energy. In recent decades, research based on post-occupation evaluation studies of indoor environment quality indicators have become more and more common. Factors such as geographic, cultural and climatological diversity have confirmed that it is not possible to develop a single model, but rather it is essential to disseminate research to diagnose reality. In addition, it is important to consider the functions, uses and habits in order to determine a sustainable design. In the case of educational buildings, in addition to IEQs, teaching methods should be taken into consideration. At present, several university models involve active teaching, which promotes the participation and interaction of students as a basis for learning. This research aimed to delve into three constructs—the peer effect, place attachment and IEQ satisfaction—and their relationship with academic outcomes.
For this, the Learning Environment and Social Interaction scale was designed and validated, which evidenced a structure of five factors: classroom design as a facilitator of social interactions, working design satisfaction, the learning value of social interaction, classroom environmental satisfaction and place attachment. Regarding the first factor, the literature shows that flexible designs allow teachers to promote greater learning and better adaptability to active methodologies, which also allows an improvement in the flow of social interactions between students [29,30]. The IEQ satisfaction has was divided into two factors: workspace design and classroom environmental satisfaction. The literature does not really show this separation, but there is agreement on the variables related to the activity performed in the space and those related to the environment [38,69]. Regarding the learning value of social interaction, positive relationships between classmates have shown benefits for academic performance and motivation [34,35]. Finally, place attachment has been confirmed as a factor in itself; as the basis of the link between the person and the place [60], it not only improves the well-being of the users of the building but also favors inclusion and interaction between people [57].
The regression results indicate that place attachment is the LESI variable that explains academic performance in the sample to the greatest extent. This contribution supports previous studies that demonstrated that place attachment had a higher value than other common IEQs, such as lighting, regarding the development of academic performance [67]. Regarding IEQ satisfaction, wall color, acoustics and ventilation also evidenced a direct relationship with the academic outcome, in line with evidence on satisfaction with the learning environment [44,45] and quality of environment [46].
Two variables of the learning value of social interaction showed an inverse and a direct relationship with the learning outcome: the importance of interactions with students from other courses and the importance of professor–student interactions. These findings indicate that greater interaction with the teacher may be related to a better understanding of the objectives or content of the subject and consequently of the academic outcome, while greater interaction with students from other courses leads to lower solvency of the course. Although it seems a consistent result, it is common for students to lean on peers from other courses, as they create bonds of friendship beyond academic assignments. However, this scenario would require a larger study to determine whether the support of outsiders is correlated with fewer interactions in the classroom itself. Previous research has verified the negative effects of a greater number of classmates and interactions and the positive effects of interactions in a smaller group [26], which could identified as the academic group within the classroom.
Finally, only one of the variables of classroom design as a facilitator of social interaction showed an inverse relationship with the academic outcome: the practice classroom favors teacher–student interactions. This result shows an apparent contradiction, in line with the literature [23,24]. Previously, it came to light that those students who assign higher value to teacher–student interactions obtain better GPAs, and those users who perceive that the classroom favors these interactions obtain worse results. The research does not allow for determination of the reason for this difference, but it seems logical that those who value interaction for their learning use it for academic purposes, also known as “learning interaction”. Meanwhile, those who indicate that the design favors interaction would use it for social purposes.
This leads to the conclusion that the social dimension of the physical space contributes to the explanation of a student’s academic result. In addition, the research contributes to the design and validation of LESI, the scale that those responsible for higher education centers can apply to diagnose their particular scenario and consequently manage the pertinent modifications.
This research focused on quantitative methods, due to its exploratory nature. A multi-method approach would be beneficial to complement the theory on learning space satisfaction and social interaction in higher education. Furthermore, more research is necessary both in higher education and at other educational levels, so that the high costs of building can be justified by substantial data on sustainable architecture in terms of purpose adequacy. Likewise, research on each factor, allowing an in-depth understanding of the particular complexity of each variable, is required.
Author Contributions
Conceptualization, V.L.-C.; methodology, V.L.-C.; software, V.L.-P.; validation, V.L.-C. and V.L.-P.; formal analysis, V.L.-C. and V.L.-P.; writing—original draft preparation, V.L.-C. and V.L.-P.; writing—review and editing, V.L.-C. and V.L.-P. Both authors have read and agreed to the published version of the manuscript.
Funding
This research received no external funding.
Institutional Review Board Statement
Not applicable.
Informed Consent Statement
Informed consent was obtained from all subjects involved in the study. The participation was optional and entailed the treatment, analysis and publication of findings.
Data Availability Statement
Not applicable.
Conflicts of Interest
The authors declare no conflict of interest.
References
- Wong, L.T.; Mui, K.W.; Hui, P.S. A multivariate-logistic model for acceptance of indoor environmental quality (IEQ) in offices. Build. Environ. 2008, 43, 6. [Google Scholar] [CrossRef]
- Heinzerling, D.; Schiavon, S.; Webster, T.; Arens, E. Indoor environmental quality assessment models: A literature review and a proposed weighting and classification scheme. Build. Environ. 2013, 70, 210–222. [Google Scholar] [CrossRef] [Green Version]
- Leccese, F.; Rocca, M.; Salvadori, G.; Belloni, E.; Buratti, C. Towards a holistic approach to indoor environmental quality assessment: Weighting schemes to combine effects of multiple environmental factors. Energy Build. 2021, 245, 111056. [Google Scholar] [CrossRef]
- Galasiu, A.D.; Veitch, J.A. Occupant preferences and satisfaction with the luminous environment and control systems in daylit offices: A literature review. Energy Build. 2006, 38, 728–742. [Google Scholar] [CrossRef] [Green Version]
- Ma, K.W.; Wong, H.M.; Mak, C.M. A systematic review of human perceptual dimensions of sound: Meta-analysis of semantic differential method applications to indoor and outdoor sounds. Build. Environ. 2018, 133, 123–150. [Google Scholar] [CrossRef]
- Pigliautile, I.; Casaccia, S.; Morresi, N.; Arnesano, M.; Pisello, A.L.; Revel, G.M. Assessing occupants’ personal attributes in relation to human perception of environmental comfort: Measurement procedure and data analysis. Build. Environ. 2020, 177, 106901. [Google Scholar] [CrossRef]
- Földváry Ličina, V.; Cheung, T.; Zhang, H.; de Dear, R.; Parkinson, T.; Arens, E.; Chun, C.; Schiavon, S.; Luo, M.; Brager, G.; et al. Development of the ASHRAE Global Thermal Comfort Database II. Build. Environ. 2018, 142, 502–512. [Google Scholar] [CrossRef] [Green Version]
- Khan, M.; Thaheem, M.J.; Khan, M.; Maqsoom, A.; Zeeshan, M. Thermal comfort and ventilation conditions in healthcare facilities—Part 2: Improving indoor environment quality (ieq) through ventilation retrofitting. Environ. Eng. Manag. J. 2021, 19, 2059–2075. [Google Scholar]
- López-Chao, V.; Lorenzo, A.A.; Martin-Gutiérrez, J. Architectural indoor analysis: A holistic approach to understand the relation of higher education classrooms and academic performance. Sustainability 2019, 11, 6558. [Google Scholar] [CrossRef] [Green Version]
- Zuhaib, S.; Manton, R.; Griffin, C.; Hajdukiewicz, M.; Keane, M.M.; Goggins, J. An Indoor Environmental Quality (IEQ) assessment of a partially-retrofitted university building. Build. Environ. 2018, 139, 69–85. [Google Scholar] [CrossRef]
- Preiser, W.F.E. Post-occupancy evaluation: How to make buildings work better. Facilities 1995, 13, 19–28. [Google Scholar] [CrossRef]
- Li, Y.; Yang, L.; He, B.; Zhao, D. Green building in China: Needs great promotion. Sustain. Cities Soc. 2014, 11, 6. [Google Scholar] [CrossRef]
- Domínguez-Amarillo, S.; Fernández-Agüera, J.; González, M.M.; Cuerdo-Vilches, T. Overheating in Schools: Factors Determining Children’s Perceptions of Overall Comfort Indoors. Sustainability 2020, 12, 5772. [Google Scholar] [CrossRef]
- Mallory-Hill, S.; van der Voordt, T.; van Dortmont, A. Evaluation of innovative workplace design in the Netherlands. In Assessing Building Performance; Routledge: London, UK, 2004. [Google Scholar]
- Wang, C.; Zhang, F.; Wang, J.; Doyle, J.K.; Hancock, P.A.; Mak, C.M.; Liu, S. How indoor environmental quality affects occupants’ cognitive functions: A systematic review. Build. Environ. 2021, 193, 107647. [Google Scholar] [CrossRef]
- D’Oca, S.; Pisello, A.L.; De Simone, M.; Barthelmes, V.M.; Hong, T.; Corgnati, S.P. Human-building interaction at work: Findings from an interdisciplinary cross-country survey in Italy. Build. Environ. 2018, 132, 147–159. [Google Scholar] [CrossRef] [Green Version]
- Amasyali, K.; El-Gohary, N.M. Energy-related values and satisfaction levels of residential and office building occupants. Build. Environ. 2016, 95, 251–263. [Google Scholar] [CrossRef]
- Ma, G.; Lin, J.; Li, N.; Zhou, J. Cross-cultural assessment of the effectiveness of eco-feedback in building energy conservation. Energy Build. 2017, 134, 329–338. [Google Scholar] [CrossRef]
- Chen, C.; Hong, T.; de Rubens, G.Z.; Yilmaz, S.; Bandurski, K.; Bélafi, Z.D.; De Simone, M.; Bavaresco, M.V.; Wang, Y.; Liu, P.; et al. Culture, conformity, and carbon? A multi-country analysis of heating and cooling practices in office buildings. Energy Res. Soc. Sci. 2020, 61, 101344. [Google Scholar] [CrossRef]
- Day, J.K.; McIlvennie, C.; Brackley, C.; Tarantini, M.; Piselli, C.; Hahn, J.; O’Brien, W.; Rajus, V.S.; De Simone, M.; Kjærgaard, M.B.; et al. A review of select human-building interfaces and their relationship to human behavior, energy use and occupant comfort. Build. Environ. 2020, 178, 106920. [Google Scholar] [CrossRef]
- Schweiker, M.; Ampatzi, E.; Andargie, M.S.; Andersen, R.K.; Azar, E.; Barthelmes, V.M.; Berger, C.; Bourikas, L.; Carlucci, S.; Chinazzo, G.; et al. Review of multi-domain approaches to indoor environmental perception and behaviour. Build. Environ. 2020, 176, 106804. [Google Scholar] [CrossRef]
- Cornell, P. The impact of changes in teaching and learning on furniture and the learning environment. New Dir. Teach. Learn. 2002, 2002, 33–42. [Google Scholar] [CrossRef]
- Carrell, S.E.; Fullerton, R.L.; West, J.E. Does Your Cohort Matter? Measuring Peer Effects in College Achievement. J. Labor Econ. 2009, 27, 439–464. [Google Scholar] [CrossRef] [Green Version]
- Carrell, S.E.; Sacerdote, B.I.; West, J.E. From Natural Variation to Optimal Policy? The Importance of Endogenous Peer Group Formation. Econometrica 2013, 81, 855–882. [Google Scholar] [CrossRef]
- Booij, A.S.; Leuven, E.; Oosterbeek, H. Ability Peer Effects in University: Evidence from a Randomized Experiment. Rev. Econ. Stud. 2016, 84, 547–578. [Google Scholar] [CrossRef]
- Brady, R.R.; Insler, M.A.; Rahman, A.S. Bad Company: Understanding negative peer effects in college achievement. Eur. Econ. Rev. 2017, 98, 144–168. [Google Scholar] [CrossRef] [Green Version]
- López-Chao, V.; Lorenzo, A.A.; Saorín, J.L.; De La Torre-Cantero, J.; Melián-Díaz, D. Classroom indoor environment assessment through architectural analysis for the design of efficient schools. Sustainability 2020, 12, 2020. [Google Scholar] [CrossRef] [Green Version]
- Ebersbach, M.; Brandenburger, I. Reading a short story changes children’s sustainable behavior in a resource dilemma. J. Exp. Child Psychol. 2020, 191, 104743. [Google Scholar] [CrossRef]
- Attai, S.L.; Reyes, J.C.; Davis, J.L.; York, J.; Ranney, K.; Hyde, T.W. Investigating the impact of flexible furniture in the elementary classroom. Learn. Environ. Res. 2021, 24, 153–167. [Google Scholar] [CrossRef]
- McArthur, J.A. Matching Instructors and Spaces of Learning: The impact of classroom space on behavioral, affective and cognitive learning. J. Learn. Spaces 2015, 4, 16. [Google Scholar]
- Martin, A.J.; Dowson, M. Interpersonal Relationships, Motivation, Engagement, and Achievement: Yields for Theory, Current Issues, and Educational Practice. Rev. Educ. Res. 2009, 79, 327–365. [Google Scholar] [CrossRef]
- Ryan, A.M. Peer Groups as a Context for the Socialization of Adolescents’ Motivation, Engagement, and Achievement in School. Educ. Psychol. 2000, 35, 101–111. [Google Scholar] [CrossRef]
- Furman, W.; Buhrmester, D. Age and Sex Differences in Perceptions of Networks of Personal Relationships. Child Dev. 1992, 63, 103. [Google Scholar] [CrossRef] [PubMed]
- Furrer, C.; Skinner, E. Sense of relatedness as a factor in children’s academic engagement and performance. J. Educ. Psychol. 2003, 95, 148–162. [Google Scholar] [CrossRef]
- Liem, A.D.; Lau, S.; Nie, Y. The role of self-efficacy, task value, and achievement goals in predicting learning strategies, task disengagement, peer relationship, and achievement outcome. Contemp. Educ. Psychol. 2008, 33, 486–512. [Google Scholar] [CrossRef]
- Humphreys, M.A. Quantifying occupant comfort: Are combined indices of the indoor environment practicable? Build. Res. Inf. 2005, 33, 317–325. [Google Scholar] [CrossRef]
- Sant’Anna, D.O.; Dos Santos, P.H.; Vianna, N.S.; Romero, M.A. Indoor environmental quality perception and users’ satisfaction of conventional and green buildings in Brazil. Sustain. Cities Soc. 2018, 43, 95–110. [Google Scholar] [CrossRef]
- Schiavon, S.; Altomonte, S. Influence of factors unrelated to environmental quality on occupant satisfaction in LEED and non-LEED certified buildings. Build. Environ. 2014, 77, 148–159. [Google Scholar] [CrossRef]
- Leaman, A.; Thomas, L.; Vandenberg, M. “Green” buildings: What Australian users are saying. EcoLibrium 2007, 6, 22–30. [Google Scholar]
- Holmgren, M.; Kabanshi, A.; Sörqvist, P. Occupant perception of “green” buildings: Distinguishing physical and psychological factors. Build. Environ. 2017, 114, 140–147. [Google Scholar] [CrossRef]
- Salazar, H.A.; Oerlemans, L.; van Stroe-Biezen, S. Social influence on sustainable consumption: Evidence from a behavioural experiment. Int. J. Consum. Stud. 2013, 37, 172–180. [Google Scholar] [CrossRef]
- Castaldo, V.L.; Pigliautile, I.; Rosso, F.; Cotana, F.; De Giorgio, F.; Pisello, A.L. How subjective and non-physical parameters affect occupants’ environmental comfort perception. Energy Build. 2018, 178, 107–129. [Google Scholar] [CrossRef] [Green Version]
- Kopec, D.A. Environmental Psychology for Design; Fairchild: New York, NY, USA, 2006. [Google Scholar]
- Temple, P.H. Learning spaces in higher education: An under-researched topic. Lond. Rev. Educ. 2008, 6, 229–241. [Google Scholar] [CrossRef]
- Hopland, A.O.; Nyhus, O.H. Does student satisfaction with school facilities affect exam results? Facilities 2015, 33, 760–774. [Google Scholar] [CrossRef]
- Teli, D.; Jentsch, M.F.; James, P.A.B. Naturally ventilated classrooms: An assessment of existing comfort models for predicting the thermal sensation and preference of primary school children. Energy Build. 2012, 53, 166–182. [Google Scholar] [CrossRef]
- Teli, D.; James, P.A.B.; Jentsch, M.F. Investigating the principal adaptive comfort relationships for young children. Build. Res. Inf. 2015, 43, 371–382. [Google Scholar] [CrossRef]
- Baeza Moyano, D.; San Juan Fernández, M.; González Lezcano, R.A. Towards a Sustainable Indoor Lighting Design: Effects of Artificial Light on the Emotional State of Adolescents in the Classroom. Sustainability 2020, 12, 4263. [Google Scholar] [CrossRef]
- Korsavi, S.S.; Montazami, A.; Mumovic, D. The impact of indoor environment quality (IEQ) on school children’s overall comfort in the UK; a regression approach. Build. Environ. 2020, 185, 107309. [Google Scholar] [CrossRef]
- Alonso Sanz, A.; Jardón, P.; Lifante Gil, Y. The role of the classroom’s images. Study of visual culture at three schools. Vis. Stud. 2019, 34, 107–118. [Google Scholar] [CrossRef]
- Hedge, A.; Burge, P.S.; Robertson, A.S.; Wilson, S.; Harris-Bass, J. Work-related illness in offices: A proposed model of the “sick building syndrome”. Environ. Int. 1989, 15, 143–158. [Google Scholar] [CrossRef]
- Schweiker, M.; Wagner, A. The effect of occupancy on perceived control, neutral temperature, and behavioral patterns. Energy Build. 2016, 117, 246–259. [Google Scholar] [CrossRef]
- Sharma, A.; Saxena, A.; Sethi, M.; Shree, V. Life cycle assessment of buildings: A review. Renew. Sustain. Energy Rev. 2011, 15, 871–875. [Google Scholar] [CrossRef]
- Dreyer, B.C.; Coulombe, S.; Whitney, S.; Riemer, M.; Labbé, D. Beyond Exposure to Outdoor Nature: Exploration of the Benefits of a Green Building’s Indoor Environment on Wellbeing. Front. Psychol. 2018, 9, 1583. [Google Scholar] [CrossRef]
- Thatcher, A.; Milner, K. Is a green building really better for building occupants? A longitudinal evaluation. Build. Environ. 2016, 108, 194–206. [Google Scholar] [CrossRef]
- Low, S.M.; Altman, I. Place Attachment. In Place Attachment; Springer US: Boston, MA, USA, 1992; p. 12. [Google Scholar]
- Scannell, L.; Gifford, R. Defining place attachment: A tripartite organizing framework. J. Environ. Psychol. 2010, 30, 10. [Google Scholar] [CrossRef]
- Kaya, N.; Burgess, B. Territoriality. Environ. Behav. 2007, 39, 859–876. [Google Scholar] [CrossRef]
- Tester, G.; Ruel, E.; Anderson, A.; Reitzes, D.C.; Oakley, D. Sense of Place among Atlanta Public Housing Residents. J. Urban Health 2011, 88, 436–453. [Google Scholar] [CrossRef] [Green Version]
- Scannell, L.; Gifford, R. The experienced psychological benefits of place attachment. J. Environ. Psychol. 2017, 51, 256–269. [Google Scholar] [CrossRef]
- Tang, I.-C.; Sullivan, W.C.; Chang, C.-Y. Perceptual Evaluation of Natural Landscapes. Environ. Behav. 2015, 47, 595–617. [Google Scholar] [CrossRef] [Green Version]
- Qu, Y.; Xu, F.; LYU, X. Motivational place attachment dimensions and the pro-environmental behaviour intention of mass tourists: A moderated mediation model. Curr. Issues Tour. 2019, 22, 197–217. [Google Scholar] [CrossRef]
- Ramkissoon, H.; Weiler, B.; Smith, L.D.G. Place attachment and pro-environmental behaviour in national parks: The development of a conceptual framework. J. Sustain. Tour. 2012, 20, 257–276. [Google Scholar] [CrossRef] [Green Version]
- Cole, L.B.; Coleman, S.; Scannell, L. Place attachment in green buildings: Making the connections. J. Environ. Psychol. 2021, 74, 101558. [Google Scholar] [CrossRef]
- Hidalgo, M.C.; Hernández, B. Place attachment: Conceptual and empirical questions. J. Environ. Psychol. 2001, 21, 273–281. [Google Scholar] [CrossRef]
- Heerwagen, J.; Zagreus, L. The Human Factors of Sustainable Building Design: Post Occupancy Evaluation of the Philip Merrill Environmental Center; U.S. Department of Energy, Center for the Built Environment, University of California: Berkeley, CA, USA, 2005. [Google Scholar]
- Barrett, P.; Davies, F.; Zhang, Y.; Barrett, L. The Holistic Impact of Classroom Spaces on Learning in Specific Subjects. Environ. Behav. 2017, 49, 425–451. [Google Scholar] [CrossRef] [PubMed] [Green Version]
- López-Chao, V. El Impacto del Diseño del Espacio Y Otras Variables Socio-Físicas en el Proceso de Enseñanza-Aprendizaje, Universidade da Coruña. Ph.D. Thesis, Universidade da Coruña, Coruña, Spain, January 2017. [Google Scholar]
- Muñoz Cantero, J.M.; García Mira, R.; López-Chao, V. Influence of physical learning environment in student’s behavior and social relations. Anthropologist 2016, 25, 249–253. [Google Scholar] [CrossRef]
Publisher’s Note: MDPI stays neutral with regard to jurisdictional claims in published maps and institutional affiliations. |
© 2021 by the authors. Licensee MDPI, Basel, Switzerland. This article is an open access article distributed under the terms and conditions of the Creative Commons Attribution (CC BY) license (https://creativecommons.org/licenses/by/4.0/).