Article

The Effect of Basalt Fiber on Mechanical, Microstructural, and High-Temperature Properties of Fly Ash-Based and Basalt Powder Waste-Filled Sustainable Geopolymer Mortar

1
School of Civil Engineering, Avcilar Campus, Istanbul University-Cerrahpasa, 34200 Istanbul, Turkey
2
Civil Engineering Department, Avcilar Campus, Istanbul Gelisim University, 34200 Istanbul, Turkey
3
Architecture and Design Department, Escuela Politécnica Superior, Universidad CEU San Pablo, 28040 Madrid, Spain
*
Authors to whom correspondence should be addressed.
Sustainability 2021, 13(22), 12610; https://doi.org/10.3390/su132212610
Submission received: 26 October 2021 / Revised: 11 November 2021 / Accepted: 12 November 2021 / Published: 15 November 2021
(This article belongs to the Special Issue Indoor Environment Quality and Health in Energy-Efficient Buildings)

Abstract

:
As the human population grows and technology advances, the demand for concrete and cement grows. However, it is critical to propose alternative ecologically suitable options to cement, the primary binder in concrete. Numerous researchers have recently concentrated their efforts on geopolymer mortars to accomplish this objective. The effects of basalt fiber (BF) on a geopolymer based on fly ash (FA) and basalt powder waste (BP) filled were studied in this research. The compressive and flexural strength, Charpy impact, and capillary water absorption tests were performed on produced samples after 28 days. Then, produced samples were exposed to the high-temperature test. Weight change, flexural strength, compressive strength, UPV, and microstructural tests of the specimens were performed after and before the effect of the high temperature. In addition, the results tests conducted on the specimens were compared after and before the high-temperature test. The findings indicated that BF had beneficial benefits, mainly when 1.2 percent BF was used. When the findings of samples containing 1.2 percent BF exposed to various temperatures were analyzed, it was revealed that it could increase compressive strength by up to 18 percent and flexural strength by up to 44 percent. In this study, the addition of BF to fly ash-based geopolymer samples improved the high-temperature resistance and mechanical properties.

1. Introduction

In terms of environmental protection, it is critical to creating a sustainable product. The geopolymer mortars were used to reduce OPC use to as an alternative to Ordinary Portland cement (OPC). Cement manufacture accounts for 5–7 percent of global CO2 emissions [1]. This scenario has severe environmental consequences. Finding alternate OPC replacements is essential. Industrial waste materials (slag, red mud, fly ash) were significant replacements. Alkaline activators were used to activate these waste materials in the geopolymer manufacture process. The carbon dioxide emissions are decreased due to recycling waste materials and using less OPC [2].
Additionally, geopolymer mortars have much superior durability and mechanical properties. In this instance, the compact and dense geopolymer microstructure is beneficial [3]. Industrial waste, produced as a byproduct of many technological operations, is a major environmental issue. One of these sectors is the quarry industry which generates a large quantity of industrial waste. The environmental cost for storing waste items rises year after year. The mining and processing of rock raw materials are rapidly expanding. Rock raw materials are treated to cutting and grinding operations in stone manufacturers. The fine-grained waste material generated during processing is transported to and deposited in landfills. Therefore, geopolymer was produced using different waste materials, and its properties were investigated in previous studies [4,5,6,7]. The sodium hydroxide (SH) and sodium silicate (SS) used in this study were close to the amounts of SH and SS used in these studies. However, it can be stated that using BP instead of sand in this study is more economical than geopolymers using sand. BP is a byproduct of the manufacturing of high-quality aggregates from basalt rocks. Tammam et al. [8] were used industrial waste filler materials such as BP, marble powder, and limestone powder waste in geopolymer mortars. They found that the use of industrial waste enhanced the mechanical and durability properties of the geopolymer specimens. Celikten and Atabey [9] investigated the mechanical and physical characteristics of geopolymer mortars manufactured using basalt stone cutting waste. Geopolymer mortars with four different water contents were created for this purpose. They found that the mortars with the least water content had the highest strength values.
Improving mechanical characteristics using fiber has significant benefits. PVA, basalt, glass, Carbon, and steel fiber have all been used to create geopolymer [10,11,12]. Previous research used polyvinyl alcohol (PVA) fibers and nano-SiO2 to manufacture geopolymer concrete. The findings showed that PVA fibers enhanced the proprieties’ strength, improved toughness, and achieved the optimal value at 0.6% to 1% [13,14,15,16]. Significant values were achieved with high temperatures in BF, and PVA contained geopolymer mortars. BF was examined and is among the most widely used concrete fibers [17]. It is a very efficient insulating, non-toxic, low-cost fibrous material formed during basalt rock melting at up to 1400 ℃. It is less costly than other fibers since it requires less energy and no additives [18]. Additionally, it was shown that it had a function in strength growth by substantially adding to workability. Several publications have verified the beneficial benefits of BF [19,20,21,22,23]. Ali et al. [24] investigated the impact of boron waste and BF on metakaolin-based geopolymer. Based on the findings of their study, 24 mm BF has more significant beneficial impacts than 12 mm BF. The specimens were found to be stable during high temperatures, sulfuric acid, and freeze-thaw effects.
Previous studies were conducted on alternative binder ingredients in fly ash-based geopolymer. Only a few of them have mixed various ratios of BF and basalt waste aggregate. This study aims to produce a sustainable mortar with high mechanical and microstructural properties and good high-temperature resistance. Thus, this study has led to environmentally friendly geopolymer mortar production using waste materials instead of cement and sand. For this proposal, BF contained fly ash-based, and BP-filled geopolymer mortar samples were produced. The mechanical, physical, and microstructural tests were performed after and before the high-temperature test.

2. Materials and Methods
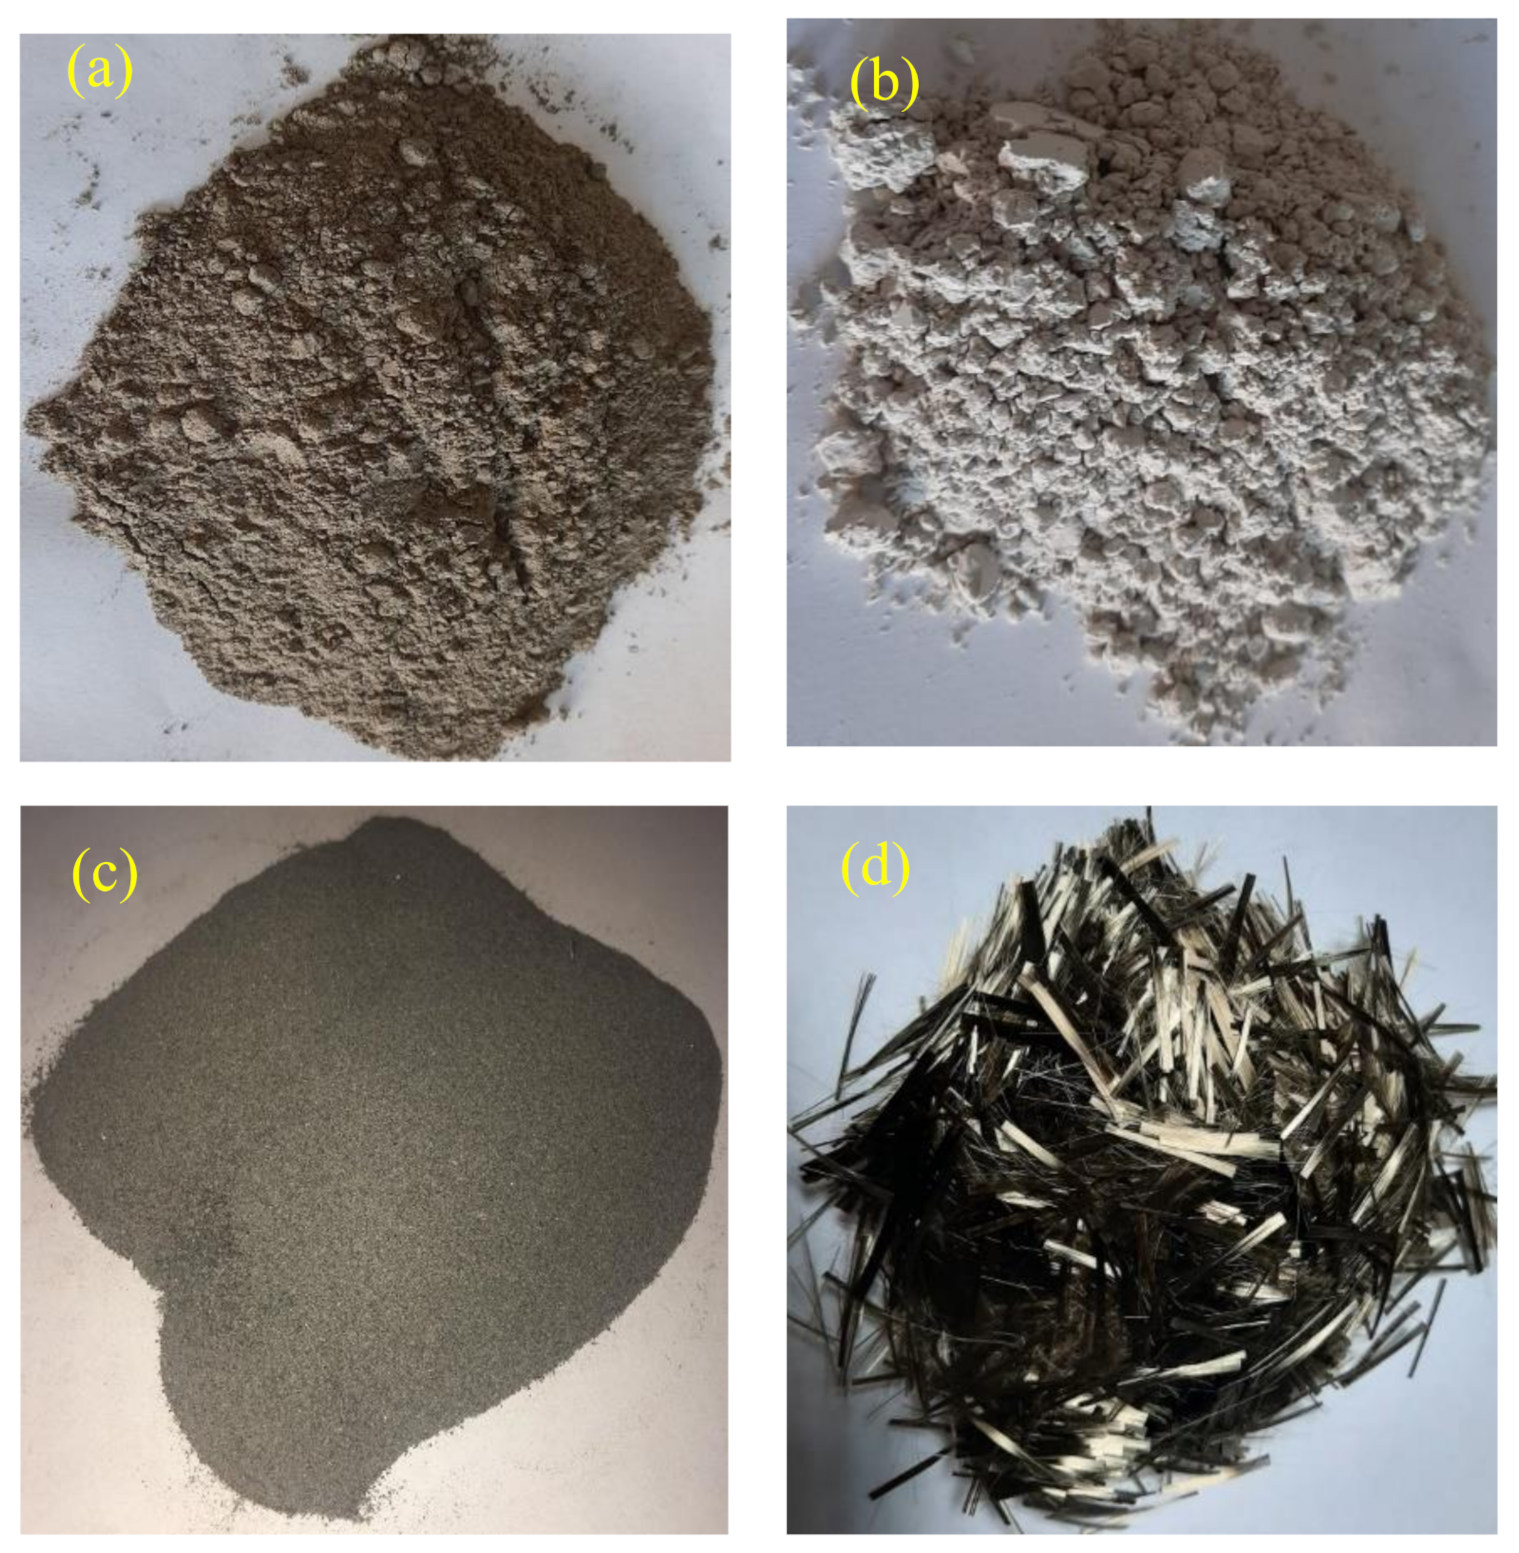
2.1. Materials

In this study, waste materials were used as binder and filler material in fly ash-based geopolymer mortars. Class F fly ash (FA) and slag (S) were used as binders. Basalt dust waste (BP) was also used as filling material. The physical and chemical properties of BP, S, and FA materials are given in Table 1. The particle diameters of BP range from 1 to 300 µm, with an average particle diameter of 120 µm. Sodium hydroxide (SH) and sodium silicate (SS) were used as activators to produce geopolymer mortar. Table 2 and Table 3 illustrate the chemical characteristics of SS and SH, respectively. In addition, BF was used at 4, 8, and 12 percent by volume. BF properties used in blends are shown in Table 4. The images of FA, S, BP, and BF materials used in fly ash -based and BP-filled geopolymer mortars are given in Figure 1.

2.2. Mixing Procedure and Samples

In the first mixing stage of the fly ash-based geopolymer mortars produced in this study, 12 M sodium hydroxide solution was prepared and kept at 20 °C for 24 h to cool. 1000 g of deionized water was used for each 40 g of sodium hydroxide pellets to prepare 12 M sodium hydroxide solution. Then, sodium hydroxide solution (SH) was mixed with sodium silicate solution (SS) after cooling. Then, fly ash was placed in the mixer, and the prepared mixture of SS and SH (mixed activator solution) was added and mixed until homogeneous. Then, slag was added to the mixture and mixed homogeneously. BP waste, which is the filling material, was added to the mixture and mixed homogeneously. Finally, BF was added to the mixtures at different rates (0%, 4%, 8%, and 12%) and mixed homogeneously. In addition, the amounts of the materials used in the fly ash-based geopolymer mortar mixtures produced in this study are given in (kg/m3), as Table 5 shows. BF was added at 0%, 4%, 8%, and 12% by volume. Previous trial experiments and earlier studies were used to prepare the mixture [8,25].
Freshly prepared mixtures were placed into 40 × 40 × 160 mm3 prismatic molds and 50 × 50 × 50 mm3 cubic molds. The molds were then vibrated while being placed on the vibration table. Then the samples were cured in an oven at 60 °C for 24 h. The cured samples were kept at 20 °C for 28 days.

2.3. Tests Conducted

In this study, mixtures of fly ash-based geopolymer contained BF were prepared. Compressive strength, flexural strength, Ultrasonic pulse velocity (UPV), Charpy impact, and capillary water absorption tests were performed to examine the impact of BF content on prepared samples. Then, 50 × 50 × 50 mm3 cubic and 40 × 40 × 160 mm3 prismatic samples were subjected to the high-temperature test. Weight change, compressive strength, flexural strength, and UPV tests of the samples exposed to the high-temperature test were performed. In addition, the results before and after the high-temperature test were compared. Scanning Electron Microscopy (SEM) and Energy Dispersive X-ray (EDS) analyzes were performed to observe the BF content and changes in the matrices of the samples.

2.3.1. Compressive Strength, Flexural Strength, and Ultrasonic Pulse Velocity (UPV) Tests

Compressive strength, flexural strength, and UPV tests were performed to examine the impact of BF on produced samples after 28 days at 20 °C. The same tests were also carried out on samples exposed to high-temperature effects. For each mixture, the average compressive strength of three 50 × 50 × 50 mm3 cube samples after 28 days was performed. Compressive strength was conducted with a rate of 0.602 MPa/s according to ASTM C39. In addition, compressive strengths were performed on the geopolymer samples exposed to 200 °C, 400 °C, 600 °C, and 800 °C temperatures, and the differences between the results were analyzed. The flexural test was performed after 28 days on three 40 × 40 × 160 mm3 prism samples for each mixture. Flexural strength tests were conducted following ASTM C 348. As in the compressive strength test, the flexural strength test was also performed after the high-temperature test. The 4× and 40× magnified crack images of 12 BF specimens subjected to flexural strength test are shown in Figure 2.
In addition, the UPV test of the geopolymer mortar samples was applied after 28 days according to ASTM C597-16. UPV test results of fly ash-based geopolymer samples contained BF exposed to 20 °C, and high temperatures were obtained. The damage degrees caused by high temperatures were calculated using the UPV results and the following formula:
          D d = 1 v a v b
Dd was the damage degree of samples, Va was the UPV values of samples after the high-temperature test, and Vb was the UPV values of samples before the high-temperature test.

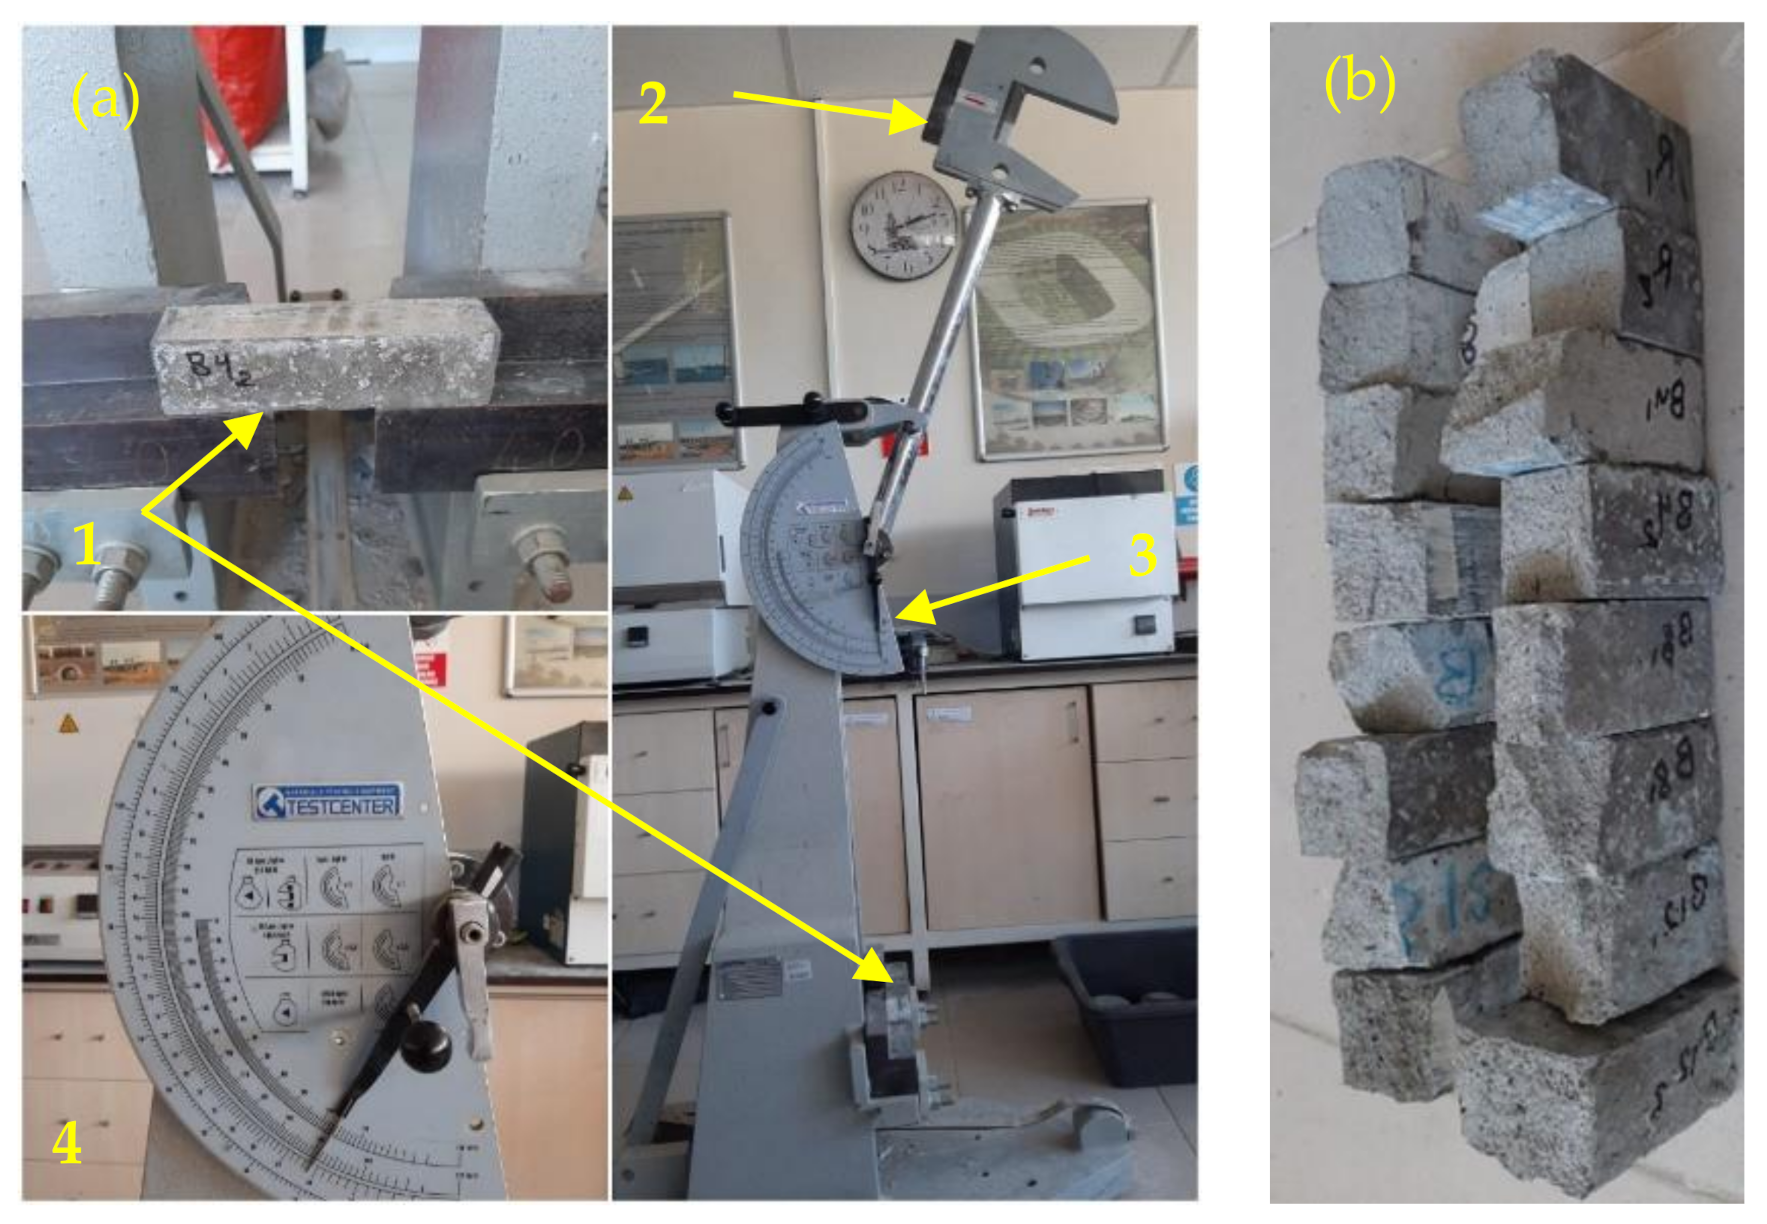
2.3.2. Charpy Impact Test

The Charpy impact test was conducted following ASTM E23. 40 × 40 × 160 mm3 prismatic fly ash-based geopolymer specimens were used for the Charpy impact test. In the first stage of the Charpy impact test, the sample was placed centered on the device, as shown in Figure 3a. Subsequently, the pendulum was raised, and the drag indicator was set to the zero position. Finally, the pendulum was released from the first height and swung through the specimen to the second height. Figure 3 illustrates the procedure of the Charpy impact test and the samples subjected to this test. Three fly ash-based geopolymer samples containing BF were subjected to the Charpy impact test, and the average results were recorded from the device in the Kgf-m unit.

2.3.3. Capillary Water Absorption

The capillary water absorption capacity of fly ash-based geopolymer samples was determined using ASTM C1585-20. 40 × 40 × 160 mm3 fly ash-based geopolymer samples were dried in an oven at 105 °C for 24 h. Then, the samples surfaces were covered with paraffin except for the surface contacted with water and the opposite surface. Then, the dry weights (Wd) of the samples were obtained, and the dry samples were immersed in 5 mm depth water. After 15 min, 30 min, 1, 2, 3, 5, 24, 48, 72, and 96 h, the fly ash-based samples were withdrawn from the water, and their wet weight (Ww) was determined. Finally, the capillary water absorption curves and water absorption coefficient (Kc) using the following formula:
K C × t = Q A
where Q was the absorbed water mass (Ww-Wd) (kg), Wd was the dry weight (kg), Ww was the wet weight (kg), A was the immersed surface area (m2), t was a time (s), and Kc was the water absorption coefficient ((kg/(m2. √s)).

2.3.4. High-Temperature Test

In this study, a high-temperature test was performed to examine the high-temperature resistance of fly ash-based geopolymer samples and the effect on the BF contained in the samples. Fly ash-based geopolymer samples were dried in an oven at 105 °C for 24 h. Dried samples were exposed to temperatures of 200 °C, 400 °C, 600 °C, and 800 °C, respectively. The high-temperature degrees rose with the rate of 5 °C/min, and then the samples were exposed to temperatures for another 1 h.
The dry weight (Wd) of the samples dried at 105 °C for 24 h in the oven was performed. Then, the weights of the samples exposed to the effects of high temperatures were measured, and the percentages of change in weights were calculated. The images of the cracks were obtained using a microscope with 40× magnification to evaluate the effect of high temperature on the samples.

3. Results and Discussions

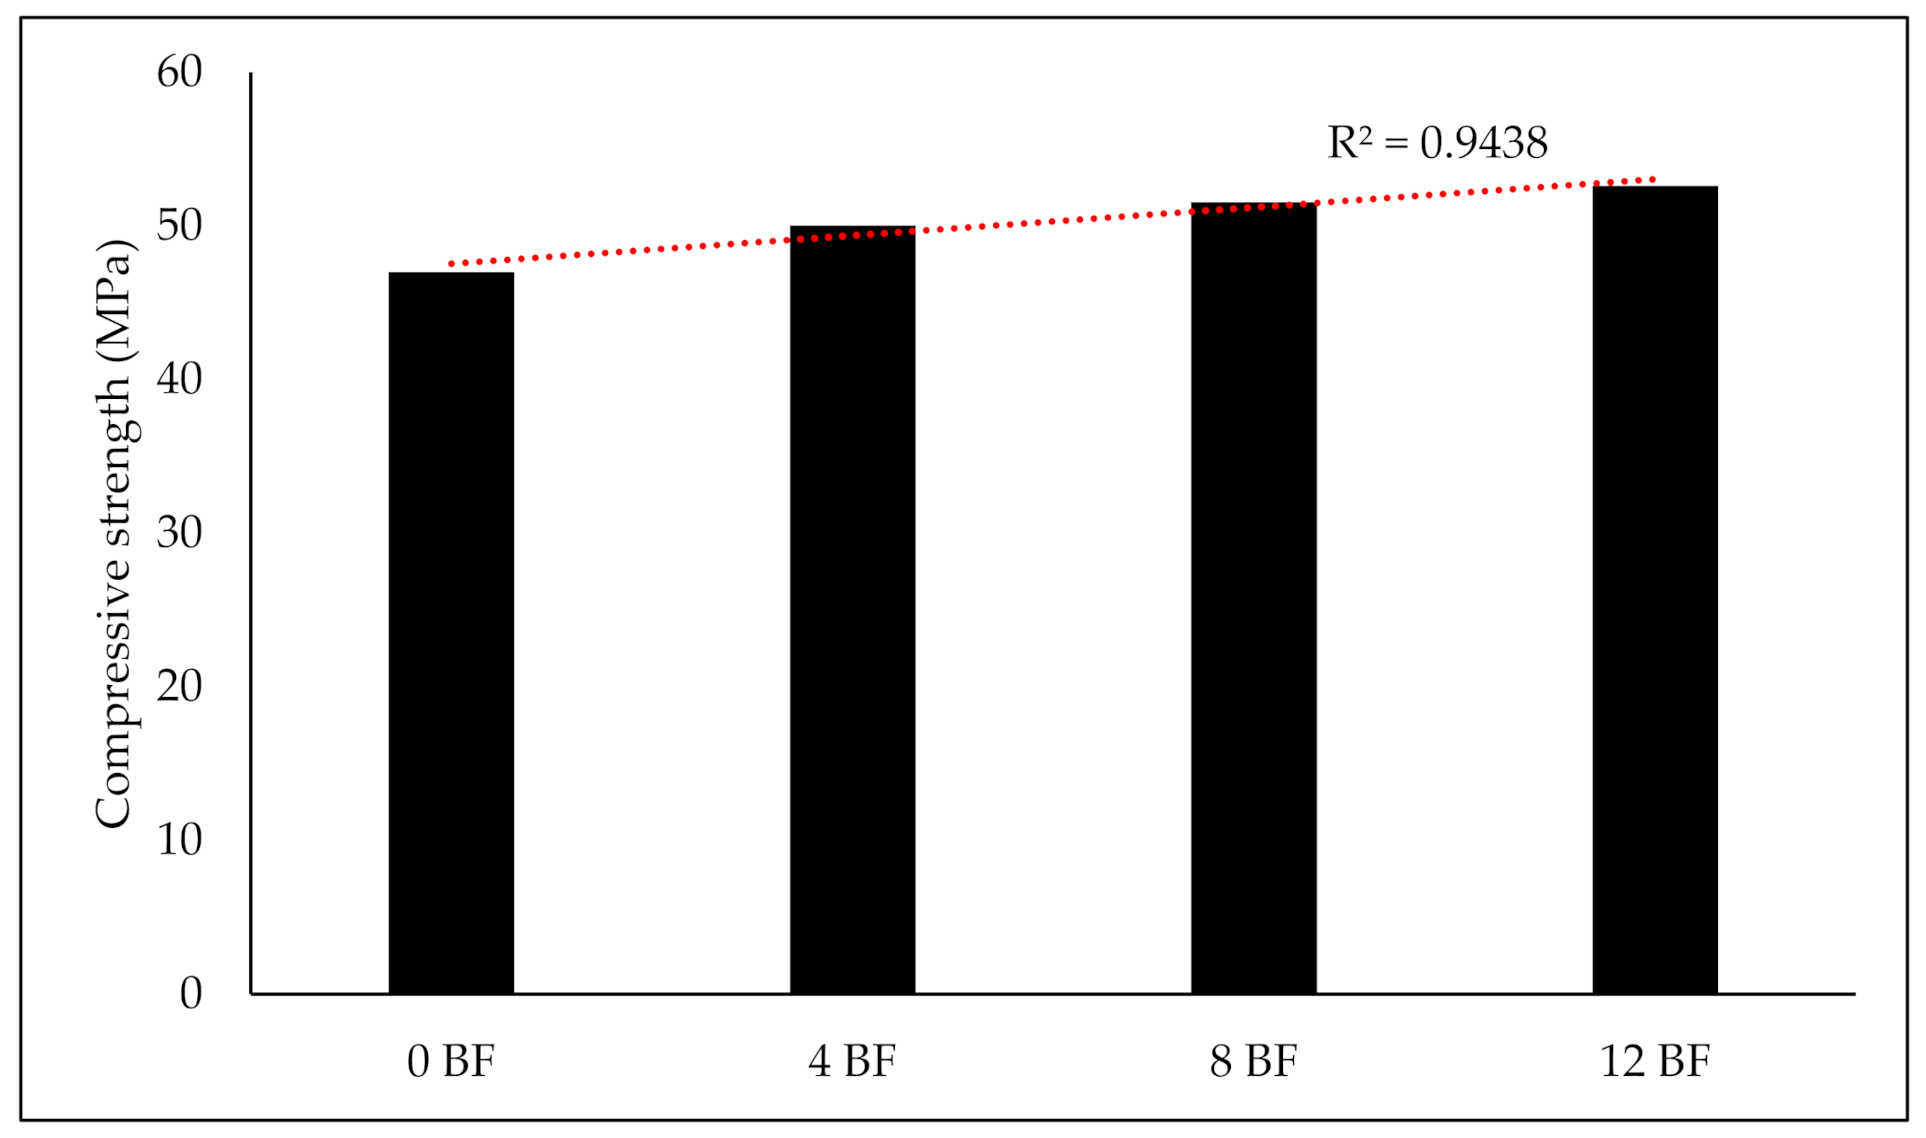
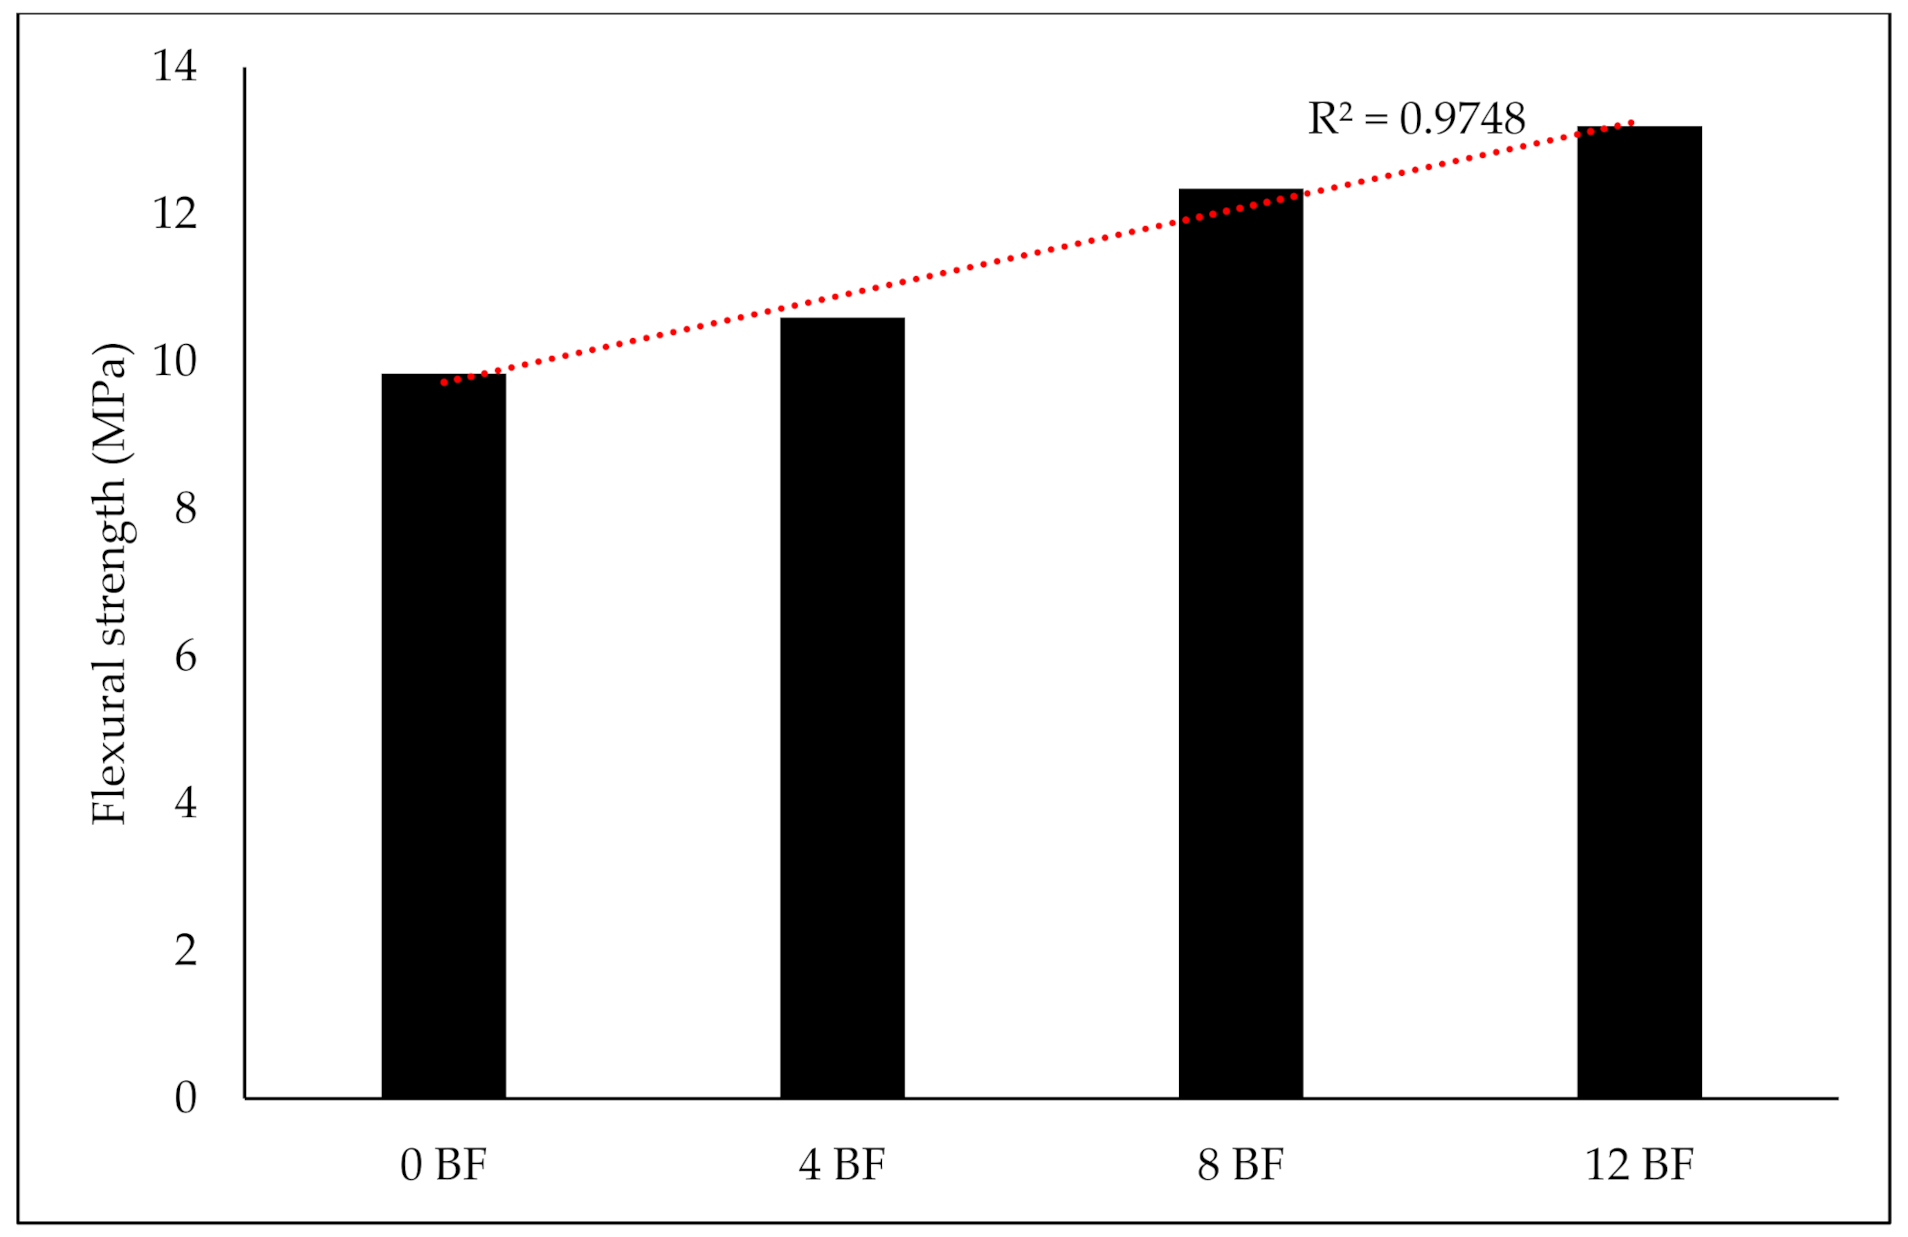
3.1. Compressive and Flexural Strength Results

Compressive strength, flexural strength, UPV, and Charpy impact tests were performed on geopolymer mortar samples after 28 days. These tests were conducted to study the effect of BF and determine the mechanical properties of the fly ash-based geopolymer mortars filled with BP. Subsequently, the results of these tests were determined. Figure 4 and Figure 5 show the compressive and flexural strength results of fly ash-based geopolymer samples containing BF. Additionally, Figure 4 and Figure 5 show the relationship between the strengths and the content of BF in the geopolymer series. The relationships were quite strong, and R2 was 0.94 for compressive strength (Figure 4) and 0.97 for flexural strength (Figure 5). Therefore, in this study, it was found that the increase of BF content in fly ash-based geopolymer mortars increased the compressive and flexural strength of the specimens. The increases in compressive strength were 6.43%, 9.65%, and 11.94% for 4 BF, 8 BF, and 12 BF, respectively.
Similarly, the flexural strength increased by 7.72%, 25.51%, and 34.15% for 4 BF, 8 BF, and 12 BF, respectively. Consequently, the increase in flexural strength due to basalt content was higher than the increase in compressive strength. Especially for the 12 BF series, the increase in flexural strength was 2.86 times larger than the increase in compressive strength. All specimens with BF exhibited higher strength than the 0 BF specimens. The use of BF increased the compressive and strength of the geopolymer matrix. The delicate and uniform distribution of crystal phases helped improve the BF materials’ physical and mechanical properties. Applying a nucleating agent such as P2O5, TiO2, and ZrO2 helped achieve the required degree of microstructure. At the same time, basaltic rock was not required for melting, creating a naturally occurring nucleating agent such as Fe3O4 aided in the process. Thus, the nucleating agents outperformed the necessary fibers [17]. The addition of BF significantly reduced the number of fractures during the flexural test because they transferred the flexural load. In other words, they delayed the formation of cracks by distributing the resulting stress. As a result, BF had a massive effect on flexural strength [26].

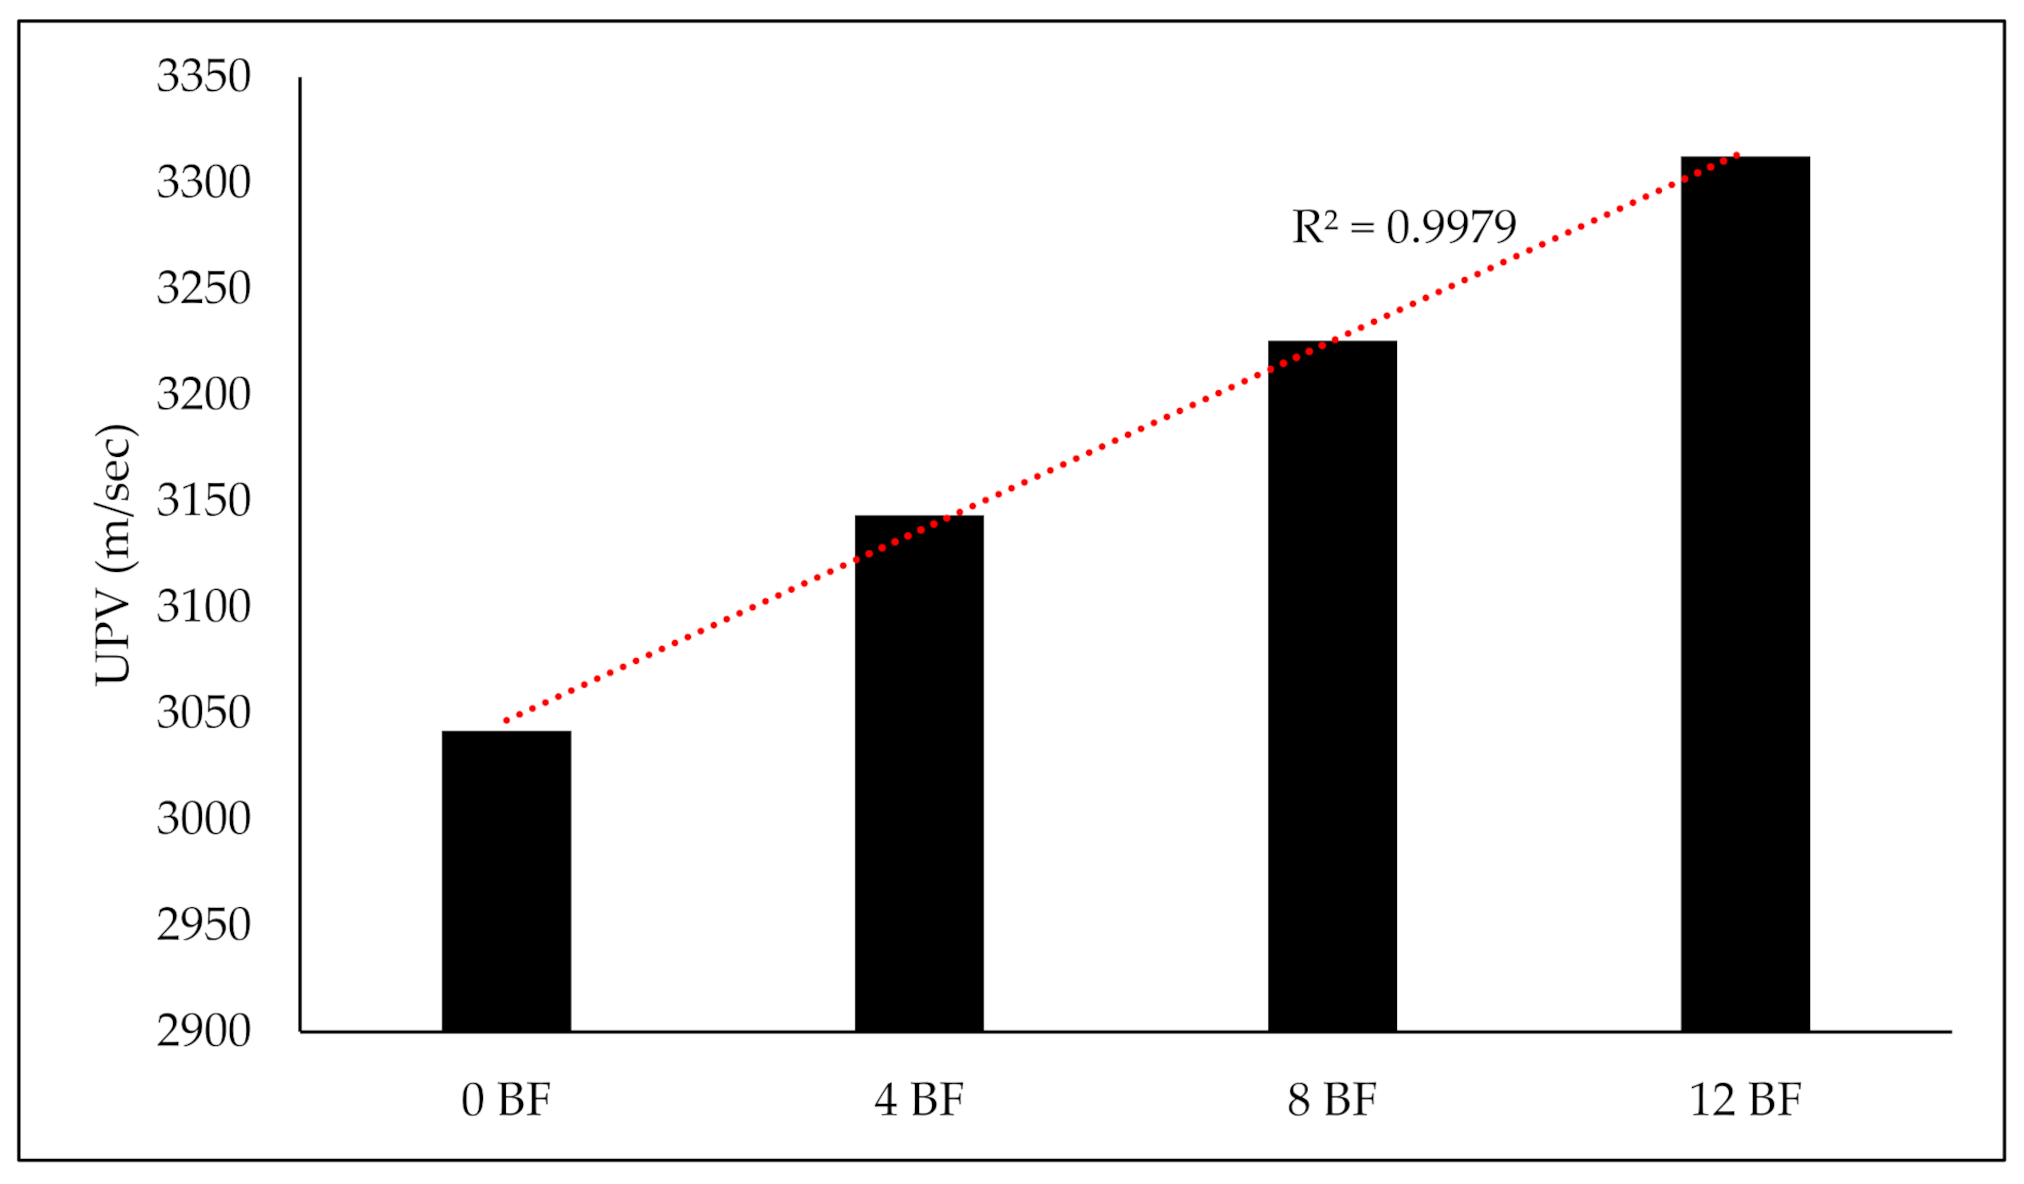
3.2. Ultrasonic Pulse Velocity (UPV) Results

The UPV test was performed on fly ash-based geopolymer mortar samples after 28 days. The UPV test was carried out to study the effect of BF on the samples and to determine the compactness of the fly ash-based geopolymer mortars filled with BP waste. Figure 6 shows the UPV test results of the series. Similarly, Figure 6 illustrates the relationship between the UPV and BF content in the geopolymer series. The wave velocity and the number of voids in the matrix of geopolymer samples have a reciprocal relationship [27]. The penetration rate is determined by dividing the distance between the origin and the receiver by the elapsed time. When the matrix of samples contains more voids, the time required increases, and the penetration rate decreases.
Consequently, the void ratio has a significant effect on the mechanical properties of fly ash-based geopolymer specimens. The relationship between UPV and BF content was relatively high, with an R2 of 0.99. Thus, in this study, it was found that the addition of BF to fly ash-based geopolymer mortars increased the UPV values of the geopolymer specimens. The UPV values increased by 3.34%, 6.05%, and 8.90% for series 4 BF, 8 BF, and 12 BF, respectively, compared to series 0 BF. Although the fiber exposure improved the UPV values by reducing the void ratio, the improvement was not significant. This situation was because the fibers had no direct effect on the homogeneity or compaction of the matrix. The observed behavior indicates that basalt fiber content influences the UPV of composites and is connected to the composite density and perceived porosity. Additionally, basalt fiber influences the geopolymer matrix and improved the UPV values of geopolymer mortar samples. Ozkan and Coban [28] investigated the hybrid effects of basalt and PVA fiber on the properties of cementitious composites, and the effect of BF on UPV results they found are consistent with the effect of BF performed in this study.

3.3. Charpy Impact Test Results

The Charpy impact test was performed on prismatic fly ash-based geopolymer samples. The Charpy impact test was performed on samples of the series, and the average results were reported in Kgf-m units. This test uses a falling pendulum’s potential energy to fracture samples at high strain rates and characterize the composites. Mechanical property testing procedures are based on the principles of stress wave propagation, kinetic energy, or potential energy [29]. The absorption of impact energy and comparable characteristics are highly dependent on the fiber properties [30]. In this study, the correlation between Charpy impact test values and BF content was strong, and the R2 was 0.90. The addition of BF enhanced the Charpy impact test values of the geopolymer specimens. The Charpy impact test results were 13.65, 24.4, 28.65, and 29.8 Kgf-m for series 0 BF, 4 BF, 8 BF, and 12 BF, respectively. The Charpy impact test results increased by 78.75%, 109.89%, and 118.32% for series 4 BF, 8 BF, and 12 BF, respectively, compared to series 0 BF. The Charpy impact test results increases are shown in Figure 7.

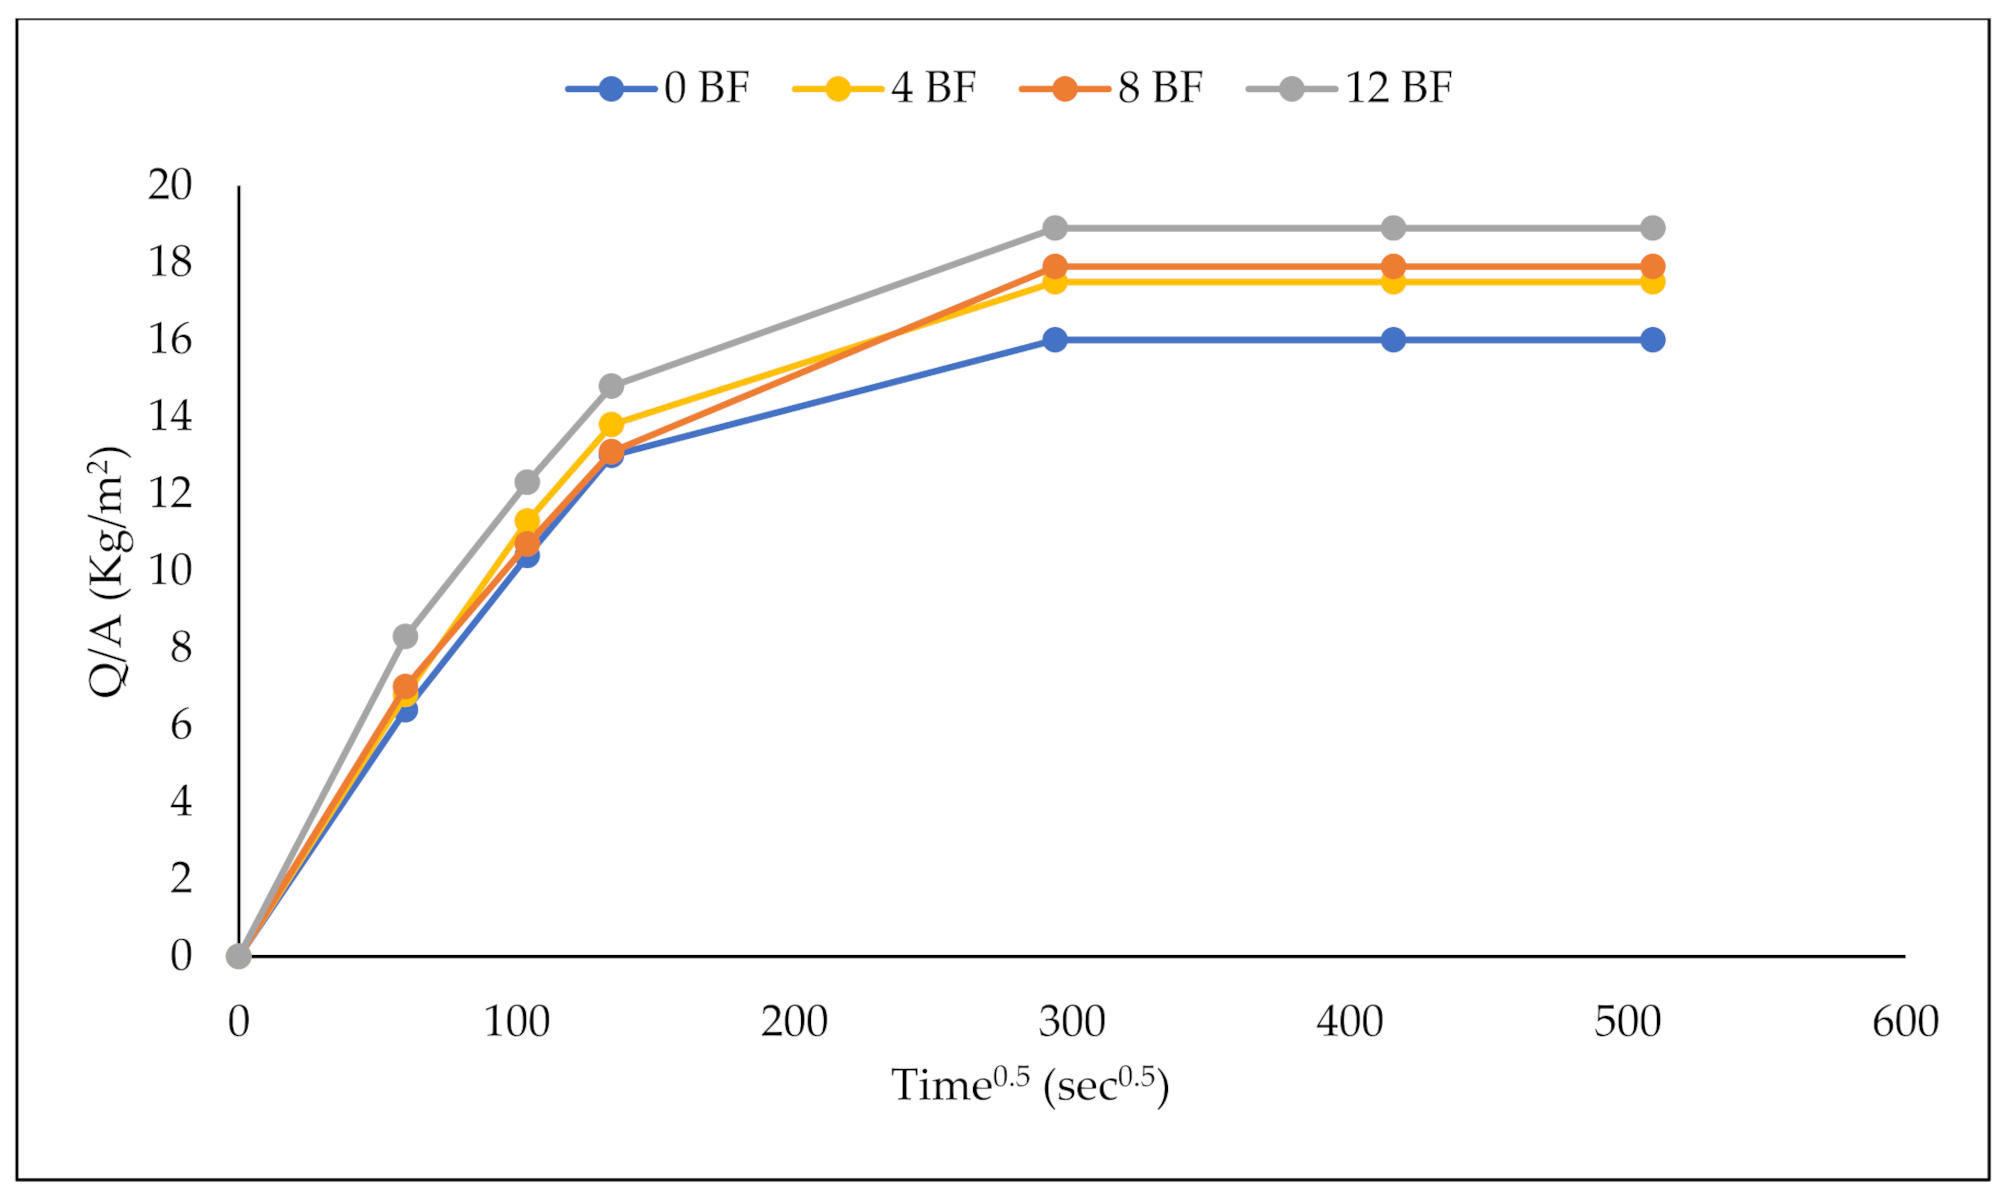
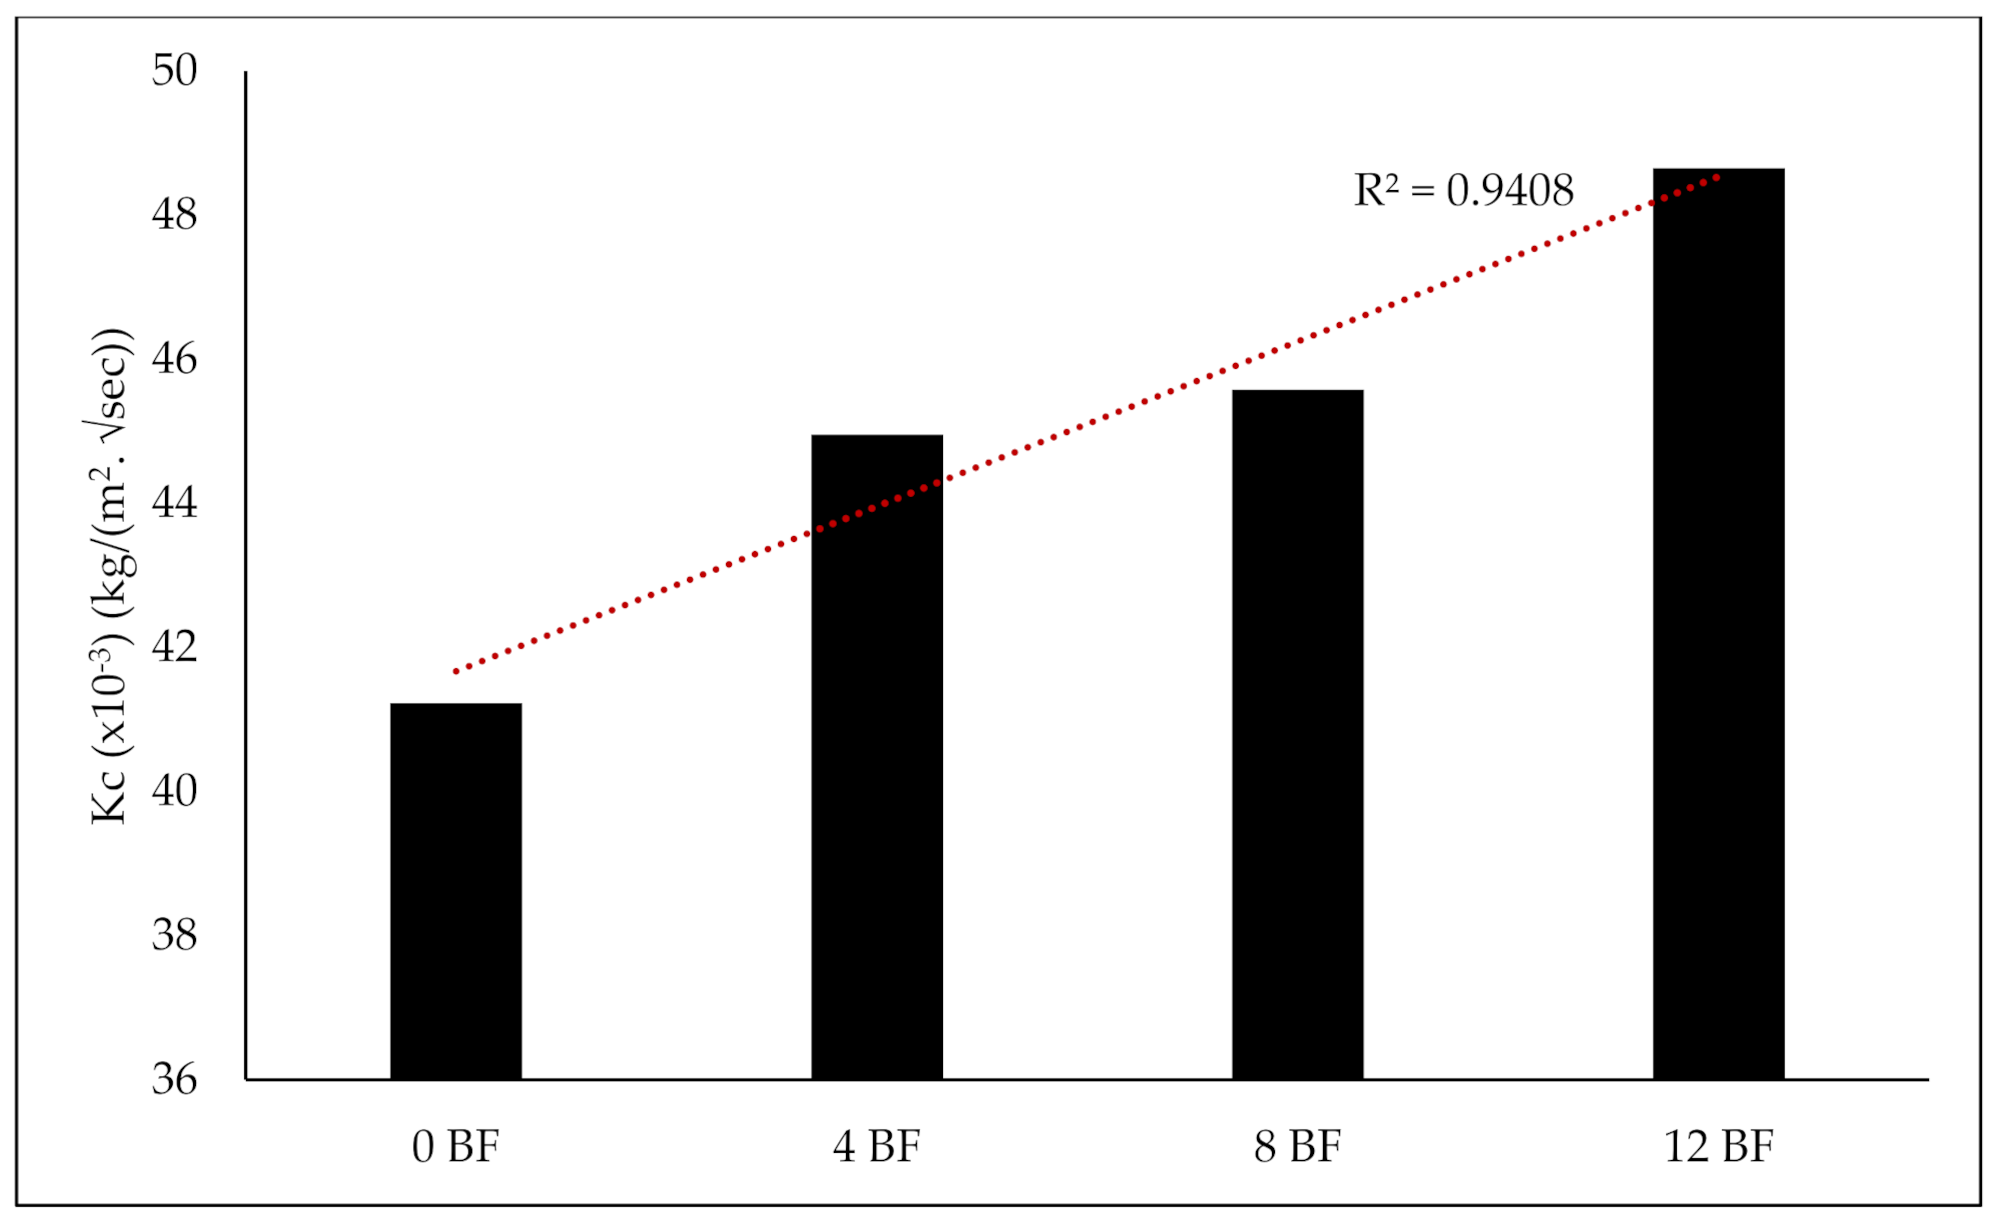
3.4. Water Absorption

After 28 days, the capillary water absorption test was performed on the samples, and the results are shown in Figure 8. In this study, the amount of water absorbed over time was determined as a function of the area in contact with the water, and the capillary water absorption curves shown in Figure 8 were obtained using formula two given in Section 2.3.3. Series 0 BF absorbed the least amount of water, and series 12 BF absorbed the most water compared to the other series. Increasing the BF percentage increased the amount of water absorbed, as shown by the slopes of the capillary water uptake. The percentage increase in water absorption was 9.38%, 11.88%, and 18.13% for 4 BF, 8 BF, and 12 BF, respectively, compared to sample 0 BF. These results are supported by the slopes of the capillary water uptake tests. Figure 9 also shows the capillary water absorption coefficient (Kc) values of fly ash-based geopolymer mortar samples containing BF in different proportions. The water absorption coefficient (Kc) values were determined using the least-squares method. The percentage increases in the water absorption coefficients of samples 4 BF, 8 BF, and 12 BF were 9.04%, 10.55%, and 17.99%, respectively. As a result of capillary water absorption of fly ash geopolymer samples containing BF in different ratios, increasing the content of BF increased the amount of water absorbed by the samples. This increase is because the addition of BF improves pore connectivity at large volume fractions. Similar results were obtained in [21,31].

3.5. High-Temperature Results

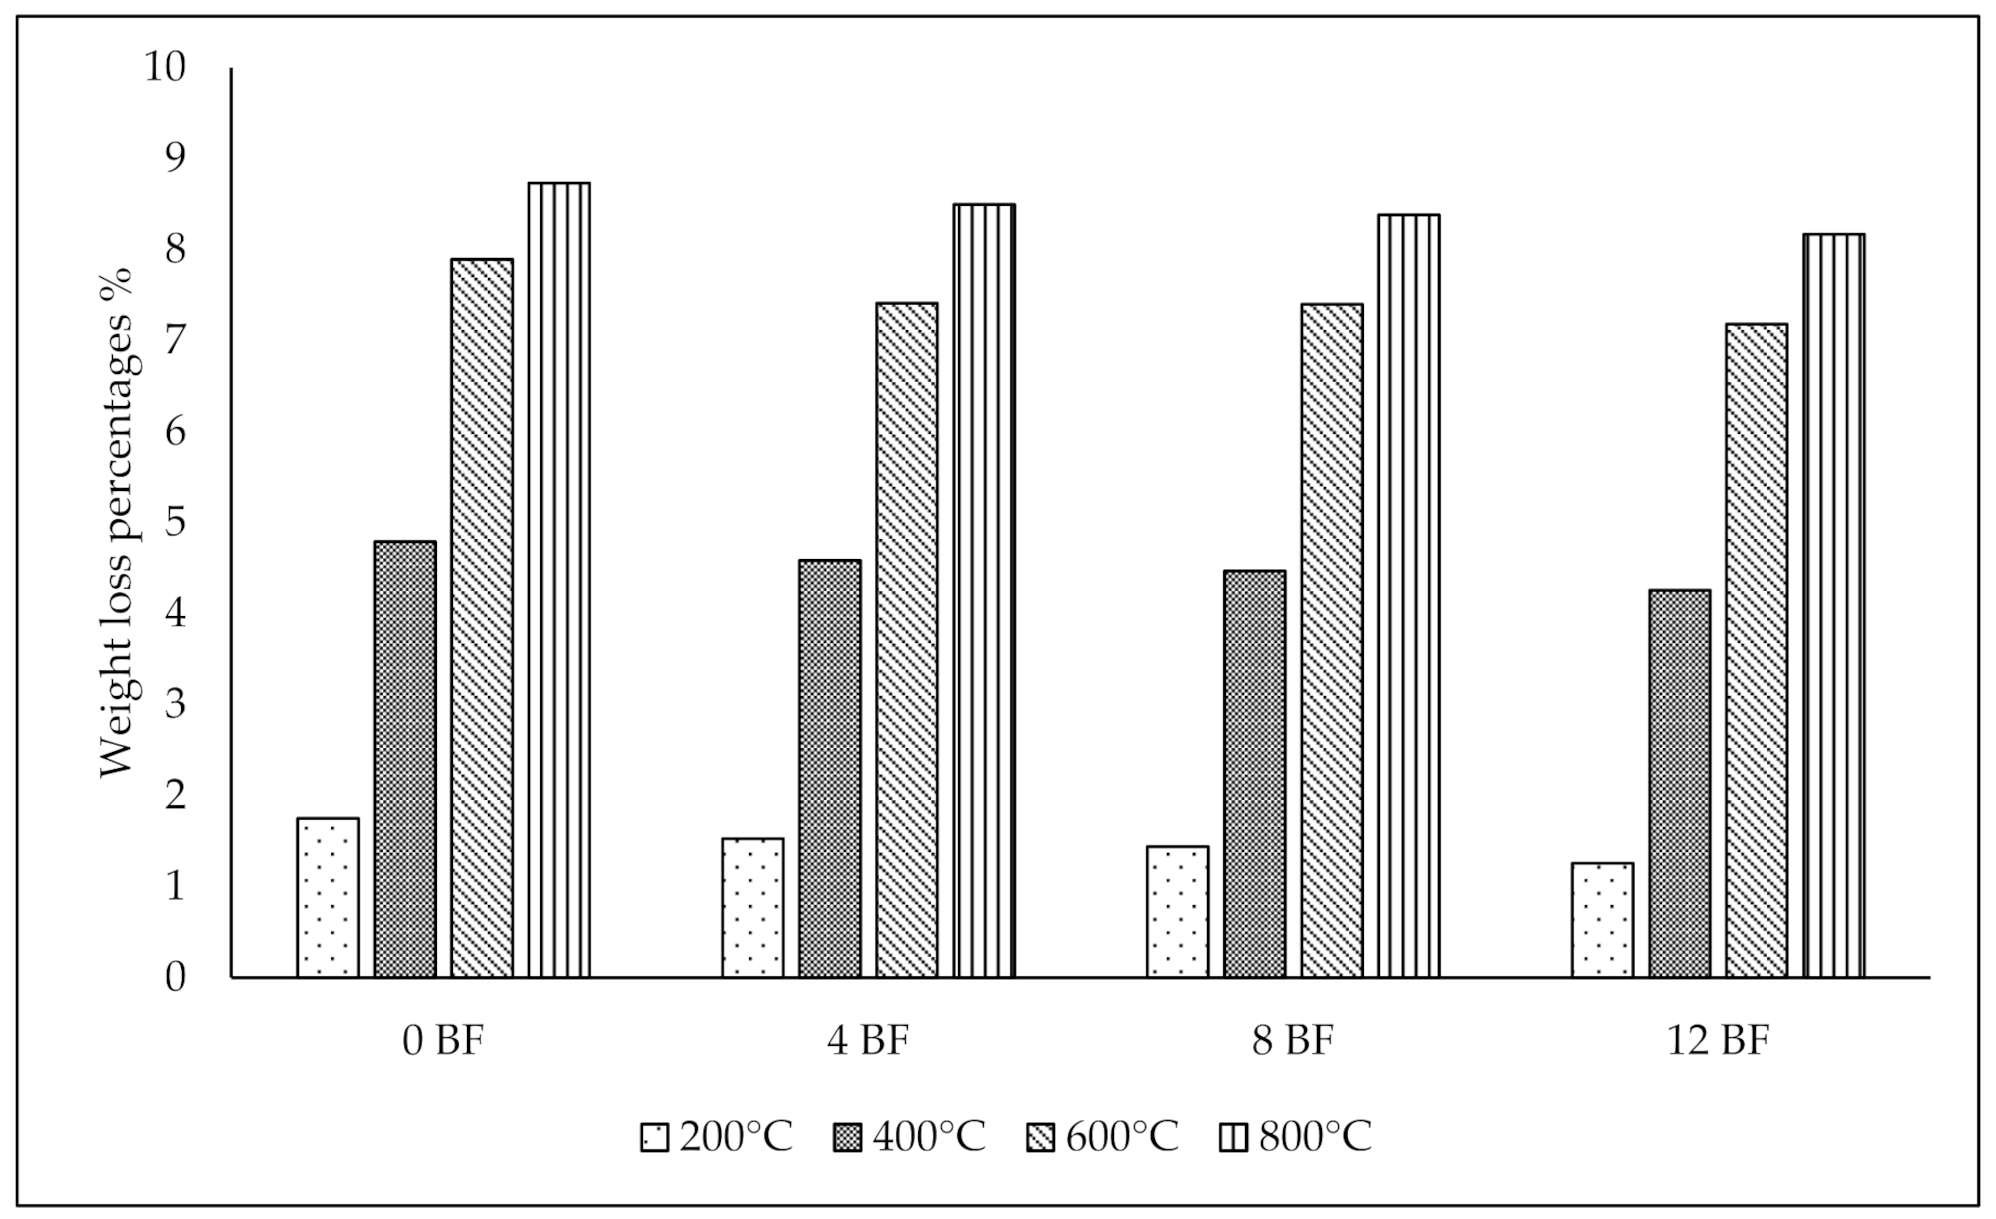
3.5.1. Weight Measurement Results

The behaviors of the produced geopolymer specimens after a high-temperature test were analyzed and compared with samples cured at 20 °C for 28 days. Fly ash-based samples were exposed to 200 °C, 400 °C, 600 °C, and 800 °C temperatures to perform the high-temperature test. Figure 10, Figure 11, Figure 12, Figure 13, Figure 14 and Figure 15 showed the weight loss, compressive strength, flexural strength, UPV, and damage degree values of fly ash geopolymer samples after and before the high-temperature test. After 400 °C, the increase in weight loss ratio was observed, as seen in Figure 10. The 12 BF samples had the smallest weight loss, and the 0 BF had the highest weight loss. After 800 °C, the weight loss percentages of 0 BF, 4 BF, 8 BF,12 BF were 8.73%, 8.49%, 8.38%, and 8.17% respectively. The inclusion of BF slowed down the weight reduction. This occurred as a result of BF’s ability to limit the high-temperature cracks in the samples. Thus, reducing the formation of cracks reduced the samples’ weight loss exposed to the high-temperature effect. Sahin et al. [32] investigated the effect of basalt fiber on metakaolin-based geopolymer mortars, and they found that the inclusion of BF reduced weight reduction. Generally, the interface bonds between paste and aggregate weaken at high temperatures, leading to weight loss [33,34]. For example, the weight loss percentages of 12 BF samples exposed to 200 °C, 400 °C, 600 °C, and 800 °C were 1.26%, 4.26%, 7.18%, and 8.17 respectively.

3.5.2. Compressive and Flexural Strength Results

The Compressive strength and flexural strength tests were performed on geopolymer mortar samples which exposed to 200 °C, 400 °C, 600 °C, and 800 °C. Then the results of the samples conducted after and before the high-temperature test were compared. The strength tests were conducted to study the effect of high temperature on the fly ash-based geopolymer mortars’ mechanical properties contained BF. Figure 11 and Figure 12 show the results of the compressive and flexural strength of the fly ash-based geopolymer samples. The 12 BF mix had the highest compressive and flexural strength results, and the 0 BF mix had the lowest compressive and flexural strength results. Thus, the BF improved the mechanical properties of the geopolymer samples. The increases of the results of 4 BF, 8 BF, 12 BF samples exposed to 800 °C were 9.01%, 12.79%, and 15.79% for compressive strength and 11.61%, 32.87%, and 44.69% for flexural strength, respectively compared to 0 BF samples. In addition, the increases of the results of 12 BF samples exposed to 200 °C, 400 °C, 600 °C, and 800 °C were 14.31%, 17.18%, 18.65%, and 15.79% for compressive strength and 36.94%, 39.95%, 37.80%, and 44.69% for flexural strength, respectively compared to 0 BF samples.
At 200 °C, the flexural and compressive strengths of the samples did not change significantly (Figure 11 and Figure 12), but beyond 400 °C, the reduction rate of compressive and flexural increased more. Endothermic processes caused these reductions. Dehydration and water vapor of free water occurred concurrently with the processes in the matrix structure of the geopolymer [8,35,36]. In addition, the flexural strength decreases due to the high-temperatures effect were lower than the compressive strength decreases. Where the decreases of the strength of the 12 BF samples exposed to 200 °C, 400 °C, 600 °C, and 800 °C were 7.53% 28.17%, 41.36%, and 54.57% for compressive strength and 2.27%, 14.02%, 33.71%, and 44.32%for flexural strength, respectively compared to the samples not exposed to high-temperature test.
The vapor action emphasized the decrease of compressive and flexural strength as the temperature rose. The geopolymer matrix structure’s water transformed into vapor whenever the specimens were exposed to high temperatures. Additionally, increasing temperatures make the Al SiO gel composition crystallized in the geopolymer matrix, causing more microcracks [37]. When the temperature surpassed 100 °C, the internal pressure rose steadily. This scenario produced microcracks in the geopolymer specimens due to crystallization stress. Thermal fractures and thermochemical breakdown in crystal lattices were apparent as the temperature rose. While the sample’s strength values decreased, it became more brittle, and fragile cracking appeared. In addition, when the temperature surpassed 100 °C, there was a substantial thermal incompatibility between the paste and the aggregate in geopolymer. Increased temperature also caused microcracks in the aggregate-paste interface transition region, resulting in thermal incompatibilities [38].

3.5.3. Ultrasonic Pulse Velocity (UPV) Results

The UPV test of fly ash geopolymer samples was conducted, and using the UPV results, the damage degrees of samples were calculated (Figure 13). The 12 BF samples had the highest UPV, and the 0 BF had the smallest UPV. Where the UPV results of 0 BF, 4 BF, 8 BF, 12 BF samples exposed to 800 °C were 2512.05, 2627.69, 2700.42, and 2785.63 m/s respectively. Thus, the addition of BF in the fly ash geopolymer samples increased the UPV. The UPV readings dropped as the temperature rose for all samples. Due to evaporation in the interior structure, the pore size grew, and the continuity reduced, resulting in this situation [39]. When the UPV findings were compared to the mechanical results, it was observed that the values were almost consistent. At high temperatures, the interface bonds between the aggregates and pastes of the samples weaken, resulting in a reduction in UPV [33]. Where the UPV results of 12 BF samples exposed to 200 °C, 400 °C, 600 °C, and 800 °C were 3312.63, 3190.17, 3020.59, 2905.46, and 2785.63 m/s, respectively.
In addition, the damage degrees of the fly ash-based geopolymer samples exposed to high temperatures were performed. The damage degrees of the fly ash-based geopolymer samples containing BF are shown in Figure 14. The width and number of the cracks of fly ash-based geopolymer samples increased as the high temperatures increased. The UPV values were used to evaluate the degree of damage. In previous studies, Singh and Gupta [40] were used the UPV values to perform the damage degree in their study. A proportional relationship was obtained between the damage degrees and the increase of high temperatures in all series. In addition, as Figure 14 shows, the increase in basalt content decreased the damage degrees of fly ash-based geopolymer mortar samples containing BF with different ratios. The performed damage degrees were ranged between 3.69% for 12 BF samples exposed to 200 °C and 17.42% for 0 BF samples exposed to 800 °C. In other words, the UPV values of the samples exposed to the high-temperature effect were smaller than the initial UPV values of the samples. Thus, high-temperature increases increased the damage degrees of geopolymer samples. The damage degrees of the 12 BF samples at temperatures of 200 °C, 400 °C, 600 °C, and 800 °C were 3.70%, 8.82%, 12.29%, and 15.91%, respectively. This result is compatible with the weight measurement and mechanical strength tests performed in the study. The damage degrees of 0 BF, 4 BF, 8 BF and 12 BF samples exposed to 800 °C were 17.42%, 16.41%, 16.29%, and 15.91%. In addition, the damage degrees of 0 BF, 4 BF, 8 BF, and 12 BF samples exposed to 200 °C were 4.54%, 4.38%, 4.04%, and 3.70%. Thus, the increase in the BF ratio decreased the damage degrees. This situation was because BF inhibited high-temperature cracks in the samples and limited the damage.

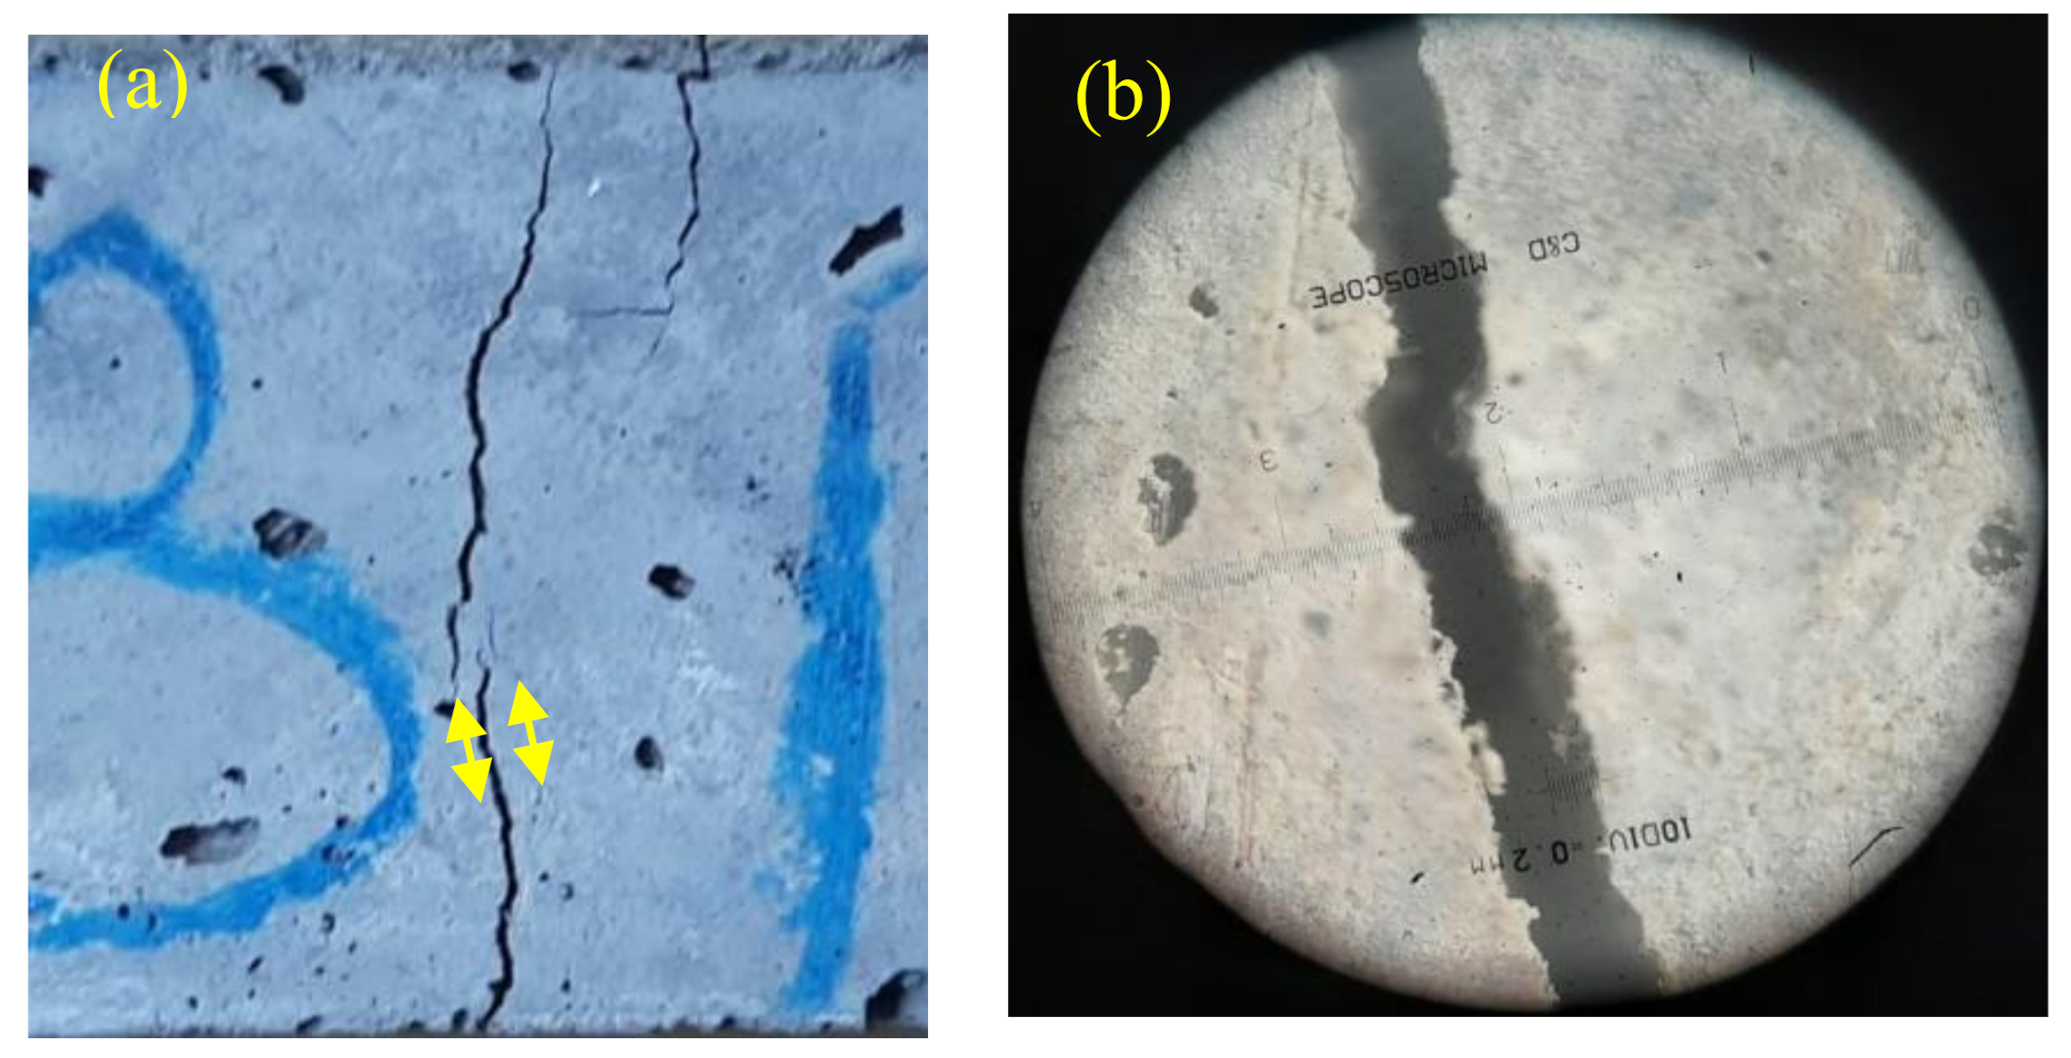
3.5.4. Visual Assessment of High-Temperature Test

Fly ash-based geopolymer mortar samples exposed to various temperatures are shown in Figure 15. In general, it was found that the color of the samples and BF exposed to 200 °C and 400 °C did not change compared to the samples not exposed to the high temperature (20 °C). The color of samples exposed to 600 °C and 800 °C changed from gray to brown and white spots were formed in the cross-section. In addition, the BF of the samples exposed to 600 °C and 800 °C changed in color. Unequal volume changes between geopolymer components caused by temperature exposure were referred to as thermal incompatibility of components. This situation also resulted in microcracks in the interfacial transition zone between the geopolymer paste and the aggregate. Microcracks were also increased because of the loss of homogeneity [38].
A 40× magnification microscope was used to examine better the complexity of the outer surfaces of the BF-containing geopolymer samples exposed to high temperatures. The preliminary visual evaluation determined that series 12 BF was the most compact series, as the BF content was higher than the other series. For this reason, 12 BF samples were selected to be examined under the microscope. The microscope images of the 12 BF samples subjected to the high-temperature tests are shown in Figure 16.
Figure 16a,b show that the geopolymer mortar samples exposed to 200 °C and 400 °C did not show any cracks on the surface and the samples maintained their compactness. Figure 16c shows that superficial microcracks formed on the outer surfaces of the geopolymer mortar specimens exposed to 600 °C. Figure 16d shows that the outer surfaces of the specimens exposed to the transition from 600 °C to 800 °C loosened due to superficial cracks, and the cracks were filled with dust formed due to the deteriorated outer surfaces and the aggregates emerged from under the outer surface. As a result, it was observed that the compactness of the geopolymer samples exposed to 600–800 °C deteriorated significantly due to dehydration [8,41].

3.5.5. SEM and EDS Analysis

SEM images of 0 BF and 12 BF samples not exposed to high-temperature tests are shown in Figure 17. As Figure 17a,b shows, 0 BF samples without basalt contained microcracks. The basalt-containing 12 BF samples shown in Figure 17c,d prevented the formation of cracks with the effect of basalt, and it was seen that the 12 BF samples were more compact. The BF acted as a bridging agent, slowing the formation of fractures [42]. In addition, SEM images of both 0 BF and 12 BF samples contain N-A-S-H gel and unreacted FA particles. This finding is consistent with previous fly ash-based geopolymers discovered in the literature [43].
Moreover, SEM images of 12 BF samples exposed to 200 °C, 400 °C, 600 °C, and 800 °C are shown in Figure 18. In Figure 18a,c, it was seen that the structure of the BF of 12 BF samples exposed to 200 °C and 400 °C was the same and did not change. In addition, the 12 BF samples exposed to 200 °C were more compact and had fewer microcracks than the samples exposed to different high temperatures. In this study, the authors were noticed that the matrix of 12 BF samples started to form microcracks after 400 °C and became less compact than the samples exposed to 200 °C. As shown in Figure 18e, voids were formed in the sample exposed to 600 °C due to dehydration and evaporation. Figure 18g shows that the sample exposed to 800 °C had more voids than the sample exposed to 600 °C. Additionally, the voids formed caused volume reduction and structural deterioration of the sample. After exposure to high temperatures, the samples’ evaporation rate and water losses increase, leading to structural deterioration and increased formation defects [44].
Moreover, EDS traces of the 0 BF and 12 BF samples not exposed to high-temperature test and 12 BF samples exposed to high-temperature test are shown in Figure 19. Figure 19a,b show that Si/Al ratios of 0 BF and 12 BF fly ash-based geopolymer samples exposed to high-temperature tests are 2.18 and 2.16, respectively. Thus, no significant change was observed in the Si/Al ratio of 12 BF compared to 0 BF. The Si/Al ratio of 12 BF samples exposed to 200 °C, given in Figure 19c, increased to 2.72. Additionally, it was observed that the increase in Si/Al ratio of 12 BF samples exposed to 400 °C given in Figure 19d decreased to 2.41. Figure 19e,f show that the Si/Al ratios of 12 BF samples exposed to 600 °C and 800 °C, respectively, decreased to 2.12 and 2.02. These results are consistent with the study conducted by Abdulkareem et al. [45]. They found that the Si/Al ratio decreased when the fly ash paste samples were exposed to 800 °C.

4. Conclusions

This research examined the impact of BF on a geopolymer based on FA and filled with waste BP. The following summarizes the findings of the tests conducted:
  • The study revealed that adding BF to fly ash-based geopolymer mortars improved compressive strength after 28 days. Compressive strength increased by 6.43%, 9.65%, and 11.94% for 4 BF, 8 BF, and 12 BF, respectively.
  • BF greatly improved flexural strength. The inclusion of BF decreased the number of fractures during the flexural test by transferring the flexural load. Flexural strength increased by 7.72%, 25.512%, and 34.15% for 4 BF, 8 BF and 12 BF after 28 days. Additionally, in the 12 BF series, flexural strength increased 2.86 times larger than compressive strength. Thus, the addition of basalt increased flexural strength more than compressive strength.
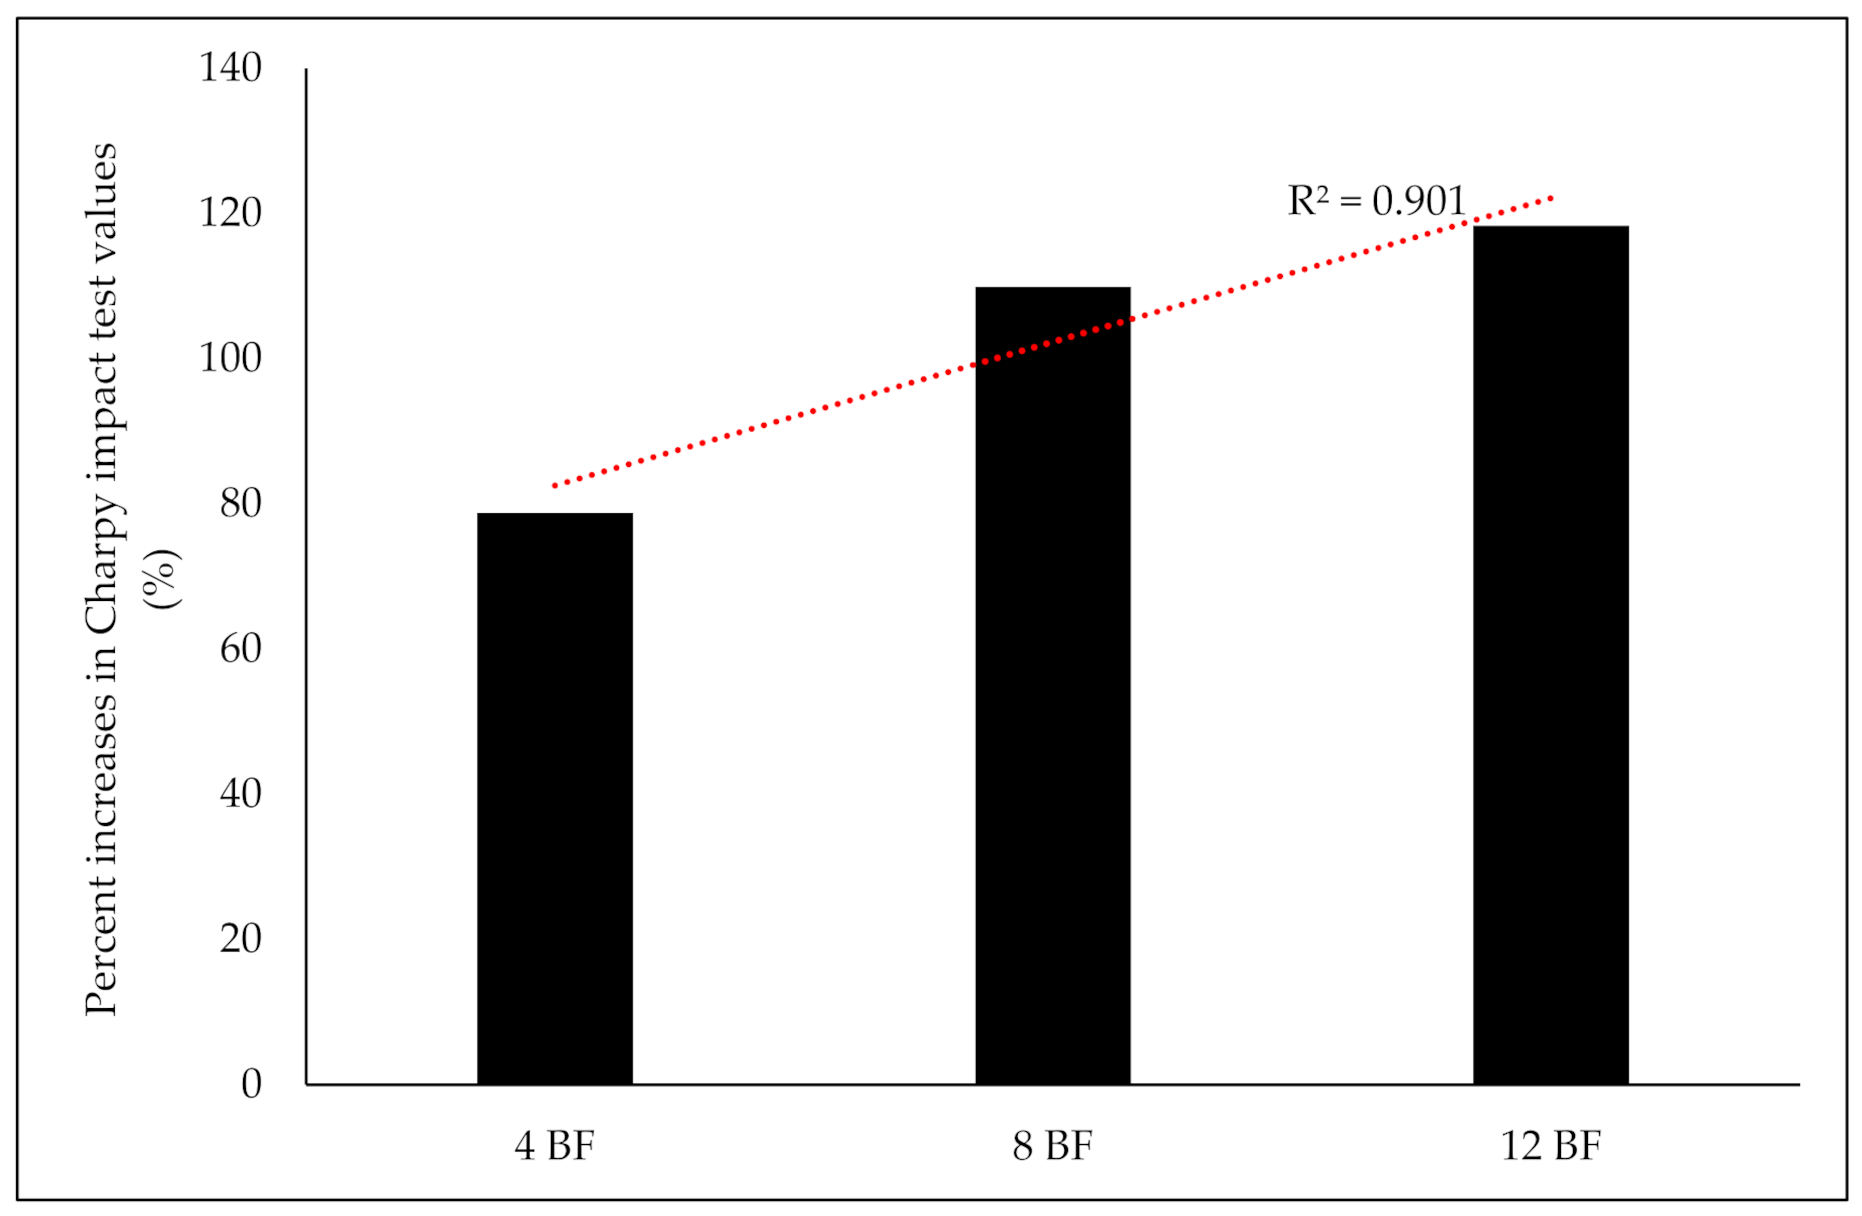
  • A good relationship was found between Charpy impact test results and BF content. It improved the Charpy impact test results of the geopolymer specimens after 28 days. As compared to series 0 BF, the Charpy impact test results improved by 78%, 109%, and 118% for series 4 BF, 8 BF, and 12 BF, respectively.
  • The increase in basalt content of fly ash-based geopolymer mortars affected negatively by increasing the water absorption ability. This increase occurred because of the inclusion of BF, which improved pore connectivity at high volume fractions. Additionally, the water absorption coefficients of 4 BF, 8 BF, and 12 BF samples increased by 9.04%, 10.55%, and 17.99%, respectively.
  • The addition of BF slowed down the weight decreases. The 12 BF samples lost the least weight, while the 0 BF samples lost the most. After 800 °C, the weight loss percentages of 0 BF, 4 BF, 8 BF, 12 BF were 8.73%, 8.49%, 8.38%, and 8.17% respectively. At elevated temperatures, the interface bonds between the paste and aggregate deteriorate, resulting in weight loss. Consequently, the increase of high temperatures increased the weight loss percentages of geopolymer samples.
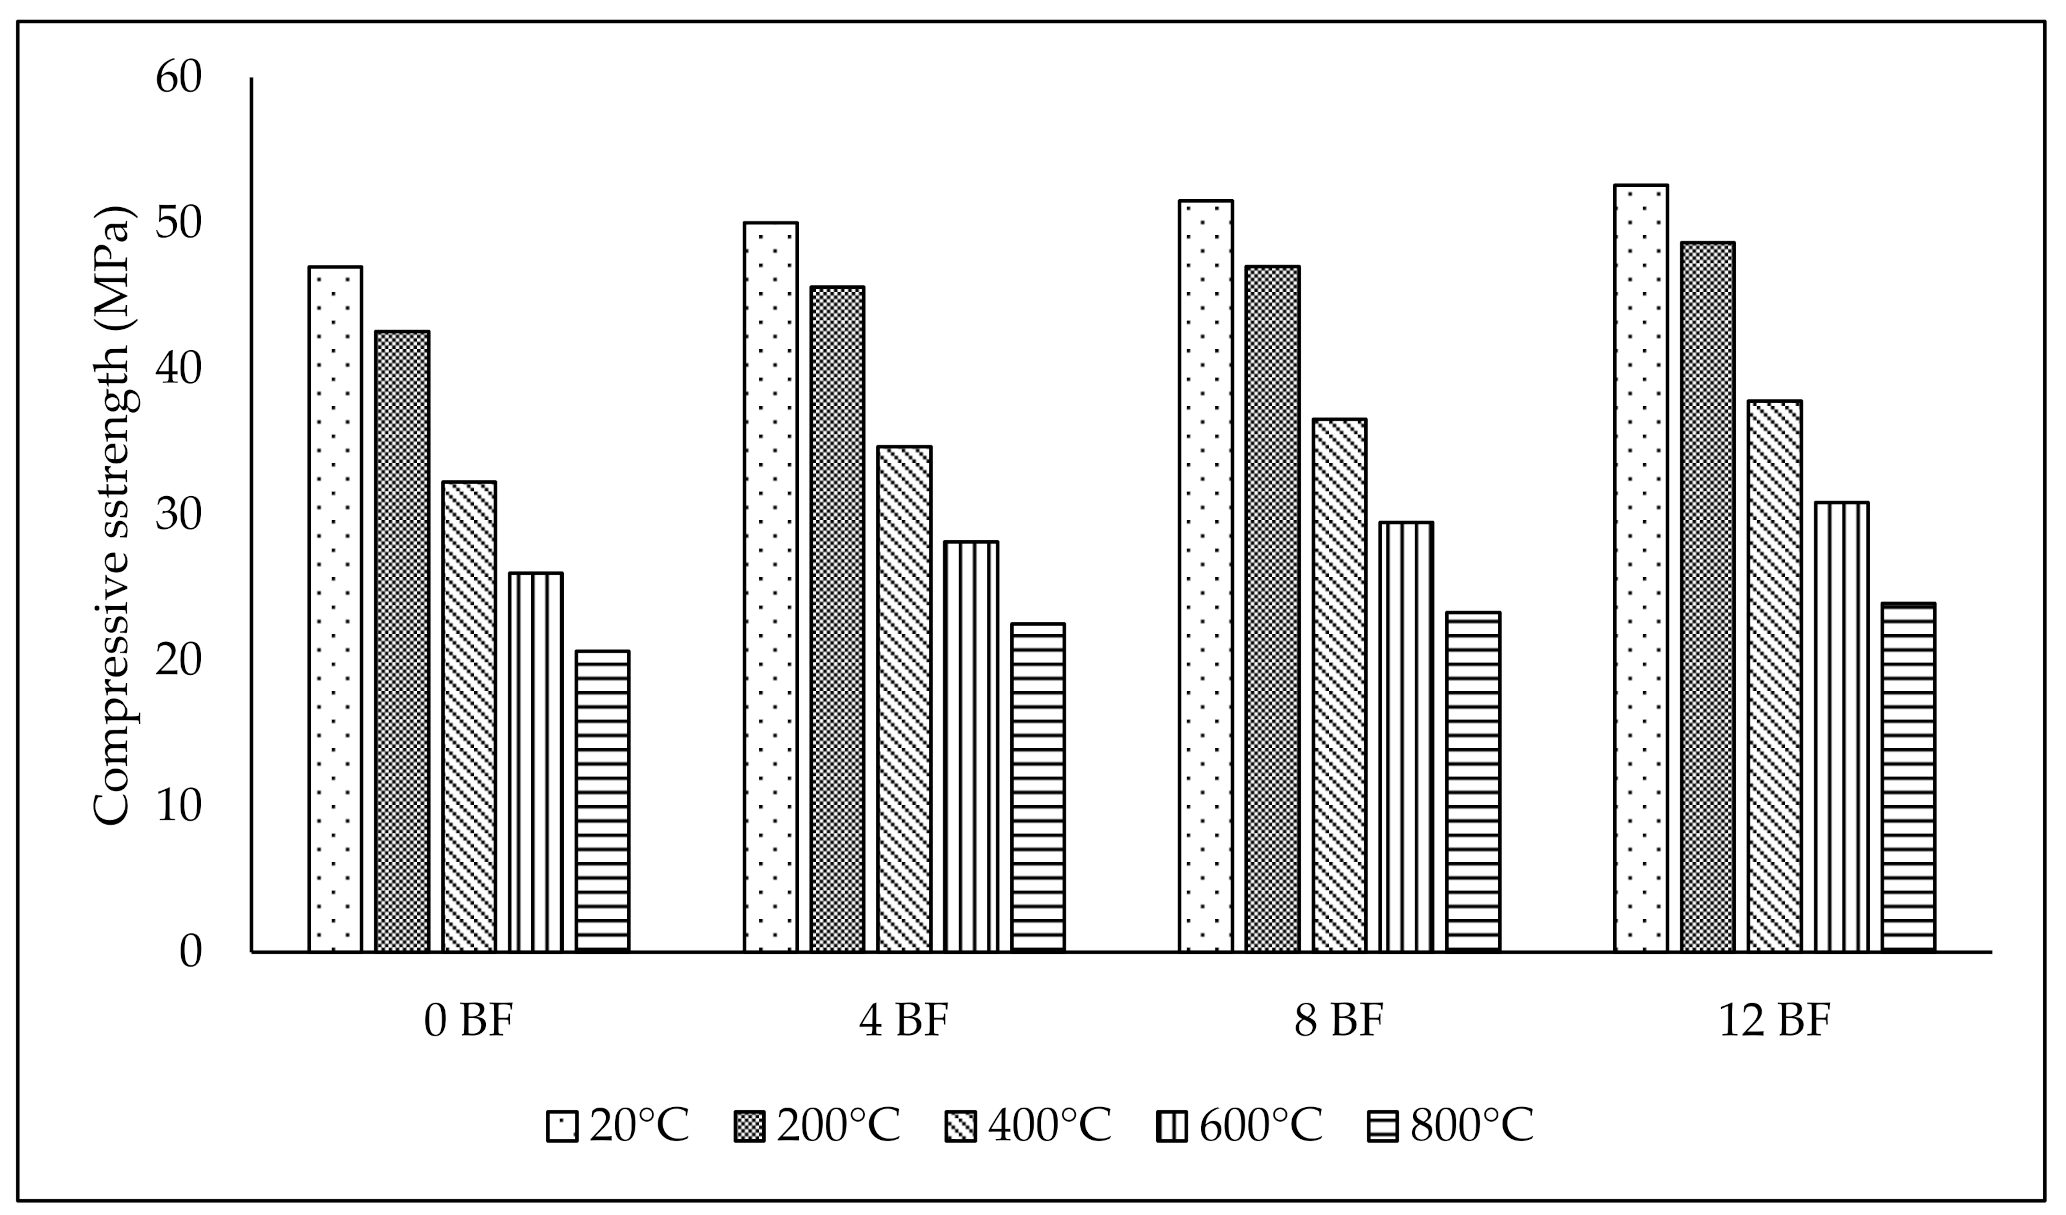
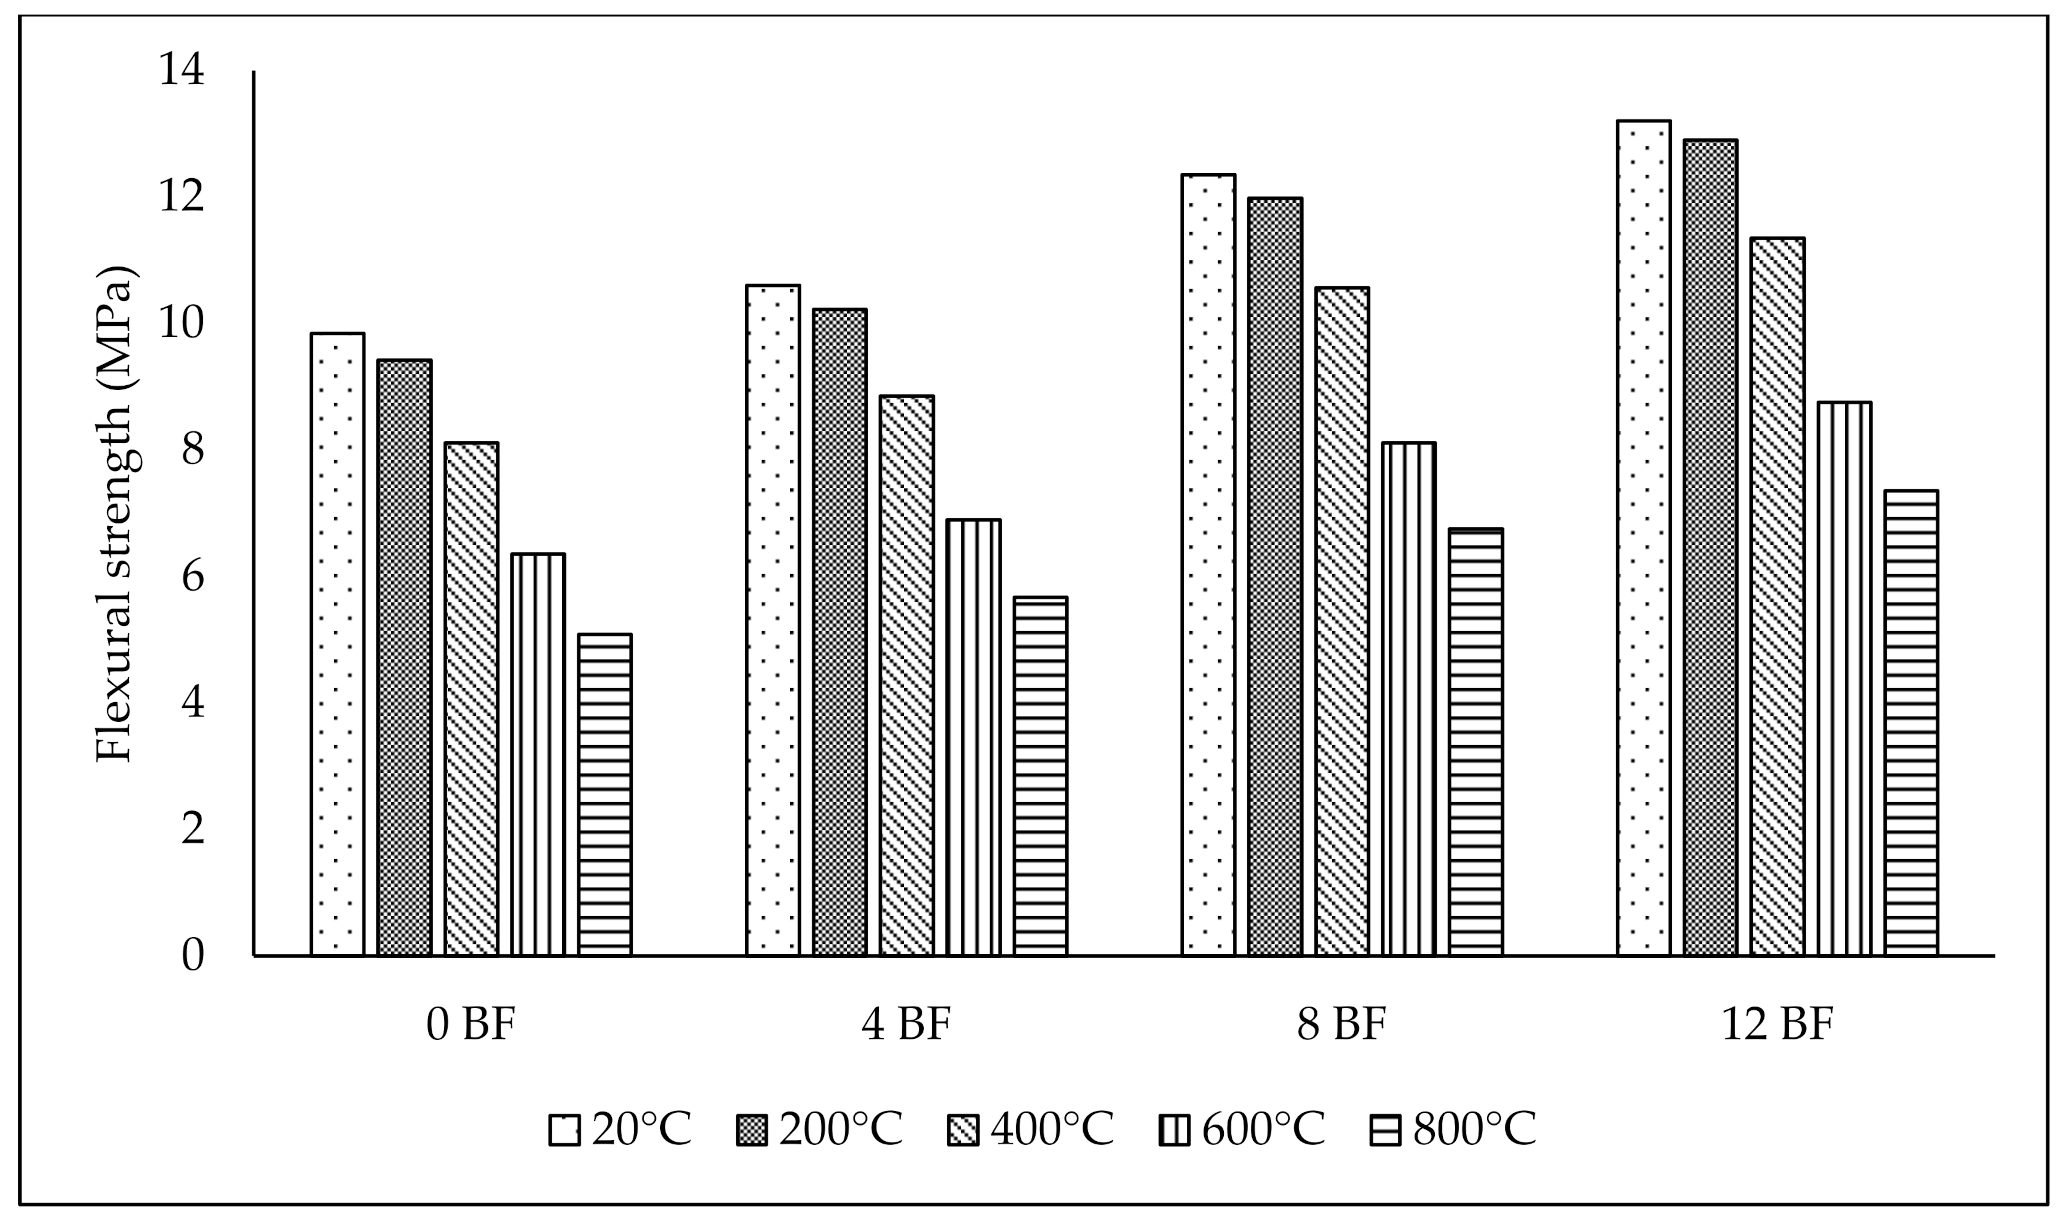
  • The BF improved the compressive and flexural strengths of the samples after and before the high-temperature test. The increases of the compressive and flexural strengths of 4BF, 8BF, 12BF samples exposed to 800 °C were 9.01%, 12.79%, and 15.79% for compressive strength and 11.61%, 32.87%, and 44.69% for flexural strength, respectively compared to 0 BF samples. Thus, the high-temperature effect reduced flexural strength more than compressive strength.
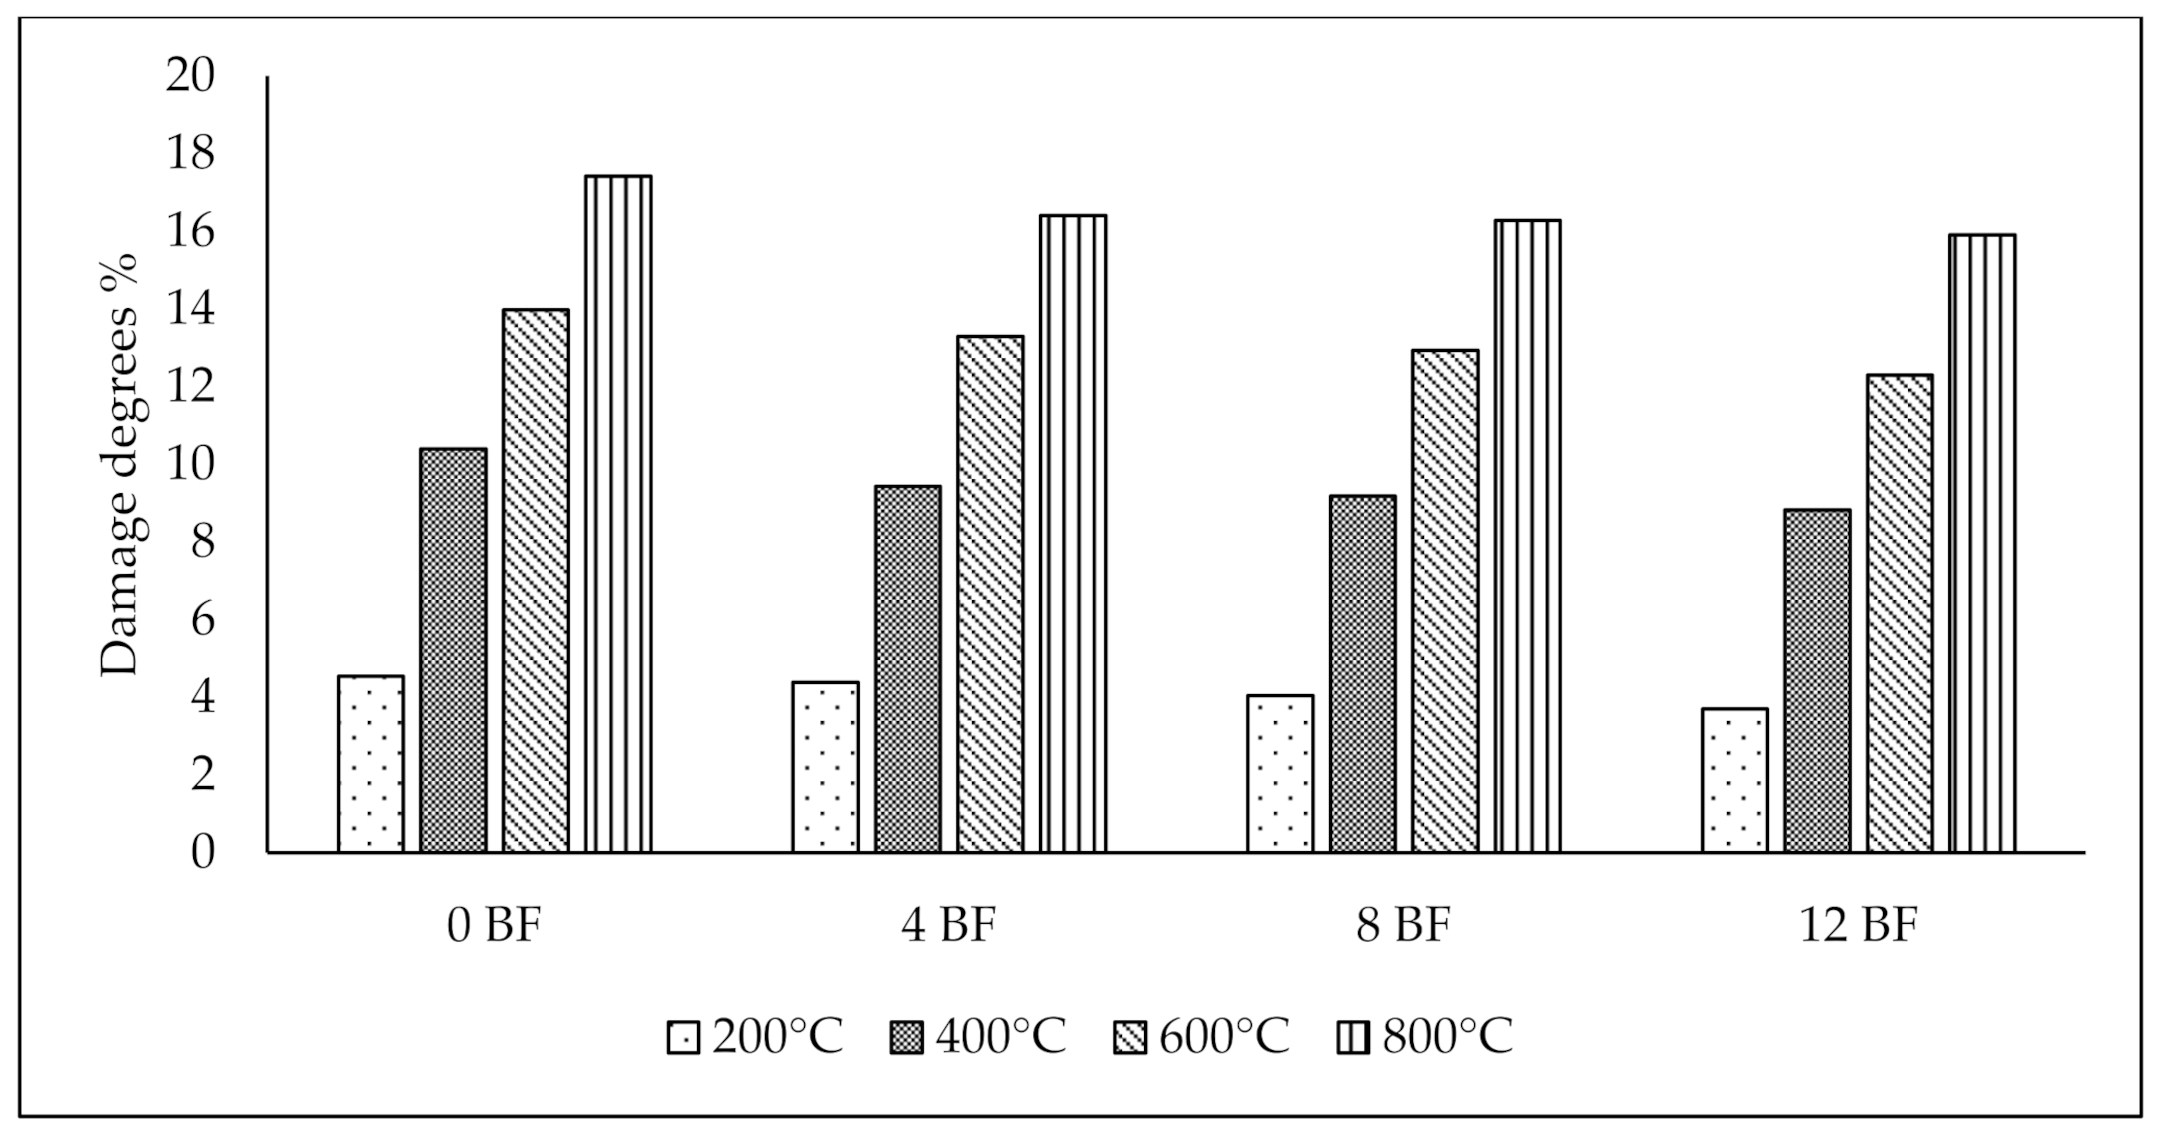
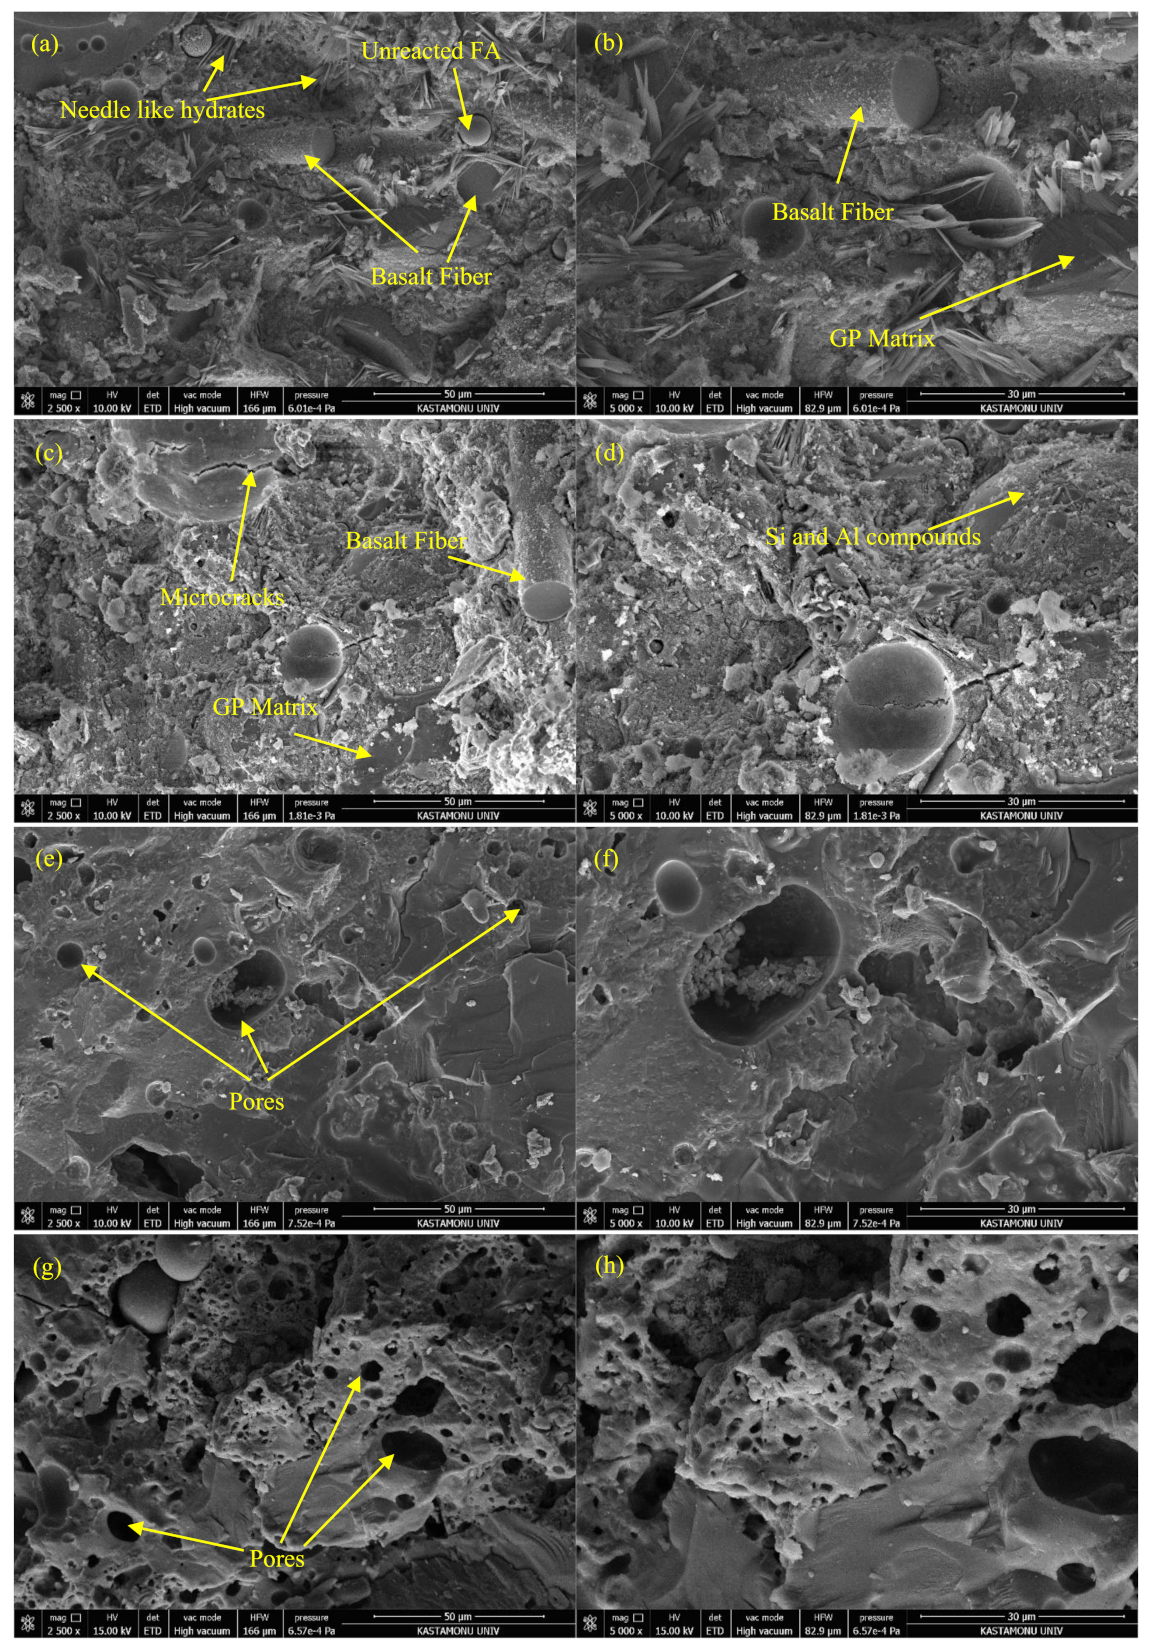
  • BF inhibited high-temperature cracks and limited the damages. Thus, the increase in basalt content decreased the damage degrees of fly ash-based geopolymer mortar samples. After the high-temperature test, the damage degrees of samples ranged from 3.69 to 17.42% for 12 BF samples. Additionally, the damage degrees of the samples exposed to high-temperature effects increased proportionally with the increase in high temperatures.
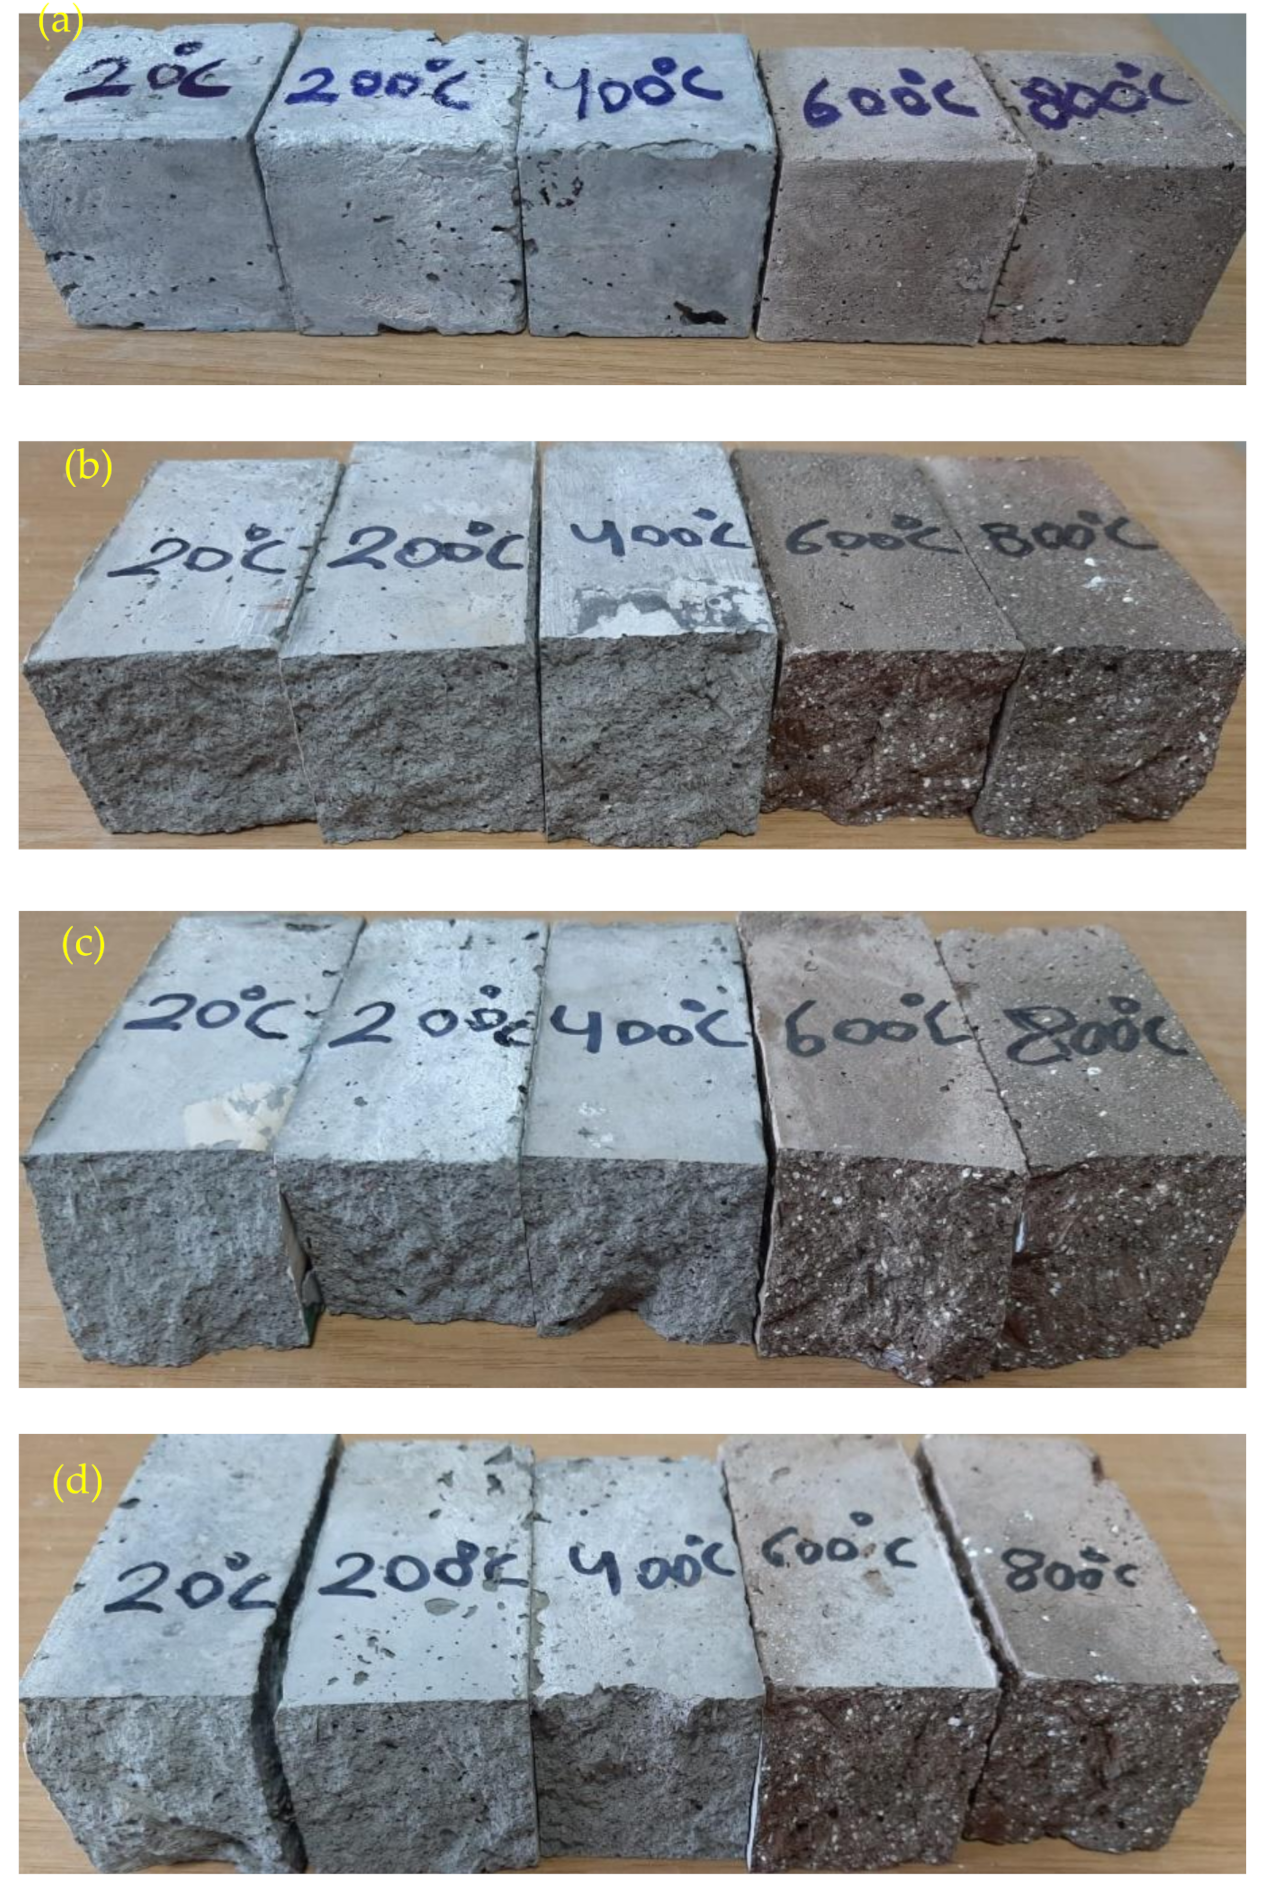
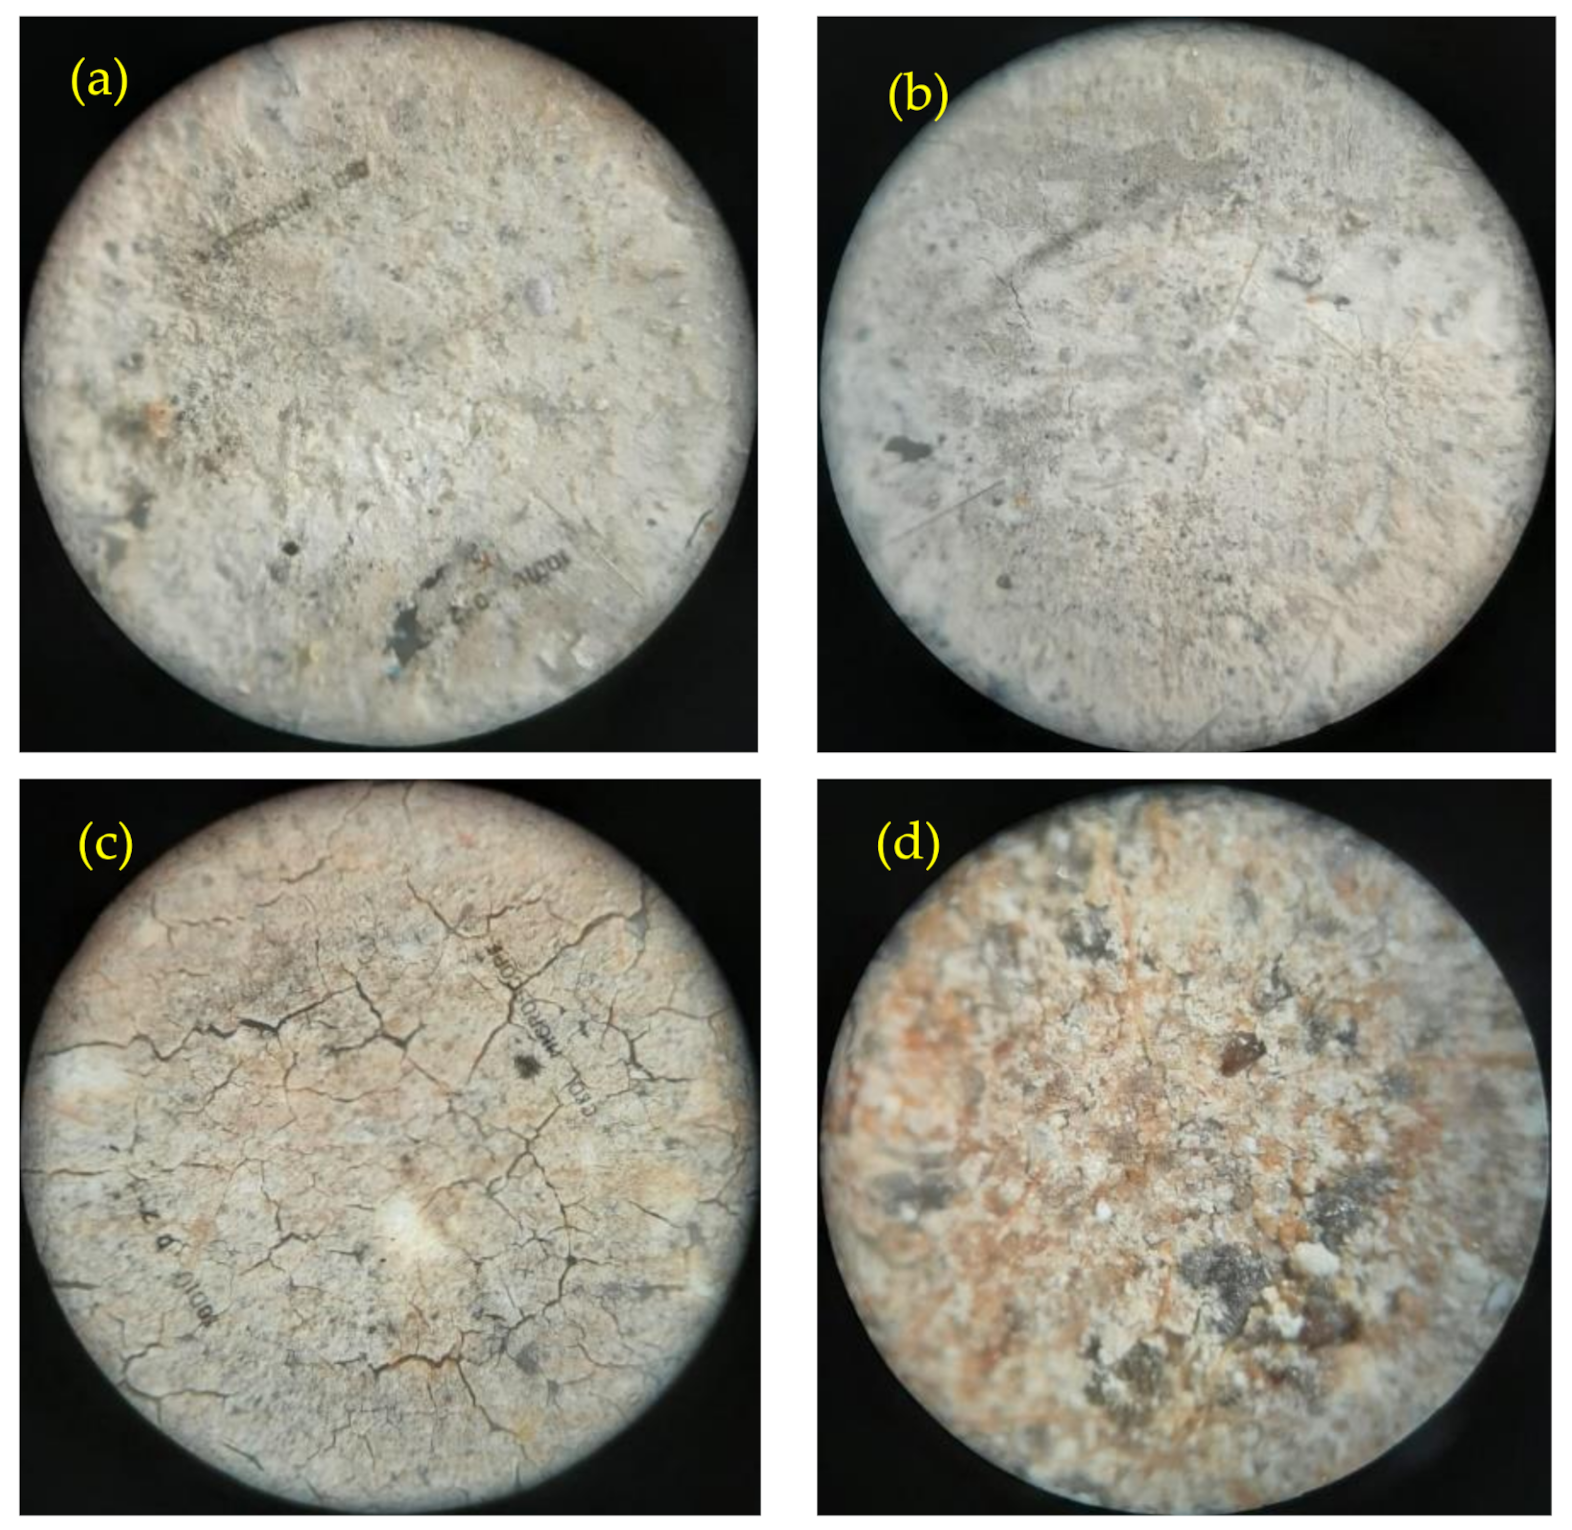
  • The color of the samples and BF exposed to 200 °C and 400 °C did not change significantly compared to the samples exposed to 20 °C. Additionally, the samples exposed to 600 °C and 800 °C turned from gray to brown. Dehydration also affected the compactness of the geopolymer samples exposed to 600–800 °C.
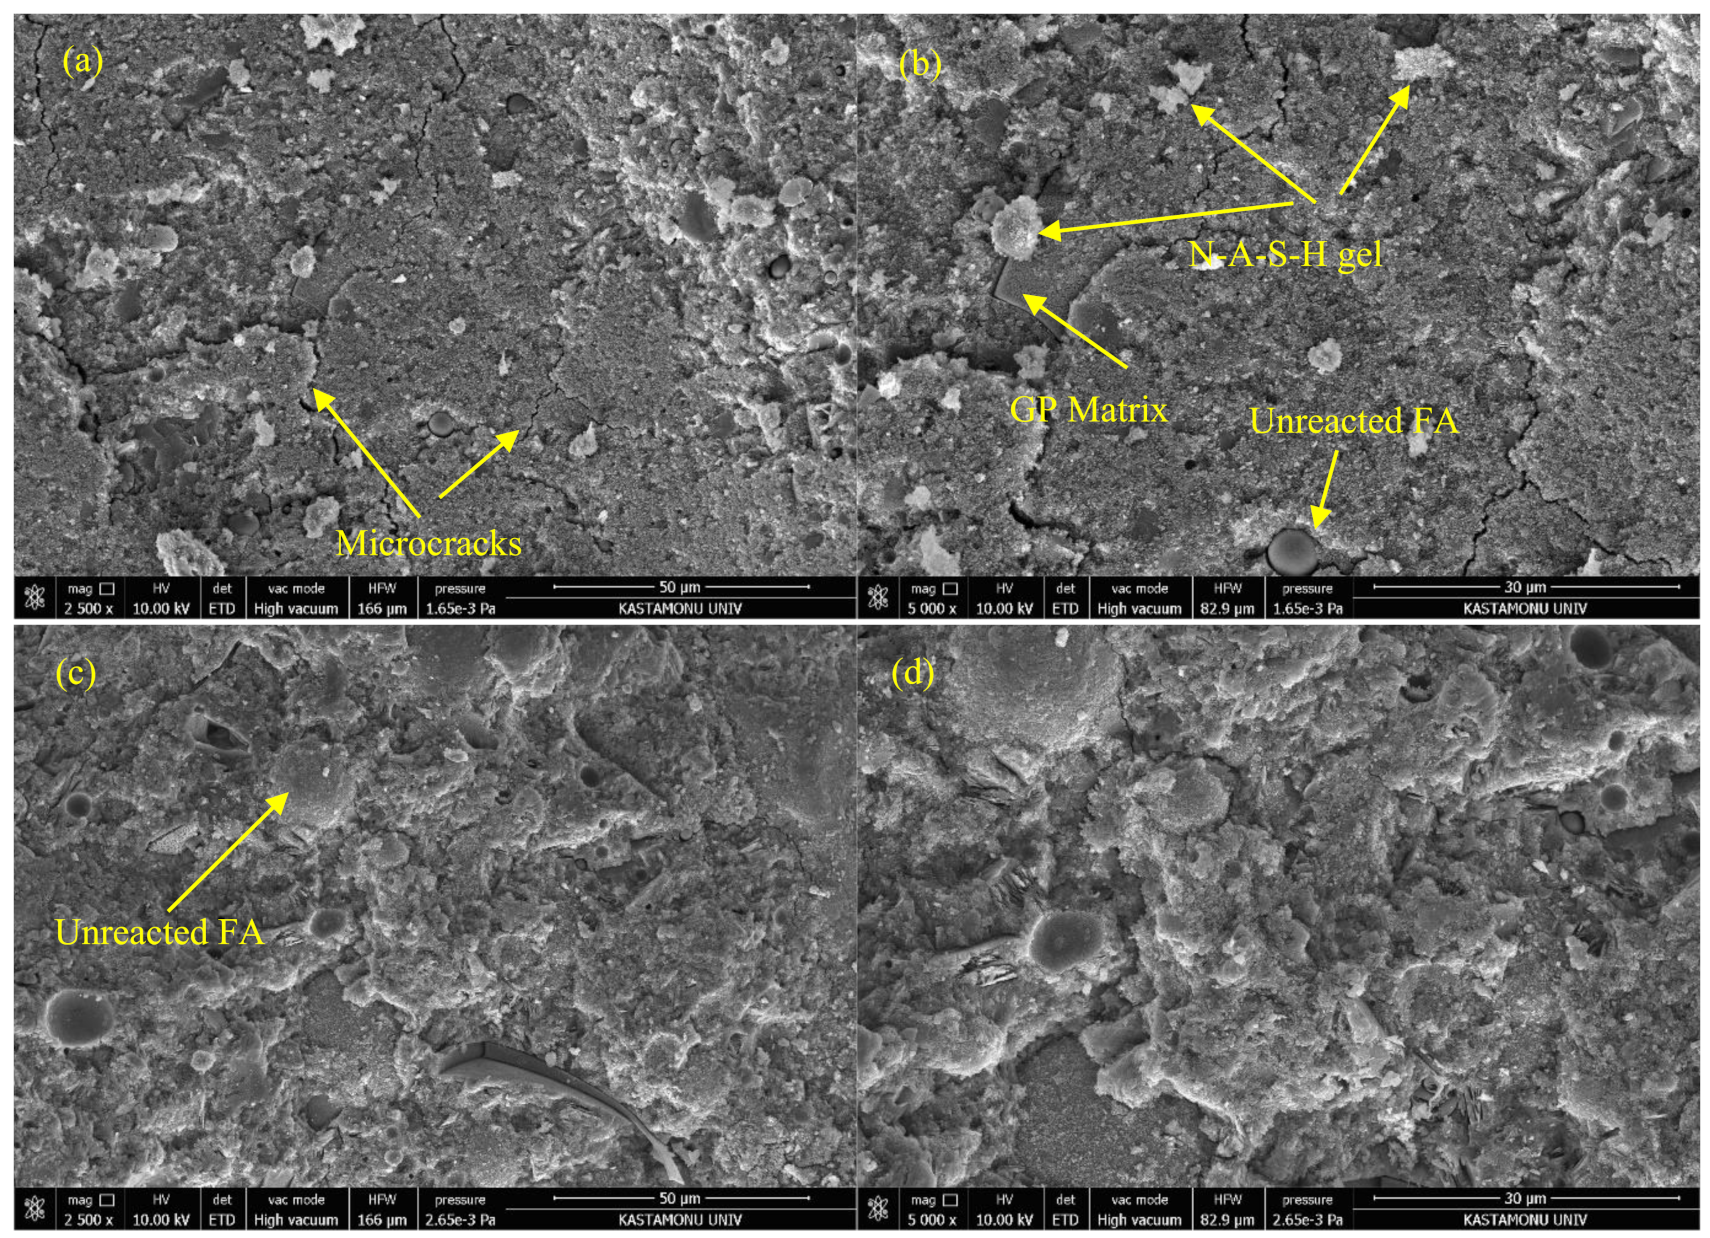
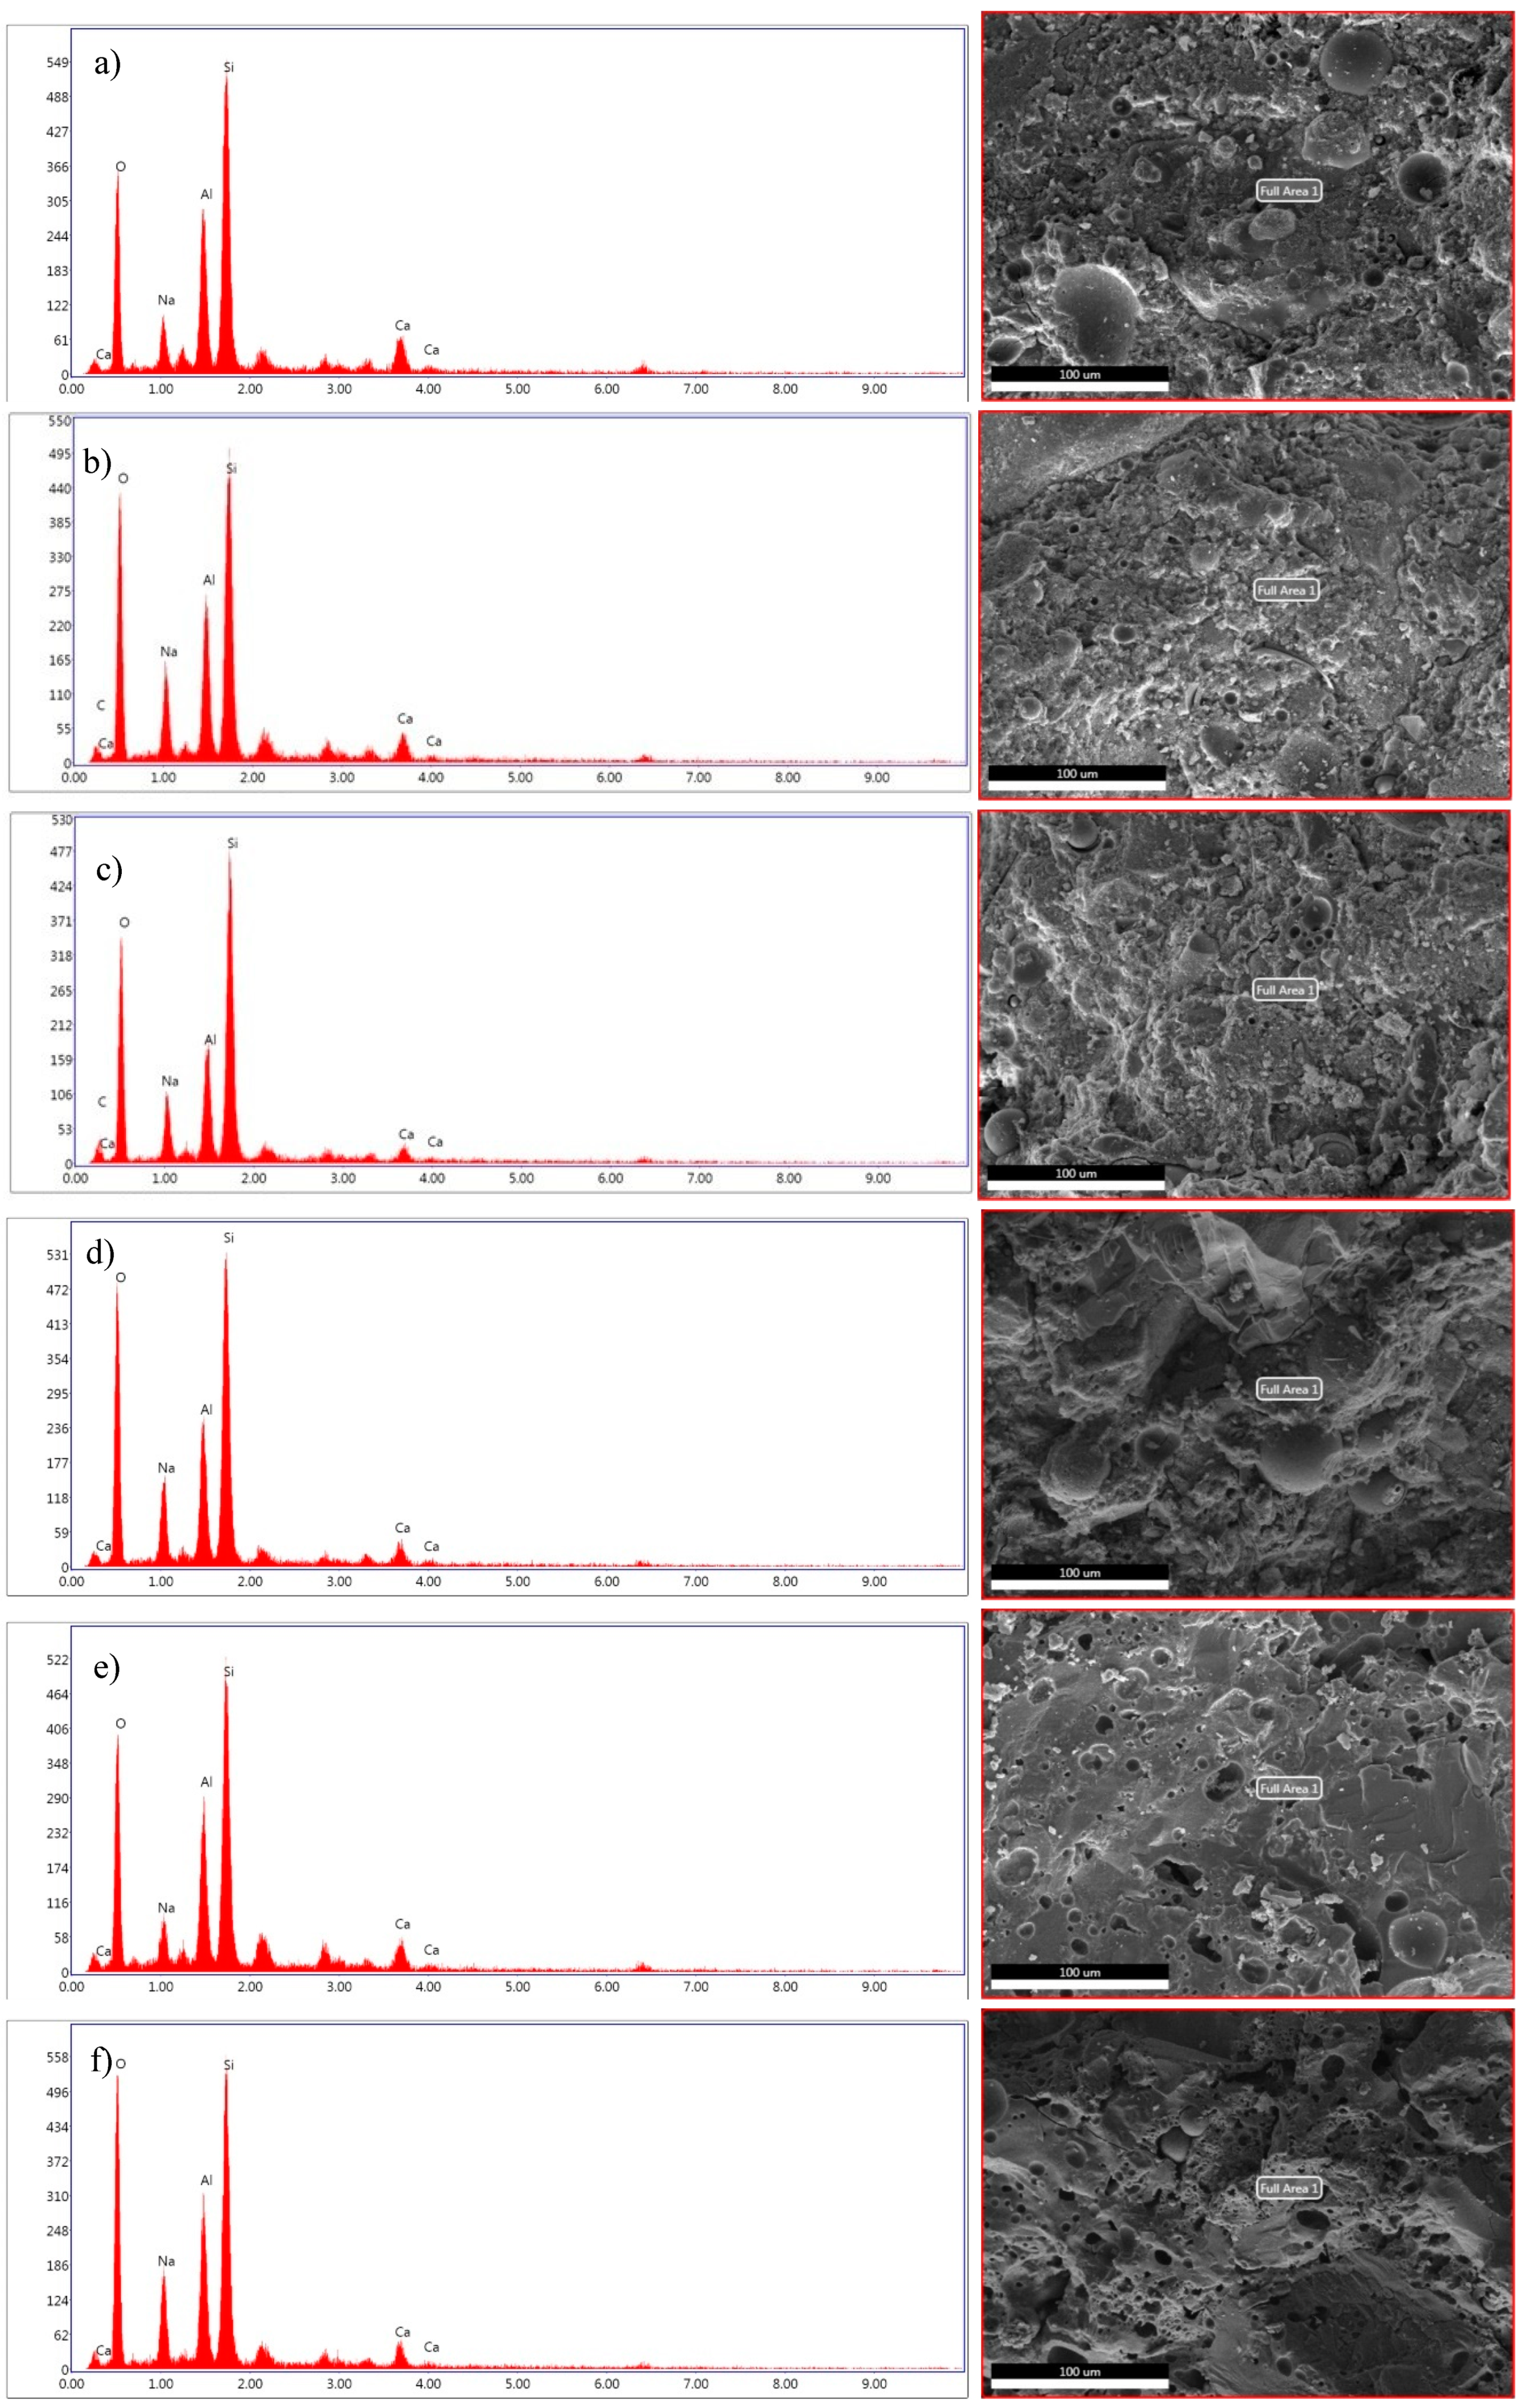
  • After 400 °C, 12 BF samples developed microcracks and became less compact than the 12 BF samples exposed to 200 °C. In addition, the Si/Al ratio of 12 BF samples exposed to 800 °C decreased compared to 12 BF samples exposed to 20 °C. After exposure to 600 °C and 800 °C, the samples’ evaporation rate and water loss rise, resulting in structural deterioration.

Author Contributions

Conceptualization, M.Z., S.E., Y.T., S.K. and R.A.G.L.; methodology, M.Z., S.E., Y.T., S.K.; formal analysis, M.Z., S.E., Y.T., S.K.; investigation, M.Z., S.E., Y.T., S.K.; resources, M.Z., S.E., Y.T., S.K., R.A.G.L.; data curation, M.Z., S.E.; writing—original draft preparation, M.Z., S.E., Y.T., S.K.; writing—review and editing, M.Z., S.E. and R.A.G.L.; visualization, M.Z., S.E., Y.T., S.K., S.E.; supervision, R.A.G.L.; project administration, M.Z., S.E., Y.T., S.K., R.A.G.L.; funding acquisition, R.A.G.L. All authors have read and agreed to the published version of the manuscript.

Funding

The authors wish to thank CEU San Pablo University Foundation for the funds dedicated to the Project Ref. MCP21V12 provided by CEU San Pablo University.

Institutional Review Board Statement

Not applicable.

Informed Consent Statement

Not applicable.

Data Availability Statement

The data presented in this study are available on request from the corresponding author.

Conflicts of Interest

The authors declare no conflict of interest.

References

  1. Benhelal, E.; Zahedi, G.; Shamsaei, E.; Bahadori, A. Global strategies and potentials to curb CO2 emissions in cement industry. J. Clean. Prod. 2013, 51, 142–161. [Google Scholar] [CrossRef]
  2. Wang, J.; Mu, M.; Liu, Y. Recycled cement. Constr. Build. Mater. 2018, 190, 1124–1132. [Google Scholar] [CrossRef]
  3. Ma, C.-K.; Awang, A.Z.; Omar, W. Structural and material performance of geopolymer concrete: A review. Constr. Build. Mater. 2018, 186, 90–102. [Google Scholar] [CrossRef]
  4. Ai, T.; Zhong, D.; Zhang, Y.; Zong, J.; Yan, X.; Niu, Y. The Effect of Red Mud Content on the Compressive Strength of Geopolymers under Different Curing Systems. Buildings 2021, 11, 298. [Google Scholar] [CrossRef]
  5. Hattaf, R.; Aboulayt, A.; Samdi, A.; Lahlou, N.; Touhami, M.O.; Gomina, M.; Moussa, R. Reusing Geopolymer Waste from Matrices Based on Metakaolin or Fly Ash for the Manufacture of New Binder Geopolymeric Matrices. Sustainability 2021, 13, 70. [Google Scholar] [CrossRef]
  6. Nikoloutsopoulos, N.; Sotiropoulou, A.; Kakali, G.; Tsivilis, S. Physical and Mechanical Properties of Fly Ash Based Geopolymer Concrete Compared to Conventional Concrete. Buildings 2021, 11, 178. [Google Scholar] [CrossRef]
  7. Occhicone, A.; Vukčević, M.; Bosković, I.; Ferone, C. Red Mud-Blast Furnace Slag-Based Alkali-Activated Materials. Sustainability 2021, 13, 1298. [Google Scholar] [CrossRef]
  8. Tammam, Y.; Uysal, M.; Canpolat, O. Effects of alternative ecological fillers on the mechanical, durability, and microstructure of fly ash-based geopolymer mortar. Eur. J. Environ. Civ. Eng. 2021, 1–24. [Google Scholar] [CrossRef]
  9. Çelikten, S.; Atabey, İ. The effects of water content and thermal curing time on physical and mechanical properties of waste basalt powder-based geopolymer mortars. Ömer Halisdemir Univ. J. Eng. Sci. 2020, 10, 328–332. [Google Scholar] [CrossRef]
  10. Assaedi, H.; Alomayri, T.; Shaikh, F.U.A.; Low, I.-M. Characterisation of mechanical and thermal properties in flax fabric reinforced geopolymer composites. J. Adv. Ceram. 2015, 4, 272–281. [Google Scholar] [CrossRef] [Green Version]
  11. Shen, D.; Liu, X.; Li, Q.; Sun, L.; Wang, W. Early-age behavior and cracking resistance of high-strength concrete reinforced with Dramix 3D steel fiber. Constr. Build. Mater. 2019, 196, 307–316. [Google Scholar] [CrossRef]
  12. Vairavan, M.; Pandian, A.; Manikandan, V.; Jappes, T.W.; Uthayakumar, M. Effect of fibre length and fibre content on mechanical properties of short basalt fibre reinforced polymer matrix composites. Mater. Phys. Mech. 2013, 16, 107–117. [Google Scholar]
  13. Zhang, P.; Gao, Z.; Wang, J.; Wang, K. Numerical modeling of rebar-matrix bond behaviors of nano-SiO2 and PVA fiber reinforced geopolymer composites. Ceram. Int. 2021, 47, 11727–11737. [Google Scholar] [CrossRef]
  14. Zhang, P.; Wang, K.; Wang, J.; Guo, J.; Hu, S.; Ling, Y. Mechanical properties and prediction of fracture parameters of geopolymer/alkali-activated mortar modified with PVA fiber and nano-SiO2. Ceram. Int. 2020, 46, 20027–20037. [Google Scholar] [CrossRef]
  15. Zhang, P.; Wang, K.; Wang, J.; Guo, J.; Ling, Y. Macroscopic and microscopic analyses on mechanical performance of metakaolin/fly ash based geopolymer mortar. J. Clean. Prod. 2021, 294, 126193. [Google Scholar] [CrossRef]
  16. Zhang, P.; Zheng, Y.; Wang, K.; Zhang, J. A review on properties of fresh and hardened geopolymer mortar. Compos. Part B Eng. 2018, 152, 79–95. [Google Scholar] [CrossRef]
  17. Fiore, V.; Scalici, T.; Di Bella, G.; Valenza, A. A review on basalt fibre and its composites. Compos. Part B Eng. 2015, 74, 74–94. [Google Scholar] [CrossRef]
  18. Girgin, Z.C.; Yıldırım, M.T. Usability of basalt fibres in fibre reinforced cement composites. Mater. Struct. 2016, 49, 3309–3319. [Google Scholar] [CrossRef]
  19. Du, Q.; Cai, C.; Lv, J.; Wu, J.; Pan, T.; Zhou, J. Experimental Investigation on the Mechanical Properties and Microstructure of Basalt Fiber Reinforced Engineered Cementitious Composite. Materials 2020, 13, 3796. [Google Scholar] [CrossRef] [PubMed]
  20. Girgin, Z.C. Effect of slag, nano clay and metakaolin on mechanical performance of basalt fibre cementitious composites. Constr. Build. Mater. 2018, 192, 70–84. [Google Scholar] [CrossRef]
  21. Sadrmomtazi, A.; Tahmouresi, B.; Saradar, A. Effects of silica fume on mechanical strength and microstructure of basalt fiber reinforced cementitious composites (BFRCC). Constr. Build. Mater. 2018, 162, 321–333. [Google Scholar] [CrossRef]
  22. Wang, Z.; Yu, Q.; Ao, Q.; Du, Q. Mechanical properties of engineered cementitious composite containing basalt fibre. FEB Fresenius Environ. Bull. 2020, 29, 1997. [Google Scholar]
  23. Zhang, N.; Zhou, J.; Ma, G.-W. Dynamic properties of strain-hardening cementitious composite reinforced with basalt and steel fibers. Int. J. Concr. Struct. Mater. 2020, 14, 44. [Google Scholar] [CrossRef]
  24. Ali, N.; Canpolat, O.; Aygörmez, Y.; Al-Mashhadani, M.M. Evaluation of the 12–24 mm basalt fibers and boron waste on reinforced metakaolin-based geopolymer. Constr. Build. Mater. 2020, 251, 118976. [Google Scholar] [CrossRef]
  25. Görhan, G.; Aslaner, R.; Şinik, O. The effect of curing on the properties of metakaolin and fly ash-based geopolymer paste. Compos. Part B Eng. 2016, 97, 329–335. [Google Scholar] [CrossRef]
  26. Rill, E.; Lowry, D.; Kriven, W. Properties of Basalt Fiber Reinforced Geopolymer Composites. In Strategic Materials and Computational Design: Ceramic Engineering and Science Proceedings; The American Ceramic Society: Westerville, OH, USA, 2010; pp. 57–67. [Google Scholar]
  27. Binici, H.; Aksogan, O. Durability of concrete made with natural granular granite, silica sand and powders of waste marble and basalt as fine aggregate. J. Build. Eng. 2018, 19, 109–121. [Google Scholar] [CrossRef]
  28. Özkan, Ş.; Çoban, Ö. The hybrid effects of basalt and PVA fiber on properties of a cementitious composite: Physical properties and non-destructive tests. Constr. Build. Mater. 2021, 312, 125292. [Google Scholar] [CrossRef]
  29. Kim, D.J.; Wille, K.; El-Tawil, S.; Naaman, A.E. Testing of cementitious materials under high-strain-rate tensile loading using elastic strain energy. J. Eng. Mech. 2011, 137, 268–275. [Google Scholar] [CrossRef]
  30. Ma, Y.; Zhu, B.; Tan, M. Properties of ceramic fiber reinforced cement composites. Cem. Concr. Res. 2005, 35, 296–300. [Google Scholar] [CrossRef]
  31. Wang, Y.; Hughes, P.; Niu, H.; Fan, Y. A new method to improve the properties of recycled aggregate concrete: Composite addition of basalt fiber and nano-silica. J. Clean. Prod. 2019, 236, 117602. [Google Scholar] [CrossRef]
  32. Şahin, F.; Uysal, M.; Canpolat, O.; Aygörmez, Y.; Cosgun, T.; Dehghanpour, H. Effect of basalt fiber on metakaolin-based geopolymer mortars containing rilem, basalt and recycled waste concrete aggregates. Constr. Build. Mater. 2021, 301, 124113. [Google Scholar] [CrossRef]
  33. He, P.; Jia, D.; Lin, T.; Wang, M.; Zhou, Y. Effects of high-temperature heat treatment on the mechanical properties of unidirectional carbon fiber reinforced geopolymer composites. Ceram. Int. 2010, 36, 1447–1453. [Google Scholar] [CrossRef]
  34. Kong, D.L.Y.; Sanjayan, J.G.; Sagoe-Crentsil, K. Comparative performance of geopolymers made with metakaolin and fly ash after exposure to elevated temperatures. Cem. Concr. Res. 2007, 37, 1583–1589. [Google Scholar] [CrossRef]
  35. Arslan, A.A.; Uysal, M.; Yılmaz, A.; Al-mashhadani, M.M.; Canpolat, O.; Şahin, F.; Aygörmez, Y. Influence of wetting-drying curing system on the performance of fiber reinforced metakaolin-based geopolymer composites. Constr. Build. Mater. 2019, 225, 909–926. [Google Scholar] [CrossRef]
  36. Aygörmez, Y.; Canpolat, O.; Al-mashhadani, M.M.; Uysal, M. Elevated temperature, freezing-thawing and wetting-drying effects on polypropylene fiber reinforced metakaolin based geopolymer composites. Constr. Build. Mater. 2020, 235, 117502. [Google Scholar] [CrossRef]
  37. Zhang, H.Y.; Kodur, V.; Wu, B.; Cao, L.; Qi, S.L. Comparative thermal and mechanical performance of geopolymers derived from metakaolin and fly ash. J. Mater. Civ. Eng. 2016, 28, 04015092. [Google Scholar] [CrossRef]
  38. Jiang, X.; Xiao, R.; Zhang, M.; Hu, W.; Bai, Y.; Huang, B. A laboratory investigation of steel to fly ash-based geopolymer paste bonding behavior after exposure to elevated temperatures. Constr. Build. Mater. 2020, 254, 119267. [Google Scholar] [CrossRef]
  39. Topçu, İ.B.; Karakurt, C. Properties of reinforced concrete steel rebars exposed to high temperatures. Res. Lett. Mater. Sci. 2008, 2008, 814137. [Google Scholar] [CrossRef] [Green Version]
  40. Singh, H.; Gupta, R. Cellulose fiber as bacteria-carrier in mortar: Self-healing quantification using UPV. J. Build. Eng. 2019, 28, 101090. [Google Scholar] [CrossRef]
  41. Celik, A.; Yilmaz, K.; Canpolat, O.; Al-mashhadani, M.M.; Aygörmez, Y.; Uysal, M. High-temperature behavior and mechanical characteristics of boron waste additive metakaolin based geopolymer composites reinforced with synthetic fibers. Constr. Build. Mater. 2018, 187, 1190–1203. [Google Scholar] [CrossRef]
  42. Xu, J.; Kang, A.; Wu, Z.; Xiao, P.; Gong, Y. Effect of high-calcium basalt fiber on the workability, mechanical properties and microstructure of slag-fly ash geopolymer grouting material. Constr. Build. Mater. 2021, 302, 124089. [Google Scholar] [CrossRef]
  43. Temuujin, J.; Minjigmaa, A.; Rickard, W.; Lee, M.; Williams, I.; Van Riessen, A. Fly ash based geopolymer thin coatings on metal substrates and its thermal evaluation. J. Hazard. Mater. 2010, 180, 748–752. [Google Scholar] [CrossRef] [PubMed]
  44. Zhang, Y.; Li, S.; Wang, Y.; Xu, D. Microstructural and strength evolutions of geopolymer composite reinforced by resin exposed to elevated temperature. J. Non-Cryst. Solids 2012, 358, 620–624. [Google Scholar] [CrossRef]
  45. Abdulkareem, O.A.; Mustafa Al Bakri, A.M.; Kamarudin, H.; Khairul Nizar, I.; Saif, A.A. Effects of elevated temperatures on the thermal behavior and mechanical performance of fly ash geopolymer paste, mortar and lightweight concrete. Constr. Build. Mater. 2014, 50, 377–387. [Google Scholar] [CrossRef]
Figure 1. The materials used in geopolymer mortars: (a) Fly ash; (b) slag; (c) basalt powder; and (d) basalt fiber.
Sustainability 13 12610 g001
Figure 2. Crack images of 12 BF specimens subjected to flexural strength test magnified at (a) 4×; (b) 40×.
Sustainability 13 12610 g002
Figure 3. (a) Charpy impact test procedure; (b) Samples exposed to Charpy impact test.
Sustainability 13 12610 g003
Figure 4. The relationship between the compressive strength and the content of BF in geopolymer series.
Sustainability 13 12610 g004
Figure 5. The relationship between the flexural strength and the content of BF in geopolymer series.
Sustainability 13 12610 g005
Figure 6. The relationship between the UPV and the content of BF in geopolymer series.
Sustainability 13 12610 g006
Figure 7. The increases of Charpy impact test values of fly ash-based geopolymers.
Sustainability 13 12610 g007
Figure 8. The amount of water absorbed per m2 of fly ash-based geopolymer mortar samples contained BF with different ratios.
Sustainability 13 12610 g008
Figure 9. Fly ash-based geopolymer mortar samples’ capillary water absorption coefficient (Kc) contained BF with different ratios.
Sustainability 13 12610 g009
Figure 10. The weight loss percentages of fly ash-based geopolymer samples exposed to high temperatures.
Sustainability 13 12610 g010
Figure 11. The effect of high temperature on compressive strength of BF contained fly ash-based geopolymer.
Sustainability 13 12610 g011
Figure 12. The effect of high temperature on flexural strength of BF contained fly ash-based geopolymer.
Sustainability 13 12610 g012
Figure 13. The effect of high temperature on UPV of BF contained fly ash-based geopolymer.
Sustainability 13 12610 g013
Figure 14. The damage degree of fly ash-based geopolymer samples exposed to high temperature.
Sustainability 13 12610 g014
Figure 15. Fly ash-based geopolymer samples exposed to various temperature effect (a) 0 BF; (b) 4 BF; (c) 8 BF and (d) 12 BF.
Sustainability 13 12610 g015
Figure 16. 40x magnified microscope images of 12 BF samples exposed to high-temperature effects (a) 200 °C; (b) 400 °C; (c) 600 °C; (d) 800 °C.
Sustainability 13 12610 g016
Figure 17. 2500 and 5000 times magnified SEM images of 0 BF sample (a,b) and 12 BF sample (c,d).
Sustainability 13 12610 g017
Figure 18. 2500 and 5000 times magnified SEM images of 12 BF sample exposed to 200 °C (a,b); 400 °C (c,d); 600 °C (e,f) and 800 °C (g,h).
Sustainability 13 12610 g018
Figure 19. EDS traces of (a) 20 °C exposed 0 BF sample; (b) 20 °C exposed 12 BF sample; (c) 200 °C exposed 12 BF sample; (d) 400 °C exposed 12 BF sample; (e) 600 °C exposed 12 BF sample and (f) 800 °C exposed 12 BF sample.
Sustainability 13 12610 g019
Table 1. The physical and chemical properties of FA, S, and BP materials.
MaterialsSiO₂Al₂O₃Fe₂O₃TiO₂CaOMnOMgOK₂ONa₂OSO₃Cl-Loss of IgnitionSpecific GravityBlaine (cm2/g)
FA (%)54.0826.086.681-2.002-2.676-0.790.7350.0921.361.982571
BP (%)56.917.68.10.98.150.12.11.93.8---2.766285
S (%)40.5512.831.1-35.58-5.87-0.790.180.01430.032.92612
Table 2. The chemical properties of SS (wt. %).
Na₂O (%) SiO₂ (%) Density (20 °C) (g/mL) Fe (%)Heavy Metals Value (pb) %
9.68 26.12 1.367<0.005 <0.005
Table 3. The chemical properties of SH (%).
NaOH (g/kg)Na₂CO₃ (g/kg)SO4FeClAl
≥990≤4≤0.01≤0.002≤0.01≤0.002
Table 4. Basalt fiber properties.
Diameter (mm)Length (mm)Elasticity Module (GPa)Nominal tensile Strength (MPa)Specific Gravity
0.02128841002.73
Table 5. Mix design of fly ash-based geopolymer mortar series (kg/m3).
SeriesFASlagSSSHBPBF (Volume %)
0 BF550712611281100-
4 BF 5507126112811004
8 BF5507126112811008
12 BF5507126112811001.2
Publisher’s Note: MDPI stays neutral with regard to jurisdictional claims in published maps and institutional affiliations.

