Environmental Impact and Levelised Cost of Energy Analysis of Solar Photovoltaic Systems in Selected Asia Pacific Region: A Cradle-to-Grave Approach

 ,
,
Abstract
:1. Introduction
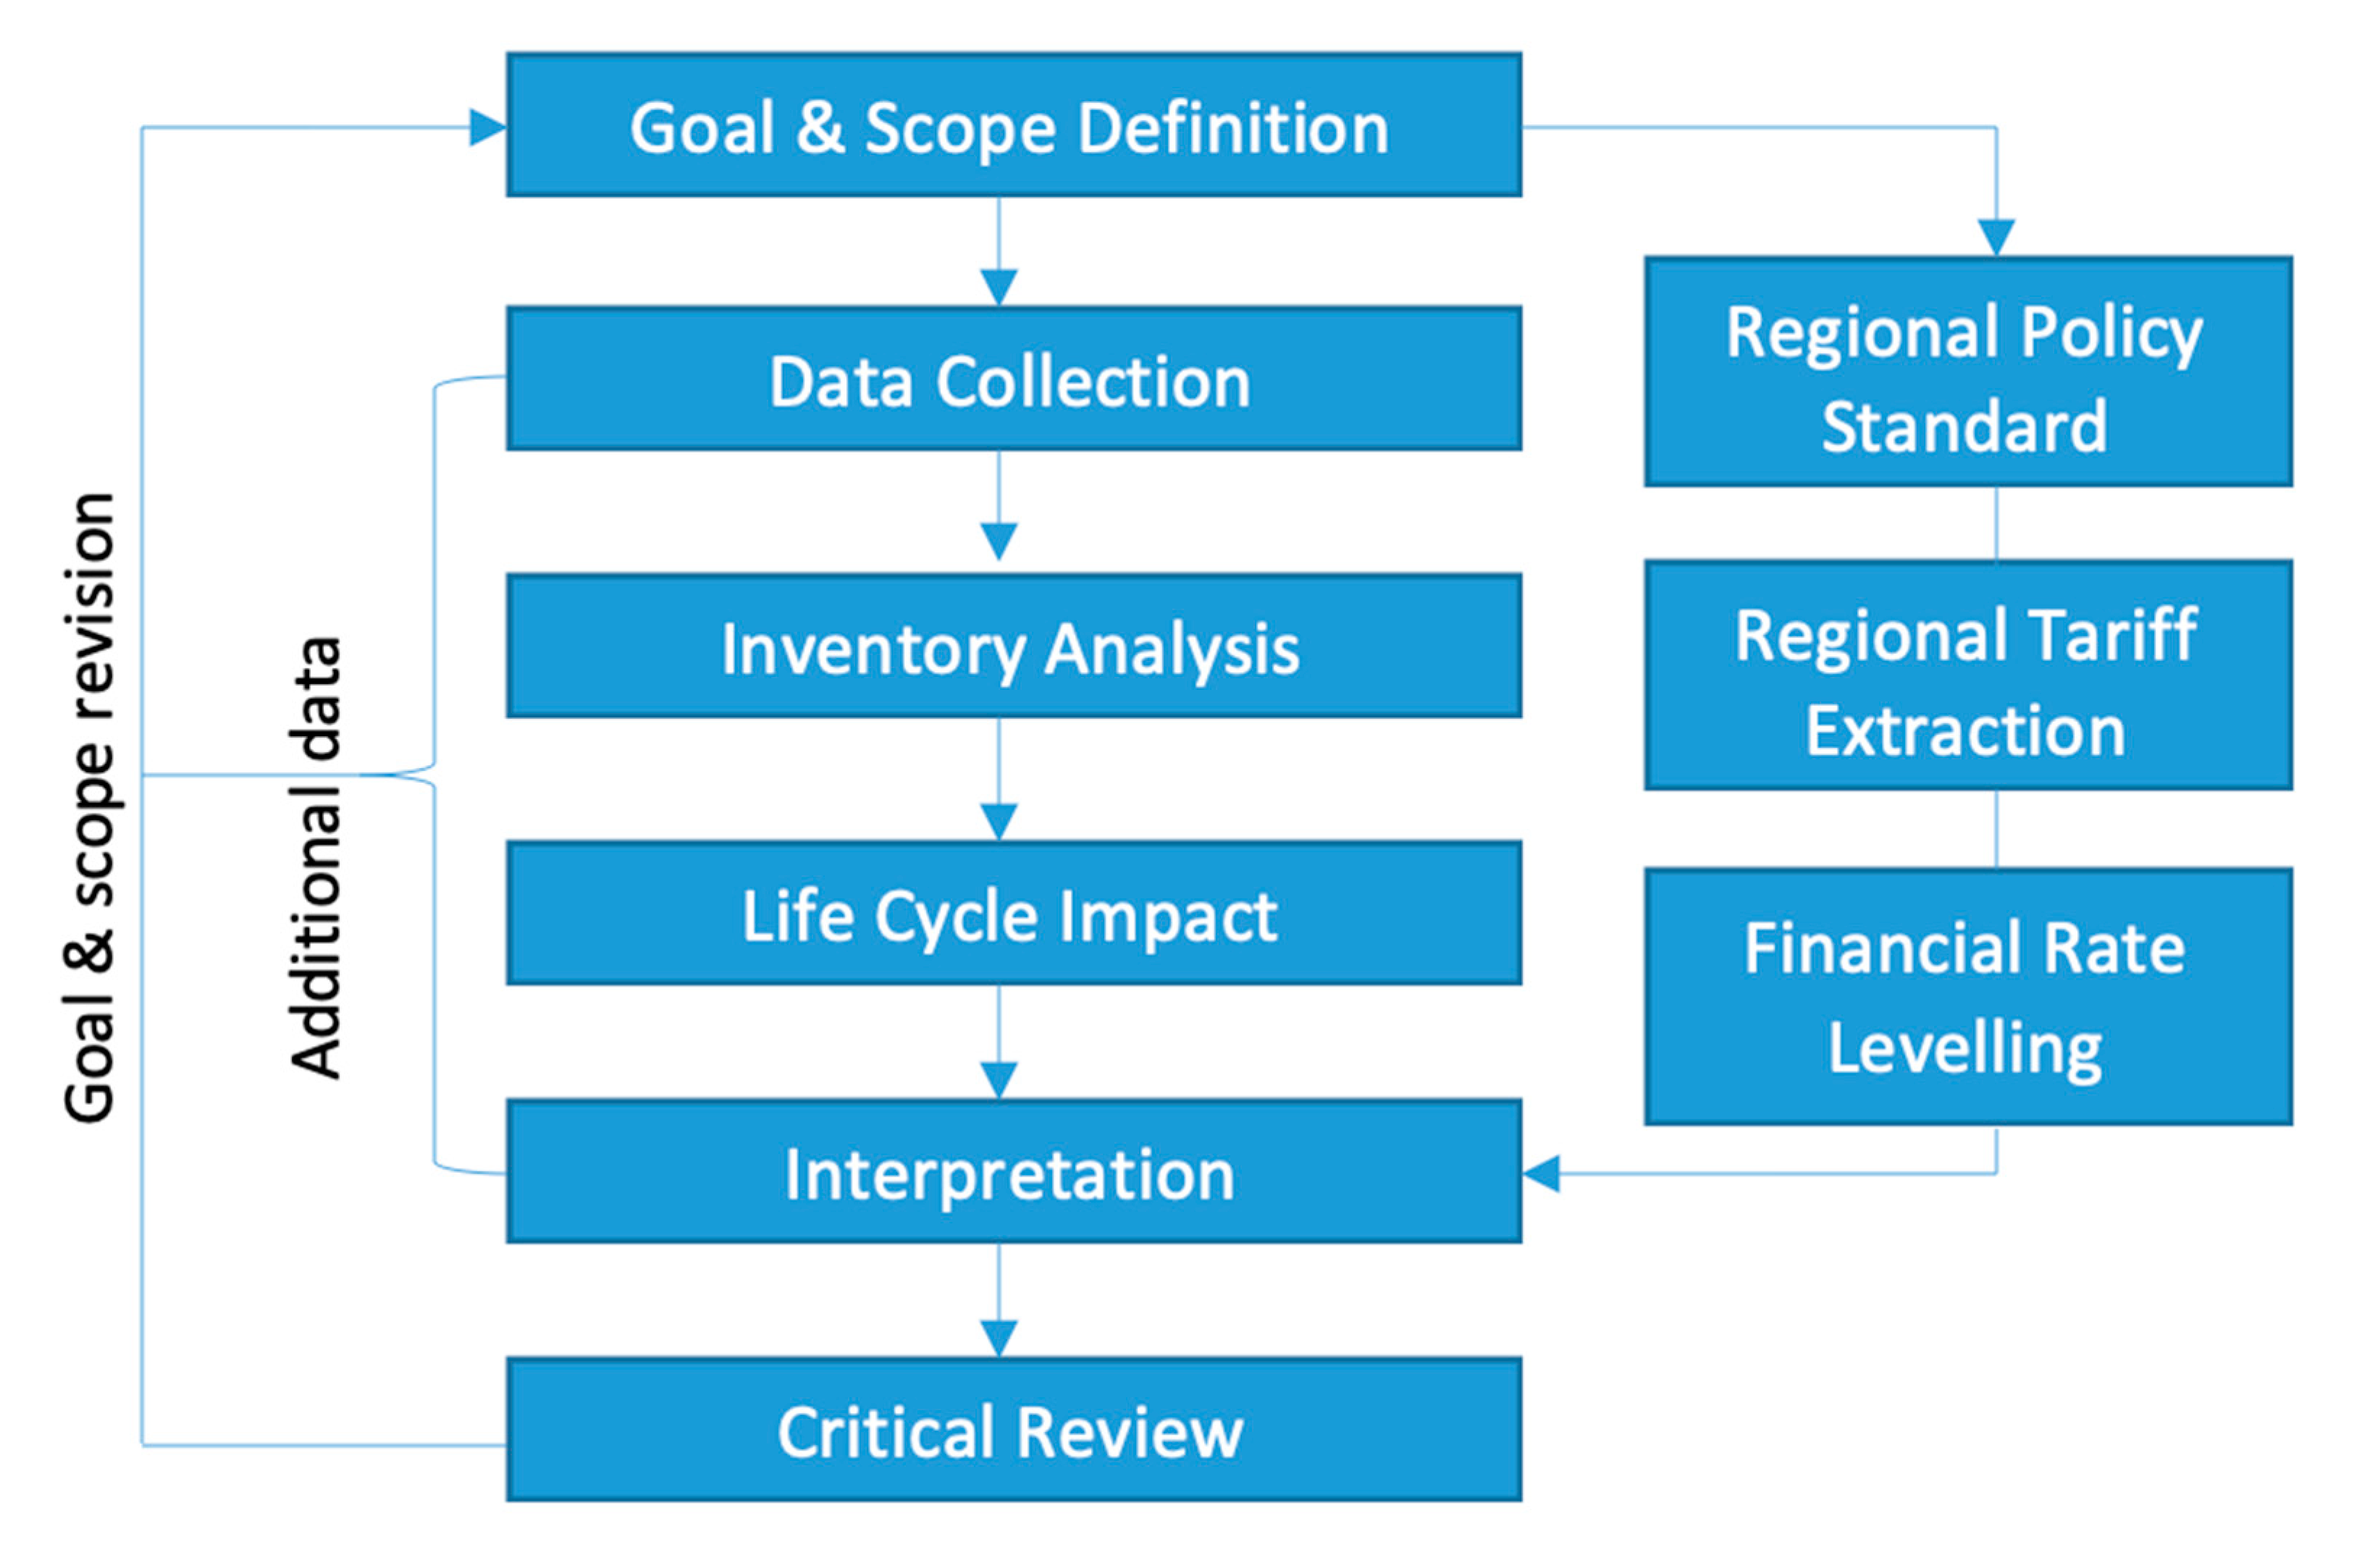
2. Methodology
- (a)
- Energy and emission impact analysis
- (b)
- Economic fluctuation impact analysis
Selected Case Studies
- i.
- A two-year matured system;
- ii.
- Location in Asian countries with a tropical climate;
- iii.
- Commercial system owned by an individual or single company;
- iv.
- The use of a crystalline-based (monocrystalline/polycrystalline) or amorphous PV system only.
3. Results and Discussion
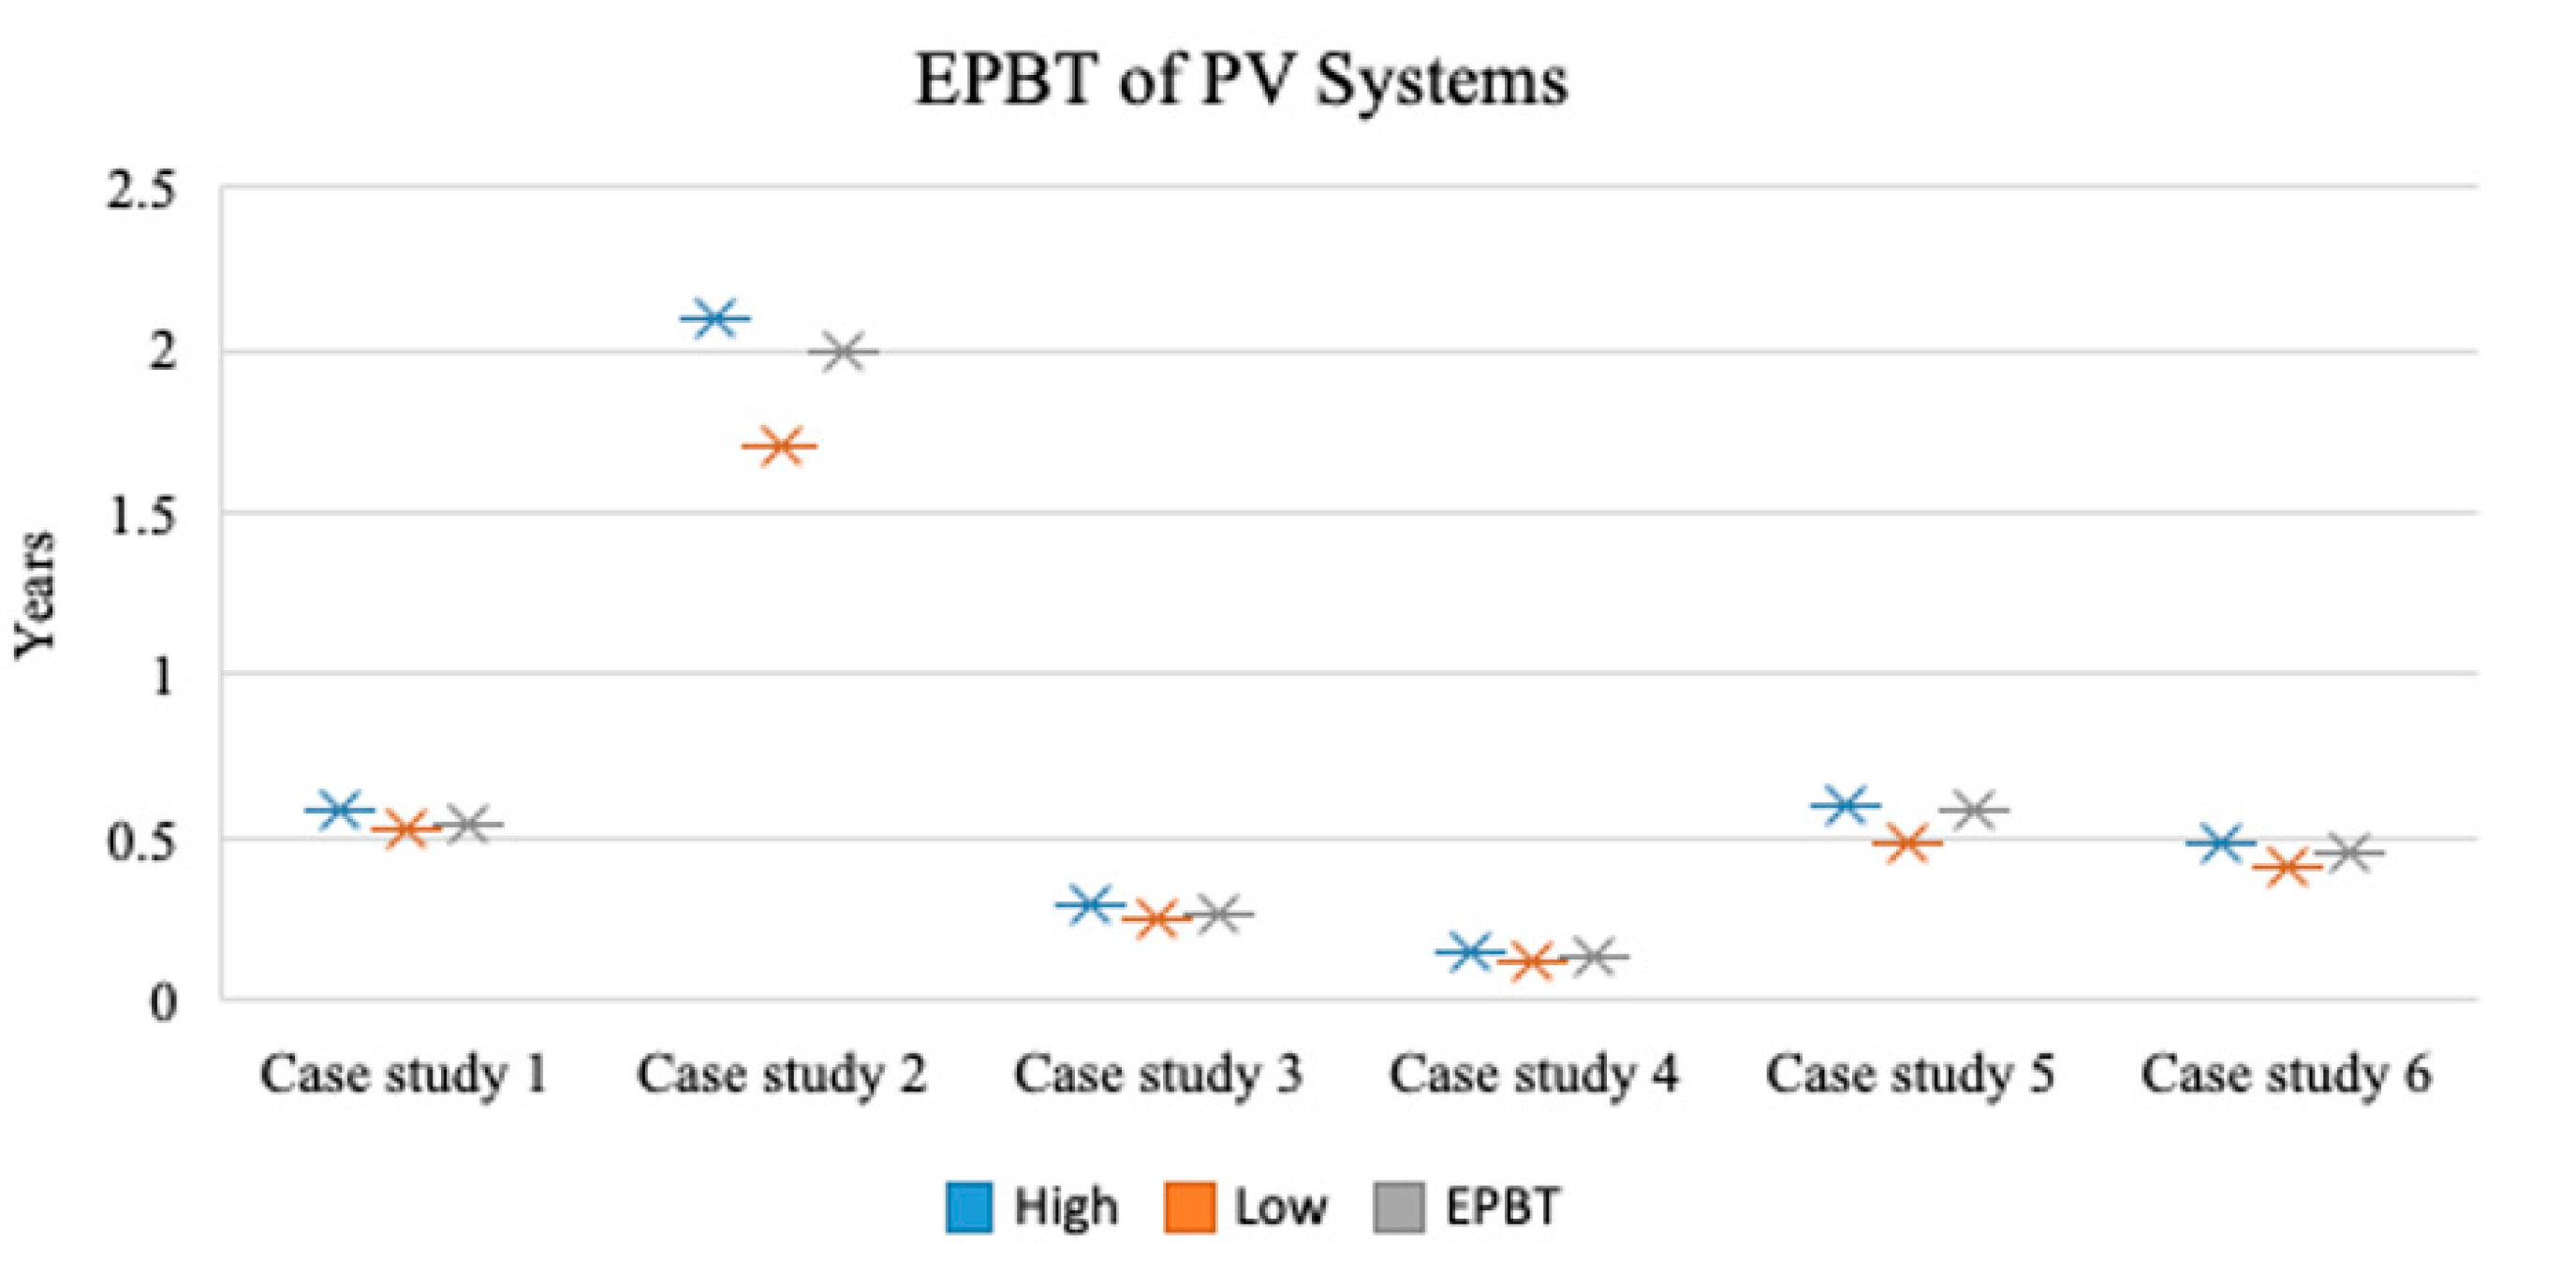
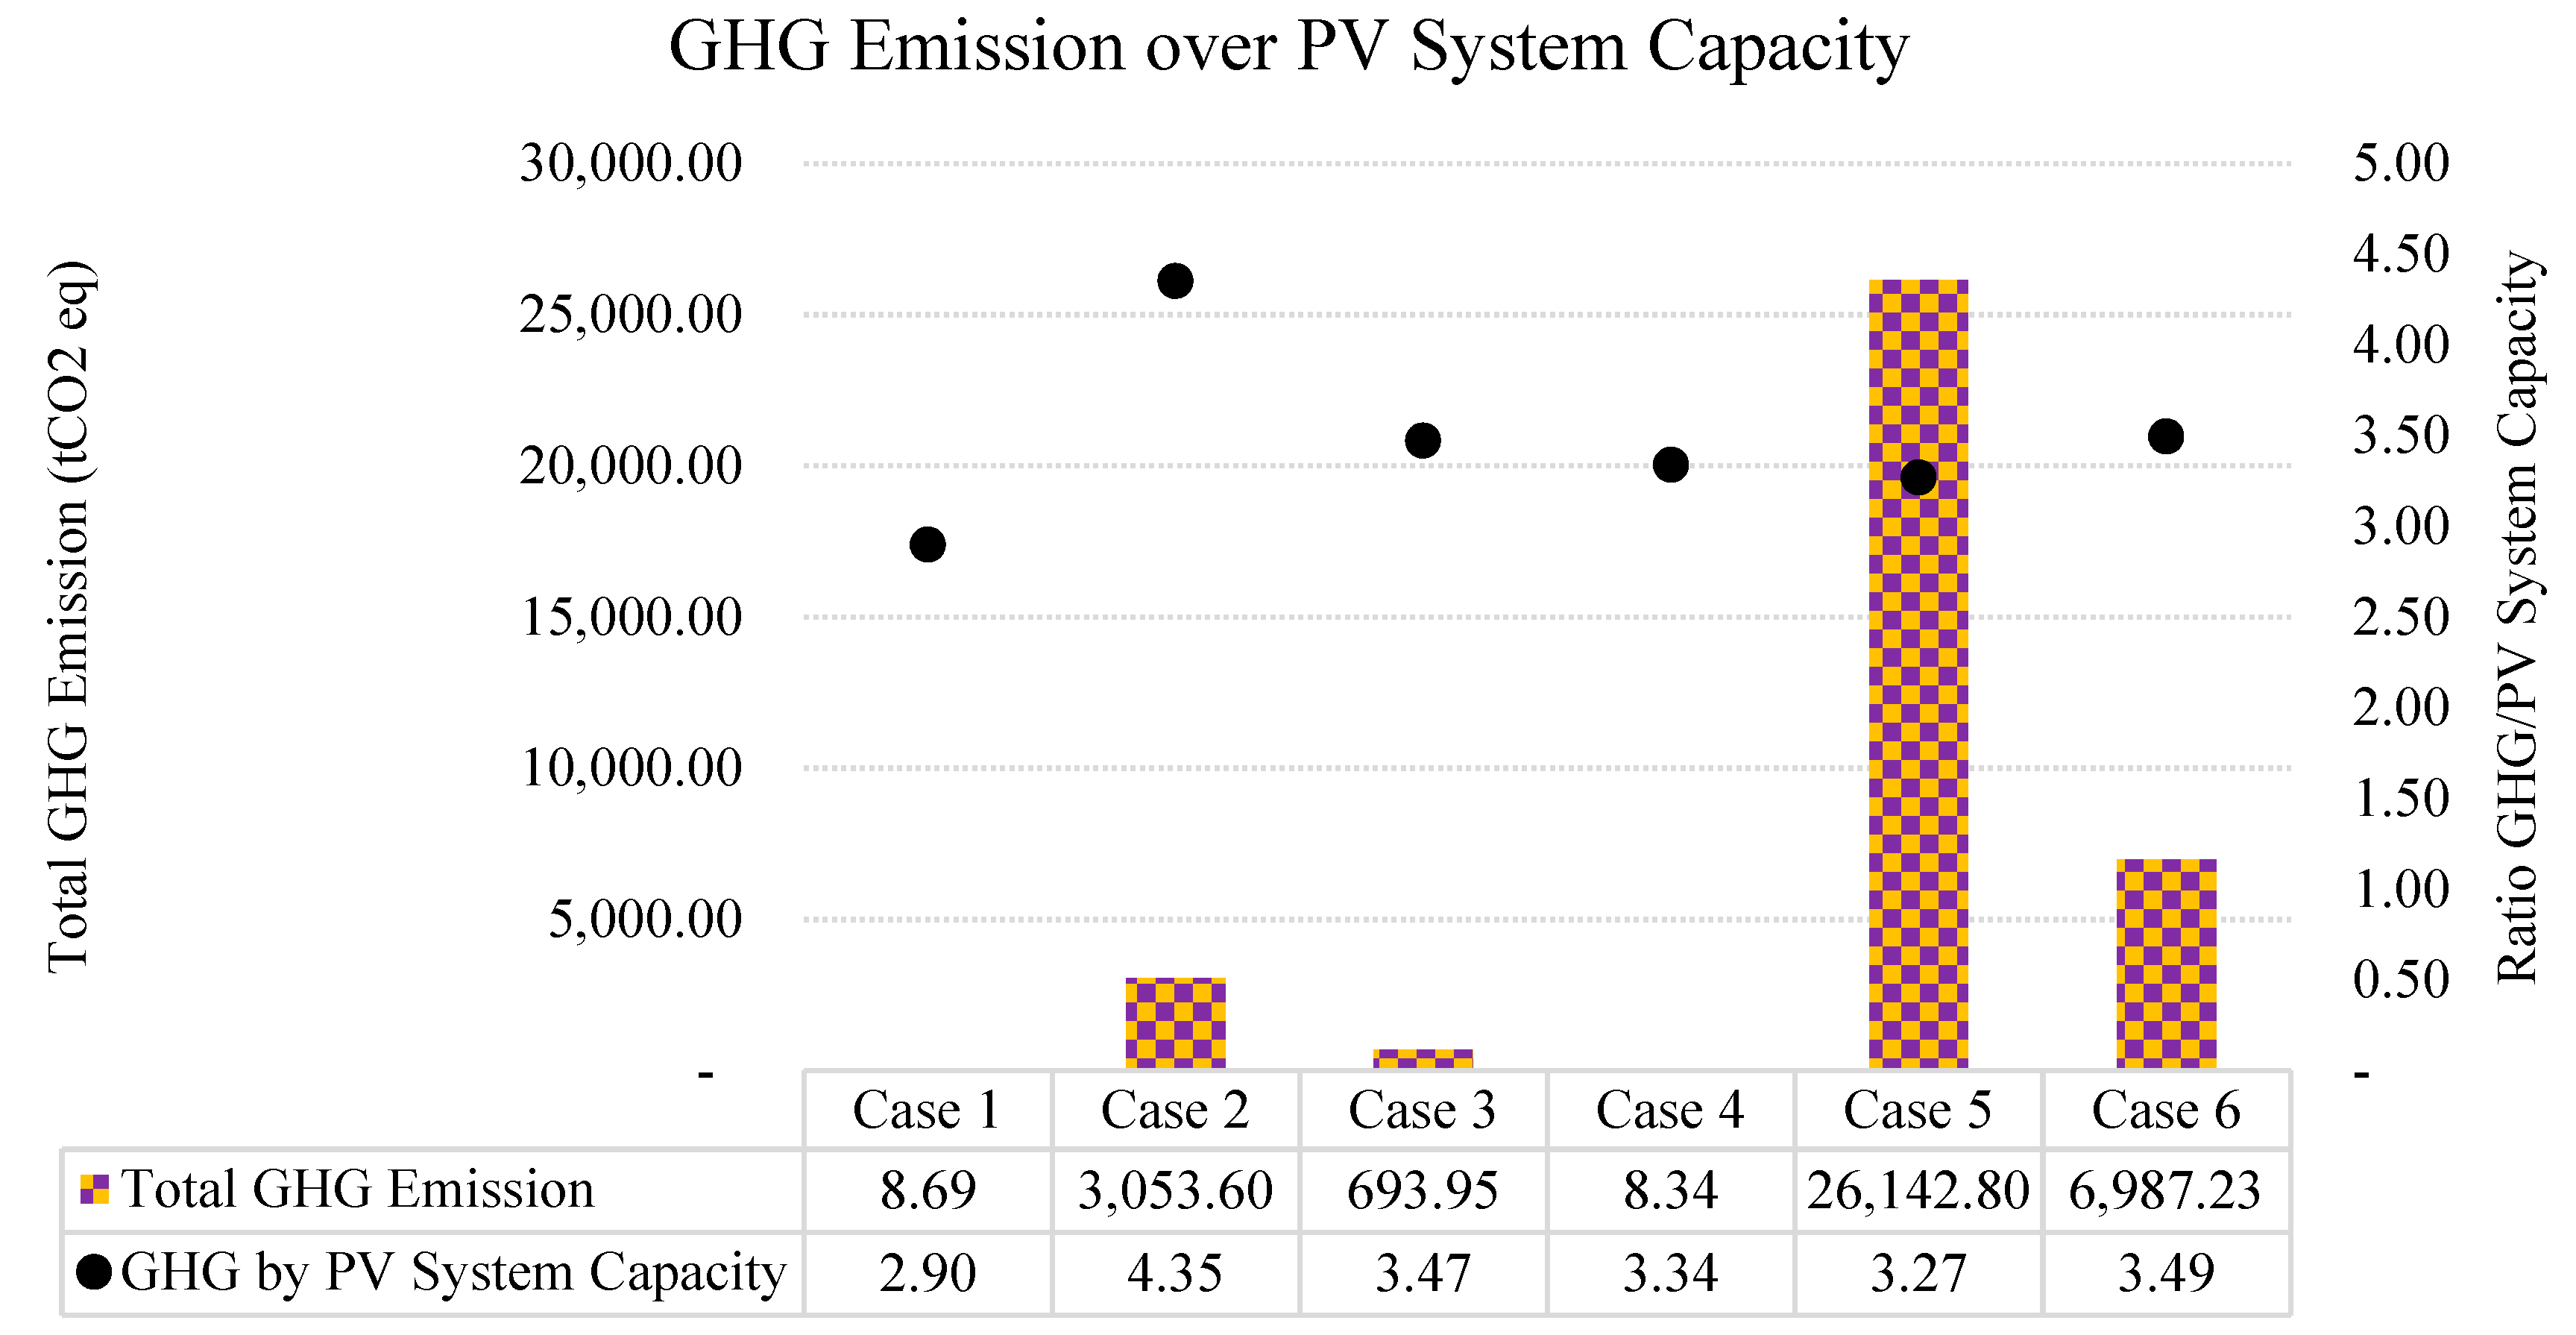
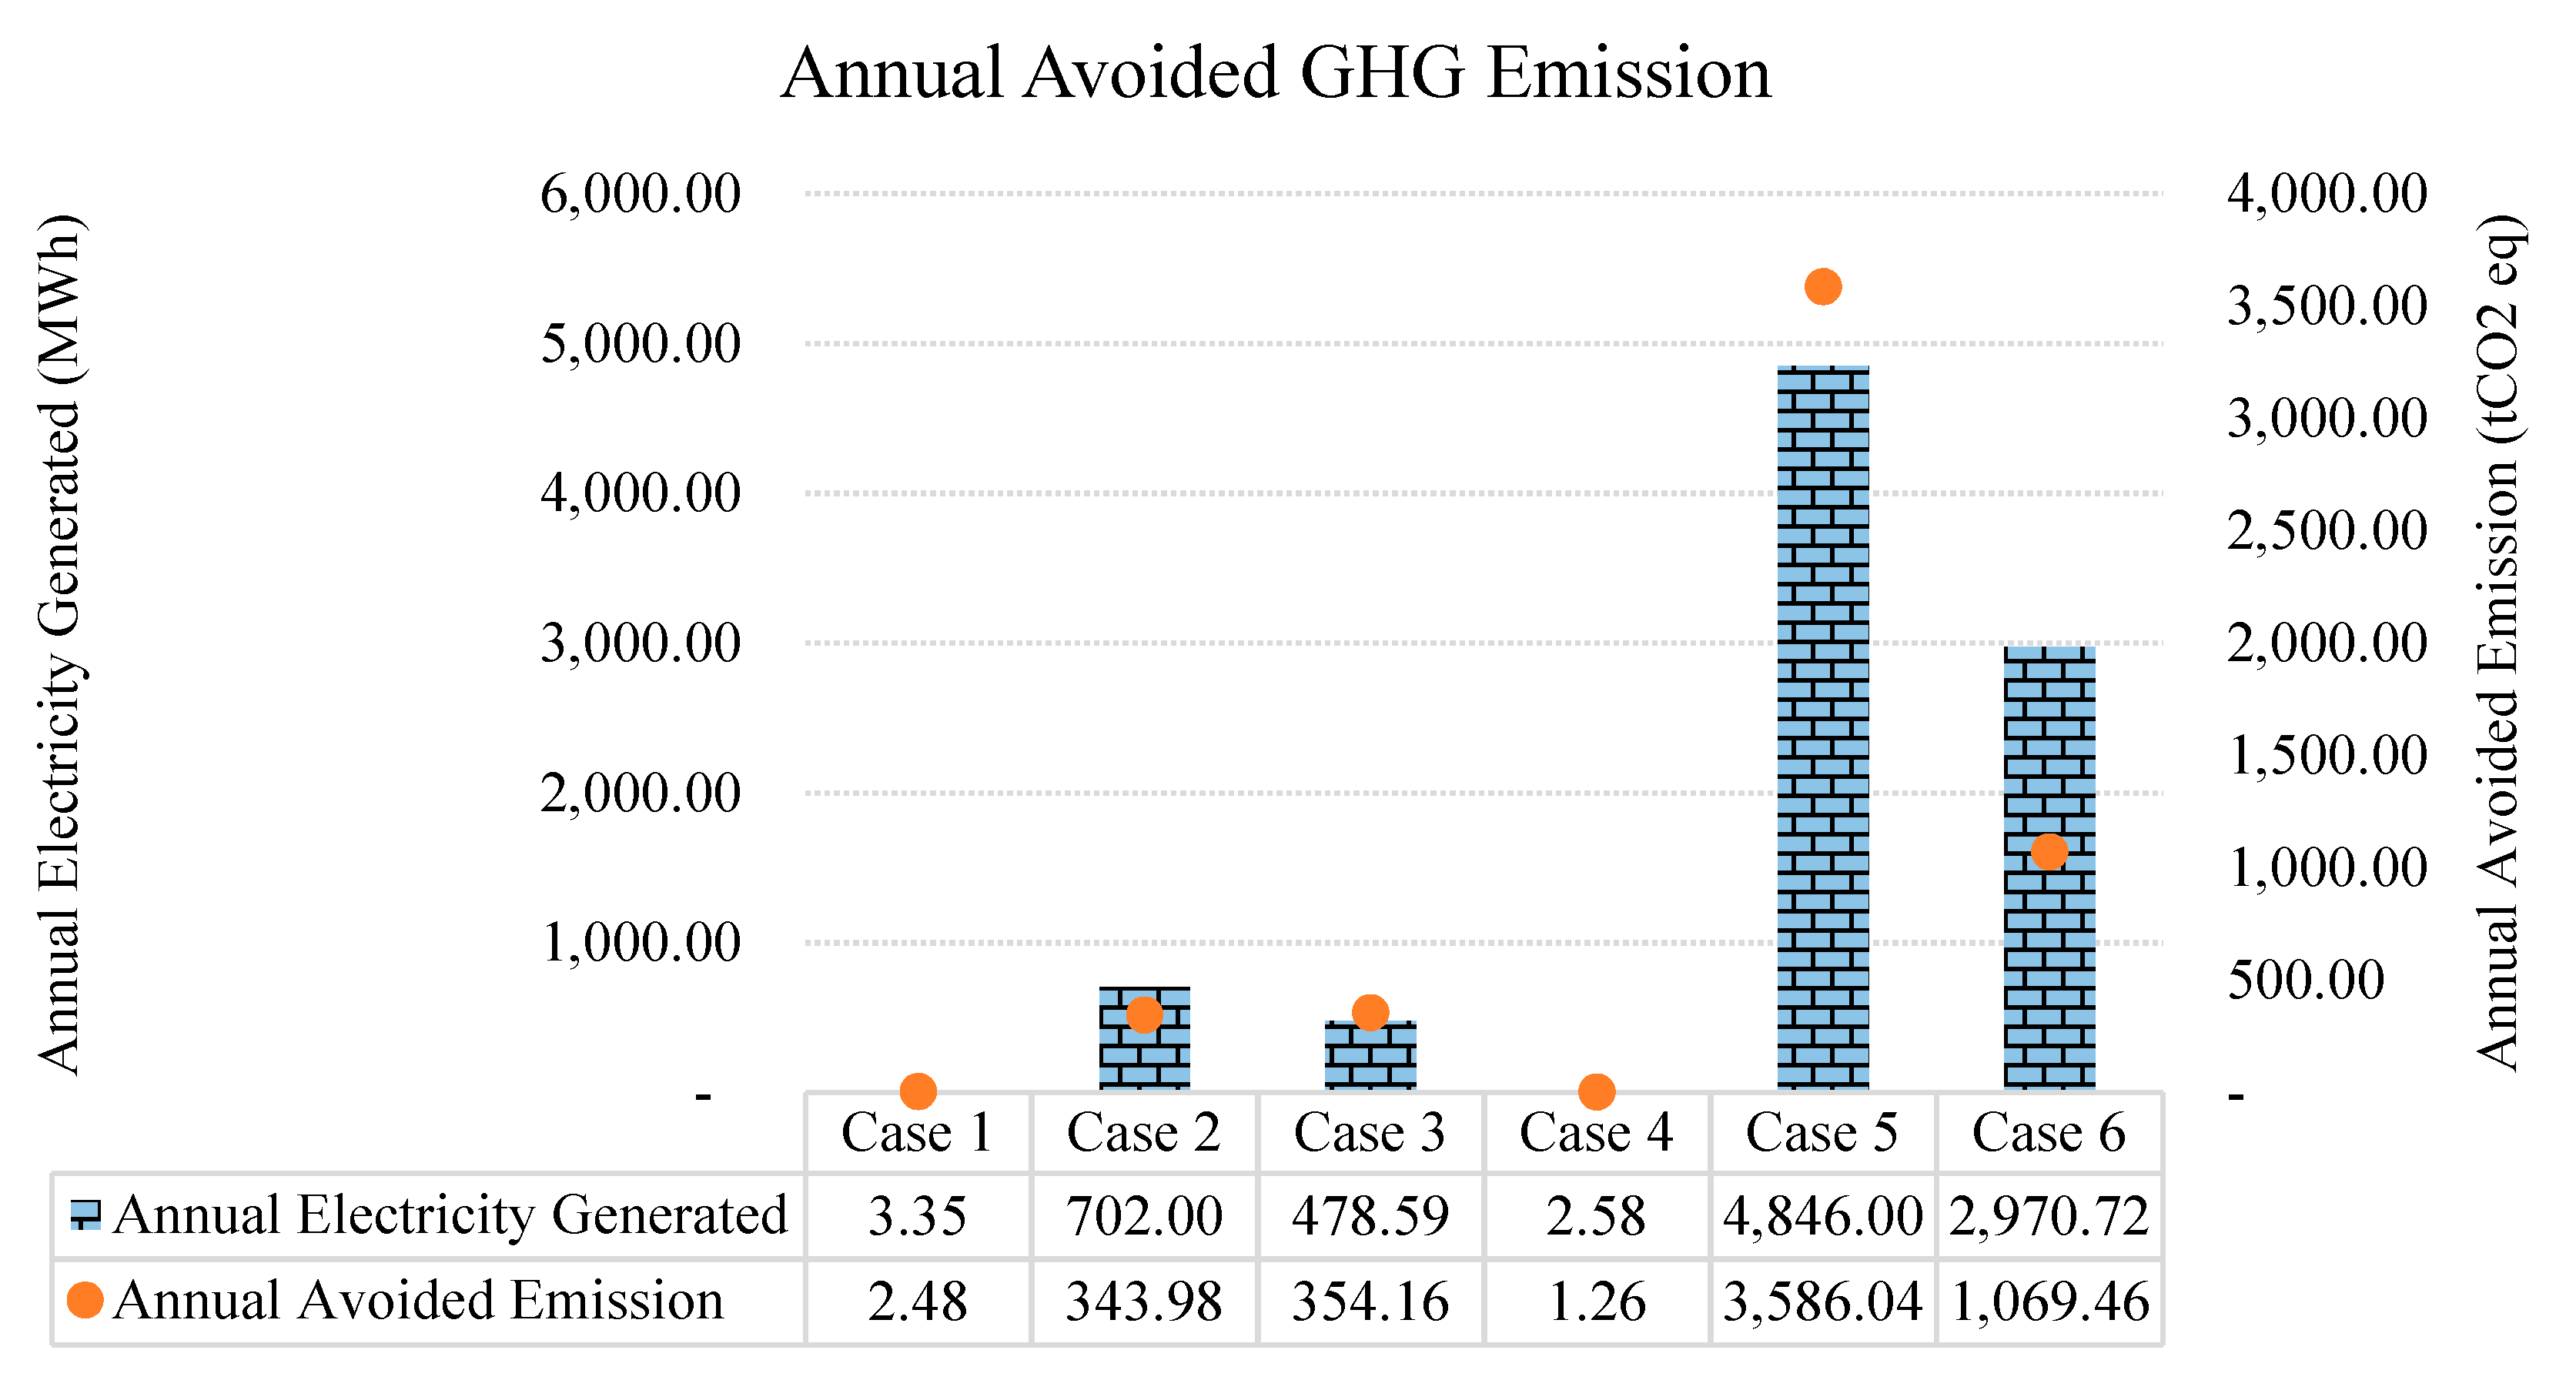
3.1. Environmental Impact
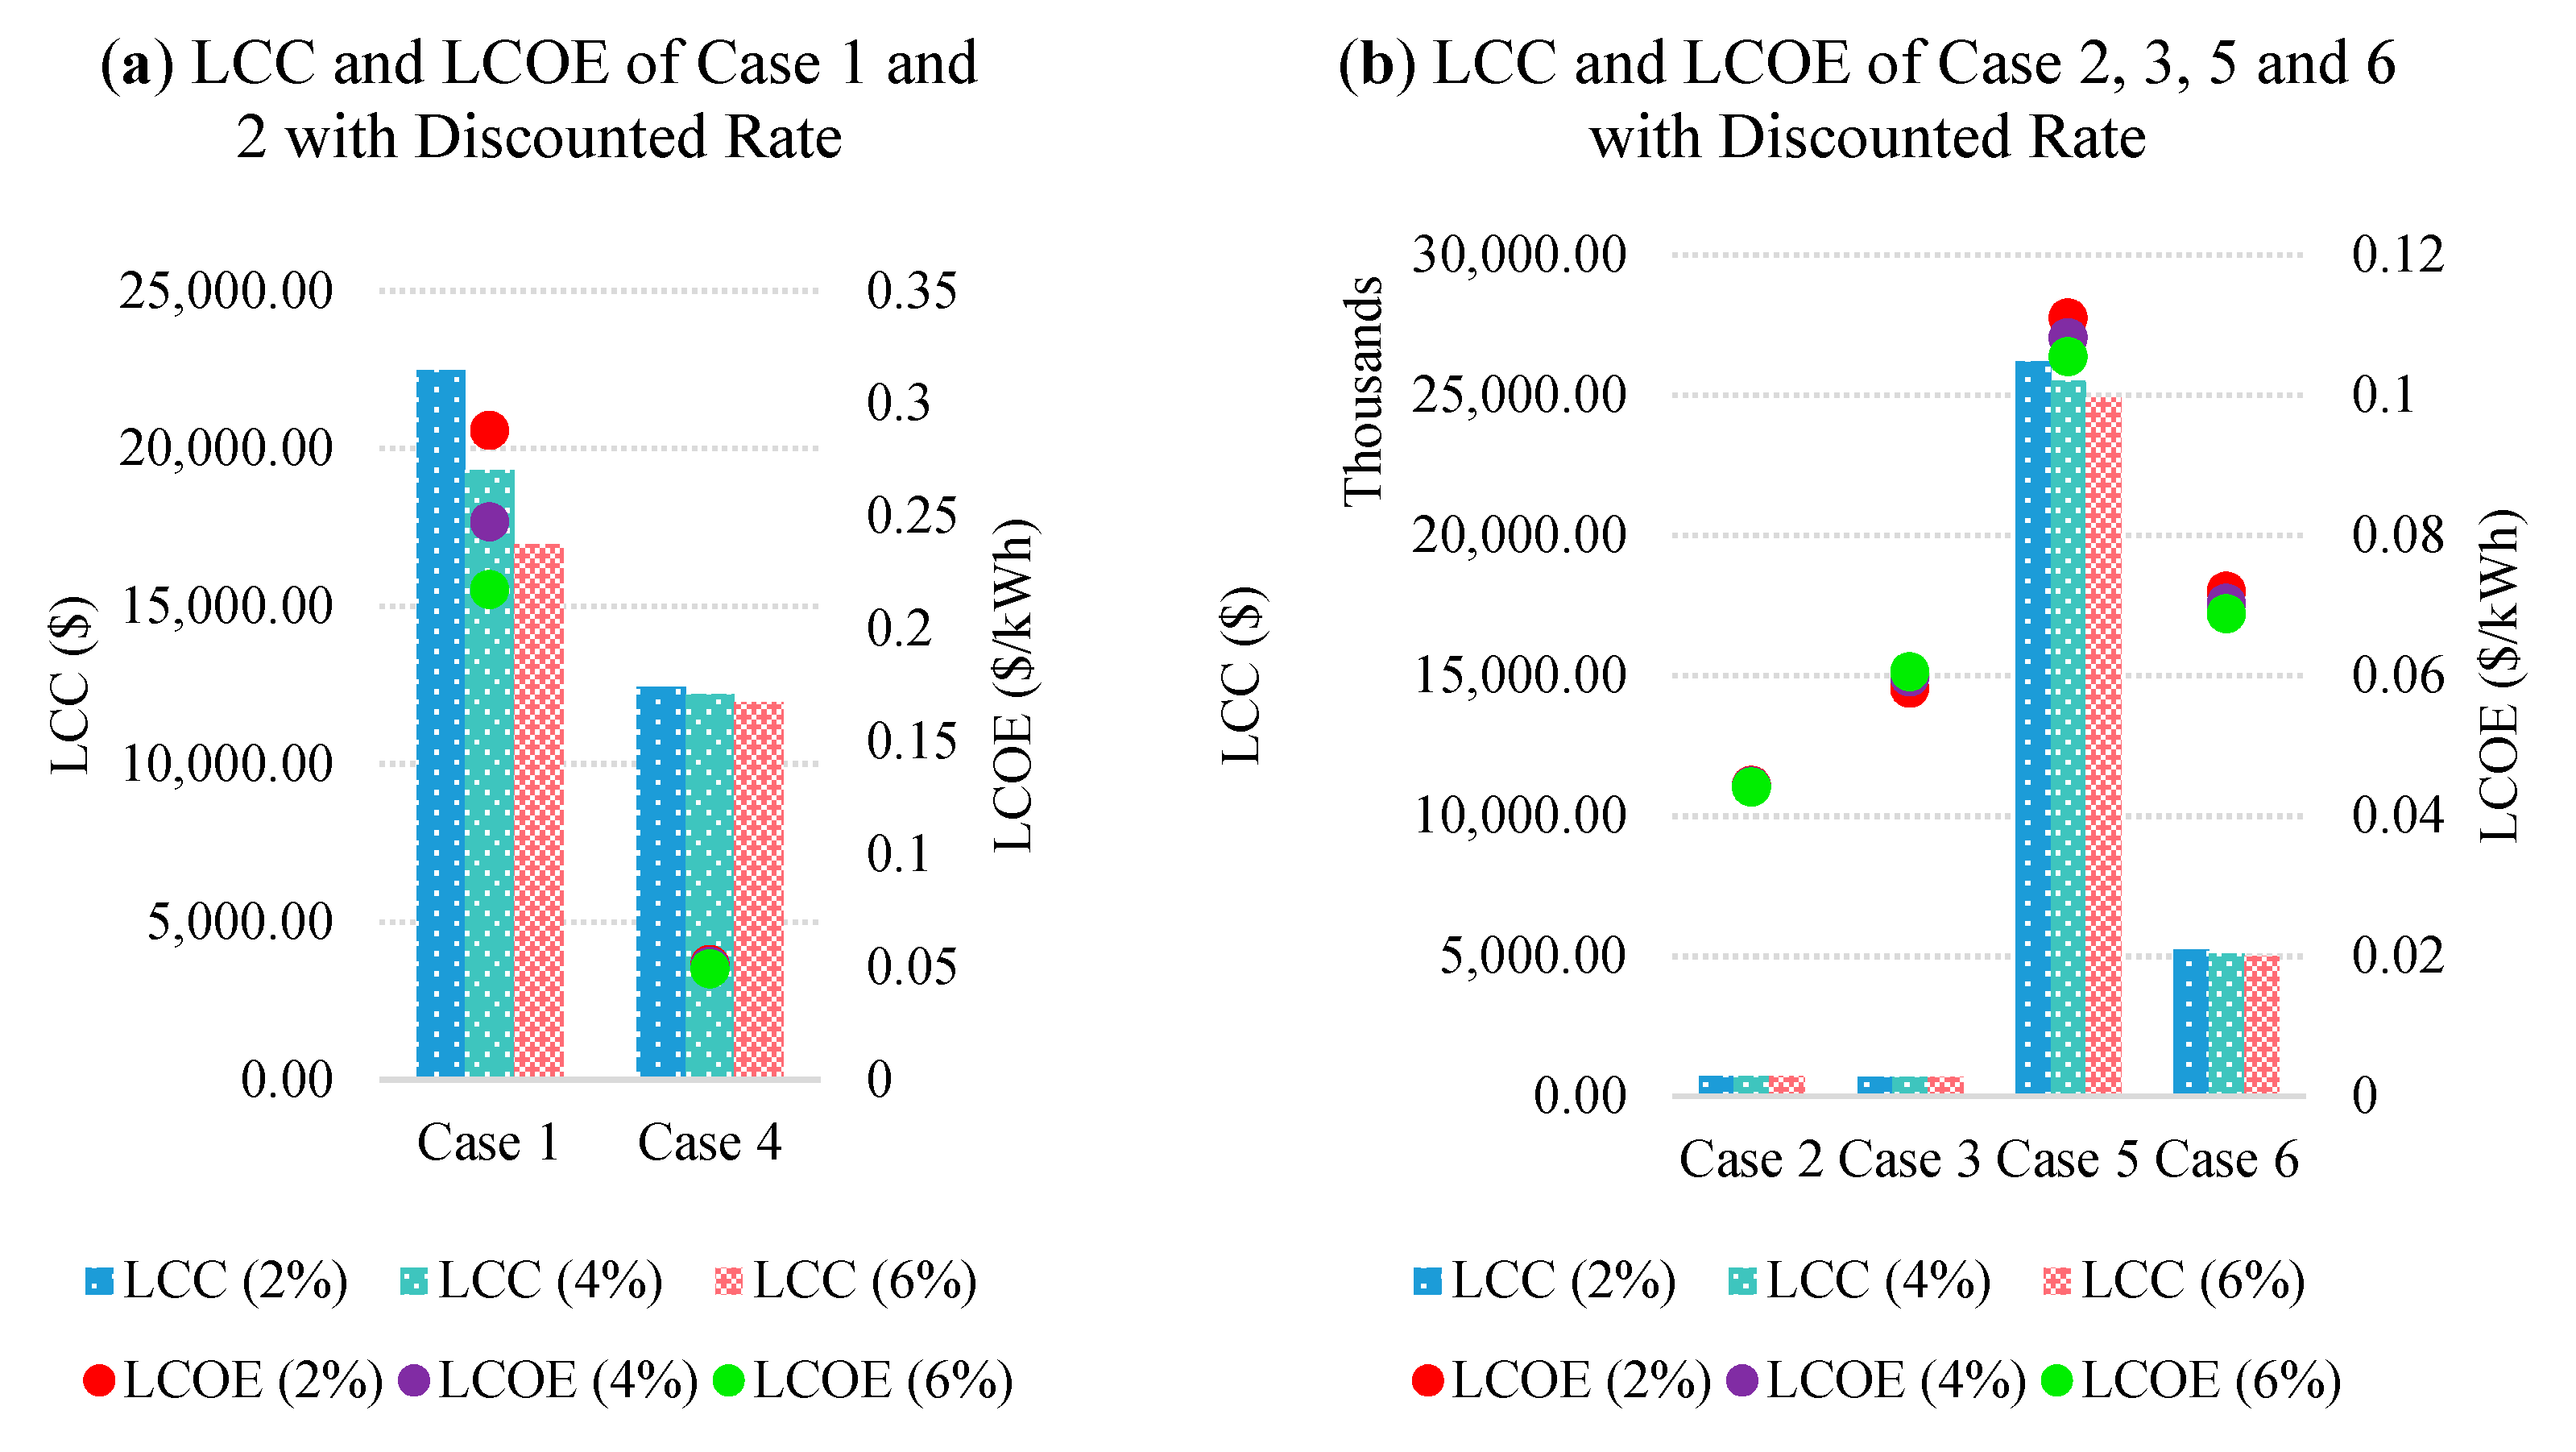
3.2. Economic Impact
4. Policy Intervention
- Whole system integration for optimal spatial consumption and impact trade-off balance on a temporal basis;
- Improvement of additional technology efficiency via low-energy consumption and low-toxic manufacturing;
- Design an optimal evaluation method that includes environment, circular economy, and social issues for renewable energy technology.
5. Conclusions
- Economies should widen their renewable energy roadmap by considering other adaptable policies and measures in the energy portfolio.
- Attractive programs and incentives are an excellent catalyst to improve public awareness and attract investments.
- Initializing the many energy scenarios in a decision-making platform achieves the highest potential for concerns of spatial installation and temporal market-driven trade-offs.
Author Contributions
Funding
Institutional Review Board Statement
Informed Consent Statement
Data Availability Statement
Acknowledgments
Conflicts of Interest
Abbreviations
| AC | Alternating Current |
| BAU | Business-as-Usual |
| CO2 | Carbon Dioxide |
| DC | Direct Current |
| EPBT | Energy Payback Time |
| GHG | Greenhouse Gas |
| LCA | Life Cycle Assessment |
| LCI | Life Cycle Inventory |
| LCC | Life Cycle Cost |
| LEP | Local Energy Production |
| PB | Payback |
| RE | Renewable Energy |
| SPB | Simple Payback |
| m-Si | Monocrystalline |
| APEC | Asia Pacific Cooperation |
| BOS | Balance of System |
| CED | Cumulative Energy Demand |
| DPB | Discounted Payback |
| FiT | Feed-in-Tariff |
| GDP | Gross Domestic Product |
| LCCA | Life Cycle Cost Assessment |
| LCOE | Levelised Cost of Energy |
| LCIA | Life Cycle Impact Assessment |
| O&M | Operation and Maintenance |
| PV | Photovoltaic |
| SDG | Sustainable Development Goals |
| a-Si | Amorphous Silicon |
| p-Si | Polycrystalline |
References
- APEC Policy Support Unit. APEC Regional Trends Analysis Trade, Policy, and the Pursuit of Inclusion. 2018. Available online: https://www.apec.org/Publications/2018/05/APEC-Regional-Trends-Analysis (accessed on 12 May 2018).
- APEC Energy Working Group. APEC Workshop on Energy Statistical and Geographic Information Systems Summary Report; APEC: Mexico City, Mexico, 2018; Available online: https://www.APEC-Workshop-on-Energy-Statistical-and-Geographic-Information-Systems.pdf (accessed on 12 May 2018).
- APEC Policy Support Unit. Research Outcomes: Summary of Research Project 2017. Available online: https://www.apec.org/Publications/2018/05/Research-Outcomes---Summary-of-Research-Projects-2017 (accessed on 12 May 2018).
- REN21 and Global Network of Research Partners. Renewables 2017 Global Status Report; REN21: Paris, France, 2017; Available online: https://www.ren21.net/wp-content/uploads/2019/05/GSR2017_Full-Report_English.pdf (accessed on 12 May 2018).
- International Renewable Energy Agency. Renewable Power Generation Costs in 2019; International Renewable Energy Agency Agency: Abu Dhabi, UAE, 2020; Available online: https://www.irena.org/-/media/Files/IRENA/Agency/Publication/2020/Jun/IRENA_Power_Generation_Costs_2019 (accessed on 12 May 2018).
- ExxonMobil. 2018 Outlook for Energy: A View to 2040; Energy Global News: Texas, TX, USA, 2018; Available online: https://www.aop.es/wp-content/uploads/2019/05/2018-Outlook-for-Energy-Exxon.pdf (accessed on 12 May 2018).
- Ferroukhi, R.; Nagpal, D.; Hawila, D. IRENA (2018), Renewable Energy Market Analysis: Southeast Asia; Abu Dhabi, UAE, 2018. Available online: https://www.IRENA_Market_Southeast_Asia_2018.pdf (accessed on 12 May 2018).
- Jäger-waldau, A. PV Status Report 2016; EU Science Hub: Luxembourg, 2016; Available online: https://publications.jrc.ec.europa.eu/repository/bitstream/JRC103426/ldna28159enn.pdf (accessed on 12 May 2018).
- International Renewable Energy Agency. Renewable Power Generation Costs in 2017; International Renewable Energy Agency Agency: Abu Dhabi, UAE, 2017. [Google Scholar]
- International Renewable Energy Agency (IRENA). Renewable Capacity Statistics 2019; International Renewable Energy Agency Agency: Abu Dhabi, UAE, 2019. [Google Scholar]
- UN. The 2030 Agenda for Sustainable Development; A/RES/70/1; UN: New York, NY, USA, 2015; Volume 16301, pp. 13–14. Available online: https://www.un.org/ga/search/view_doc.asp?symbol=A/RES/70/1&Lang=E (accessed on 3 January 2020).
- Bajracharya, I.; Bhattrai, N. Road Transportation Energy Demand and Environmental Emission: A Case of Kathmandu Valley. Hydro Nepal 2016, 18, 30–40. [Google Scholar] [CrossRef] [Green Version]
- Frischknecht, R.; Fthenakis, V.; Kim, H.C.; Raugei, M.; Sinha, P.; Stucki, M. Life Cycle Inventories and Life Cycle Assessments of Photovoltaic Systems; IEA PVPS: New York, NY, USA, 2015. [Google Scholar]
- Ho, K.; Tang, D. Climate change in Malaysia: Trends, contributors, impacts, mitigation and adaptations. Sci. Total Environ. 2019, 650, 1858–1871. [Google Scholar]
- European Commission—Joint Research Centre—Institute for Environment and Sustainability. Framework and Requirements for Life Cycle Impact Assessment Models and Indicators; European Commission: Luxembourg, 2010. [Google Scholar]
- Goedkoop, M.; Heijungs, R.; Huijbregts, M.; De Schryver, A.; Struijs, J.; Van Zelm, R. ReCiPe 2008; The Netherlands, 2009; pp. 1–44. Available online: http://www.pre-sustainability.com/download/misc/ReCiPe_main_report_final_27-02-2009_web.pdf (accessed on 12 May 2018).
- Rincón, L.; Castell, A.; Pérez, G.; Solé, C.; Boer, D.; Cabeza, L.F. Evaluation of the environmental impact of experi-mental buildings with different constructive systems using Material Flow Analysis and Life Cycle Assessment. Appl. Energy 2013, 109, 544–552. [Google Scholar] [CrossRef]
- Verones, F.; Bare, J.; Bulle, C.; Frischknecht, R.; Hauschild, M.; Hellweg, S.; Henderson, A.; Jolliet, O.; Laurent, A.; Liao, X.; et al. LCIA framework and cross-cutting issues guidance within the UNEP-SETAC Life Cycle Initiative. J. Clean. Prod. 2017, 161, 957–967. [Google Scholar] [CrossRef] [PubMed] [Green Version]
- Su, S.; Li, X.; Zhu, Y.; Lin, B. Dynamic LCA framework for environmental impact assessment of buildings. Energy Build. 2017, 149, 310–320. [Google Scholar] [CrossRef]
- Christensen, C.B.; Barker, G.M. Effects of Tilt and Azimuth on Annual Incident Solar Radiation for United States Locations. In Proceedings of the International Solar Energy Conference. American Society of Mechanical Engineers, Washington, DC, USA, 21–25 April 2001; pp. 225–232. [Google Scholar]
- Weidema, H.R.; Bauer, C.; Hischier, R.; Mutel, C.; Nemecek, T.; Reinhard, J.; Vadenbo, C.O.; Wernet, G. Overview and Methodology, Data Quality Guideline for the Ecoinvent; Swiss Centre for Life Cycle Inventories: Zurich, Switzerland, 2013; Volume 3. [Google Scholar]
- Asian Development Bank. Guidelines for Estimating Greenhouse Gas Emissions of Asian Development Bank Projects Additional Guidance for Energy Projects; Asian Development Bank: Manila, Philippines, 2017. [Google Scholar]
- Veríssimo, P.H.A.; Campos, R.A.; Guarnieri, M.V.; Veríssimo, J.P.A.; Nascimento, L.R.D.; Rüther, R. Area and LCOE considerations in utility-scale, single-axis tracking PV power plant topology optimization. Sol. Energy 2020, 211, 433–445. [Google Scholar] [CrossRef]
- Reddy, V.R.; Kurian, M.; Ardakanian, R. Life-cycle Cost Approach (LCCA): Framework and Concepts. In Environmental Education and Ecotourism; Springer Science and Business Media LLC: Berlin/Heidelberg, Germany, 2015; pp. 17–37. [Google Scholar]
- Universiti Teknologi MARA. Fundamentals of Finance, 14th ed.; Universiti Teknologi MARA: Selangor, Malaysia, 2014. [Google Scholar]
- Cellura, M.; Cusenza, M.A.; Longo, S. Energy-related GHG emissions balances: IPCC versus LCA. Sci. Total Environ. 2018, 628–629, 1328–1339. [Google Scholar] [CrossRef]
- Jäger-Waldau, A.; Kougias, I.; Taylor, N.; Thiel, C. How photovoltaics can contribute to GHG emission reductions of 55% in the EU by 2030. Renew. Sustain. Energy Rev. 2020, 126, 109836. [Google Scholar] [CrossRef]
- Energy Commission. Malaysia Energy Statistics Handbook 2017; Energy Commission: Kuala Lumpur, Malaysia, 2018. [Google Scholar]
- IRENA. Renewable Energy Outlook: Thailand; IRENA: Bangkok, Thailand, 2017. [Google Scholar]
- National Energy Council. Indonesia Energy Outlook 2016; National Energy Council: Jakarta, Indonesia, 2016. [Google Scholar]
- Kourkoumpas, D.; Benekos, G.; Nikolopoulos, N.; Karellas, S.; Grammelis, P.; Kakaras, E. A review of key environ-mental and energy performance indicators for the case of renewable energy systems when integrated with storage solu-tions. Appl. Energy 2018, 231, 380–398. [Google Scholar] [CrossRef]
- Fthenakis, V.; Frischknecht, R.; Raugei, M.; Kim, H.C.; Alsema, E.; Held, M.; de Wild-Scholten, M. Methodology Guidelines on Life Cycle Assessment of Photovoltaic Electricity. IEA PVPS Task 2011, 12, 6–21. [Google Scholar]
- IEA. Tracking Clean Energy Progress; IEA: Paris, France, 2012. [Google Scholar]
- Kittner, N.; Gheewala, S.H.; Kamens, R. Life Cycle Considerations for Monocrystalline Photovoltaics in Thailand. J. Sustain. Energy Environ. 2012, 3, 143–146. [Google Scholar]
- Ludin, N.A.; Mustafa, N.I.; Hanafiah, M.M.; Ibrahim, M.A.; Teridi, M.A.M.; Sepeai, S.; Zaharim, A.; Sopian, K. Prospects of life cycle assessment of renewable energy from solar photovoltaic technologies: A review. Renew. Sustain. Energy Rev. 2018, 96, 11–28. [Google Scholar] [CrossRef]
- Allouhi, A.; Saadani, R.; Buker, M.; Kousksou, T.; Jamil, A.; Rahmoune, M. Energetic, economic and environmental (3E) analyses and LCOE estimation of three technologies of PV grid-connected systems under different climates. Sol. Energy 2019, 178, 25–36. [Google Scholar] [CrossRef]
- Sherwani, A.F.; Usmani, J.A. Life cycle assessment of solar PV based electricity generation systems: A review. Renew. Sustain. Energy Rev. 2010, 14, 540–544. [Google Scholar] [CrossRef]
- Althaus, H.-J. Calculation of energy payback time of PV and its determinants. In Proceedings of the Swiss Photonics Workshop Dübendorf, Quantis, Switzerland, 22 October 2013. [Google Scholar]
- Rossi, F.; Heleno, M.; Basosi, R.; Sinicropi, A. Environmental and economic optima of solar home systems design: A combined LCA and LCC approach. Sci. Total Environ. 2020, 744, 140569. [Google Scholar] [CrossRef]
- Soares, N.; Bastos, J.; Pereira, L.D.; Soares, A.; Amaral, A.; Asadi, E.; Rodrigues, E.; Lamas, F.; Monteiro, H.; Lopes, M.; et al. A review on current advances in the energy and environmental performance of buildings towards a more sustainable built environment. Renew. Sustain. Energy Rev. 2017, 77, 845–860. [Google Scholar] [CrossRef]
- Magrassi, F.; Rocco, E.; Barberis, S.; Gallo, M.; Del Borghi, A. Hybrid solar power system versus photovoltaic plant: A comparative analysis through a life cycle approach. Renew. Energy 2019, 130, 290–304. [Google Scholar] [CrossRef]
- Bazán, J.; Rieradevall, J.; Gabarrell, X.; Vázquez-rowe, I. Science of the Total Environment Low-carbon electricity production through the implementation of photovoltaic panels in rooftops in urban environments: A case study for three cities in Peru. Sci. Total Environ. 2018, 622–623, 1448–1462. [Google Scholar] [CrossRef]
- Battaglia, C.; Cuevas, A.; De Wolf, S. High-efficiency crystalline silicon solar cells: Status and perspectives. Energy Environ. Sci. 2016, 9, 1552–1576. [Google Scholar] [CrossRef] [Green Version]
- Atia, N.G.; Bassily, M.A.; Elamer, A.A. Do life-cycle costing and assessment integration support decision-making towards sustainable development? J. Clean. Prod. 2020, 267, 122056. [Google Scholar] [CrossRef]
- Naves, A.X.; Fernández, A.; Fernández, A.I.; Cabeza, L.F.; Haddad, A.N.; Boer, D. Life cycle costing as a bottom line for the life cycle sustainability assessment in the solar energy sector: A review. Sol. Energy 2019, 192, 238–262. [Google Scholar] [CrossRef]
- Harvey, L.D. Clarifications of and improvements to the equations used to calculate the levelized cost of electricity (LCOE), and comments on the weighted average cost of capital (WACC). Energy 2020, 207, 118340. [Google Scholar] [CrossRef]
- Narayan, N.; Chamseddine, A.; Vega-Garita, V.; Qin, Z.; Popovic-Gerber, J.; Bauer, P.; Zeman, M. Exploring the boundaries of Solar Home Systems (SHS) for off-grid electrification: Optimal SHS sizing for the multi-tier framework for household electricity access. Appl. Energy 2019, 240, 907–917. [Google Scholar] [CrossRef]
- Gu, Y.; Zhang, X.; Are Myhren, J.; Han, M.; Chen, X.; Yuan, Y. Techno-economic analysis of a solar photovoltaic/thermal (PV/T) concentrator for building application in Sweden using Monte Carlo method. Energy Convers. Manag. 2018, 165, 8–24. [Google Scholar] [CrossRef]
- Kunkel, S.; Matthess, M. Digital transformation and environmental sustainability in industry: Putting expectations in Asian and African policies into perspective. Environ. Sci. Policy 2020, 112, 318–329. [Google Scholar] [CrossRef]
- Yu, H.J.J.; Geoffron, P. Solar PV Market and Policies; Elsevier BV: Amsterdam, The Netherlands, 2020; pp. 413–437. [Google Scholar]
- Butler, R. Challenges and opportunities. Worldw. Hosp. Tour. Themes 2018, 10, 635–641. [Google Scholar] [CrossRef]
- Erdiwansyah, R.; Mamat, M.S.; Sani, M.; Sudhakar, K. Renewable energy in Southeast Asia: Policies and recommendations. Sci. Total Environ. 2019, 670, 1095–1102. [Google Scholar] [CrossRef]
- Phoumin, H.; Kimura, F.; Arima, J. Potential Renewable Hydrogen from Curtailed Electricity to Decarbonize ASEAN’s Emisions: Policy Implications. Sustainability 2020, 12, 10560. [Google Scholar] [CrossRef]
- Energy Commission. Handbook Malaysia Energy Statistics; Energy Commission: Kuala Lumpur, Malaysia, 2019. [Google Scholar]
- Ambashi, M. Key Messages: ASEAN Development and Innovation Strategy in the Era of New Industrialisation; Economic Research Institute for ASEAN and East Asia: Jakarta, Indonesia, 2020; pp. 1–5. [Google Scholar]
- Arnaoutakis, N.; Souliotis, M.; Papaefthimiou, S. Comparative experimental Life Cycle Assessment of two commercial solar thermal devices for domestic applications. Renew. Energy 2017, 111, 187–200. [Google Scholar] [CrossRef]


| Asia Countries | Total Solar Energy Capacity (MW) | ||||
|---|---|---|---|---|---|
| 2014 | 2015 | 2016 | 2017 | 2018 | |
| Brunei Darussalam | 1 | 1 | 1 | 1 | 1 |
| Cambodia | 9 | 12 | 18 | 28 | 28 |
| China | 28,402 | 43,552 | 77,802 | 130,816 | 175,032 |
| Chinese Taipei | 620 | 842 | 1245 | 1768 | 2618 |
| India | 3518 | 5396 | 9647 | 17,873 | 27,098 |
| Indonesia | 42 | 51 | 58 | 59 | 60 |
| Japan | 23,339 | 34,150 | 42,040 | 49,040 | 55,500 |
| Kazakhstan | 5 | 57 | 57 | 59 | 209 |
| Korea DPR | 5 | 8 | 10 | 11 | 11 |
| Korea Rep | 2481 | 3613 | 4502 | 5835 | 7862 |
| Malaysia | 166 | 229 | 279 | 317 | 438 |
| Philippines | 23 | 165 | 759 | 886 | 886 |
| Singapore | 26 | 46 | 97 | 116 | 150 |
| Thailand | 1304 | 1425 | 2451 | 2702 | 2725 |
| Viet Nam | 5 | 5 | 5 | 8 | 106 |
| Total | 59,946 | 89,552 | 138,971 | 209,519 | 272,724 |
| Case | Location | Annual Average Irradiation | No. of PV Panels and Model | Panel Effective Area | Power Capacity | Service Year |
|---|---|---|---|---|---|---|
 Case 1 Case 1 | Malaysia (2′43′ N, 101′57′ E) | 1571 kWh/m2/year | 12 unit SHARP Poly-Si-ND-235QCJ | 19.22 m2 | 3.0 kWp | 2015 |
 Case 2 Case 2 | Thailand (18.7′ N 98.9′ E) | 1672 kWh/m2/year | 2808 unit Solartron Polycrystalline SP250 | 4548.98 m2 | 702 kWp | 2011 |
 Case 3 Case 3 | Malaysia (5.22′ N 100.24′ E) | 1685.39 kWh/m2/year | 1320 unit Polycrystalline | 2138.4 m2 | 200 kWp | 2016 |
 Case 4 Case 4 | Thailand (18.7′ N 98.9′ E) | 1672 kWh/m2/year | 32 unit Amorphous Silicon | 51.84 m2 | 2.5 kWp | 2011 |
 Case 5 Case 5 | Malaysia (2.3 N, 102.3 E) | 1571 kWh/m2/year | 29,092 unit Yingli PANDA Monocrystalline | 47,129 m2 | 8.0 MWp | 2014 |
 Case 6 Case 6 | Indonesia (1.3 N, 116.3 E) | 1888 kWh/m2/year | 8568 unit Adyasolar SP240-24M Monocrystalline | 13,880.16 m2 | 2.0 MWp | 2014 |
| Materials | Embedded Energy and Carbon Coefficient | Comments | ||
|---|---|---|---|---|
| EE (MJ/kg) | EC (kgCO2/kg) | EC (kgCO2e/kg) | EE: Embedded Energy EC: Embedded Carbon | |
| Aggregate (general) | 0.083 | 0.0048 | 0.0052 | Industrial fuel consumptions |
| Aluminium (general) | 155 | 8.24 | 9.16 | Assumed ratio |
| Primary Glass | 15.00 | 0.86 | 0.91 | Includes CO2 emission from primary manufacturing |
| Silicon | 2355 | - | - | |
| Lithium | 853 | 5.30 | - | |
| Water | 0.01 | 0.001 | - | |
| Plastic | 80.50 | 2.73 | 3.31 | Includes feedstock energy (EU) |
| Wire | 36.00 | 2.83 | 3.02 | |
| MJ/m2 | kgCO2/m2 | |||
| Monocrystalline PV | 4750 | 242 | Industrial fuel mix | |
| Polycrystalline PV | 4070 | 208 | ||
| Life Cycle Cost, LCC (USD) | Levelized Cost of Energy, LCOE (USD/kWh) | |||||
|---|---|---|---|---|---|---|
| Discount Rate | 2% | 4% | 6% | 2% | 4% | 6% |
| Stand-alone PV | ||||||
| Case 1 | 22,480.70 | 19,310.94 | 16,959.09 | 0.2881 | 0.2475 | 0.2173 |
| Case2 | 725,147.86 | 723,662.66 | 721,783.24 | 0.0443 | 0.0442 | 0.0441 |
| Rooftop PV | ||||||
| Case 3 | 677,047.86 | 695,562.66 | 704,673.74 | 0.0582 | 0.0598 | 0.0605 |
| Case 4 | 12,439.22 | 12,198.39 | 11,958.97 | 0.0511 | 0.0501 | 0.0491 |
| Solar farm | ||||||
| Case 5 | 26,184,865.32 | 25,509,958.23 | 24,889,130.50 | 0.111 | 0.1082 | 0.1055 |
| Case 6 | 5,218,893.56 | 5,100,949.46 | 4,988,828.95 | 0.072 | 0.0703 | 0.0688 |
| Simple Payback, SPB (Year) | Discounted Payback, DPB (Year) | |||
|---|---|---|---|---|
| Discount rate | - | 2% | 4% | 6% |
| Stand-alone PV | - | |||
| Case 1 | - | - | - | - |
| Case2 | 13.28 | 14.28 | 17.59 | 25.11 |
| Rooftop PV | - | |||
| Case 3 | 8.45 | 9.36 | 10.55 | 12.20 |
| Case 4 | 7.96 | 8.77 | 9.80 | 11.22 |
| Solar farm | - | |||
| Case 5 | 9.75 | 10.98 | 12.69 | 15.32 |
| Case 6 | 6.26 | 6.76 | 7.36 | 8.10 |
Publisher’s Note: MDPI stays neutral with regard to jurisdictional claims in published maps and institutional affiliations. |
© 2021 by the authors. Licensee MDPI, Basel, Switzerland. This article is an open access article distributed under the terms and conditions of the Creative Commons Attribution (CC BY) license (http://creativecommons.org/licenses/by/4.0/).
Share and Cite
Ahmad Ludin, N.; Ahmad Affandi, N.A.; Purvis-Roberts, K.; Ahmad, A.; Ibrahim, M.A.; Sopian, K.; Jusoh, S. Environmental Impact and Levelised Cost of Energy Analysis of Solar Photovoltaic Systems in Selected Asia Pacific Region: A Cradle-to-Grave Approach. Sustainability 2021, 13, 396. https://doi.org/10.3390/su13010396
Ahmad Ludin N, Ahmad Affandi NA, Purvis-Roberts K, Ahmad A, Ibrahim MA, Sopian K, Jusoh S. Environmental Impact and Levelised Cost of Energy Analysis of Solar Photovoltaic Systems in Selected Asia Pacific Region: A Cradle-to-Grave Approach. Sustainability. 2021; 13(1):396. https://doi.org/10.3390/su13010396
Chicago/Turabian StyleAhmad Ludin, Norasikin, Nurfarhana Alyssa Ahmad Affandi, Kathleen Purvis-Roberts, Azah Ahmad, Mohd Adib Ibrahim, Kamaruzzaman Sopian, and Sufian Jusoh. 2021. "Environmental Impact and Levelised Cost of Energy Analysis of Solar Photovoltaic Systems in Selected Asia Pacific Region: A Cradle-to-Grave Approach" Sustainability 13, no. 1: 396. https://doi.org/10.3390/su13010396