The Relationship between Human Well-Being and Carbon Emissions


Department of Environmental Science & Engineering, Fudan University, Shanghai 200433, China
*
Author to whom correspondence should be addressed.
Sustainability 2021, 13(2), 547; https://doi.org/10.3390/su13020547
Submission received: 17 December 2020
/
Revised: 4 January 2021
/
Accepted: 5 January 2021
/
Published: 8 January 2021
(This article belongs to the Special Issue Climate Adaptation and Mitigation through Sustainable Energy Solutions)
Abstract
:Governments around the world are actively exploring strategies to reduce carbon emissions and mitigate and adapt to the impacts of climate change. In addition to technological progress, promoting a transformation of residents’ behaviors to a low carbon mode is also a solution. Many people are concerned about how to reduce carbon emissions while ensuring human well-being. Starting from the comparative analysis of two main theories of human well-being, this paper sorted out existing well-being measurement methods from the perspectives of “top-down” and “bottom-up” and further sorted out research on the relationship between human well-being and energy carbon emissions. While “top-down” research is conducive to the layout of macro policies, “bottom-up” research can better help to promote the transformation of society to a low carbon life by estimating the energy consumption and carbon emissions contained in human needs. Current research discusses human well-being, human needs, energy use and carbon emissions, respectively, but they are not systematically integrated. Furthermore, this paper proposes a framework combining these aspects to analyze the relationship between human well-being and carbon emissions. In addition, this paper suggests future research directions.
1. Introduction
The world has raised more and more awareness of the impacts of climate change. Governments around the world actively explore strategies to reduce carbon emissions in order to mitigate the impacts of climate change [1]. Currently, more and more researchers believe that changes in lifestyle and consumption modes are essential to energy conservation and emission reduction other than technological progress [2]. However, it usually takes great effort to reduce emissions at the consumption level. In many cases, increasing consumption is commonly regarded as a synonym for increasing human well-being. However, some scholars believe that the consumption scale in modern society is harmful to both the environment and psychology and that human beings can significantly reduce consumption without reducing the level of human well-being [3]. That is to say, there is such a “win-win” situation in which human beings can lead better lives while reducing consumption and environmental impacts in the process. Therefore, how to reduce carbon emissions while ensuring the improvement of human well-being has attracted more and more attention. To answer this question, first of all we need to understand the relationship between human well-being and carbon emissions, then find the correlation channel between human well-being and carbon emissions. Only in this way can it be intrinsically appealing for residents to turn to a green and low carbon lifestyle.
2. Methodology
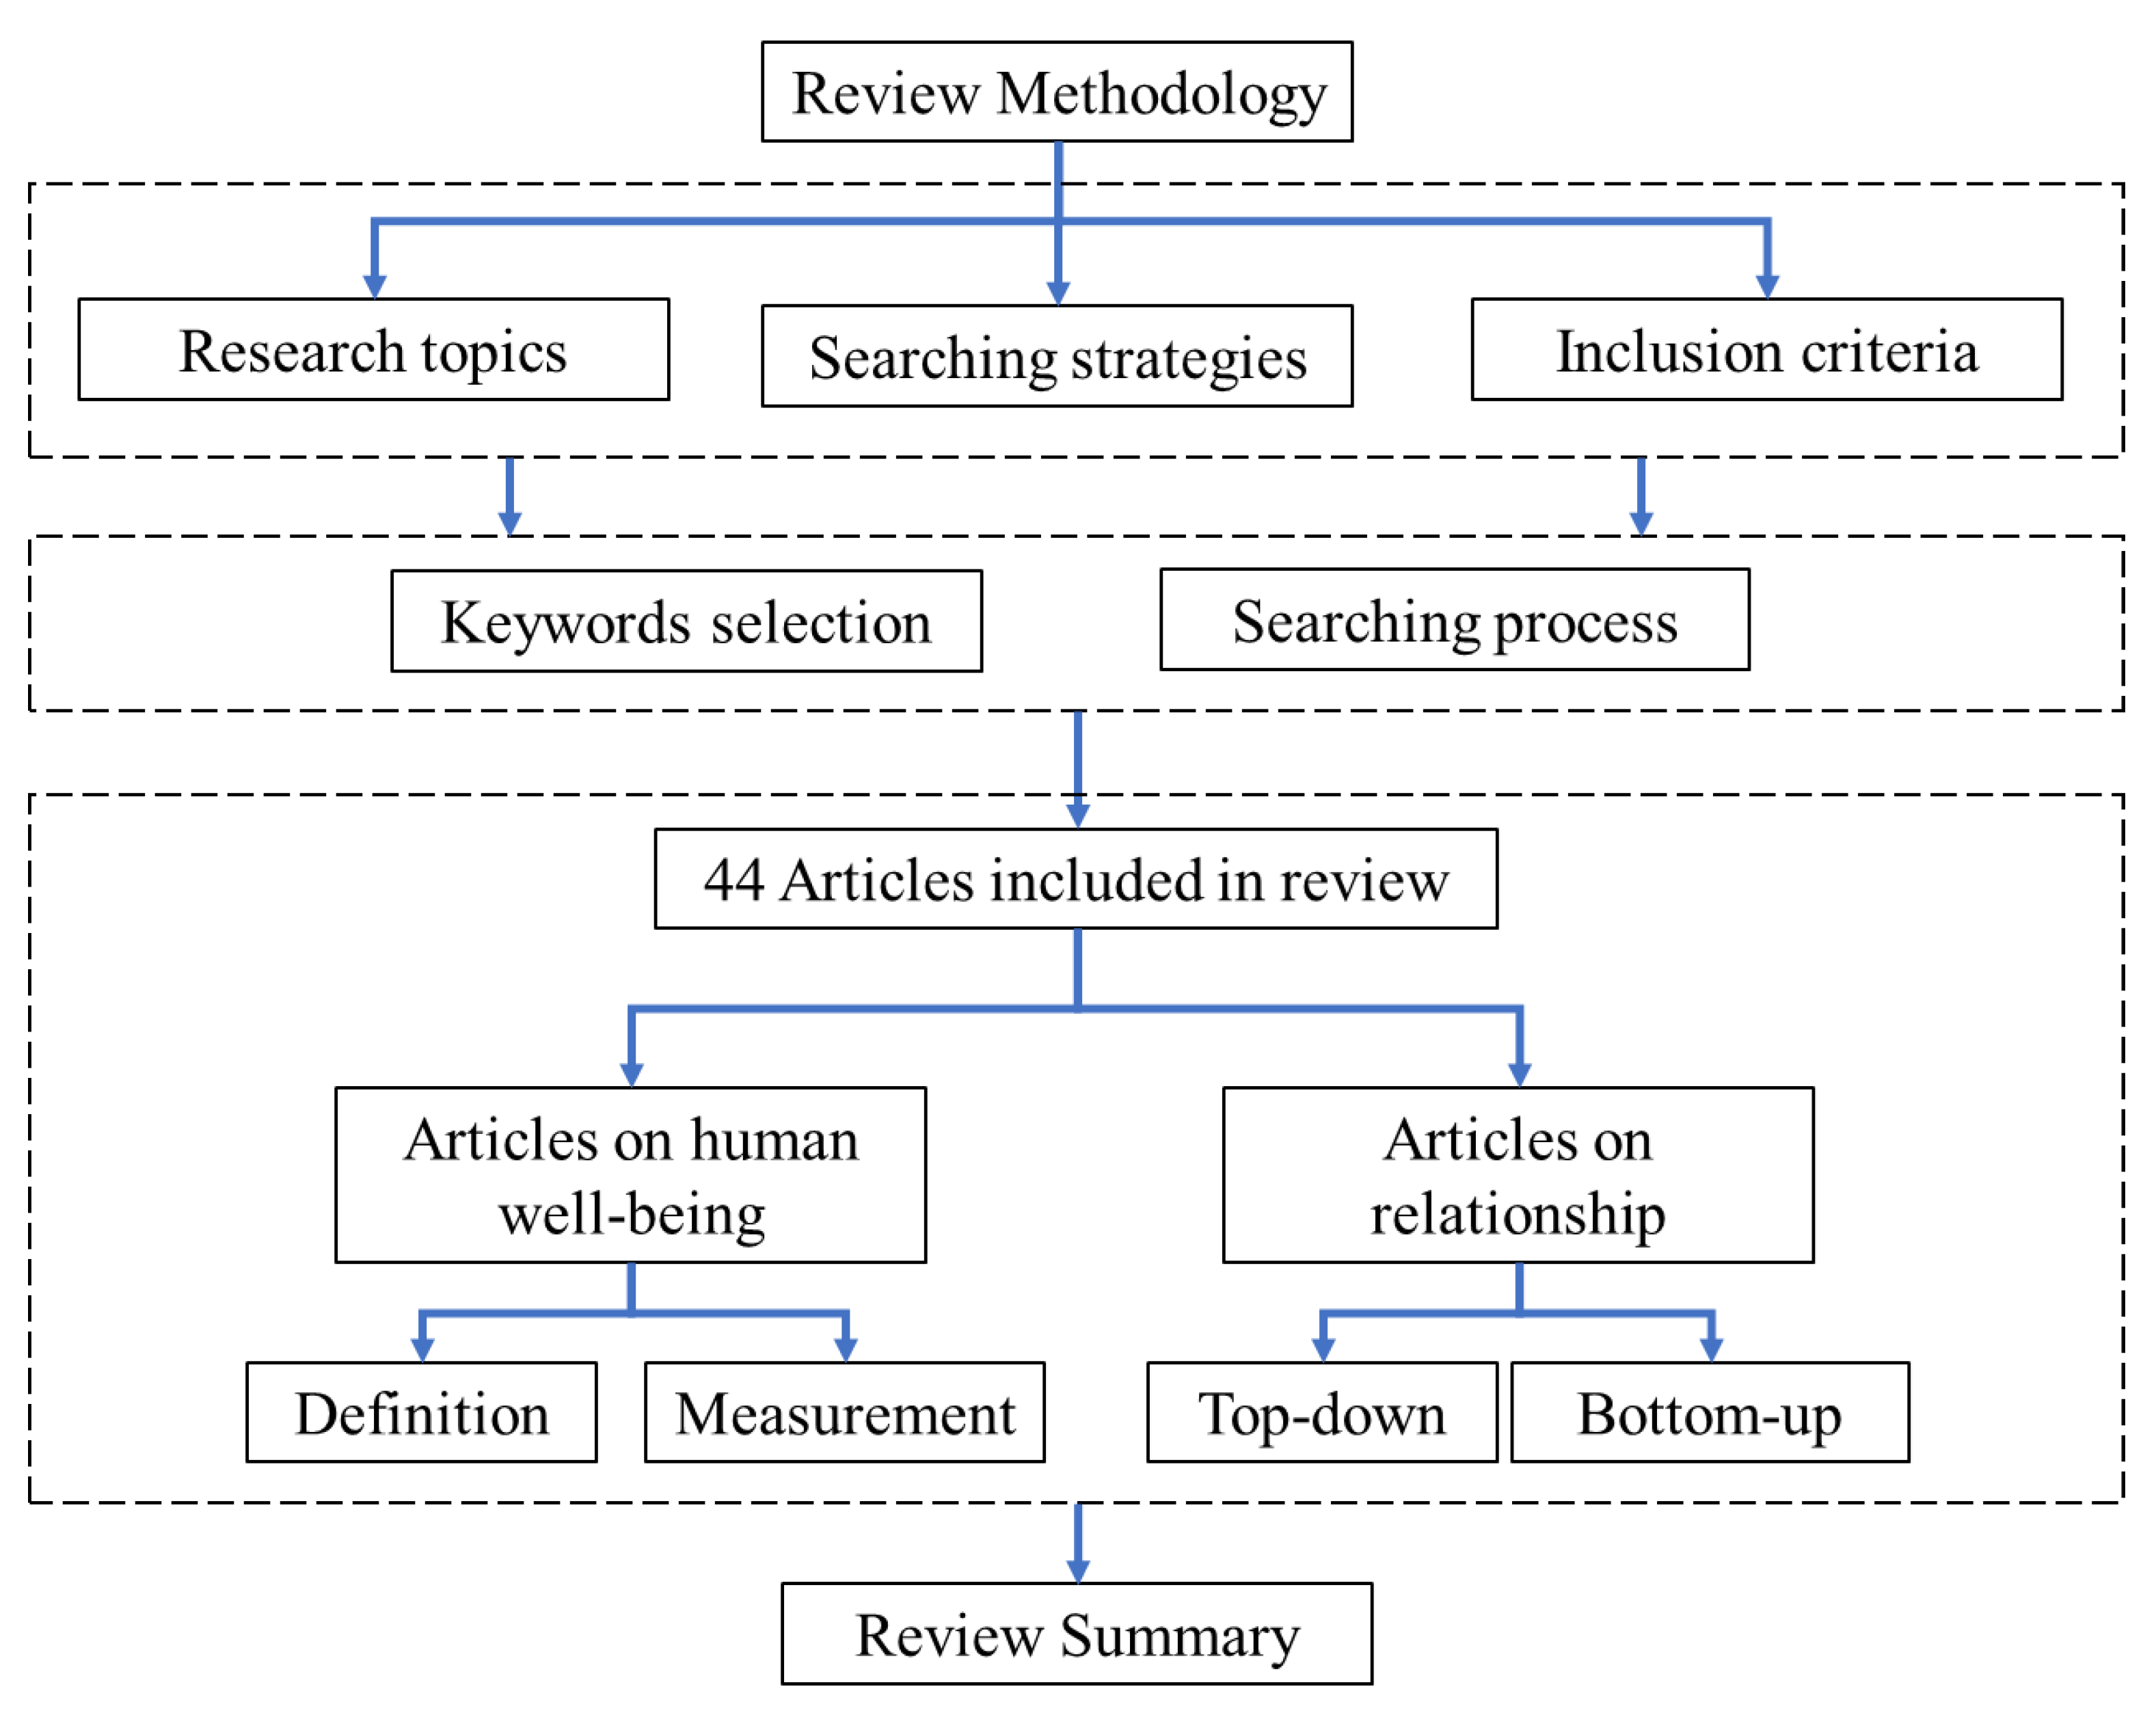
Figure 1 shows the overall review methodology. This study considers that a systematic review can be categorized into four parts (preparation, searching, analyzing and reporting the review). During the preparation, research topics and questions, searching strategies and inclusion criteria were determined. The search was then performed to bring together articles published in the period from 1900 to April 2020 with such keywords as “human well-being” OR “human needs” AND “carbon emission” AND “energy use”. While there have been plenty of literature reviews on carbon emission, this paper focuses on human well-being and its relationship with carbon emissions. Some articles that did not meet inclusion criteria were excluded during this phase. This resulted in 44 articles included in this review. In order to explore the relationship, this paper sorted out current studies and reported the review under this structure: Section 3 clarifies the definition and measurement methods of human well-being and Section 4 presents current research on the relationship between human well-being and carbon emissions from “top-down” and “bottom-up” perspectives. Furthermore, an analytical framework is established on the basis of the discussion in Section 5. Conclusions and future research directions are drawn in Section 6.
3. Definition and Measurement of Human Well-Being
3.1. Theories of Human Well-Being
The definition of human well-being is diverse and is often used interchangeably with happiness, human welfare, standard of living or quality of life and has become an all-around term to measure and promote human lifestyle [4]. As the definition will affect the value choice behind it, it is of great importance to study the theoretical proposition behind the typical methods of human well-being measurement. In this part, two different theories of human well-being are compared.
There are two major theories of human well-being: Epicurus’ hedonic well-being and Aristotle’s eudaimonic well-being [5].
Hedonic well-being emphasizes maximizing pleasure and minimizing pain [6]. Its representative model is the utility theory of neoclassical economics, which measures the level of well-being by using a consumption preference to represent human well-being. For example, under budget constraints, it studies how consumption decisions can maximize utility [7]. However, due to incomplete knowledge, incomplete rationality and lack of consideration for other people’s well-being, there are inconsistencies between humans’ preference and well-being, hence this method is not always easy to use [8]. Hedonic well-being is often used to evaluate subjective happiness. In large-scale data surveys such as the World Values Survey, the world happiness report and the UK based national labor force survey, it is widely used in the form of standardized questions [4].
In the theory of eudaimonic well-being, Aristotle believed that human well-being lay in behaviors, content and the process of the personal life rather than a temporary and subjective psychological state [5]. Sen also pointed out that human well-being does not directly depend on the quantity of commodities owned by individuals but on the functions and abilities possessed by individuals [9]. The functions here refer to basic living conditions such as health, education and nutrition and the abilities refer to the possibilities and opportunities available to individuals. This theory is often used in objective research, which is reflected in the use of health, education, infrastructure, public services and other dimensions to measure the level of human well-being. This theory has derived a variety of human well-being measurement methods including the multi-dimensional poverty index and demand satisfaction theory.
From the neoclassical economics of hedonism, greater consumption means more satisfied preference, which leads to a higher human well-being. Consumption is regarded not only as an activity of internal satisfaction but also as a means of fierce competition for social status and scarce goods [10,11]. Therefore, the position in the wealth hierarchy is the main influencing factor of personal human well-being [12]. In the theory of eudaimonic well-being, consumption plays a limited role. It is necessary to meet material needs in different fields (such as housing, nutrition and education) but as these needs are satisfiable, consumption beyond the threshold is unnecessary or even counterproductive [13].
In the theory of hedonic well-being, the analysis of preference is often aimed at the current moment while in the theory of eudaimonic well-being, happiness is the ultimate goal that people pursue. In other words, hedonic well-being focuses on the present happiness while eudaimonic well-being pursues a long-term happiness. In hedonic well-being, people pursue the maximization of short-term personal interests, which may infringe on the human well-being of others and lead to the failure of the maximization of the human well-being of the whole society. Conversely, in the theory of eudaimonic well-being, people can sacrifice part of their own human well-being rationally in order to maximize the long-term human well-being of the society.
3.2. Measurement Method of Human Well-Being
There are different methods to measure the level of human well-being, among which the GDP (or GNP) is the simplest one to represent human well-being. However, many studies have revealed that the GDP (or GNP) has certain limitations as a single economic accounting indicator when it is adapted to measure human well-being involving all aspects of residents’ lives [4].
Some scholars hold that the GDP (or GNP) and other economic performance indicators can be supplemented to review the actual level of human development from the perspective of economic human well-being. In view of the defect that the GNP cannot accurately reflect economic welfare, Nordhaus and Tobin came up with the Measure of Economic Welfare (MEW) to modify the calculation content of the GNP in which the cost of some damage to human well-being such as environmental pollution was deducted and the value of beneficial non-market activities such as leisure activities was increased [14]. Based on Nordhaus and Tobin’s method, Samuelson put forward the Net Economic Welfare (NEW) [15]. However, this method, which is on the basis of market utility, has some deviation from the calculation of non-market activities [16].
As single-attribute indicators cannot meet the requirement to comprehensively measure the human well-being level, scholars have begun to select multiple human well-being dimensions to refine a comprehensive index system to reflect human well-being status. In this way, indicators need to be set at appropriate weights. In general, there are three methods to set weights: normative, data-driven and hybrid weights [4].
Based on the perspective of sustainable development, Daly and Cobb developed the Index of Sustainable Economic Welfare (ISEW) to measure the economic human well-being growth of the United States [17]. They integrated several aspects of sustainable human well-being into three components: society, environment and economy. On the basis of neoclassical welfare economics, the ISEW brought non-market goods into an index system to finally produce a macro index in a monetary sense. By calculating the economic human well-being growth of the United States from 1950 to 1986 using the ISEW and the GDP index, Daly and Cobb discovered that although the economy measured by the GDP continued to grow, the per capita economic human well-being growth of the United States calculated by the ISEW remained stable since the 1970s, which revealed that the increase of production did not necessarily lead to an increase of human well-being at this stage [17].
Indices such as the GDP (or GNP), MEW, NEW and ISEW are still limited to measuring human well-being from an economic perspective and it is more appropriate to measure human well-being from a human development perspective. The United Nations Development Programme (1990) proposed the Human Development Index (HDI) to measure human well-being at a national level, shifting the focus from national accounts to people-oriented considerations. The HDI is a statistical comprehensive index that combines life expectancy, education level and per capita income with normative weight. However, the HDI has some limitations in this kind of research. On one hand, the scope of the HDI coverage index is limited, only including health, income and education, which cannot fully reflect the development level of a country. On the other hand, the continuous improvement of the HDI calculation method and the triple change of data source, statistical rules and calculation formula will lead to an inconsistency of the calculation results before and after [18].
All of the above human well-being evaluation index systems are based on the measurement of the state and can carry out macro analysis from top to bottom, which is more suitable for a horizontal comparison of macro economy. In addition, on the basis of human needs, some scholars have also built human well-being evaluation systems from all aspects of human life needs from the “bottom-up”.
Table 1 summarizes the representative human well-being system based on the theory of human demand satisfaction. Maslow first divided human needs into five levels [19]. The demand on the basic level is mainly embodied in material demand including food, water and housing while the demand on the high level is non-material including human emotional needs, social connection and respect. Manfred Max-Neef, an economist in Chile, gave a more complete description of human needs. Similar to Maslow’s theory, in Max-Neef’s theoretical system, with the exception of some material demands, most needs are essentially immaterial and cannot be measured by economic growth or the GDP [20]. Doyal and Gough identified 11 intermediate needs to meet the requirements of physical health and individual autonomy [13]. In addition, they argued that both procedural and material preconditions are needed to satisfy these needs. Similar to Maslow’s and Max-Neef’s needs system, Nussbaum’s Central Human Capabilities also includes multi-dimensional needs of the body, mind and society [21].
Among these basic requirement methods, how to transform different types of requirements into measurable indicators is a difficulty as these demand dimensions usually contain dimensions that cannot be directly quantified such as “play” and “emotion” in Nussbaum’s Central Human Capabilities. However, these abstract aspects can be included in other aspects. Max-Neef put forward nine human needs (subsistence, protection, affection, understanding, participation, leisure, creation, identity and freedom) but expressed them in four different aspects: being (attributes), having (tools, norms), doing (agency) and interacting (social expressions in time and space) [20]. Similarly, by expressing in other ways, we can turn these abstract needs into more concrete daily activities so as to realize the quantification.
In the process of transforming into specific indicators, it is also a difficult problem to define the absolutely necessary and unnecessary needs. There are mainly four methods of demand definition and transformation. (1) In a subjective approach, an individual can choose to identify goods and needs that are essential to him [22]. (2) In a negotiation method, the whole group will participate in the defining process. (3) The definition of basic commodities can also be determined according to various political or administrative principles. Finland, for example, determines the basic components of social assistance in accordance with local policy priorities. (4) The fourth method is the commodity basket method, which is the most common in normative research. It is mainly through a basket of goods list formulated by experts to specify basic needs [23,24]. Represented by Reinert, basic commodities such as commodities and services that meet the objective human needs including nutritional food, clean water, health facilities, health services, education services, housing, electricity and human security services are defined, as shown in Table 2. These basic goods and services are often multi-functional and can play a role in supporting the same human needs. However, Reinert’s list only focuses on some of the most basic goods and services highlighted in the current development policy. It needs to be adjusted according to the situation of countries and regions in the later stage.
In the existing research, there are a series of different measurement methods for human well-being and the research scope of human well-being has gone beyond the monetary quantitative field, covering aspects of economy, society and environment. There is a general consensus that a set of indicators is needed to measure human well-being as one single indicator cannot accurately reflect the individual human well-being level [4]. In order to provide a clear path for the transformation of residents’ green and low carbon lifestyles, the indicators of “bottom-up” basic goods and services based on human needs can connect residents’ lifestyle and carbon emissions, which may be more applicable in this research issue. However, different countries and regions have different objective conditions and different demands. The corresponding list of basic goods and services needs to be adjusted according to the situation of each region.
4. Research on the Relationship between Human Well-Being and Carbon Emissions
Ban Ki-moon described energy as a golden thread connecting economic growth, social equity and environmental sustainability. In this context, energy consumption is also a bridge connecting the relationship between human well-being and carbon emissions. On the one hand, the level of human well-being depends on the satisfaction of their own needs and energy consumption is often the strong support behind it. On the other hand, energy consumption is also the main source of carbon dioxide emissions including carbon emissions generated by the direct energy consumption of residents such as heating, cooling, lighting, cleaning, cooking and indirect energy consumption caused by the consumption of products and services [25,26,27].Therefore, to some extent, the relationship between human well-being and energy consumption reflects the relationship between human well-being and carbon emissions.
Due to the complex sources of energy use, many empirical studies linking energy and human well-being are often conducted on the basis of the overall index of countries or regions. In the early research, Mazur and Rosa explored the correlation between a series of social indices (including health, education and subjective well-being) and per capita energy consumption in 55 countries and pointed out that this was a nonlinear relationship with a sharp decline in yield [28].
This basic functional relationship has been verified in many subsequent studies on the correlation between social well-being indices and per capita energy consumption [29,30,31,32,33], as shown in Table 3. For example, Arto et al. studied the relationship between the HDI and total primary energy demand per capita in 40 developed and developing countries for the period of 1995–2008 and found that there was a strong correlation between energy use and living standards in developing countries while there was a decoupling condition in developed countries [32]. By extrapolating the historical relationship between carbon emission levels and the HDI index on a national scale, Costa et al. estimated corresponding emission requirements when the HDI reached the threshold of 0.8 and pointed out that countries did not need to reduce emissions before reaching this threshold [31].
These macro level “top-down” studies expand the research focus of energy use from economy or technology to society. However, they fail to reveal the detailed connection between specific types of energy use and social progress as well as the specific challenges faced by different regions and point out clear directions for decoupling energy and human well-being [34].
There is a large number of studies from the “bottom-up” perspective, usually using the framework of environmental input-output analysis to transform economic activities into energy demand and then infer emission standards at the household or individual level [35,36,37,38,39,40].
“Bottom-up” studies (Table 4) mainly use the method of the basic goods basket to link human well-being and carbon emission. They interpret decent life as a set of basic goods and services for household consumption and then propose the standard of decent life based on the demand for these basic goods and services and estimate energy consumption and carbon emissions contained in the goods and services bundle, as shown in Table 4. Goldemberg et al. proposed one kilowatt (32 GJ/CAP) as a universal energy distribution to meet the basic needs of human beings but only focused on the needs of family and personal life without considering medical, education and other services [35]. Zhu and Pan used energy life cycle data to make a quantitative estimation of China’s basic demand from the “bottom-up” but this calculation is mainly based on the material demand of European countries, which is different from the actual situation of China [36]. Druckman and Jackson used the minimum income criteria in the Joseph Rowntree Foundation study to estimate greenhouse gases produced in the UK and abroad in the production and distribution of all goods and services purchased by 11 different types of UK households [37]. They also included wine as a product for social participation in the estimation system but only focused on personal needs, not public service needs. Rao and Baer especially considered the energy demand for maintaining public services such as infrastructure construction and proposed the calculation methods of direct and indirect energy demand, respectively, but this research only stayed in the framework development level [38]. Michael et al. calculated the minimum carbon emissions needed to maintain a decent life in Finland and studied the carbon footprint of 18 low income families in Finland, trying to explore the potential of a low carbon lifestyle transformation from housing, diet and other aspects but the research indicators only considered the daily needs of individuals; there was a lack of consideration of public services [39].
The ultimate goal of this basic demand approach is not to impose fixed quota standards on individuals. On the contrary, this approach provides inspiration for solving energy challenges faced by regions and provides a reference for further exploring the transformation of residents’ lifestyle and consumption choices to low carbon. For example, by assessing to which extent Norwegian households can reduce their carbon footprint by implementing a series of lifestyle change behaviors, Bjelle et al. found that households could reduce their carbon footprint by 58% through implementing a full set of change behaviors without increasing spending [40]. However, when a rebound effect was considered, the decrease reduced to 24–35%.
5. Discussion
As the meaning of well-being will influence the value choice behind it, it is necessary to determine the theoretical proposition before choosing the way to promote it [34]. Even though hedonic well-being is popular and predominant in sociology and economics studies, eudaimonic well-being would be more suitable for analyzing the relationship between human well-being and carbon emissions to achieve social sustainable development [4].
There are different methods used to measure the level of human well-being. Utility based measurement implies that any consumption behavior involving personal well-being would be considered legitimate so it cannot really produce an effective improvement on the demand side [14]. In the research of sustainable development, Sen’s index based on the capability method has a wide range of applications but it is more applicable to the macro scale [9]. The results have shown that well-being indicators based on human needs are more suitable for linking residents’ lifestyle and carbon emissions [35,36,37,38,39].
Many studies focus on the methods of linking human well-being and energy use or carbon emissions; most of these are under a macro level and international scope. They use a “top-down” approach to assess the performance of different countries or regions in providing welfare under different degrees of environmental impact or energy use (mainly using the HDI and its components such as income, life expectancy and education level) [28,29,30,31,32,33,41,42,43,44]. Most studies have found that there is a strong correlation between energy or carbon emissions and living standards at low consumption levels (in developing countries) and decoupling at higher levels (in industrialized countries). Other studies use a “bottom-up” approach, starting from a list of human needs and converting it into energy needs for analysis [35,36,37,38,39,40]. By establishing a series of minimum goods and services to meet human needs and estimating the energy consumption and carbon emissions contained in the bundle of goods and services, a roadmap for studying the energy threshold or carbon weight can be found [23]. Compared with “top-down” research, “bottom-up” research can better provide guidance for the green and low carbon transformation of lifestyles.
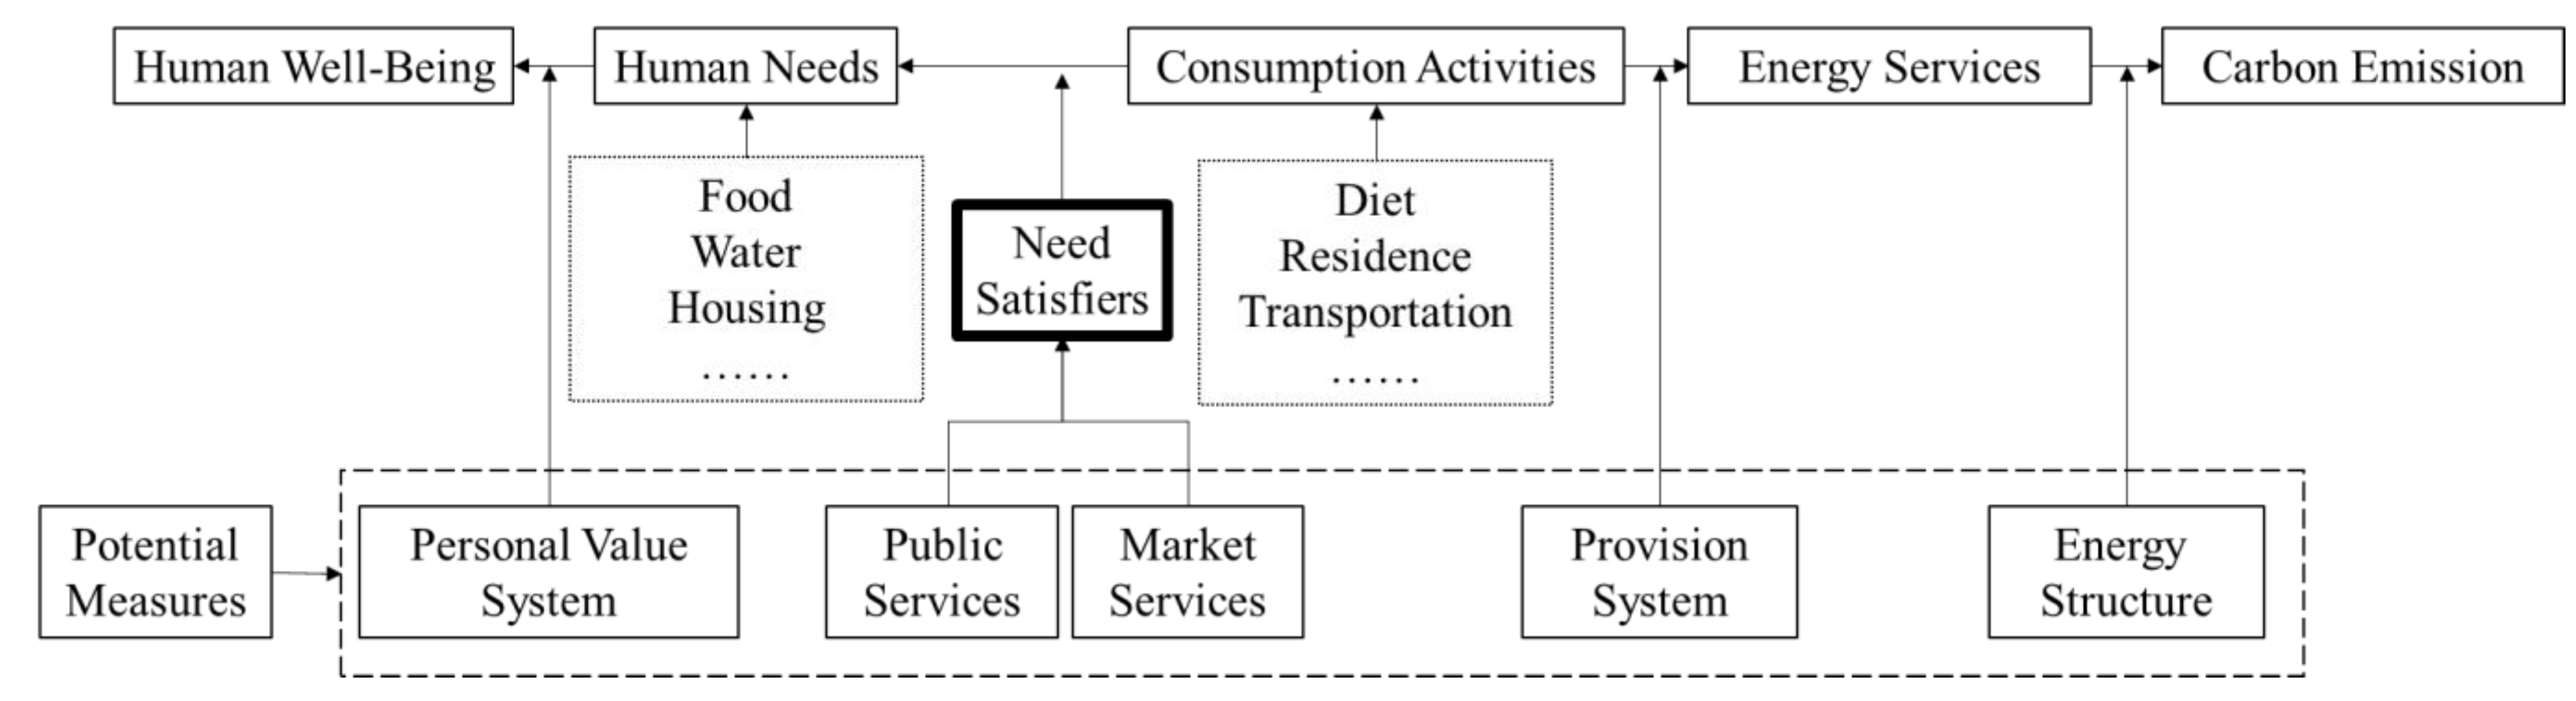
Based on the above discussion and to promote sustainable development, this paper builds a framework to analyze the relationship between human well-being and carbon emissions (as shown in Figure 2). In this framework, human well-being indicators are set on basis of human needs and can be influenced by personal value systems and “need satisfiers” (assisted by public and market services) can serve as an intermediary to link human well-being with energy consumption activities. Referring to the universal characteristics of “need satisfiers” in Doyal and Gough’s 12 intermediate needs, the satisfaction of human needs can be materialized into specific social goods and service supply. According to the national or regional provision system and infrastructure level, it can be transformed into a corresponding energy service level by using environmental input-output analysis. Combined with the regional energy supply structure, the corresponding carbon emissions can be estimated. In addition, this framework also suggests potential pathways for decoupling human well-being and carbon emissions.
6. Conclusions
To address the question of how to reduce carbon emissions while ensuring the improvement of human well-being, this paper has conducted a comparative analysis of the two theories of human well-being, sorted out the existing international human well-being measurement methods from the perspective of “top-down” and “bottom-up” and further explored the relationship between human well-being and energy carbon emissions through a literature review. The main conclusions are as follows:
- Compared with hedonic well-being, which focuses on present happiness, the establishment of a human well-being measurement system based on eudaimonic well-being would be more conducive to the sustainable development of society.
- By using the basic commodity method to convert human needs into a quantitative index, the “bottom-up” human well-being index based on human needs is more suitable for connecting individuals’ lifestyles and carbon emissions.
- While “top-down” research on the relationship between human well-being and carbon emissions is conducive to the layout of macro policies, “bottom-up” research can better help to promote the transformation of society to a low carbon life by estimating the energy consumption and carbon emissions contained in human needs.
Current research discusses human well-being, human needs, energy use and carbon emissions, respectively, but they are not systematically integrated. Furthermore, this paper proposes a framework combining these aspects to analyze the relationship between human well-being and carbon emissions. This analytical framework can not only directly reflect the connection between carbon emissions and the level of human well-being (based on the satisfaction of human needs) but also imply the potential measures to realize a low carbon development system under the specific well-being level, which provides a systematic research basis for finding development strategies compatible with well-being promotion and green low carbon life.
In this framework, “need satisfiers” is an important medium. How to meet human needs is related to the supply of social public and market services. The role of these two aspects in the green and low carbon life transformation is often ignored but they are the channels that can fundamentally affect individuals’ lifestyle. Future studies could start from these two aspects to explore their effects on the transformation of residents’ lifestyles to green and low carbon and the strategies to realize it.
In the discussion of sustainable development and the transformation to a low carbon society, it is also necessary to study the willingness and cost of different emission reduction behaviors of residents so as to provide useful enlightenment for the inhibition of the rebound effect and better promote the transformation of residents’ behavior to a low carbon way.
Author Contributions
Conceptualization, Q.L. and H.C.; methodology, Q.L.; writing—original draft preparation, Q.L.; writing—review and editing, Q.L. and H.C.; supervision, H.C.; project administration, H.C. Both authors have read and agreed to the published version of the manuscript.
Funding
This research received no external funding.
Institutional Review Board Statement
Not applicable.
Informed Consent Statement
Not applicable.
Data Availability Statement
No new data were created or analyzed in this study. Data sharing is not applicable to this article.
Conflicts of Interest
The authors declare no conflict of interest.
References
- Wang, Y.; Zhao, L.; Xia, Y.; Wang, X. Carbon emission change of energy consumption and stress assessment of local climate change in Shanghai. Fudan J. Humanit. Soc. Sci. 2015, 54, 439–448. [Google Scholar]
- Du, T.J. The Fourth Assessment Report of the Intergovernmental Panel on Climate Change (IPCC). Polit. Sci. Polit. 2007, 36, 423–426. [Google Scholar]
- Jackson, T. Live Better by Consuming Less? Is There a “Double Dividend” in Sustainable Consumption? J. Ind. Ecol. 2005, 9, 19–36. [Google Scholar] [CrossRef]
- Chaaban, J.; Irani, A.; Khoury, A. The Composite Global Well-Being Index (CGWBI): A New Multi-Dimensional Measure of Human Development. Soc. Indic. Res. 2016, 129, 465–487. [Google Scholar] [CrossRef]
- Ryan, R.M.; Huta, V.; Deci, E.L. Living well: A self-determination theory perspective on eudaimonia. J. Happiness Stud. 2008, 9, 139–170. [Google Scholar] [CrossRef]
- Thompson, S.; Marks, N. Measuring Well-Being in Policy: Issues and Applications; New Economics Foundation: London, UK, 2008. [Google Scholar]
- Correa, L.I.B.; Steinberger, J.K. A Framework for Decoupling Human Need Satisfaction from Energy Use. Ecol. Econ. 2017, 141, 43–52. [Google Scholar] [CrossRef]
- Huang, Y. Welfare Economics; Northeast University of Finance and Economics Press: Liaoning, China, 2005. [Google Scholar]
- Sen, A. The Concept of Development. In Handbook of Development Economics; Elsevier: Amsterdam, The Netherlands, 1988; Volume 1, pp. 3–50. [Google Scholar]
- Hirsch, F.; Lamberton, D.M. Social Limits to Growth. Econ. Anal. Policy 1977, 7, 61–67. [Google Scholar] [CrossRef]
- Scitovsky, T. The Joyless Economy; Oxford University Press: Oxford, UK, 1992. [Google Scholar]
- Easterlin, R.A. Does Economic Growth Improve the Human Lot? Some Empirical Evidence. In Nations and Households in Economic Growthed; David, P.A., Reder, M.W., Eds.; Academic Press: Cambridge, MA, USA, 1974; pp. 89–125. [Google Scholar]
- Doyal, L.; Gough, I.; Maxneef, M.; Elizalde, A.; Hopenhayn, M. A Theory of Human Need; Macmillan: Basingstoke, UK, 1991. [Google Scholar]
- Nordhaus, W.D.; Tobin, J. Is Growth Obsolete? NBER Chapters 1972, 5, 1–80. [Google Scholar]
- Samuelson, P.A. Economics; McGraw-Hill: New York, NY, USA, 1980; p. 11. [Google Scholar]
- Giannias, D.; Charalambakis, E.; Sfakianaki, E. Net Economic Welfare; Springer: Berlin/Heidelberg, Germany, 2014. [Google Scholar]
- Daly, H.E.; Cobb, C.W. For the Common Good: Redirecting the Economy toward Community, the Environment and a Sustainable Future; Beacon Press: Boston, MA, USA, 2017; Volume 2, pp. 346–347. [Google Scholar]
- Wang, Z.P. “Human development index” (HDI): Meaning, method and improvement. J. Shanghai Adm. Inst. 2007, 3, 47–57. [Google Scholar]
- Maslow, A. Motivation and Personality; HarperCollins: New York, NY, USA, 1954. [Google Scholar]
- Maxneef, M.A. Human Scale Development: Conception, Application and Further Reflections; The Apex Press: New York, NY, USA, 1991. [Google Scholar]
- Nussbaum, M.C. Women and Human Development: The Capabilities Approach; Cambridge University Press: Cambridge, UK, 2000. [Google Scholar]
- Aatola, L.; Viinisalo, M. Reasonable Consumption—Problems of and Opportunities for Definition and Measurement of the Concept; National Consumer Research Centre Publications: Helskinki, Finland, 1995. [Google Scholar]
- Reinert, K.A. No Small Hope: Towards the Universal Provision of Basic Goods; Oxford University Press: Oxford, UK, 2018. [Google Scholar]
- Bradshaw, J.; Middleton, S.; Davis, A.; Oldfield, N.; Williams, J. A minimum Income Standard for Britain: What People Think; Joseph Rowntree Foundation: York, UK, 2008. [Google Scholar]
- Pachauri, S.; Spreng, D. Energy use and energy access in relation to poverty. Econ. Politics Wkly. 2004, 39, 271–278. [Google Scholar]
- Karekezi, S.; McDade, S.; Boardman, B.; Kimani, J. Global Energy Assessment—Toward a Sustainable Future; Cambridge University Press: Cambridge, UK, 2012; pp. 151–190. [Google Scholar]
- Lamb, W.F.; Steinberger, J.K. Human Well-Being and Climate Change Mitigation. Wiley Interdiscip. Rev. Clim. Chang. 2017, 8, e485. [Google Scholar] [CrossRef] [Green Version]
- Mazur, A.; Rosa, E.A. Energy and Life-Style. Science 1974, 186, 607–610. [Google Scholar] [CrossRef] [PubMed]
- Pasternak, A.D. Global Energy Futures and Human Development: A Framework for Analysis; US Department of Energy: Oak Ridge, TN, USA, 2000. [Google Scholar]
- Steinberger, J.K.; Roberts, J.T. From constraint to sufficiency: The decoupling of energy and carbon from human needs, 1975–2005. Ecol. Econ. 2011, 70, 425–433. [Google Scholar] [CrossRef]
- Luís, C.; Diego, R.; Jürgen, P.K. Human Development Framework for CO2 Reductions. PLoS ONE 2011, 6, e29262. [Google Scholar]
- Arto, I.; Capellán-Pérez, I.; Lago, R.; Bueno, G.; Bermejo, R. The energy requirements of a developed world. Energ. Sustain. Dev. 2016, 33, 1–13. [Google Scholar] [CrossRef] [Green Version]
- Wang, X.; Shao, Q.; Nathwani, J.; Zhou, Q. Measuring wellbeing performance of carbon emissions using hybrid measure and meta-frontier techniques: Empirical tests for G20 countries and implications for China. J. Clean. Prod. 2019, 237, 117758. [Google Scholar] [CrossRef]
- Brand-Correa, L.I.; Martin-Ortega, J.; Steinberger, J.K. Human Scale Energy Services: Untangling a “golden thread”. Energy Res. Soc. Sci 2018, 38, 178–187. [Google Scholar] [CrossRef]
- Goldemberg, J.; Johansson, T.B.; Williams, R.R.H. Basic Needs and Much More with One Kilowatt Per Capita. Ambio 1985, 14, 190–200. [Google Scholar]
- Zhu, X.; Pan, J. Energy Requirements for Satisfying Basic Needs: China as a Case for Illustration; Chinese Academy of Social Sciences: Beijing, China, 2007. [Google Scholar]
- Druckman, A.; Jackson, T. The bare necessities: How much household carbon do we really need? Ecol Econ. 2010, 69, 1794–1804. [Google Scholar] [CrossRef] [Green Version]
- Rao, N.D.; Baer, P. “Decent Living” Emissions: A Conceptual Framework. Sustainability 2012, 4, 656–681. [Google Scholar] [CrossRef] [Green Version]
- Lettenmeier, M.; Lähteenoja, S.; Hirvilammi, T.; Laakso, S. Resource use of low-income households—Approach for defining a decent lifestyle? Sci. Total Environ. 2014, 481, 681–684. [Google Scholar] [CrossRef] [PubMed]
- Bjelle, E.L.; Steen-Olsen, K.; Wood, R. Climate change mitigation potential of Norwegian households and the rebound effect. J. Clean. Prod. 2018, 172, 208–217. [Google Scholar] [CrossRef]
- Alam, M.S.; Bala, B.K.; Huq, A.M.Z.; Matin, M.A. A model for the quality of life as a function of electrical energy consumption. Energy 1991, 16, 739–745. [Google Scholar] [CrossRef]
- Dias, R.A.; Mattos, C.R.; Balestieri, J.A.P. The limits of human development and the use of energy and natural resources. Energy Policy 2006, 34, 1026–1031. [Google Scholar] [CrossRef]
- Dietz, T.; Rosa, E.A.; York, R. Environmentally efficient well-being: Is there a Kuznets curve? Appl. Geogr. 2011, 32, 21–28. [Google Scholar] [CrossRef]
- Lamb, W.F.; Rao, N.D. Human development in a climate-constrained world: What the past says about the future. Glob. Environ. Chang. 2015, 33, 14–22. [Google Scholar] [CrossRef]
Figure 1.
Review methodology.

Figure 2.
Analytical framework to study the relationship between human well-being and carbon emissions.
Figure 2.
Analytical framework to study the relationship between human well-being and carbon emissions.


Table 1.
Different human well-being dimensions based on theories of human needs and satisfaction 1.
| Maslow | Max-Neef | Doyal and Gough | Nussbaum |
|---|---|---|---|
| Hierarchy of Needs (1954) | Axiological Categories of Human Need (1991) | Theory of Human Need (1991) | Central Human Capabilities (1999) |
| Physiological needs | Subsistence | Adequate nutritional food and water | Life |
| Appropriate health care | Bodily health | ||
| Safe birth control and childbearing | |||
| Safety needs | Protection | Adequate protective housing | Bodily integrity |
| Adequate protection | Control over one’s environment | ||
| Non-hazardous physical environment | |||
| Non-hazardous work environment | |||
| Physical security | |||
| Security in childhood | |||
| Economic security | |||
| Social needs | Participation | Significant primary relationships | Affiliation |
| Affection | Emotions | ||
| Creation | Senses, imagination, thought | ||
| Esteem needs | Identity | ||
| Understanding | Practical reason | ||
| Self-actualization needs | Appropriate basic and cross-cultural education | ||
| Leisure | Play | ||
| Freedom | |||
| Satisfiers | (Preconditions for need satisfaction) | Other species |
1 Dimensions displayed in the table are organized by common themes but they are not exactly equivalent.
Table 2.
Reinert’s list of basic goods and services and the human needs they meet.
| Basic Goods and Services | Human Needs Included |
|---|---|
| Nutritious food | Food is needed to meet minimum calorie requirements. In addition, key vitamins and minerals are also important for minimal health. Additional micronutrients can support health and prevent potential infections. |
| Clean water | Water is essential for basic health and survival. This includes drinking water, sanitation, food production and cooking. |
| Hygiene | Health is essential for the prevention of many diseases and is seen as an intrinsic factor in human dignity. |
| Health services | Basic health services (primary health care) and related products are necessary for survival and basic health. |
| Education services | Basic education services (primary and secondary) are a prerequisite for participation in modern human life and for maintaining health. Well educated parents, especially mothers, are more likely to make children live and healthy. |
| Housing | The minimum level of housing quality is important to protect individuals from these factors and to provide space for food preparation and hygiene. In addition, it is often essential for effective participation in human life. |
| Power | Electricity helps with cooling (which improves food storage and medicine preservation), radio and television (which may provide critical information) and air conditioning (which shows improved health in very hot environments). |
| Human security services | Basic safety services are essential for maintaining physical integrity and preventing injuries. They are also essential to a well-functioning society (based on a minimum of trust), to the functioning of markets and to the provision of all other basic goods and services. |
Table 3.
“Top-down” studies on the relationship between human well-being and carbon emissions.
| Mazur and Rosa (1974) | Pasternak (2000) | Steinberger et al. (2010) | Lambert et al. (2014) | Arto et al. (2016) | |
|---|---|---|---|---|---|
| Regional scale | 55 countries (mainly members of the United Nations with a population of more than seven million) | 60 countries (90% of the world’s population) | 93–156 countries (81–90% of the world’s population) | 12 developing countries | 40 developed and developing countries |
| Data time | 1971 | 1997 | 1975–2005 (5-year interval) | 2012 | 1995–2008 |
| Research method | Correlation analysis | Correlation analysis | Regression analysis of time series | Multiple regression analysis | Multi-regional input-output analysis |
| Human well-being index | Health | HDI | HDI | HDI | HDI |
| Underweight children (%) | |||||
| Education | Life expectancy | Per capita health expenditure (%) | |||
| Subjective well-being | Literacy rate | Female literacy (%) | |||
| Gender inequality index (GII) | |||||
| Rural population getting water (%) | |||||
| Economic indicators | Income (GDP per capita) | GDP per capita | |||
| Energy index | Energy consumption per capita | Annual power consumption per capita Annual energy consumption per capita | Primary energy consumption per capita | Energy return on investment (EROI) | Primary energy demand |
| Energy consumption per capita | |||||
| Industrial power consumption per capita | Energy consumption per capita | Primary energy footprint | |||
| Per capita electricity consumption for household and trade | |||||
| Carbon emission index | - | - | Total carbon emissions per capita (from fossil energy, gas combustion and cement manufacturing) | - | - |
| Conclusions | At the low level of development, energy consumption is highly correlated with a good lifestyle but at the high level of development, there is no significant correlation between the two | When the annual power consumption per capita reaches 4000 kwh, the HDI reaches the maximum | A high level of human development can be achieved at a medium level of energy and carbon; an increase in energy and carbon beyond this level does not necessarily contribute to a higher standard of living | The energy index is highly correlated with higher living standards. The threshold of per capita energy supply (more than 150 GJ) or EROI (more than 20:1) is not related to further social improvement | There is a strong correlation between energy use and living standards in middle and low developing countries while in highly developed countries there is decoupling |
Table 4.
Indicators applied in “bottom-up” studies 2.
| Goldemberg et al. (1985) | Zhu and Pan (2007) | Druckman and Jackson (2010) | Rao and Baer (2012) | Michael et al. (2014) | |
|---|---|---|---|---|---|
| Geographical scale | Universal | China | UK | Country-specific | Finland |
| Annual primary demand per capita | 32GJ energy | 77GJ energy | 17t carbon emissions | - | 20t carbon emissions |
| Direct energy demand | |||||
| Cooking | √ | √ | √ | √ | √ |
| Lighting | √ | √ | √ | ||
| Cooling | √ | √ | |||
| Television | √ | √ | √ | ||
| Mobile phone | √ | ||||
| Refrigeration | √ | √ | |||
| Heating | √ | √ | √ | ||
| Laundry | √ | ||||
| Transportation | √ | √ | √ | √ | |
| Indirect energy demand | |||||
| Personal needs | |||||
| Food | √ | √ | √ | √ | √ |
| Water | √ | √ | √ | ||
| Alcohol, tobacco, narcotics | √ | ||||
| Housing equipment | √ | √ | √ | √ | √ |
| Medical care | √ | √ | √ | √ | |
| Education | √ | √ | √ | ||
| Clothing | √ | √ | √ | ||
| Entertainment services | √ | √ | |||
| Infrastructure energy demand | |||||
| Power facilities | √ | √ | |||
| Communication facilities | √ | √ | |||
| Water supply/drainage facilities | √ | √ | |||
| Highway | √ | √ | |||
| Railway | √ | √ | |||
| Hospital | √ | √ | |||
| School | √ | √ | |||
| Residence | √ | √ | |||
2 Categories marked √ are included in the study. When spanning multiple cells, the relevant categories are included in aggregate form but not broken down numerically.
Publisher’s Note: MDPI stays neutral with regard to jurisdictional claims in published maps and institutional affiliations. |
© 2021 by the authors. Licensee MDPI, Basel, Switzerland. This article is an open access article distributed under the terms and conditions of the Creative Commons Attribution (CC BY) license (http://creativecommons.org/licenses/by/4.0/).
Share and Cite
MDPI and ACS Style
Li, Q.; Chen, H. The Relationship between Human Well-Being and Carbon Emissions. Sustainability 2021, 13, 547. https://doi.org/10.3390/su13020547
AMA Style
Li Q, Chen H. The Relationship between Human Well-Being and Carbon Emissions. Sustainability. 2021; 13(2):547. https://doi.org/10.3390/su13020547
Chicago/Turabian StyleLi, Qin, and Hongmin Chen. 2021. "The Relationship between Human Well-Being and Carbon Emissions" Sustainability 13, no. 2: 547. https://doi.org/10.3390/su13020547
Note that from the first issue of 2016, this journal uses article numbers instead of page numbers. See further details here.